The Lon protease temporally restricts polar cell differentiation events during the Caulobacter cell cycle
- Science for Life Laboratory and Department of Molecular Biosciences, The Wenner-Gren Institute, Stockholm University, Sweden
Figures
Figure 1
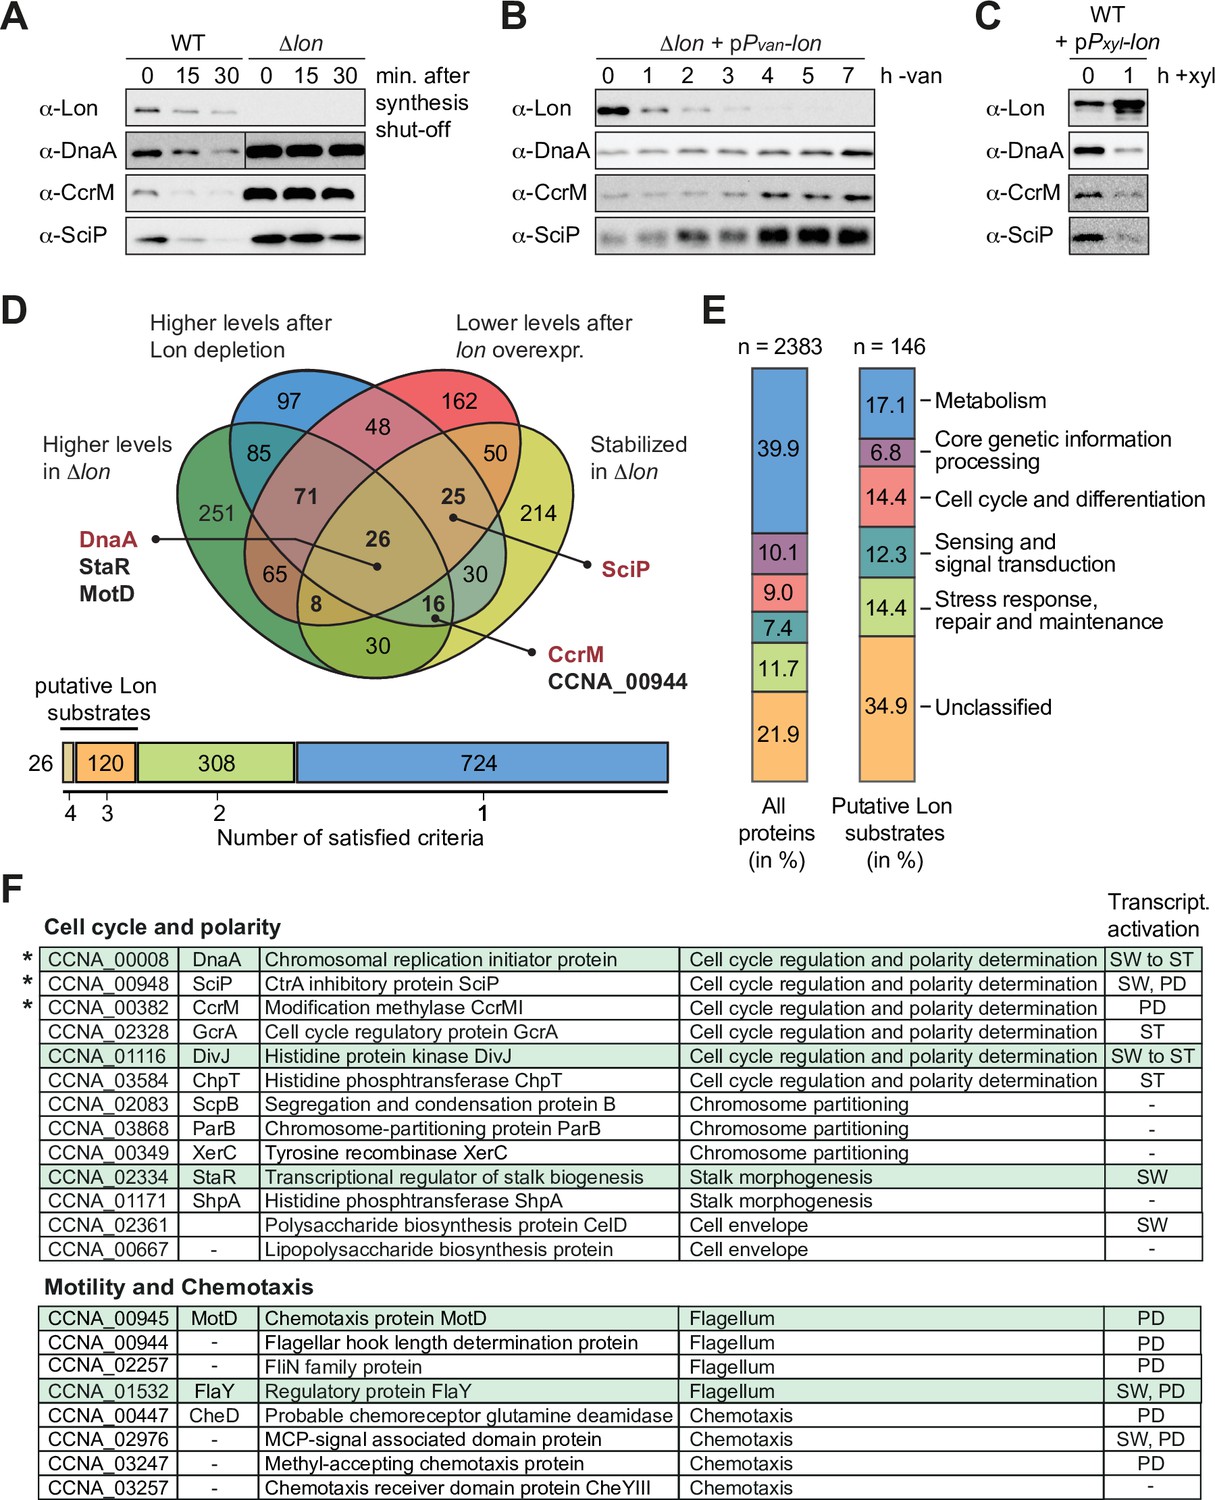
A quantitative proteomics approach identifies putative Lon substrates in Caulobacter crescentus.
(A) In vivo stability assays of Lon, DnaA, CcrM, and SciP in the wild-type (WT) and the ∆lon strain (LS2382). Protein synthesis was shut down by addition of chloramphenicol at t=0 and remaining protein levels were measured after 15 and 30 min. The protein levels at t=0 correspond to the steady-state levels of these proteins in the WT and the ∆lon (LS2382) mutant. (B) Protein levels of Lon, DnaA, CcrM, and SciP over 7 hr of Lon depletion. The expression of lon was shut off by transferring the Pvan-dependent Lon depletion strain (ML2022) from PYE supplemented with vanillate (van) to PYE lacking vanillate (−van). (C) Protein levels of Lon, DnaA, CcrM, and SciP in a Pxyl-dependent lon overexpression strain (ML2010) before (0) and 1 hr after induction with xylose (1 hr+xyl). (D) Venn chart showing groups of proteins that meet the following criteria and how they overlap: (1) to be present in higher abundance at steady state in Δlon cells compared to the WT (green circle), (2) to be upregulated after 4.5 hr of Lon depletion compared to non-depleting conditions (blue circle), (3) to be downregulated after 1 hr of induced lon overexpression compared to non-inducing conditions (red circle), and (4) to be stabilized in Δlon cells compared to the WT 30 min after translation shut off (yellow circle). Previously confirmed Lon substrates (shown in red) and the proteins investigated in this study (shown in black) are highlighted. The bar graph below the Venn chart indicates the number of proteins satisfying four, three, two, or one criteria. Proteins satisfying either three or four criteria were considered as putative Lon substrates. (E) Putative Lon substrates identified in (D) sorted by functional category (right bar graph). For comparison, the sorting of all detected proteins into functional categories is shown (left bar graph). (F) Tables listing the putative Lon substrates with functions in cell cycle and polarity as well as motility and chemotaxis. Previously known Lon substrates are marked with an asterisk. Proteins satisfying four criteria are highlighted in green. The cell cycle phase in which the expression of the listed proteins is transcriptionally induced is indicated (SW: swarmer cell, ST: stalked cell, PD: predivisional cell, SW to ST: swarmer to stalked cell transition).
-
Figure 1—source data 1
Proteomics data.
- https://cdn.elifesciences.org/articles/73875/elife-73875-fig1-data1-v1.xlsx
-
Figure 1—source data 2
Unprocessed Western blot images.
- https://cdn.elifesciences.org/articles/73875/elife-73875-fig1-data2-v1.zip
Figure 2
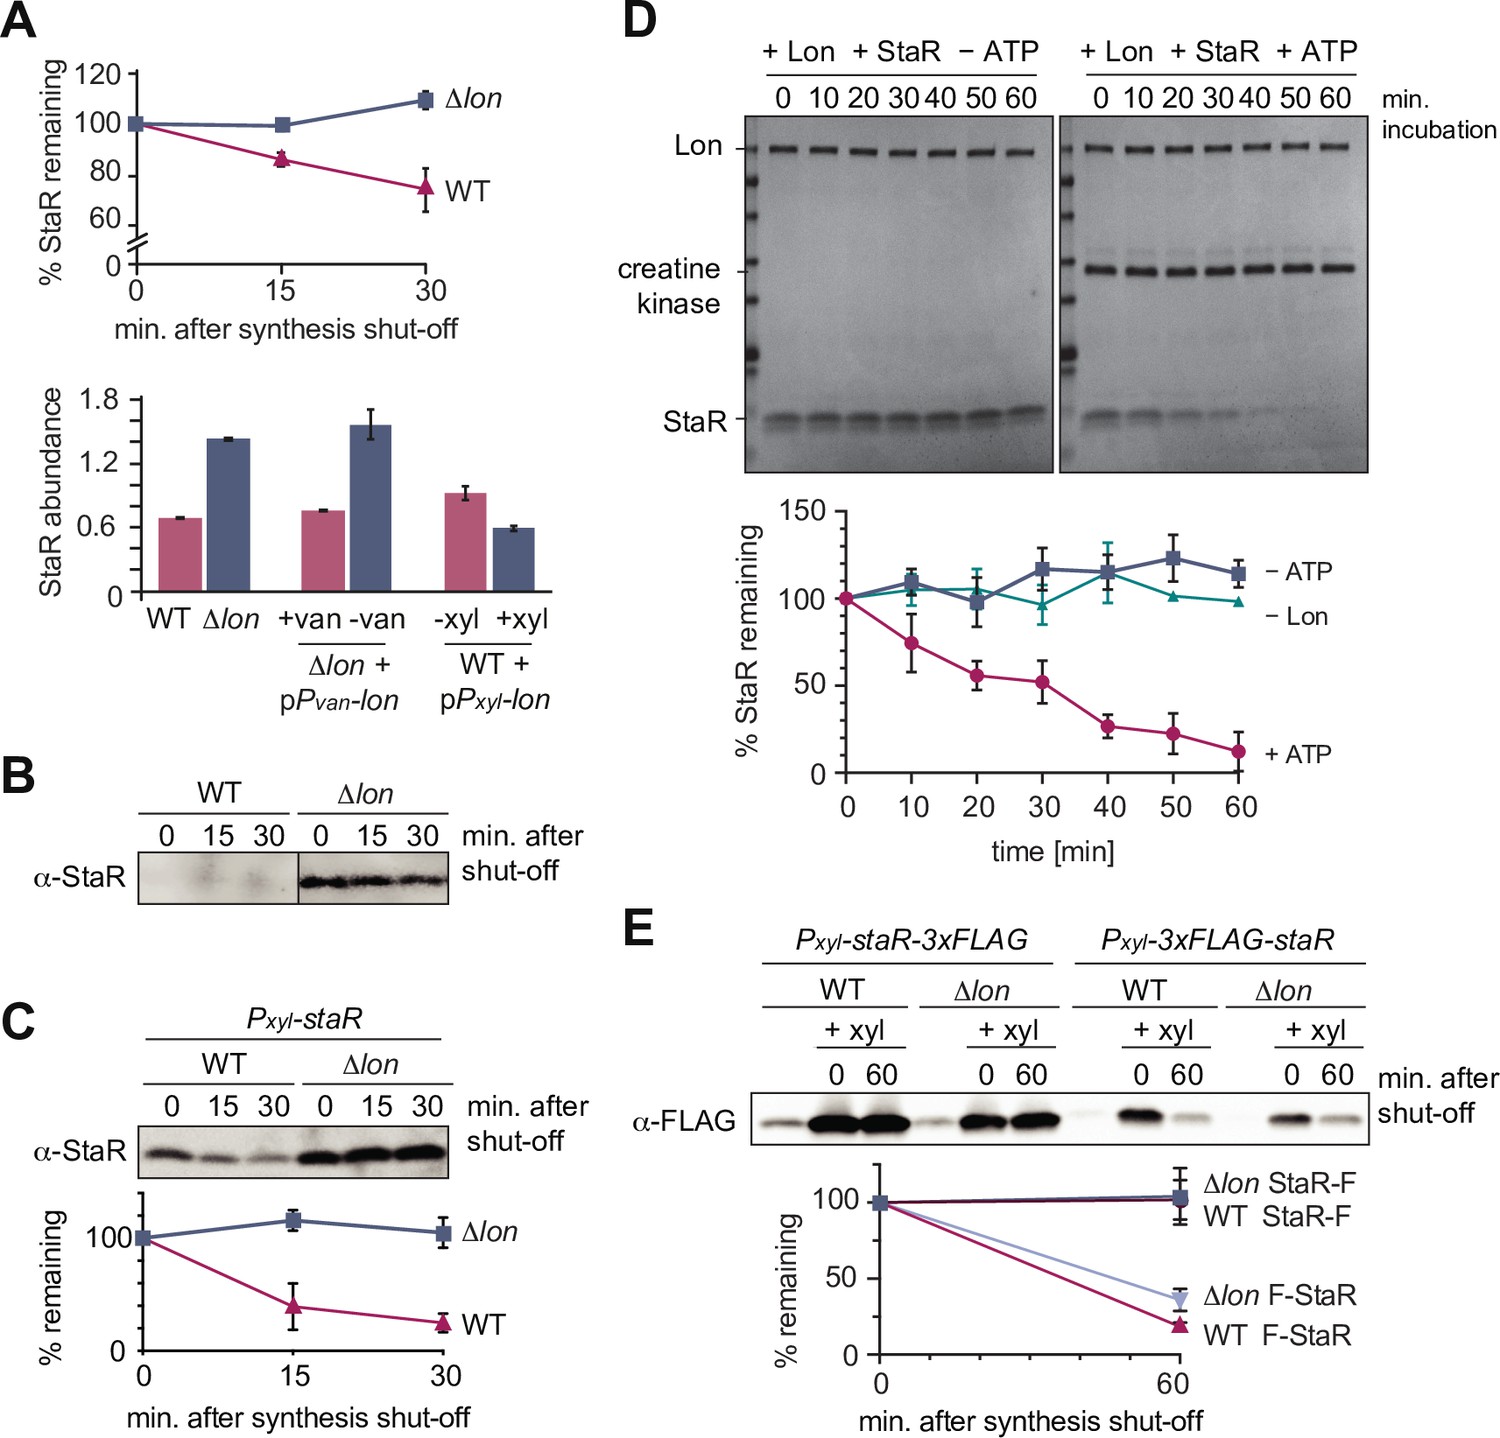
The developmental regulator StaR is a Lon substrate.
(A) Proteomics data obtained for StaR. The upper graph shows StaR stability in wild-type (WT) and Δlon (LS2382) cells and the lower graph StaR abundance in the different strain backgrounds and conditions as determined by mass spectrometry. Each data point represents the mean protein abundance of the two experimental replicates, error bars show standard deviations. (B) In vivo degradation assay of StaR at native expression levels in WT and Δlon (KJ546) cells. (C) In vivo degradation assay of StaR after xylose-induced staR overexpression in WT and Δlon (KJ546) backgrounds. The graph shows mean values and standard deviations of relative protein levels after protein synthesis shut off determined from three independent experiments. (D) In vitro assay showing degradation of StaR by Lon. 4 µM StaR and 0.125 µM Lon hexamer was incubated in the presence (+ATP) or absence (−ATP, control) of an ATP regeneration system. The graph shows the relative StaR levels normalized to Lon or CK (in case of the −Lon sample) levels of three independent experiments and are represented as means with standard deviations. (E) N-terminally and C-terminally tagged StaR (3xFLAG-StaR and StaR-3xFLAG, respectively) were expressed ectopically by xylose induction and their protein levels were assessed in WT and ∆lon (KJ546) cells prior to induction (first lanes of each set of three) and after induction either before (t=0 min) or after shutting off protein synthesis (t=60 min). The graph shows the mean values of relative protein levels and standard deviations of three independent experiments.
-
Figure 2—source data 1
Unprocessed Western blot and protein gel images.
- https://cdn.elifesciences.org/articles/73875/elife-73875-fig2-data1-v1.zip
Figure 3 with 1 supplement
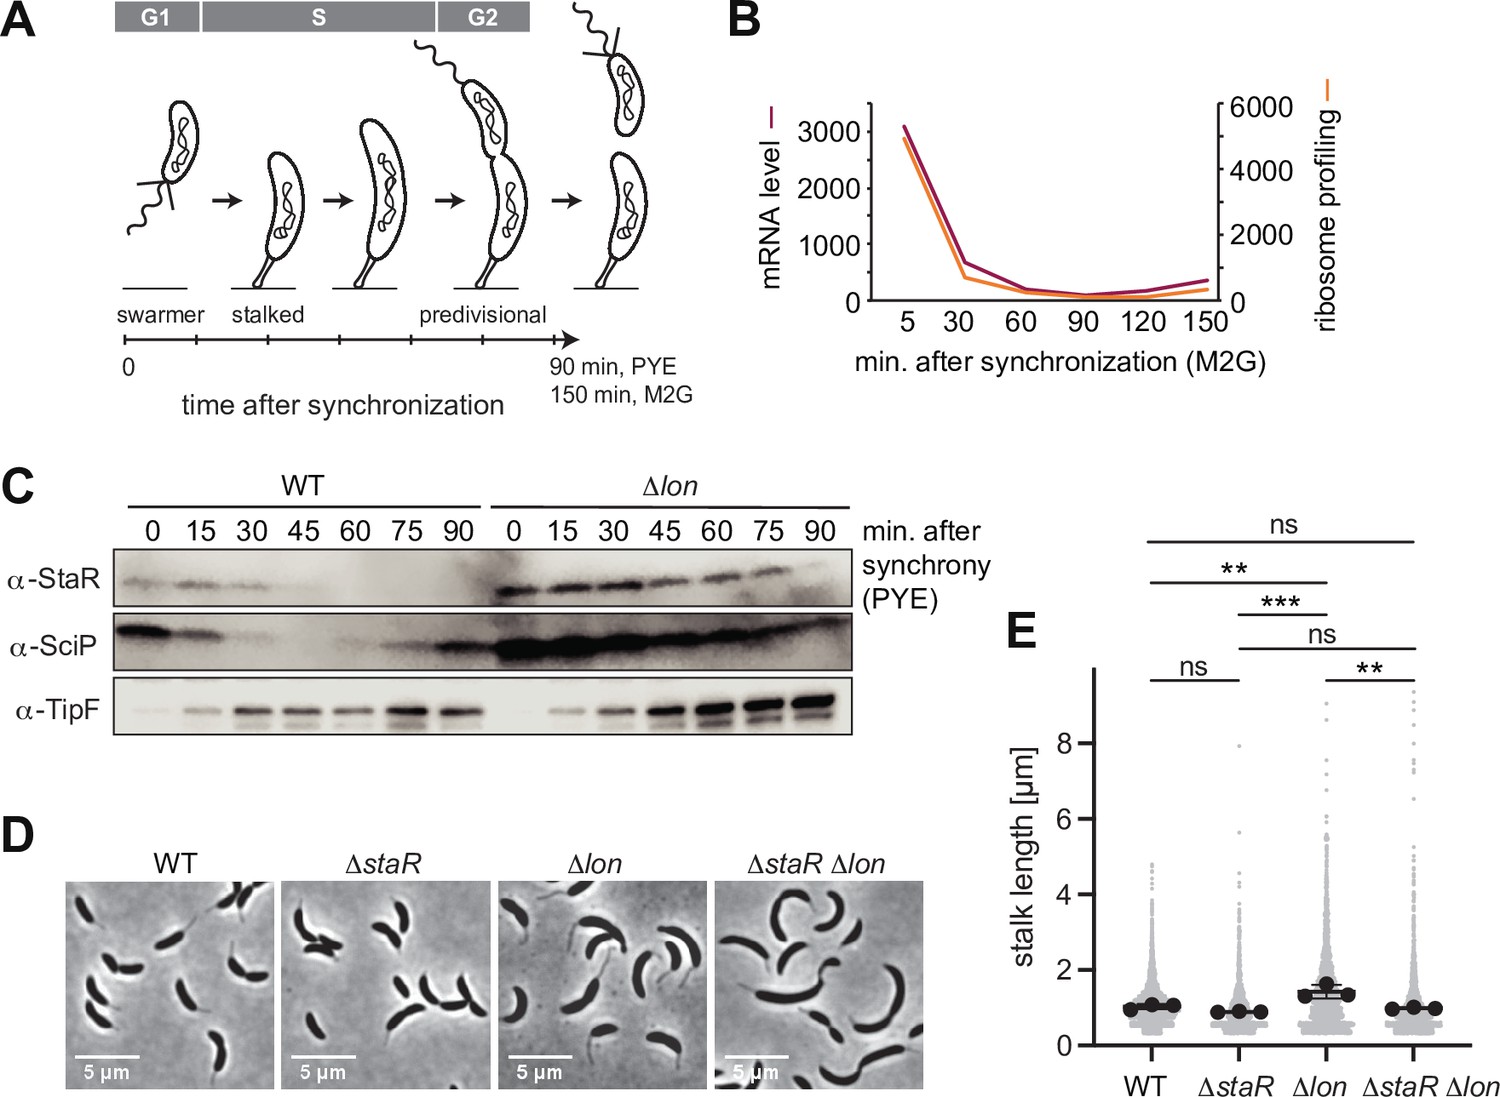
Lon ensures cell cycle-dependent accumulation of StaR and proper stalk length regulation.
(A) Schematic illustration of the Caulobacter crescentus cell cycle and how the different cell cycle phases are associated with distinct morphological states. The time line indicates how the cell cycle progresses over time. (B) RNA-sequencing and ribosome profiling data for staR, as published previously (Lasker et al., 2016; Schrader et al., 2016). (C) Protein levels of StaR, SciP, and TipF in synchronized wild-type (WT) and ∆lon (KJ546) culture over 90 min following release of swarmer cells into PYE medium. Western blots for SciP and TipF were included as controls for proteins with well-characterized cell cycle patterns (Davis et al., 2013; Gora et al., 2010). (D) Phase contrast microscopy images depicting morphological differences between C. crescentus WT the single mutants ∆staR and ∆lon (KJ546) and the double mutant ∆staR∆lon when grown in PYE at 30°C. (E) Quantifications of stalk length under optimal conditions (PYE, 30°C) of the strains shown in (D). N was at least 1800 total for each strain obtained from three biological replicates. Statistical significance was determined by ordinary one-way ANOVA (Tukey’s multiple comparisons test: WT vs. ∆lon p=0.0047, **; ∆staR vs. ∆lon p=0.0007, ***; ∆lon vs. ∆staR∆lon p=0.0025, **; WT vs. ∆staR p=0.3591, not significant; ∆staR vs. ∆staR∆lon p=0.6398, not significant; WT vs. ∆staR∆lon p=0.9447, not significant).
-
Figure 3—source data 1
Unprocessed Western blot images.
- https://cdn.elifesciences.org/articles/73875/elife-73875-fig3-data1-v1.zip
Figure 3—figure supplement 1
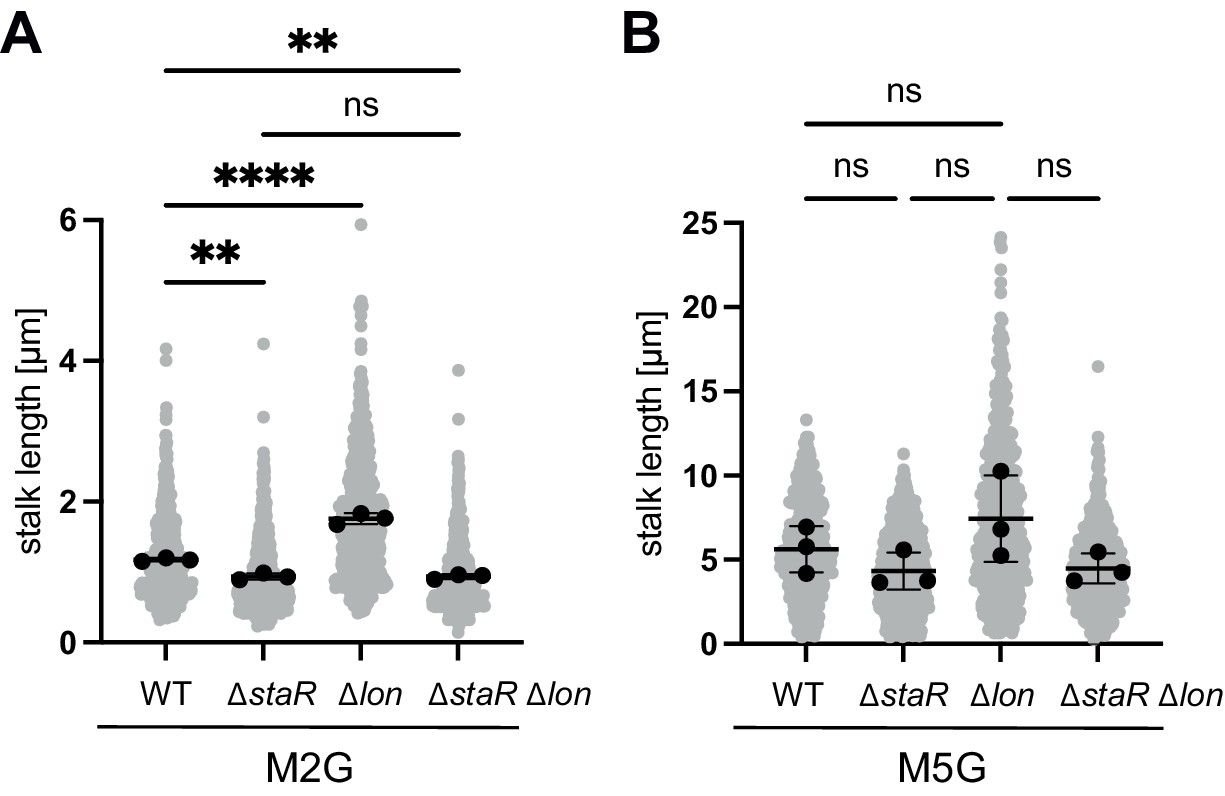
Quantification of stalk length under standard (M2G) and phosphate-limiting conditions (M5G).
(A) Quantification of stalk length of the indicated strains grown in M2G medium. N was at least 400 total for each strain and obtained from three biological replicates. Statistical significance was determined by ordinary one-way ANOVA (Tukey’s multiple comparisons test): WT vs. ∆staR p=0.0018, **; WT vs. ∆lon (KJ546) p<0.0001, ****; WT vs. ∆staR ∆lon p=0.0018, **; ∆staR vs. ∆staR ∆lon, ns (not significant). (B) Cells of the indicated strain backgrounds were pre-grown in M2G medium, washed, and subsequently grown for 24 hr in the phosphate-limiting medium M5G. N was at least 400 total for each strain and obtained from three biological replicates. The differences between the strains were statistically not significant as determined by ordinary one-way ANOVA (Tukey’s multiple comparisons test).
Figure 4 with 2 supplements
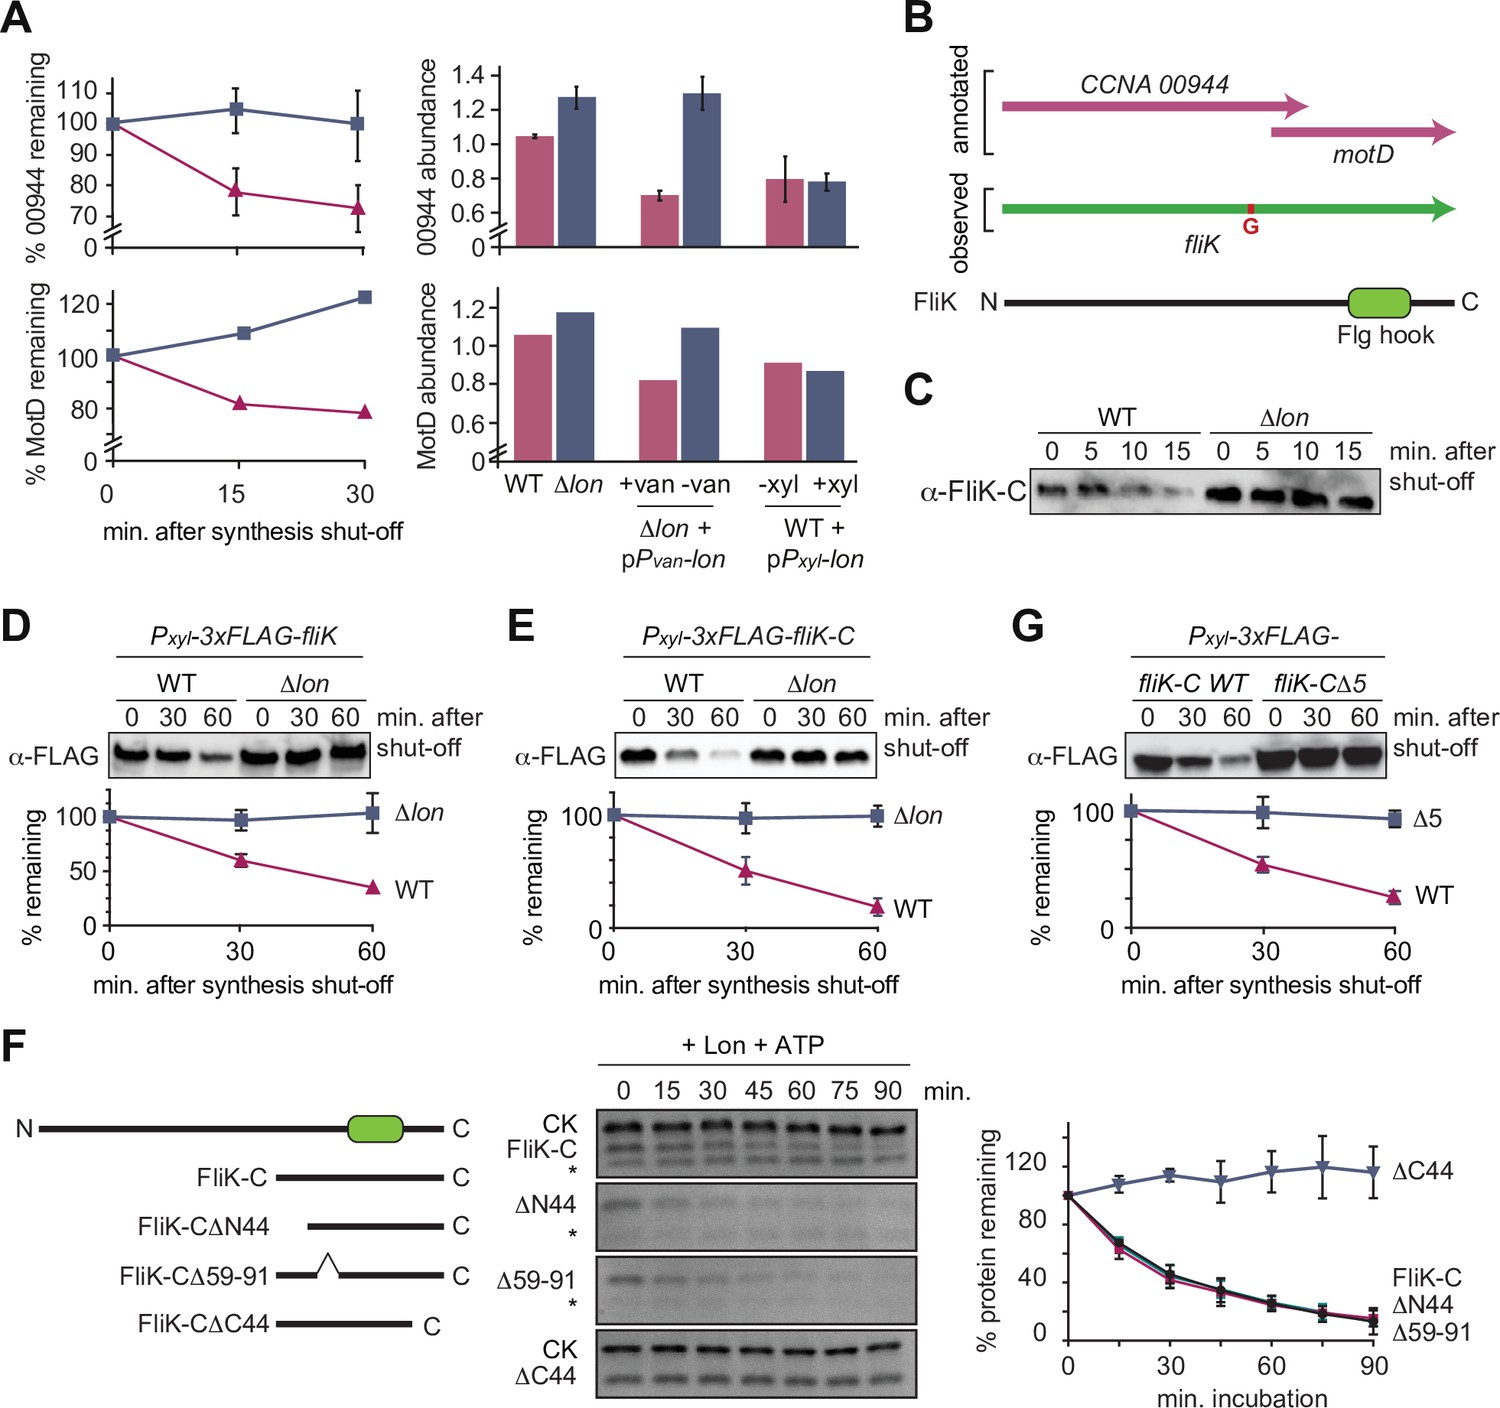
The flagella hook length regulator FliK is a Lon substrate with a C-terminal degradation tag.
(A) Proteomics data obtained for CCNA_00944 and CCNA_00945 (MotD). The graphs on the left show CCNA_00944 and MotD stability in wild-type (WT) and Δlon (LS2382) cells, and graphs on the right show CCNA_00944 and MotD abundance in the different strain backgrounds and conditions as determined by mass spectrometry. Each data point for CCNA_00944 represents the mean protein abundance of the two experimental replicates, error bars show standard deviations. MotD was only detected in one of the replicates. (B) Schematic representation of the CCNA_00944 and motD (CCNA_00945) genes as annotated in the Caulobacter crescentus NA1000 genome, and how the presence of an additional guanosine (highlighted in red) merges the two genes to form one continuous gene that was named fliK. The corresponding FliK protein contains a Flg hook domain. (C) In vivo degradation assay of full-length FliK in WT and ∆lon (KJ546) cells. Samples were taken 0, 5, 10, and 15 min after shutting off protein synthesis. (D) In vivo degradation assay of ectopically expressed N-terminally 3xFLAG-tagged full-length FliK in WT and ∆lon (KJ546) cells. The graph shows mean values and standard deviation of relative protein levels 0, 30, and 60 min after protein synthesis shut off determined from three independent experiments. (E) In vivo degradation assay of the C-terminal part of FliK (FliK-C) in WT and ∆lon (KJ546) cells. N-terminally 3xFLAG tagged FliK-C was ectopically expressed and samples were taken at indicated time points after shut off of protein synthesis. Quantifications show mean values obtained from three independent biological replicates and error bars represent standard deviation. (F) In vitro degradation assays showing Lon-dependent degradation of FliK-C and truncated FliK-C proteins lacking N-terminal, internal, or C-terminal regions, graphically illustrated on the left side of the panel. Degradation assays were carried out in Lon reaction buffer with 4 µM of one of the FliK-C variants, 0.125 µM of Lon hexamer in the presence of the ATP regeneration system (ATP, creatine phosphate, and creatine kinase [CK]). Asterisks (*) mark a low molecular weight protein, that co-purifies with FliK-C (and some variants) but is unaffected by Lon. The band intensities of the FliK-C variants from three independent experiments are represented as means with standard deviations on the right side of the panel. (G) In vivo degradation assay of N-terminally 3xFLAG tagged FliK-C (WT) and a variant lacking the C-terminal five amino acids (FliK-C∆5) after xylose induction in WT cells. Samples were taken at indicated time points after shut off of protein synthesis. Quantifications show mean values of relative protein levels obtained from three biological replicates and error bars represent standard deviation.
-
Figure 4—source data 1
Unprocessed Western blot and protein gel images.
- https://cdn.elifesciences.org/articles/73875/elife-73875-fig4-data1-v1.zip
Figure 4—figure supplement 1
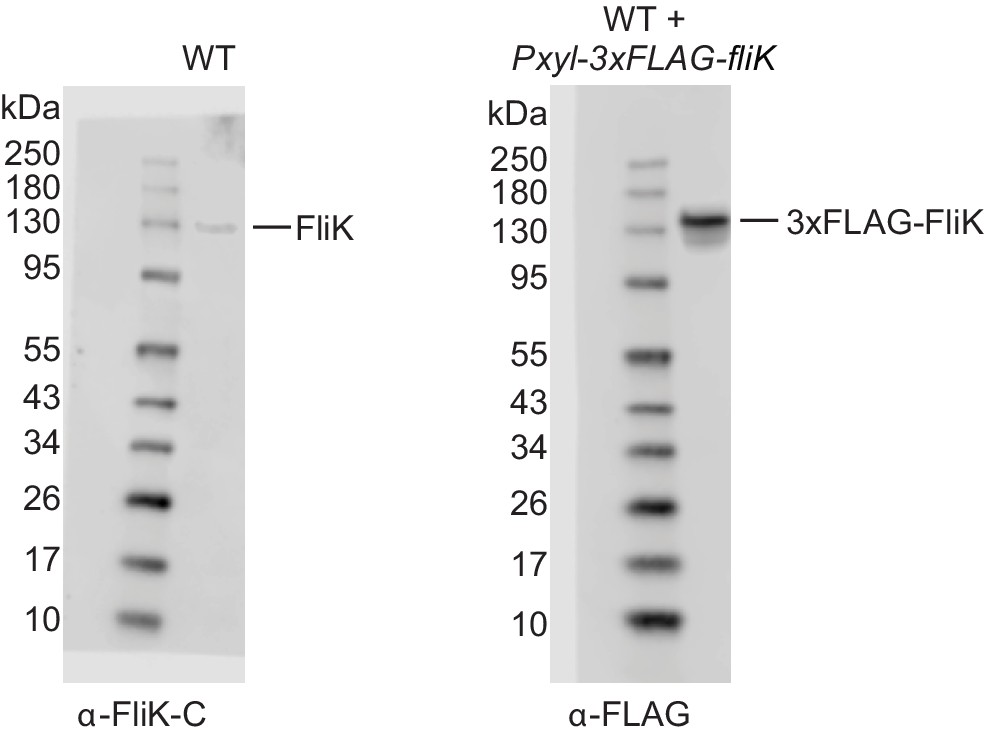
Western blots of native FliK and 3xFLAG tagged FliK.
Left panel: native FliK was detected using anti-FliK-C antibodies in wild-type (WT) cell extracts. The overlay of the blot with the picture of the prestained protein standard is shown, indicating that native FliK migrates with the 130 kDa standard band. Right panel: 3xFLAG tagged FliK was induced by xylose addition in WT cells and detected using anti-FLAG antibodies in extracts as indicated. The overlay of the blot with the picture of the prestained protein standard is shown, indicating that 3xFLAG tagged FliK migrates slightly above the 130 kDa standard band.
-
Figure 4—figure supplement 1—source data 1
Unprocessed Western blot images.
- https://cdn.elifesciences.org/articles/73875/elife-73875-fig4-figsupp1-data1-v1.zip
Figure 4—figure supplement 2
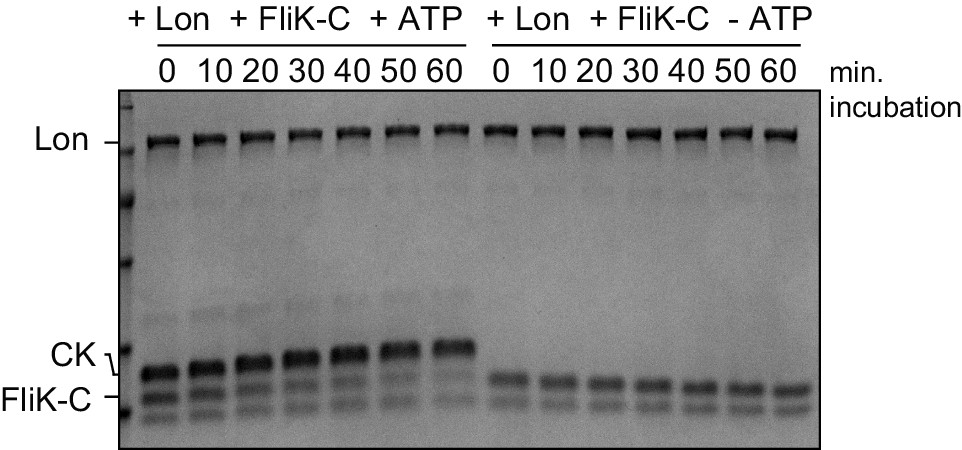
In vitro FliK-C degradation by Lon is ATP-dependent.
The in vitro degradation assay was carried out containing 4 µM FliK-C and 0.125 µm Lon hexamer in the presence (+ATP) or absence (-ATP) of the ATP regeneration system (ATP, creatine phosphate, and creatine kinase [CK]). A representative gel of two independent replicates is shown.
-
Figure 4—figure supplement 2—source data 1
Unprocessed protein gel image.
- https://cdn.elifesciences.org/articles/73875/elife-73875-fig4-figsupp2-data1-v1.zip
Figure 5
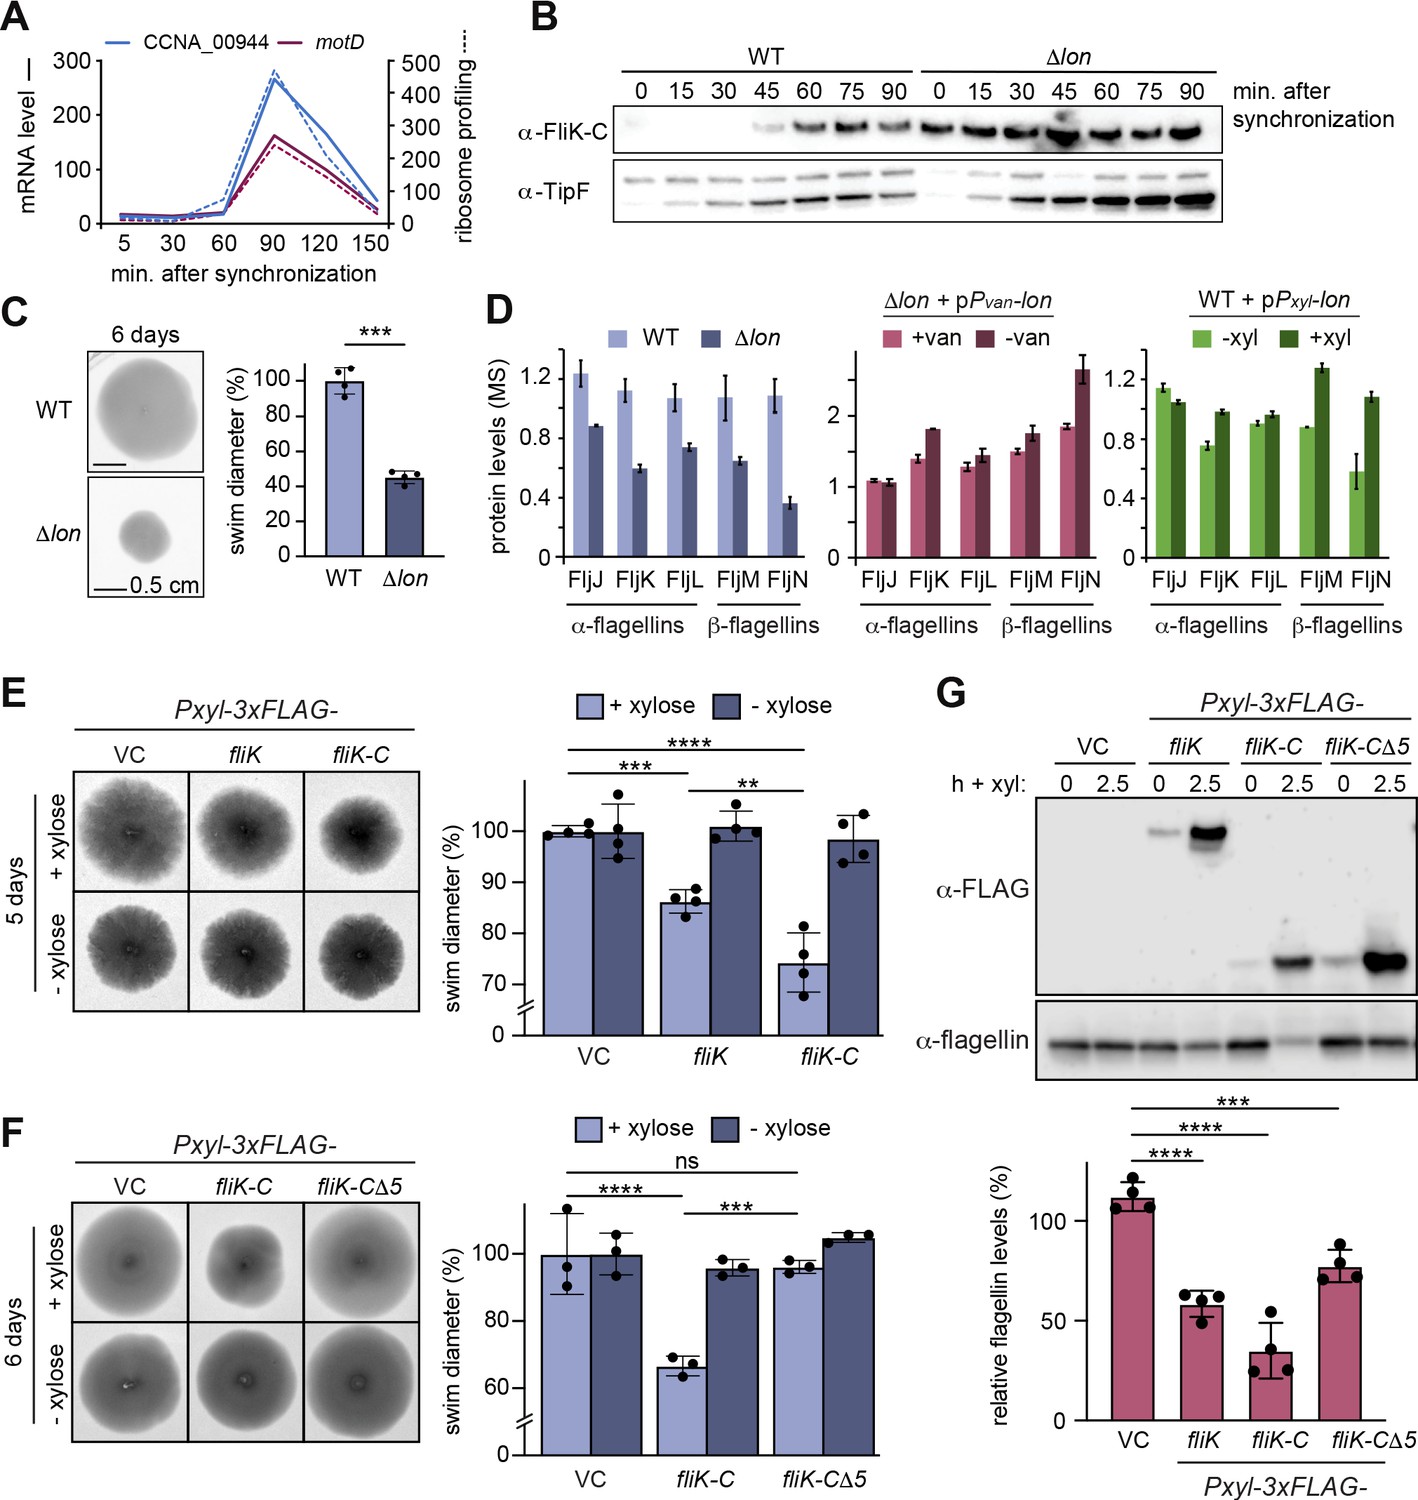
Lon-dependent degradation ensures temporal regulation of FliK levels during the cell cycle, which is needed for normal flagellin expression and motility.
(A) RNA-sequencing and ribosome profiling data for CCNA_00944 and motD (CCNA_00945), as previously published (Lasker et al., 2016; Schrader et al., 2016). (B) Protein levels of FliK and TipF in synchronized wild-type (WT) and ∆lon (KJ546) cultures over 90 min following release of swarmer cells into PYE medium. TipF was included as a control. (C) Motility assay of Caulobacter crescentus WT and the ∆lon (KJ546) mutant in PYE soft agar after 6 days. The graph shows the relative swim diameters from four biological replicates, means (mean WT value was set to 100%), and standard deviations are indicated. Statistical significance was determined by paired two-tailed t-test: WT vs. ∆lon p=0.0002, ***. (D) Flagellin protein levels as determined by mass spectrometry in WT and ∆lon (LS2382) mutant cells as well as in the other strain backgrounds and conditions, see Figure 1. (E) Motility assay in soft agar of strains overexpressing 3xFLAG-tagged FliK and FliK-C by xylose induction (+xylose) in comparison to the vector control (VC) and non-inducing conditions (−xylose). The graph shows the relative swim diameters from four biological replicates, means (mean of VC was set to 100%) and standard deviations are indicated. Statistical significance was determined by ordinary one-way ANOVA (Šidák’s multiple comparisons test) for the following comparisons: VC +xyl vs. Pxyl-3xFLAG-fliK +xyl p=0.0004, ***; VC +xyl vs. Pxyl-3xFLAG-fliK-C +xyl <0.0001, ****; Pxyl-3xFLAG-fliK +xyl vs. Pxyl-3xFLAG-fliK-C +xyl p=0.0016, **. (F) Motility assay in soft agar of strains overexpressing 3xFLAG-tagged FliK-C and FliK-C∆5 by xylose induction (+xylose) in comparison to the VC and non-inducing conditions (−xylose). The graph shows the relative swim diameters from three biological replicates, means (relative to VC) and standard deviations are indicated. Statistical significance was determined by ordinary one-way ANOVA (Šidák’s multiple comparisons test) for the following comparisons: VC +xyl vs. Pxyl-3xFLAG-fliK-C +xyl p<0.0001, ****; VC +xyl vs. Pxyl-3xFLAG-fliK-CΔ5 +xyl p=0.8184, not significant; Pxyl-3xFLAG-fliK-C +xyl vs. Pxyl-3xFLAG-fliK-CΔ5 +xyl p=0.0001, ***. (G) Western blot analysis showing total flagellin levels of strains harboring the empty vector (VC) or plasmids for expression of 3xFLAG-tagged FliK, FliK-C, or FliK-C∆5 before (0) and after induction of expression by xylose for 2.5 hr (lower panel). Induction of the respective FliK variants was determined by Western blot analysis using an anti-FLAG antibody (upper panel). The graph shows the relative flagellin levels compared to the uninduced condition (without xylose) for each strain, as determined by four independent experiments, mean values and standard deviations are indicated. Statistical significance was determined by ordinary one-way ANOVA (Šidák’s multiple comparisons test) for the following comparisons: VC vs. Pxyl-3xFLAG-fliK p<0.0001, ****; VC vs. Pxyl-3xFLAG-fliK-C p<0.0001,****; VC vs. Pxyl-3xFLAG-fliK-CΔ5 p=0.0006, ***.
-
Figure 5—source data 1
Unprocessed Western blot images.
- https://cdn.elifesciences.org/articles/73875/elife-73875-fig5-data1-v1.zip
Figure 6 with 1 supplement
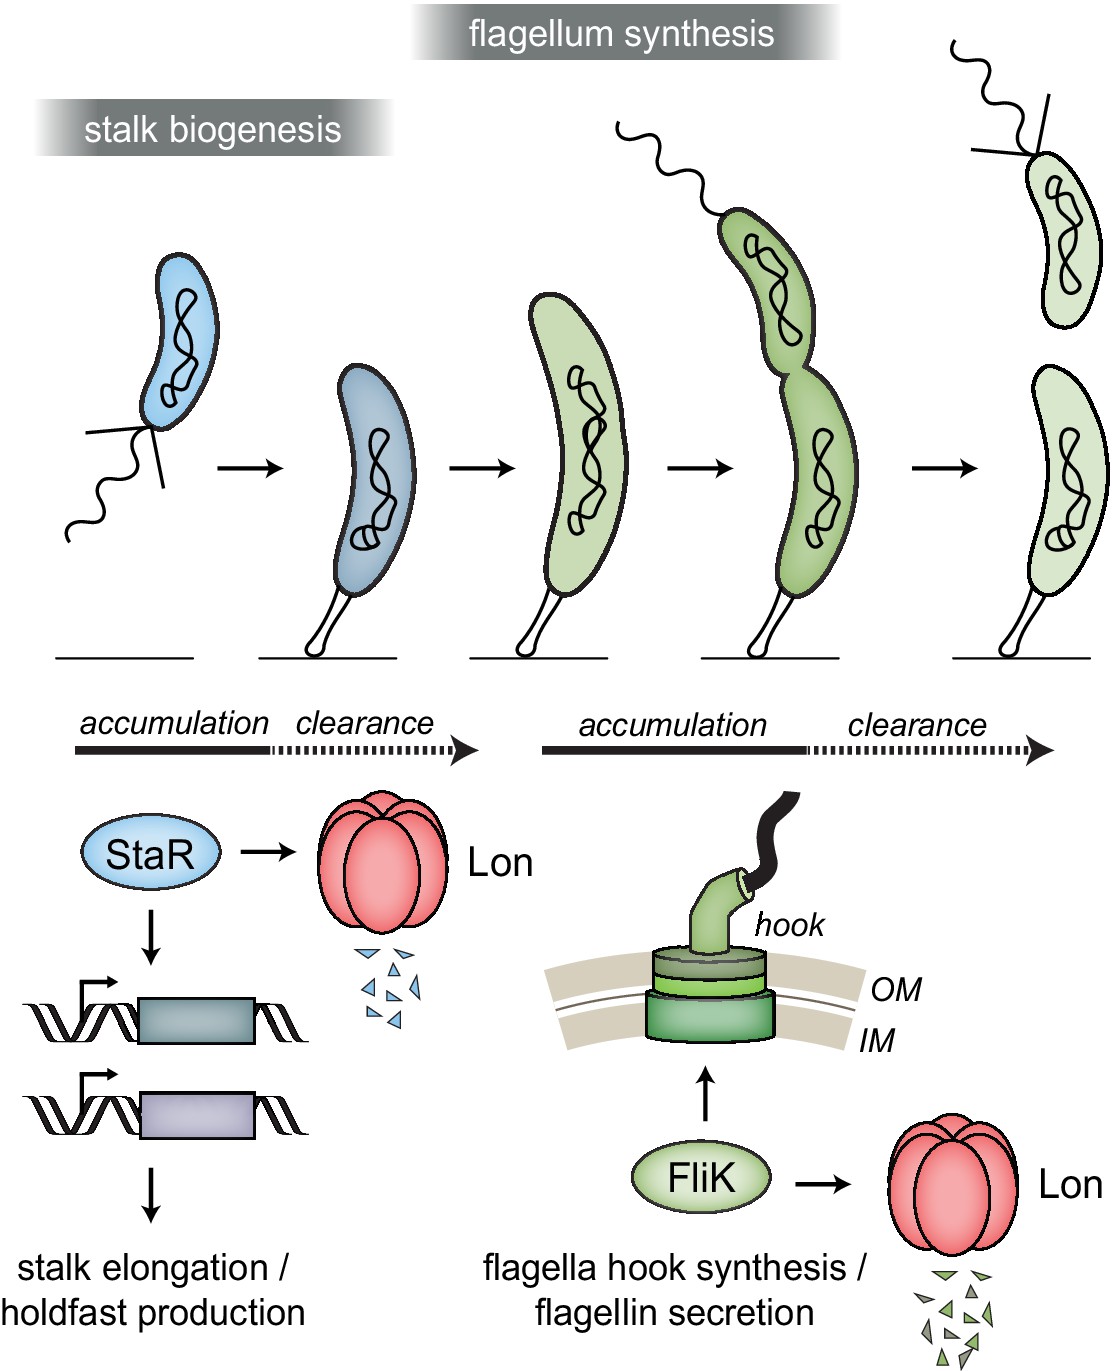
Lon ensures temporal regulation of stalk and flagella biogenesis during the Caulobacter crescentus cell cycle.
Lon specifically degrades StaR, a transcriptional regulator of stalk biogenesis and holdfast production, and FliK, a protein involved in regulating flagella hook synthesis. The expression of staR peaks in swarmer cells, while the expression of fliK peaks in late stalked and predivisional cells (Lasker et al., 2016; Laub et al., 2000; Schrader et al., 2016). Our study shows that Lon-dependent proteolysis is required to rapidly eliminate these proteins when their expression levels drop, thus outpacing synthesis. The combination of proteolysis and regulated transcription ensures that StaR abundance is temporally restricted to the swarmer-to-stalked cell transition (shown in blue) and FliK abundance to the late stalked and predivisional cell (shown in green) when their functions are needed for stalk biogenesis or flagella synthesis, respectively.
Figure 6—figure supplement 1
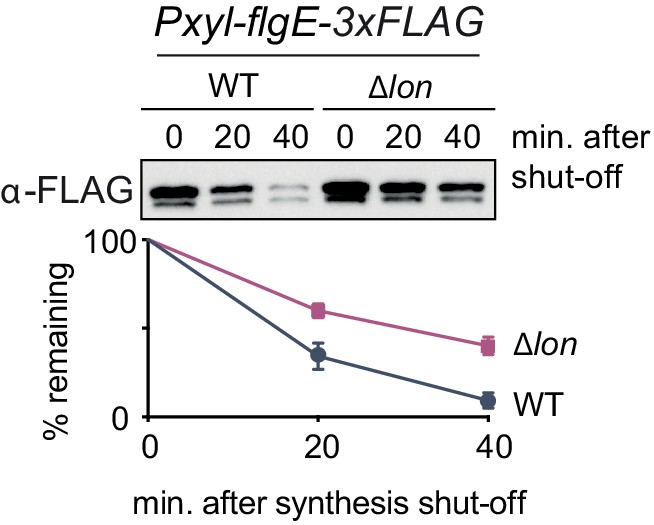
FlgE degradation is partially dependent on Lon.
In vivo degradation assay of C-terminally FLAG-tagged FlgE (FlgE-3×FLAG) after overexpression by xylose induction in wild-type (WT) and ∆lon (KJ546) cells. Samples were taken at the indicated time points after protein synthesis shut off. Mean values and standard deviation of relative protein levels after protein synthesis shut off were determined from three independent experiments.
-
Figure 6—figure supplement 1—source data 1
Unprocessed Western blot images.
- https://cdn.elifesciences.org/articles/73875/elife-73875-fig6-figsupp1-data1-v1.zip
Tables
Key resources table
| Reagent type (species) or resource | Designation | Source or reference | Identifiers | Additional information |
|---|---|---|---|---|
| Gene (Caulobacter crescentus) | fliK-C; motD; CCNA_00945 | GeneBank | GeneBank:CCNA_00945 | |
| Gene (C. crescentus) | staR; CCNA_02334 | GeneBank | GeneBank:CCNA_02334 | |
| Strain, strain background (Escherichia coli) | DH5α | Other | Michael Laub, Massachusetts Institute of Technology;Chemical competent cells | |
| Strain, strain background (E. coli) | BL21-SI/pCodonPlus | Other | Claes Andréasson, Stockholm University;Electrocompetent cells | |
| Strain, strain background (C. crescentus) | NA1000 | Other | Michael Laub, Massachusetts Institute of Technology;Electrocompetent cells | |
| Genetic reagent (plasmid) | pBX-MCS-4 (plasmid) | Thanbichler et al., 2007 | Martin Thanbichler, MPI Marburg | |
| Genetic reagent (plasmid) | pSUMO-YHRC | Holmberg et al., 2014 | RRID:Addgene_54336 | |
| Antibody | Goat anti-mouse IgG (H+L) Secondary Antibody, HRP | Thermo Fisher Scientific | Cat# 32430; RRID:AB_1185566 | (1:5000) |
| Antibody | Goat anti-Rabbit IgG (H+L) Secondary Antibody, HRP | Thermo Fisher Scientific | Cat# 32460; RRID:AB_1185567 | (1:5000) |
| Antibody | ANTI-FLAG M2 antibody (Mouse monoclonal) | Sigma-Aldrich | Cat# F1804; RRID:AB_262044 | (1:5000) |
| Antibody | Anti-DnaA (Rabbit polyclonal) | Jonas et al., 2011 | (1:5000) | |
| Antibody | Anti-Lon (Rabbit polyclonal) | Other | (1:10,000) kindly provided by R.T. Sauer | |
| Antibody | Anti-CcrM (Rabbit polyclonal) | Stephens et al., 1996 | (1:5000) | |
| Antibody | Anti-SciP (Rabbit polyclonal) | Gora et al., 2010 | (1:2000) | |
| Antibody | Anti-TipF (Rabbit polyclonal) | Davis et al., 2013 | (1:5000) kindly provided by P. Viollier | |
| Antibody | Anti-StaR (Rabbit polyclonal) | Fiebig et al., 2014 | (1:500) | |
| Antibody | Anti-FliK-C (Rabbit polyclonal) | This paper | (1:500) | |
| Antibody | Anti-flagellin (Rabbit polyclonal) | Brun and Shapiro, 1992 | (1:2000) kindly provided by Y. Brun | |
| Peptide, recombinant protein | Ulp1-6xHis | Other | Source vector and purification protocol kindly provided by Claes Andréasson (Stockholm University) | |
| Commercial assay or kit | SuperSignal West Femto Maximum Sensitivity Substrate | Thermo Fisher Scientific | Cat # 34095 | |
| Software, algorithm | Image Lab | Bio-Rad https://www.bio-rad.com/en-ca/product/image-lab-software | RRID:SCR_014210 | Version 6.0 |
| Software, algorithm | GraphPad Prism | https://www.graphpad.com | RRID:SCR_002798 | Version 7.0 |
| Software, algorithm | Fiji (ImageJ) | Schindelin et al., 2012https://fiji.sc/ | RRID:SCR_002285 | |
| Other | 4–20% Mini-PROTEAN TGX Stain-Free Protein Gels, 15 well, 15 µl | Bio-Rad | Cat # 4568096 | |
| Other | Trans-Blot Turbo System | Bio-Rad | Cat # 1704150EDU | |
| Other | LI-COR Odyssey Fc Imaging System | LI-COR | https://www.licor.com/bio/odyssey-fc/ |
Additional files
-
Supplementary file 1
List of bacterial strains, plasmids and primers used in this study.
- https://cdn.elifesciences.org/articles/73875/elife-73875-supp1-v1.xlsx
-
Transparent reporting form
- https://cdn.elifesciences.org/articles/73875/elife-73875-transrepform1-v1.docx
Download links
A two-part list of links to download the article, or parts of the article, in various formats.
Downloads (link to download the article as PDF)
Open citations (links to open the citations from this article in various online reference manager services)
Cite this article (links to download the citations from this article in formats compatible with various reference manager tools)
The Lon protease temporally restricts polar cell differentiation events during the Caulobacter cell cycle
eLife 10:e73875.
https://doi.org/10.7554/eLife.73875


