Genomic epidemiology of the first two waves of SARS-CoV-2 in Canada
- British Columbia Centre for Excellence in HIV/AIDS, Canada
- Bioinformatics, University of British Columbia, Canada
- Department of Medicine, University of British Columbia, Canada
- Department of Ecology and Evolution, University of Arizona, United States
- Department of Pathology and Laboratory Medicine, Western University, Canada
Figures
Figure 1 with 2 supplements
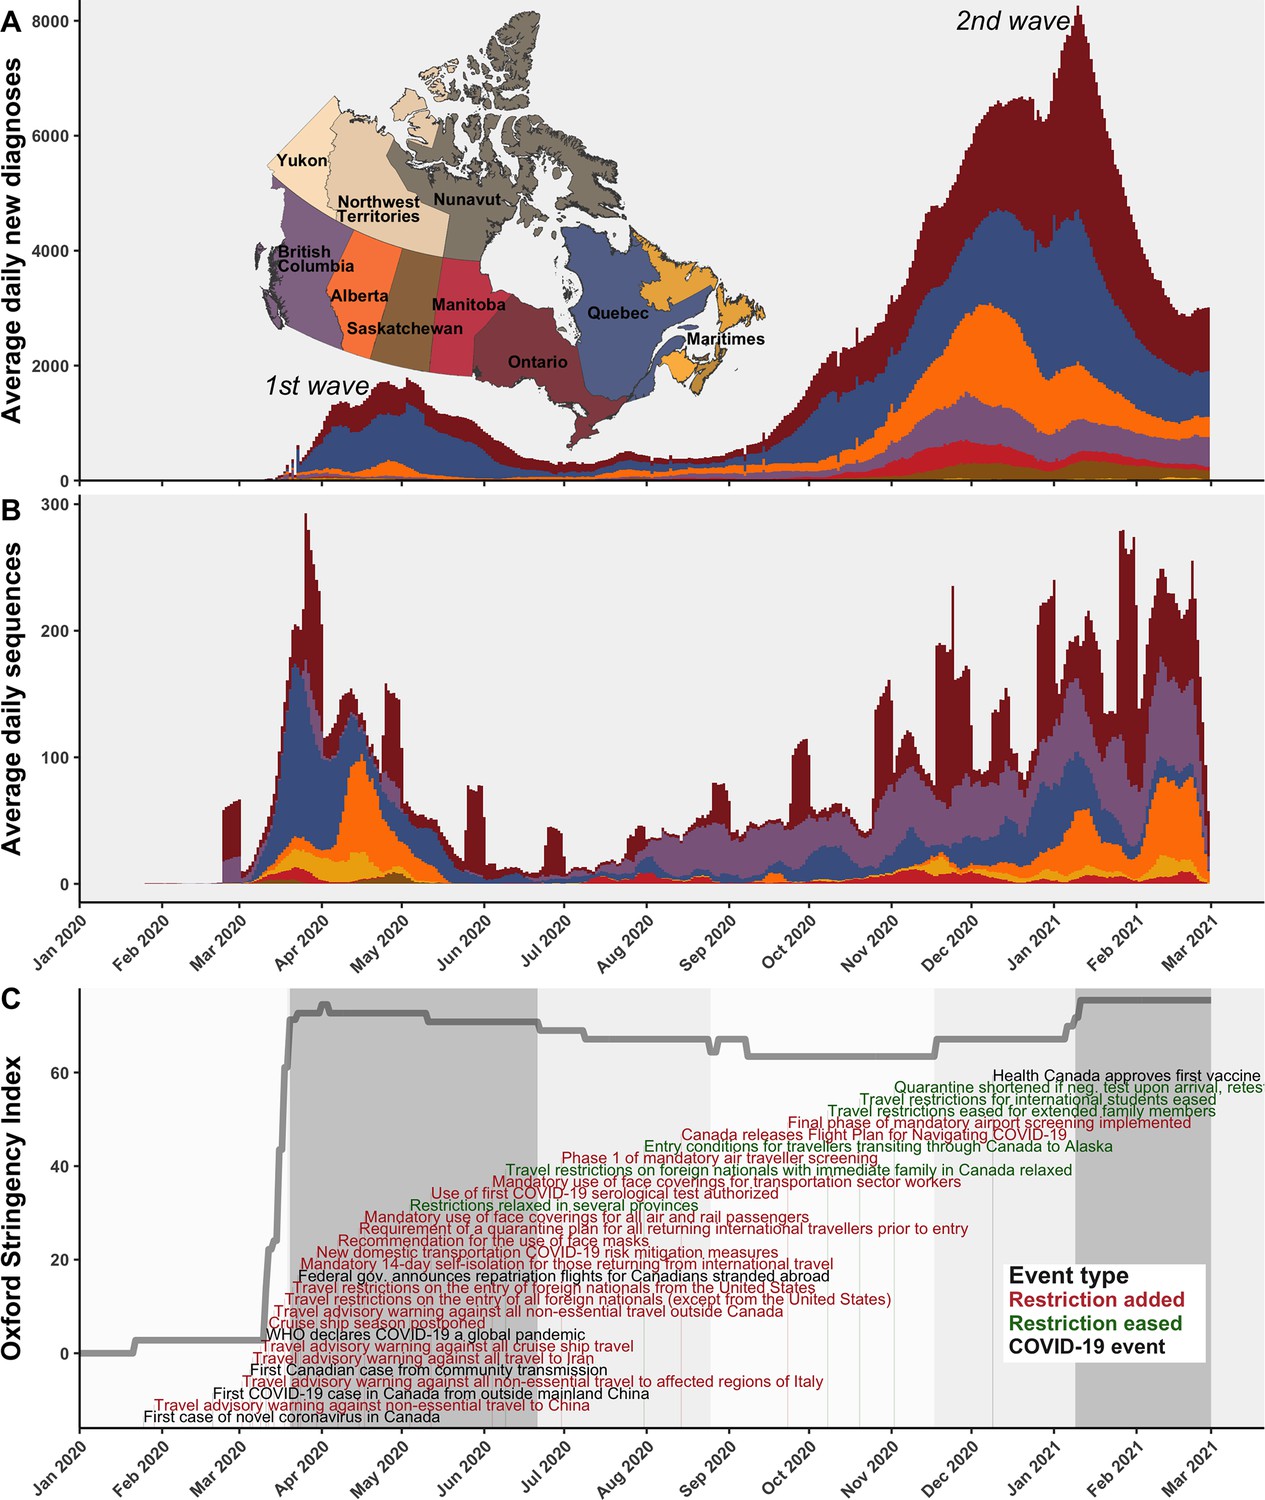
A timeline of the first and second waves of the Canadian COVID-19 epidemic up to 1 March 2021.
(A) Rolling average daily new COVID-19 diagnoses in previous 7 days across Canadian provinces and territories, or the daily count where data was sparse prior to April 2020. (B) Rolling average daily clean SARS-CoV-2 sequences collected in previous 7 days, or daily sequences where data was sparse, uploaded to Global Initiative on Sharing All Influenza Data (GISAID) by 15 June 2021. Incomplete sample collection dates were inferred within time-scaled phylogenies. (C) The Oxford Stringency Index for Canada overlaid with key epidemiologic events and national-level public health restrictions. Figure 1—figure supplement 1 summarizes the frequencies of Pango lineages among daily Canadian sequences. Figure 1—figure supplement 2 compares monthly cases, sequences available, and sequences sampled globally and within Canada.
Figure 1—figure supplement 1
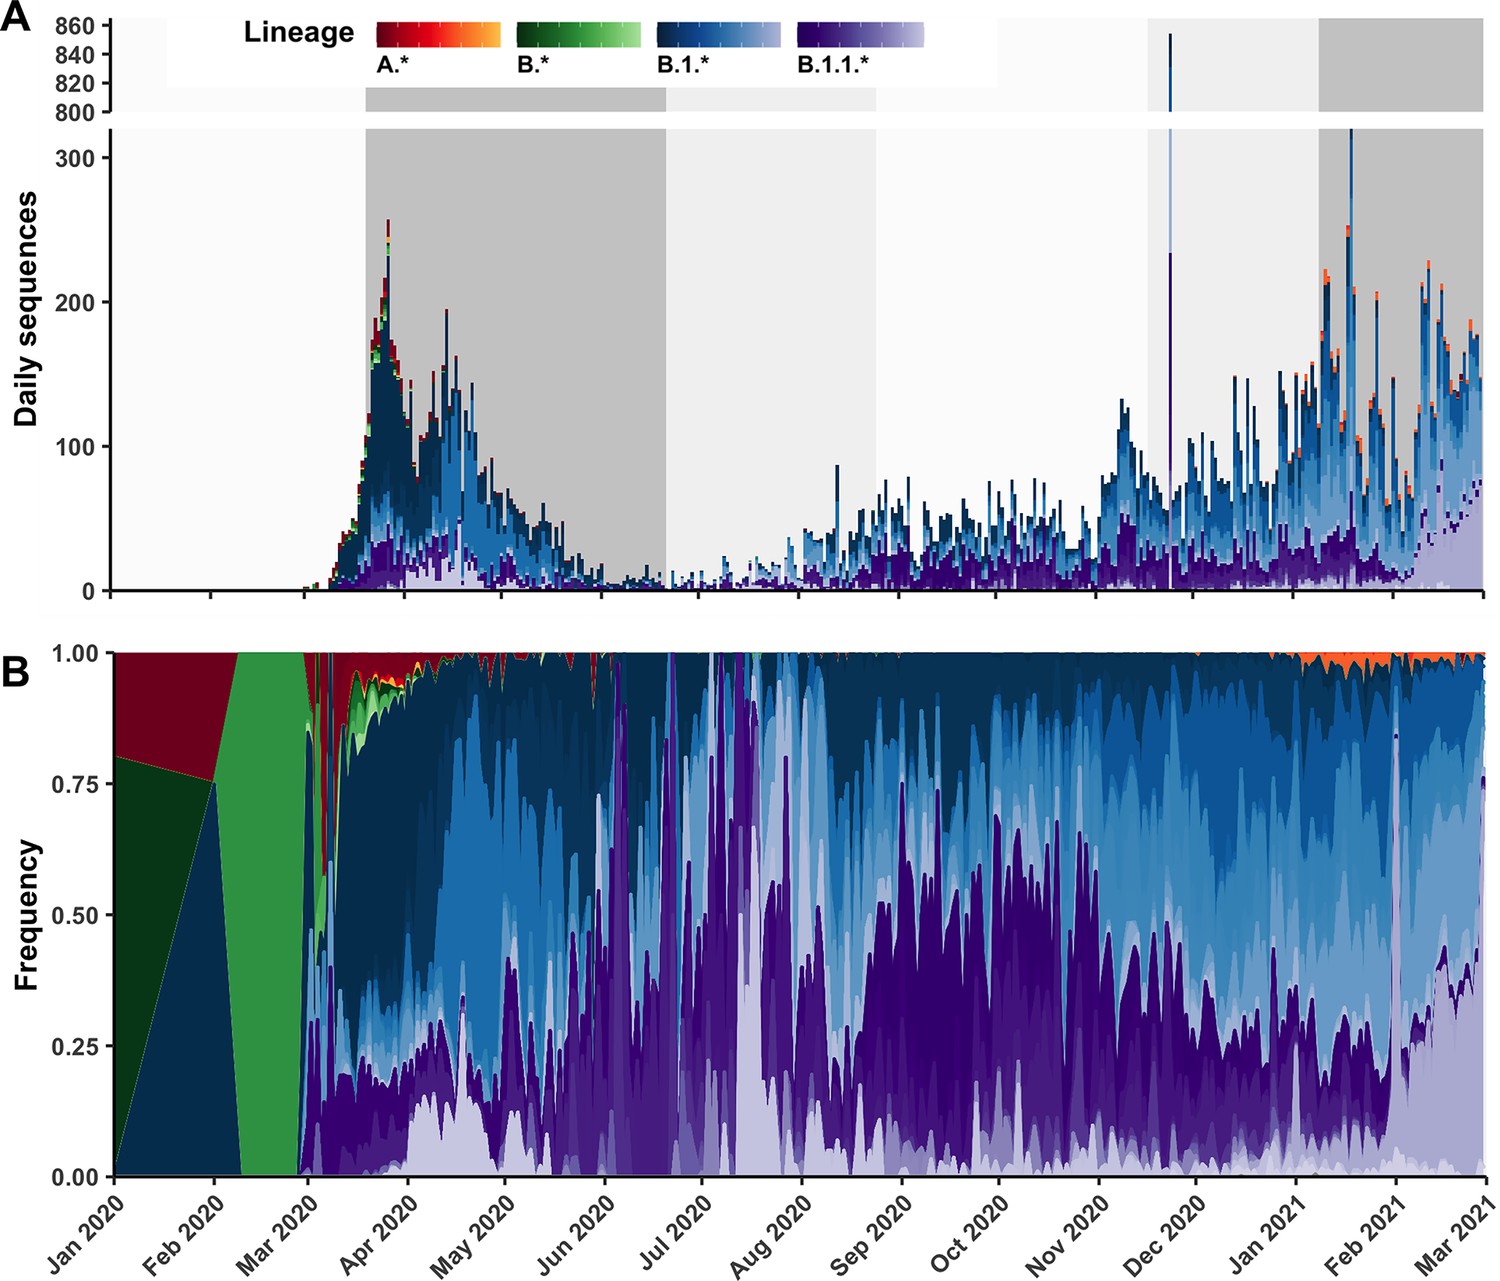
Canadian sequences available on Global Initiative on Sharing All Influenza Data (GISAID) over time by Pango lineage.
(A) Raw daily counts and (B) relative frequencies of Canadian sequences coloured by Pango lineage, separated by lineage groups A.*, B.*, B.1.*, and B.1.1.* containing the parental lineage and its descendants not covered by other groups (e.g., B.1.1.7 is within B.1.1.* only).
Figure 1—figure supplement 2
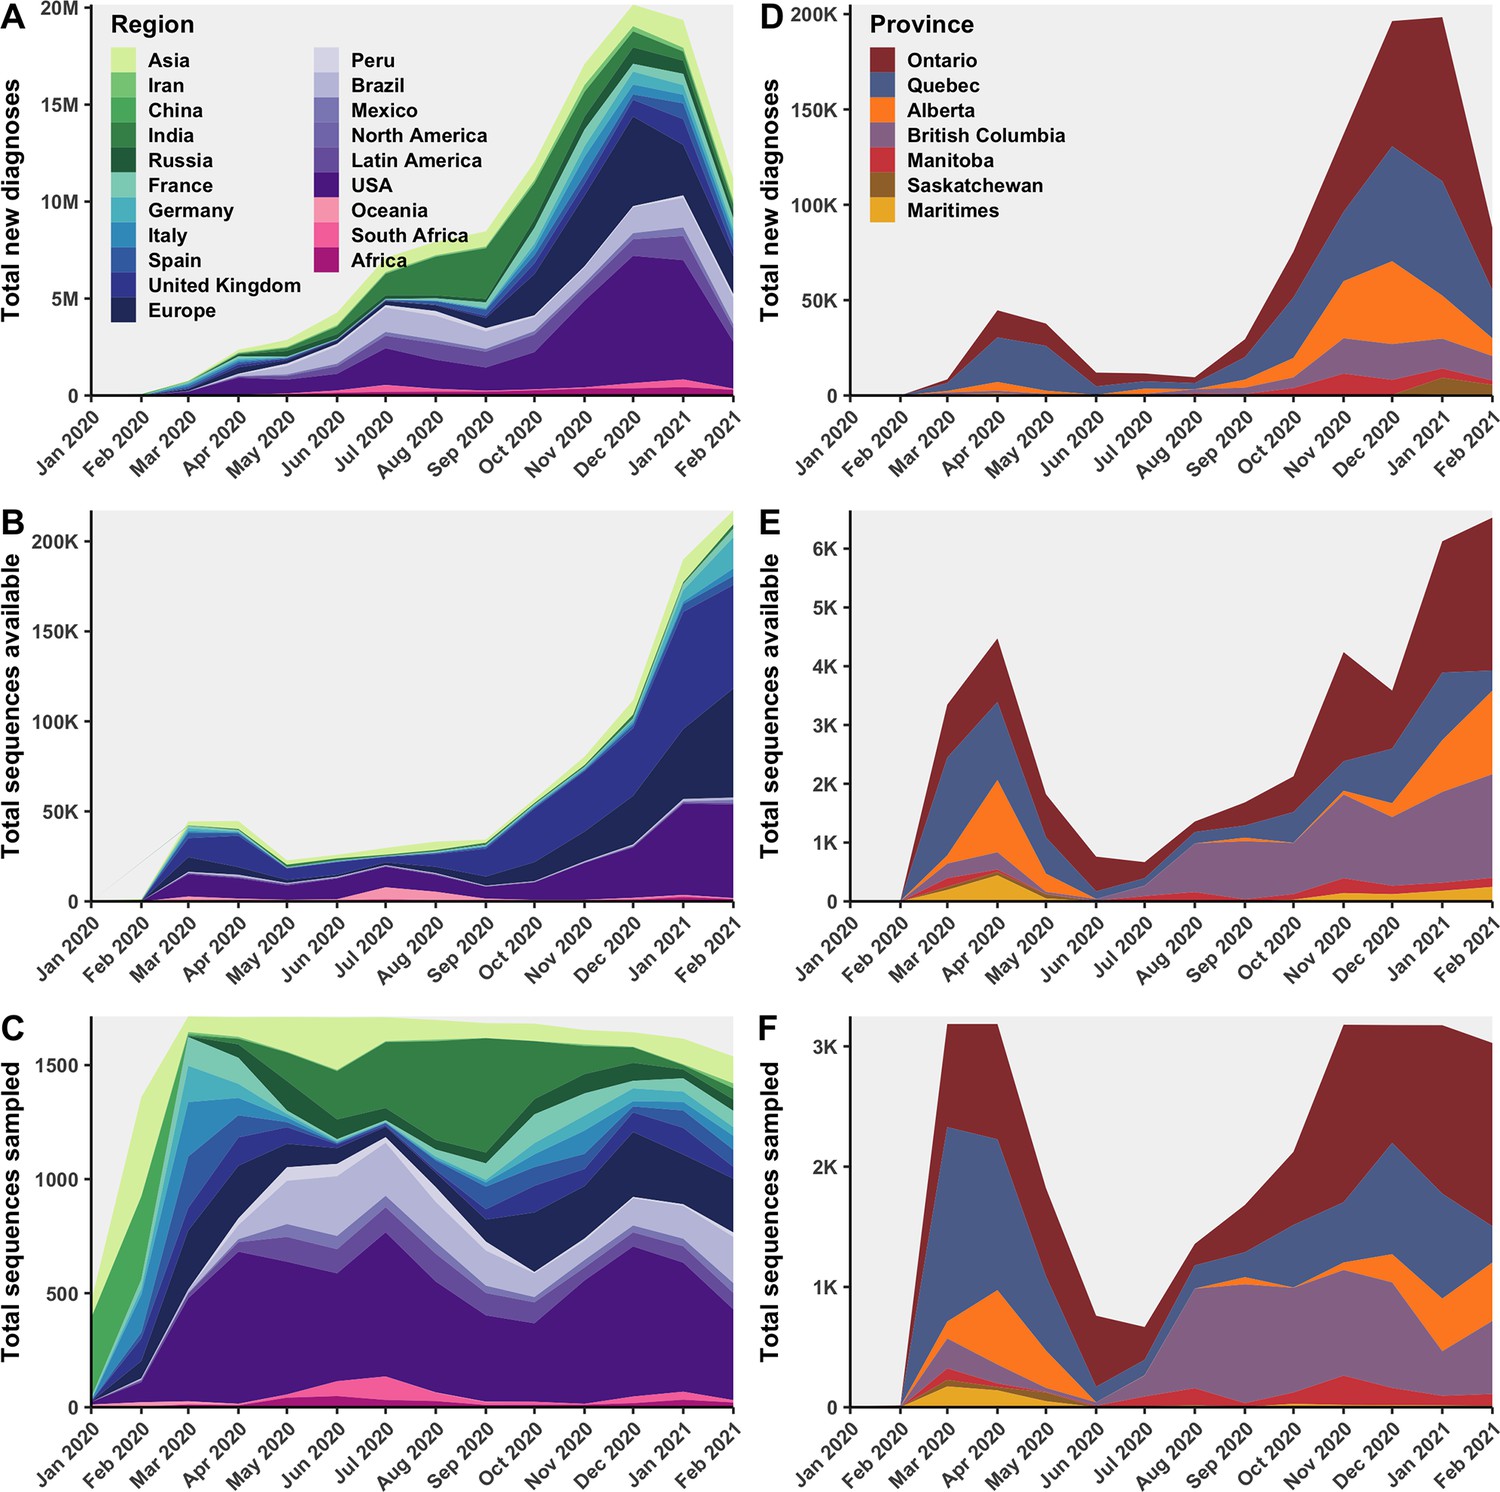
Canadian and global sequences were subsampled with probabilities proportional to total monthly cases.
Global regions’ monthly (A) total new diagnoses, (B) total clean Global Initiative on Sharing All Influenza Data (GISAID) sequences available, and (C) total sequences subsampled within the 75% Canadian sequences retained strategy. Canadian provinces’ monthly (D) total new diagnoses, (E) total sequences available, and (F) sequences subsampled with the 75% subsampling strategy. Countries were grouped into continents if they were the source of fewer than five sublineages. Only countries and Canadian provinces with sequences available were included in the total new diagnoses. Figure 6—figure supplement 2 compares the distributions of sampled sequence by sampling strategy.
Figure 2 with 3 supplements
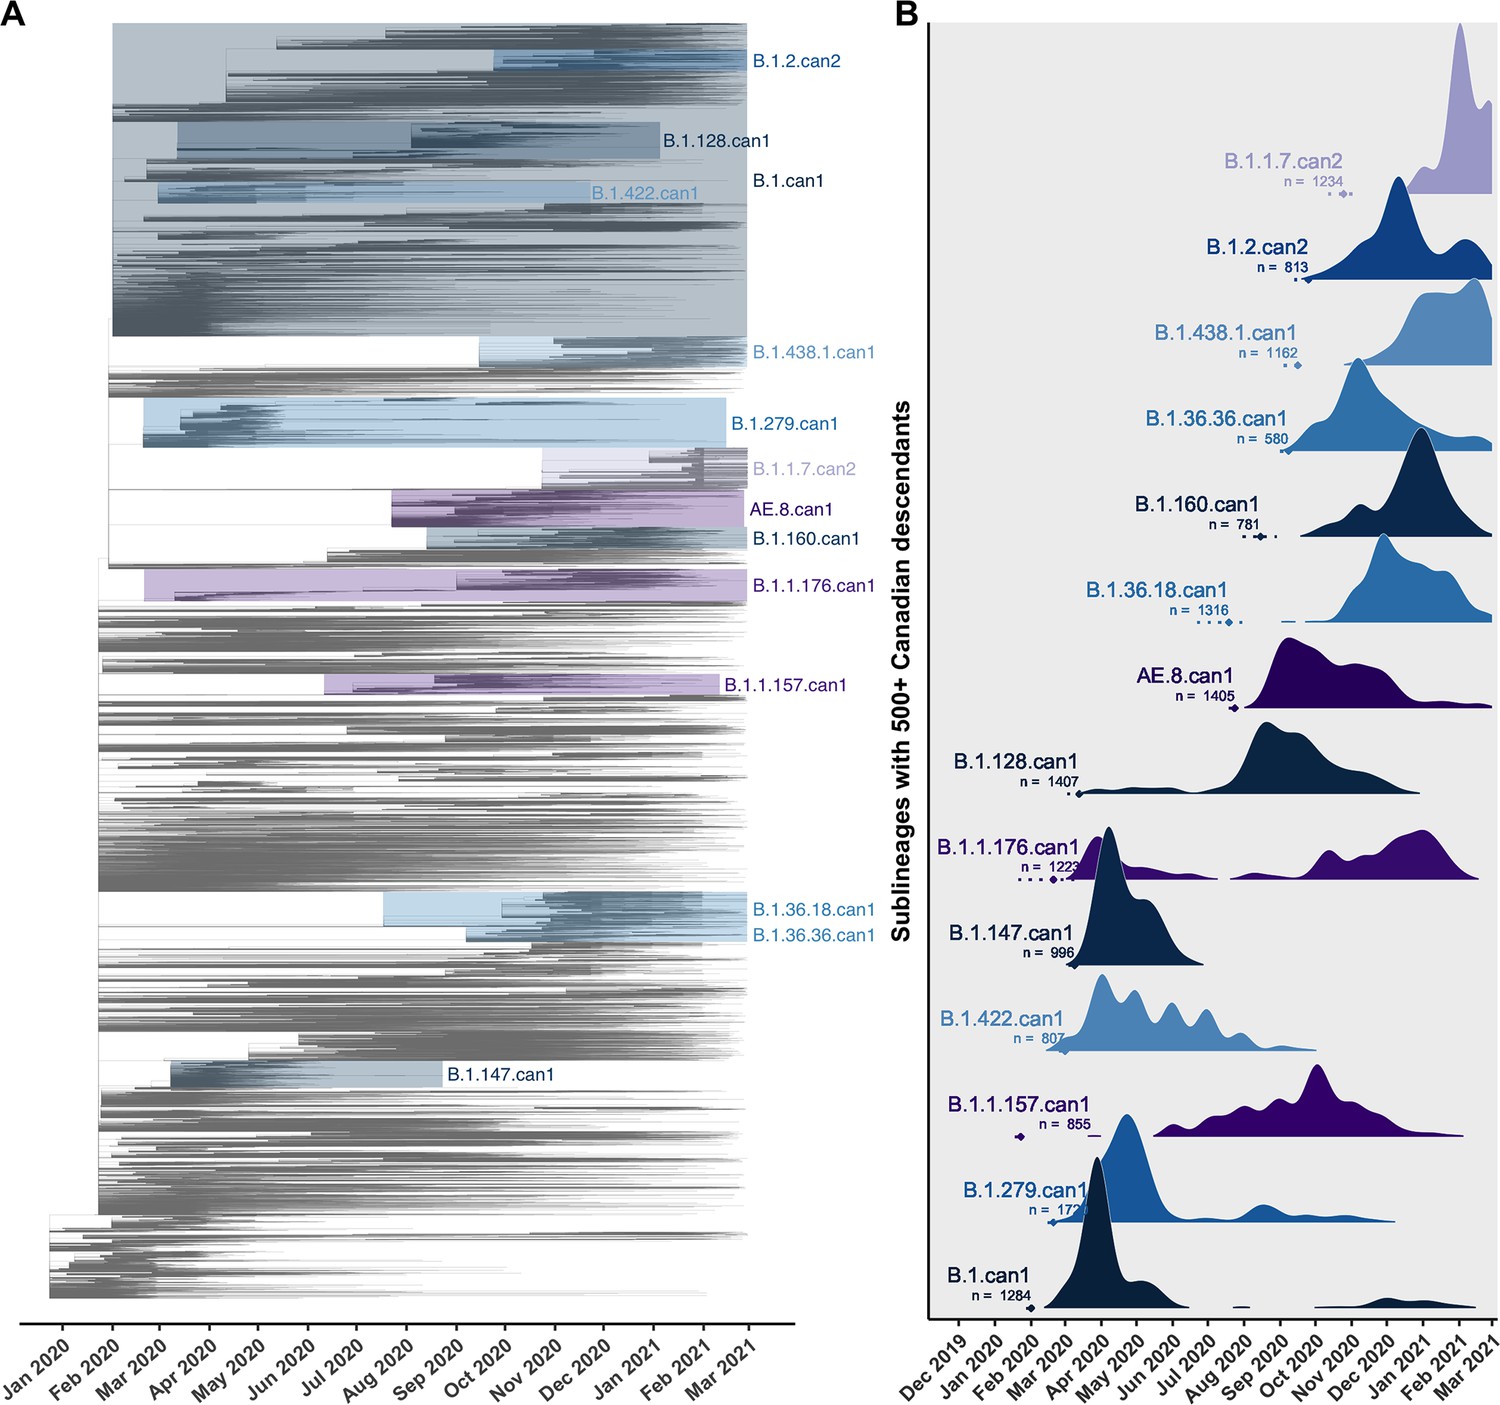
Key Canadian sublineages in a phylogenetic tree of SARS-CoV-2 in Canada and globally up to the end of the second wave on 28 February 2021.
(A) The highest likelihood bootstrap time-scaled phylogenetic tree inferred using a subsampling strategy where 75% of available Canadian sequences were retained and the remainder of sequences up to 50,000 were from global sources. (B) The timing and expansion of key Canadian SARS-CoV-2 sublineages with more than 500 sampled Canadian descendants. Height reflects the relative density of sampled Canadian descendants within each sublineage. Diamonds and dashed lines show the mean and 95% confidence interval of the time to the most recent common ancestor (TMRCA). Figure 2—figure supplement 1 zooms in on the subtrees for the four largest Canadian sublineages. Figure 2—figure supplement 2 summarizes the process of removing temporal outliers to improve molecular clock signal. Figure 2—figure supplement 3 summarizes sublineage introduction node and parent node likelihoods overlaid for all bootstraps.
Figure 2—figure supplement 1
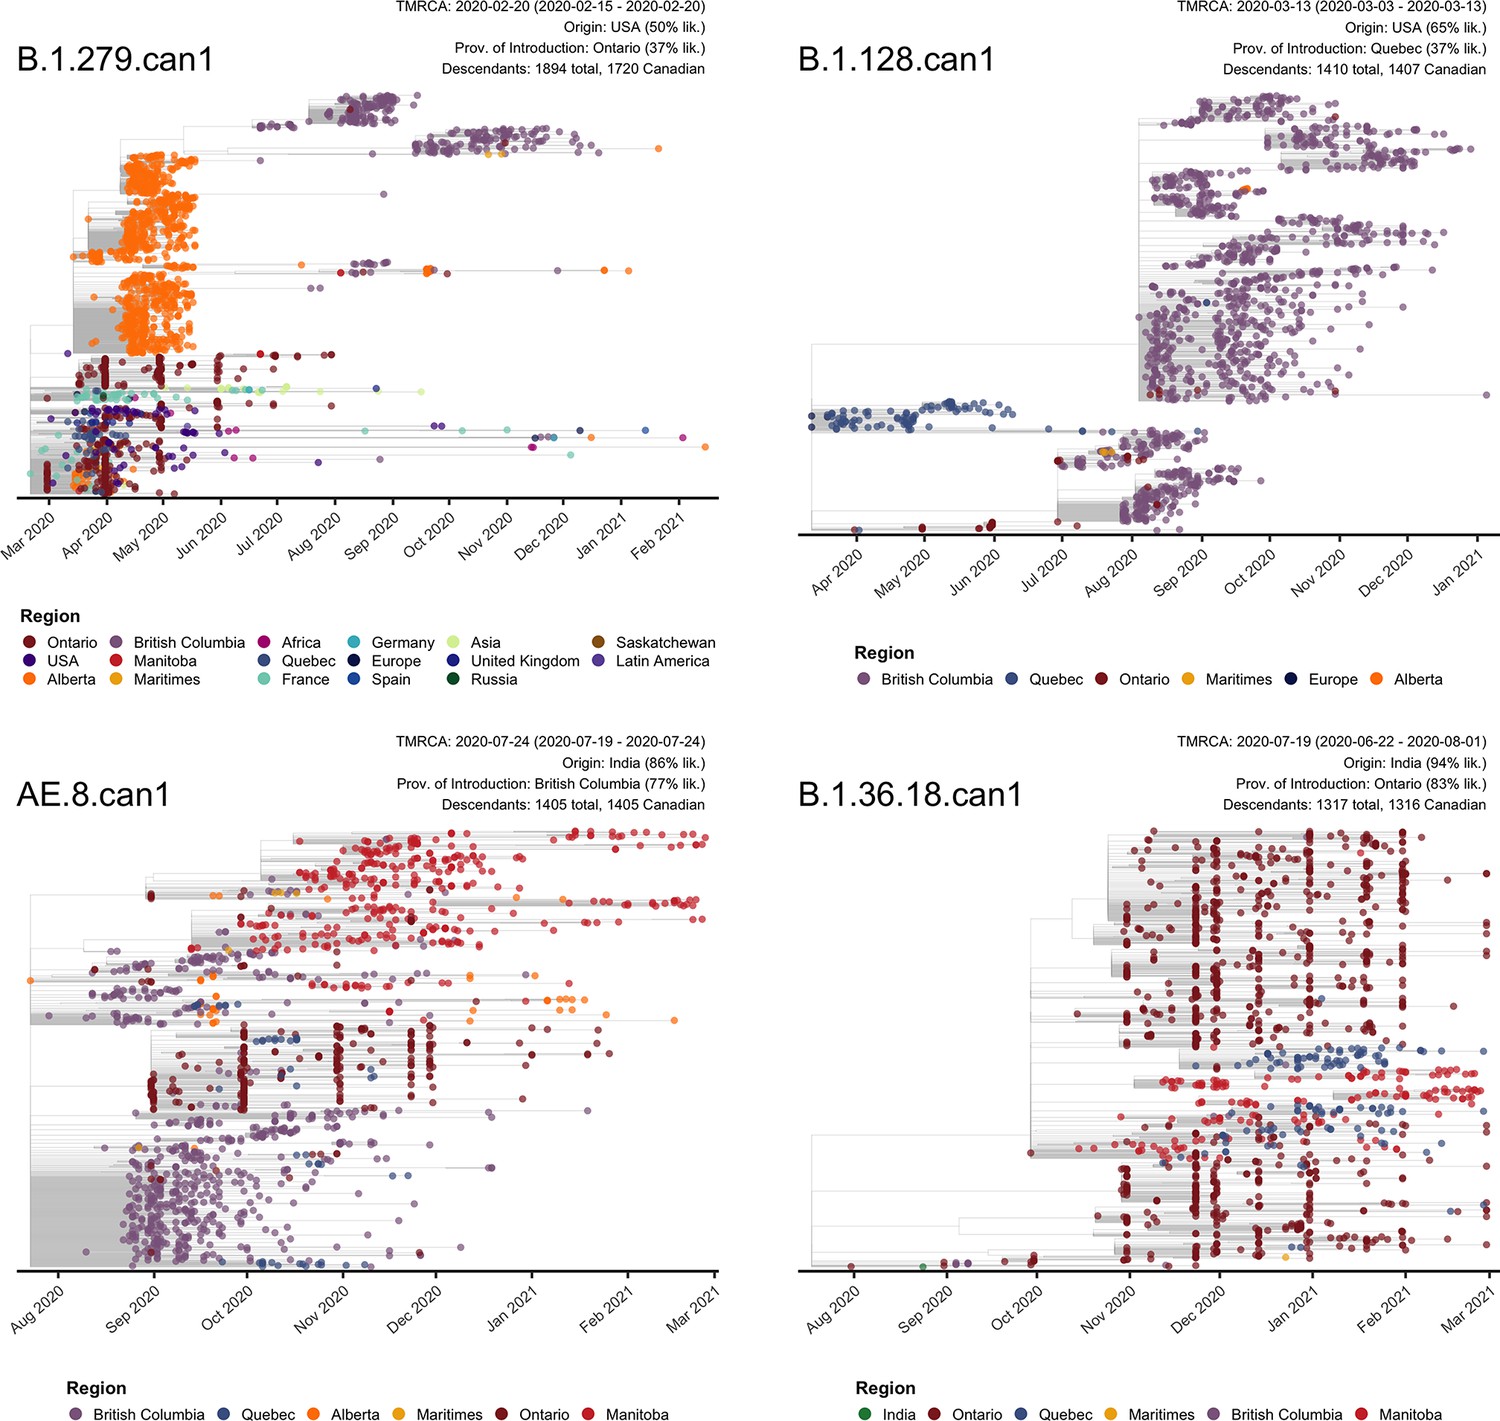
The four Canadian sublineages with the most sampled Canadian descendants by 28 February 2021.
Tip points were coloured by region of sampling. Annotations are shown for the time to the most recent common ancestor (TMRCA) with 95% confidence interval, the most likely origin region and province of introduction across 10 bootstraps with adjusted likelihood calculated as the proportion of trees that supported the location multiplied by the mean likelihood of the node states supporting that location, and the total number of sampled descendants overall and within Canada.
Figure 2—figure supplement 2
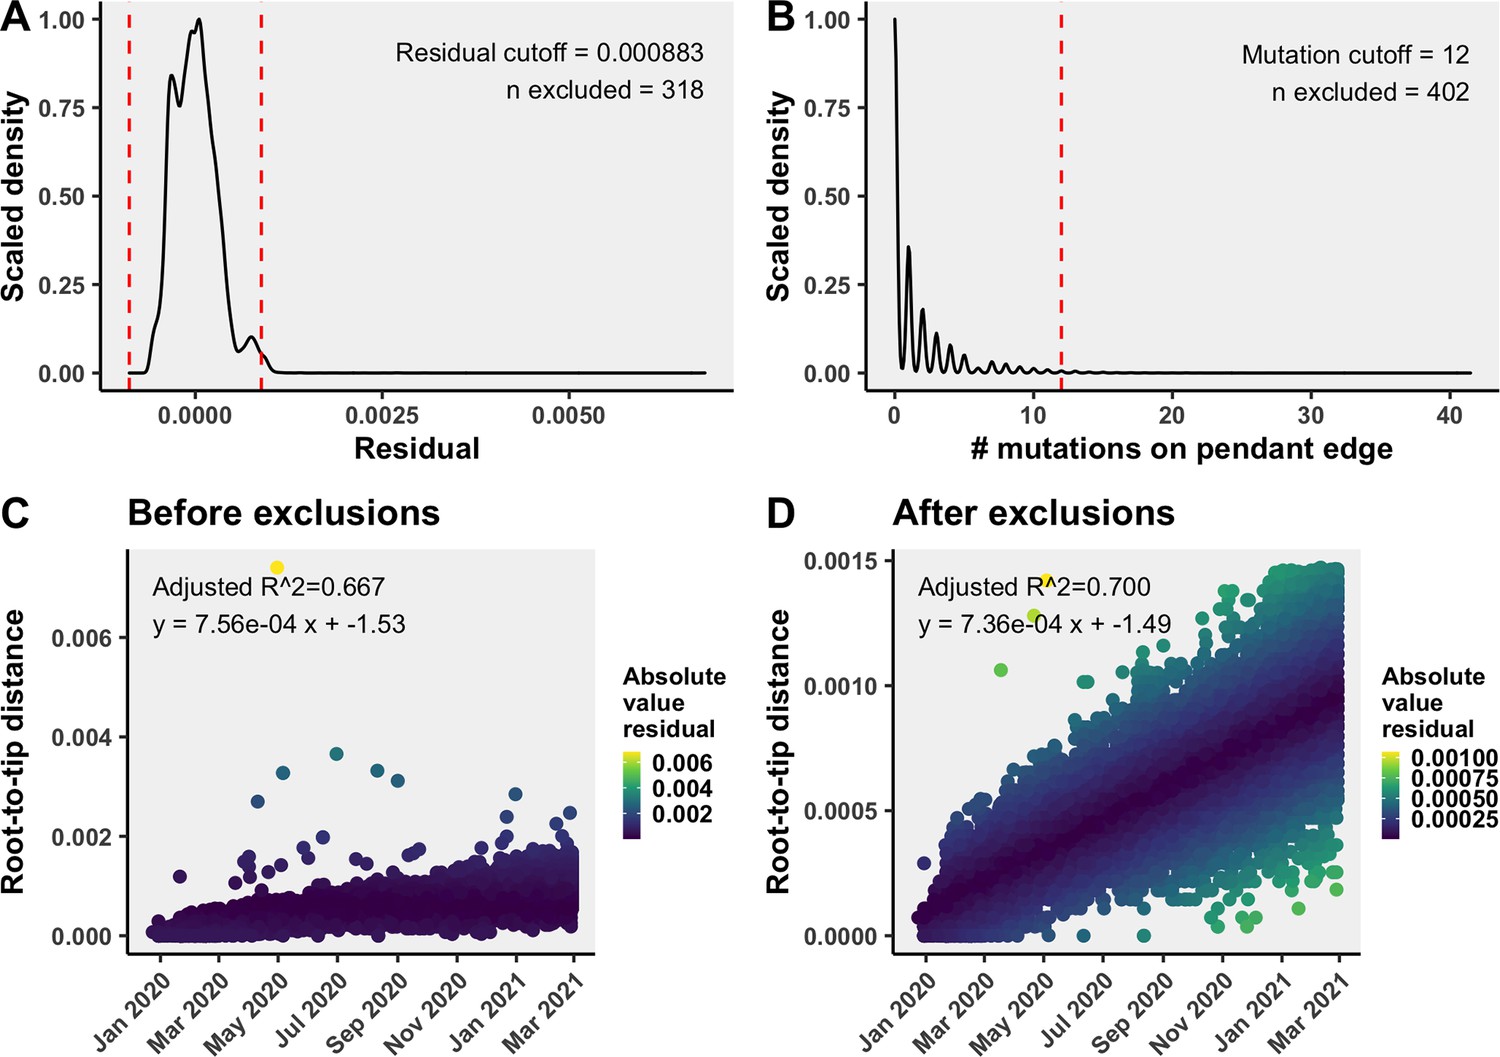
Removal of temporal outliers to improve the molecular clock rate fit.
Temporal outliers included sequences with (A) residuals further than the three standard deviations from the mean of residuals in the linear regression of divergence over time, or (B) more than 12 mutations on the final branch leading to the tip. The strict clock rate models (C) before and (D) after excluding temporal outliers. Plots are from a representative bootstrap.
Figure 2—figure supplement 3
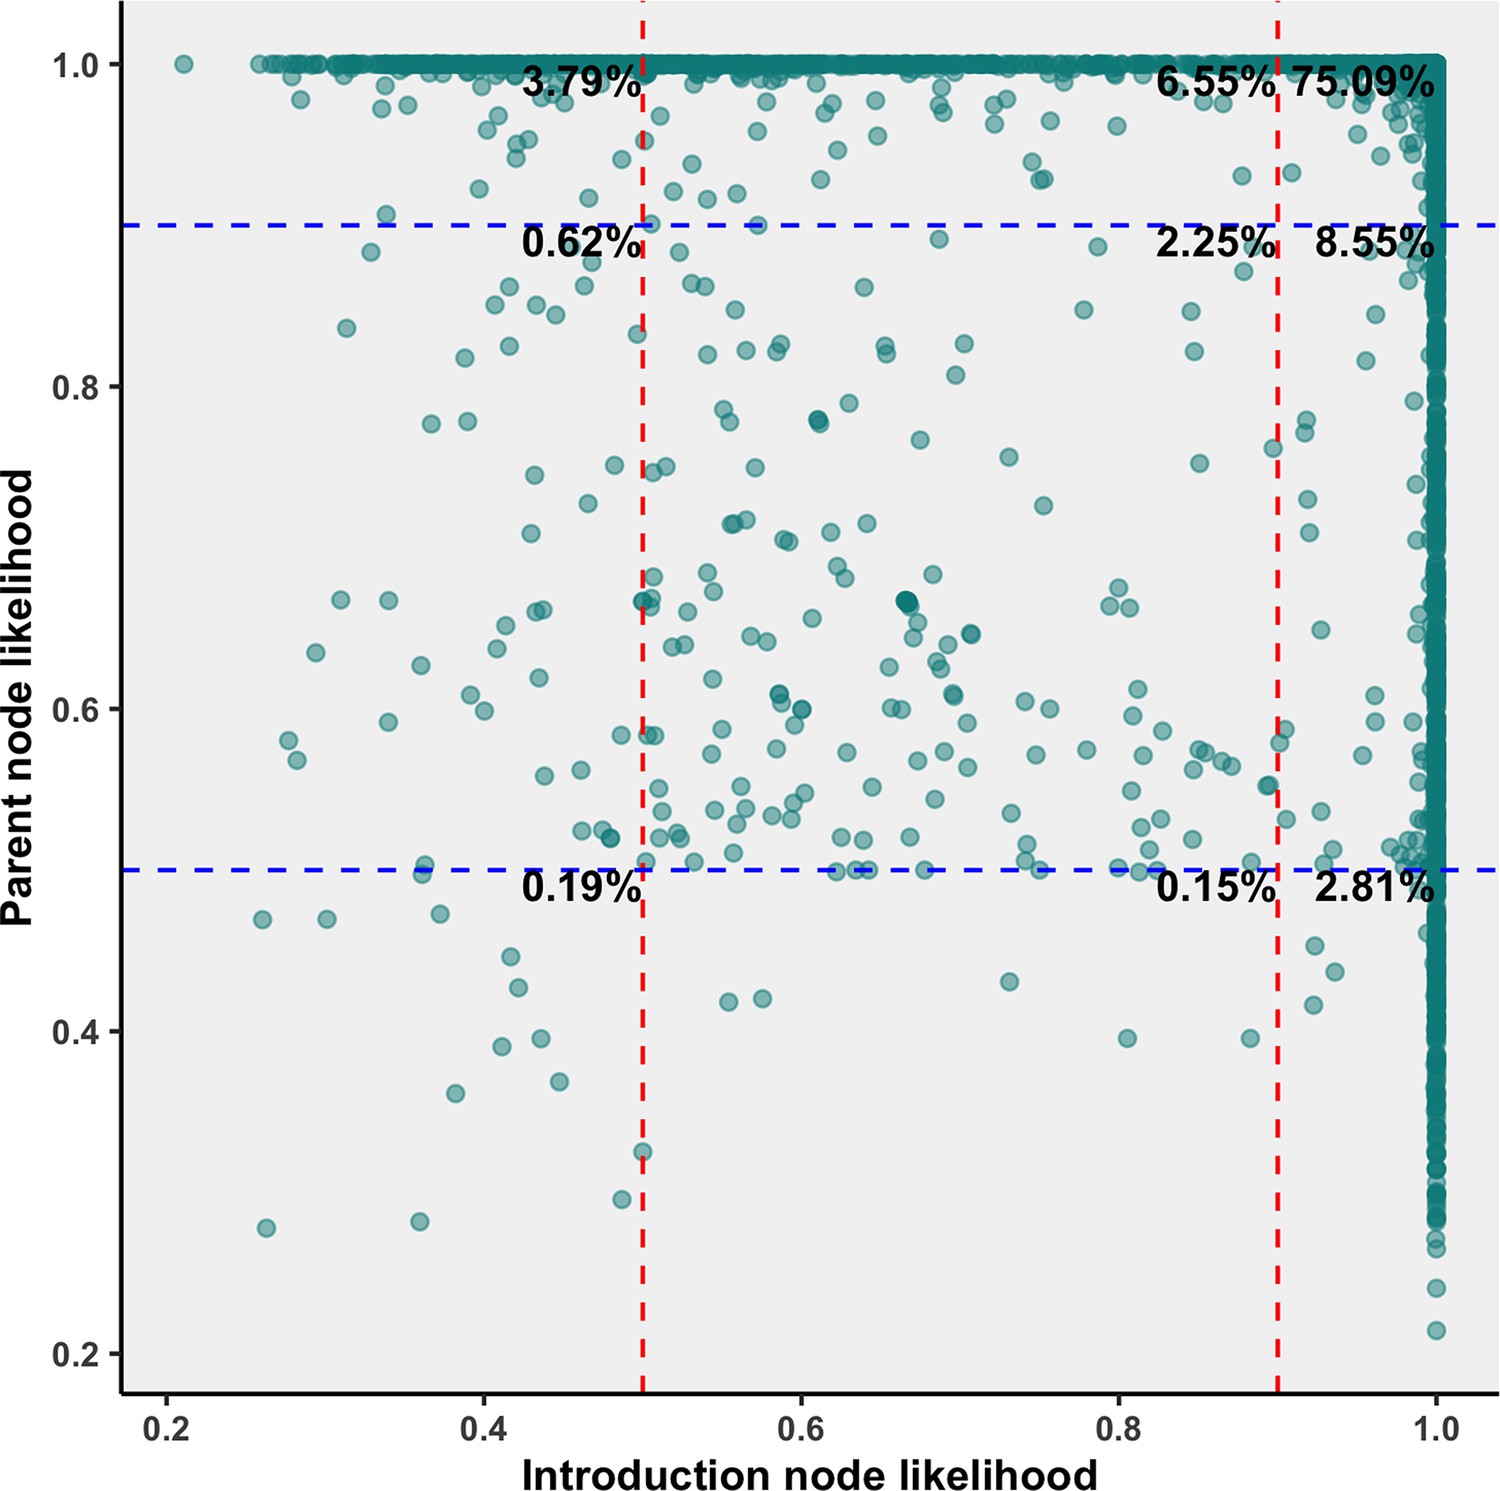
Sublineage introduction node and parent node likelihoods overlaid for all bootstraps in the 75% subsampling strategy, annotated with the percent of all Canadian sublineage-defining introductory nodes across bootstraps within each threshold.
Figure 3 with 5 supplements
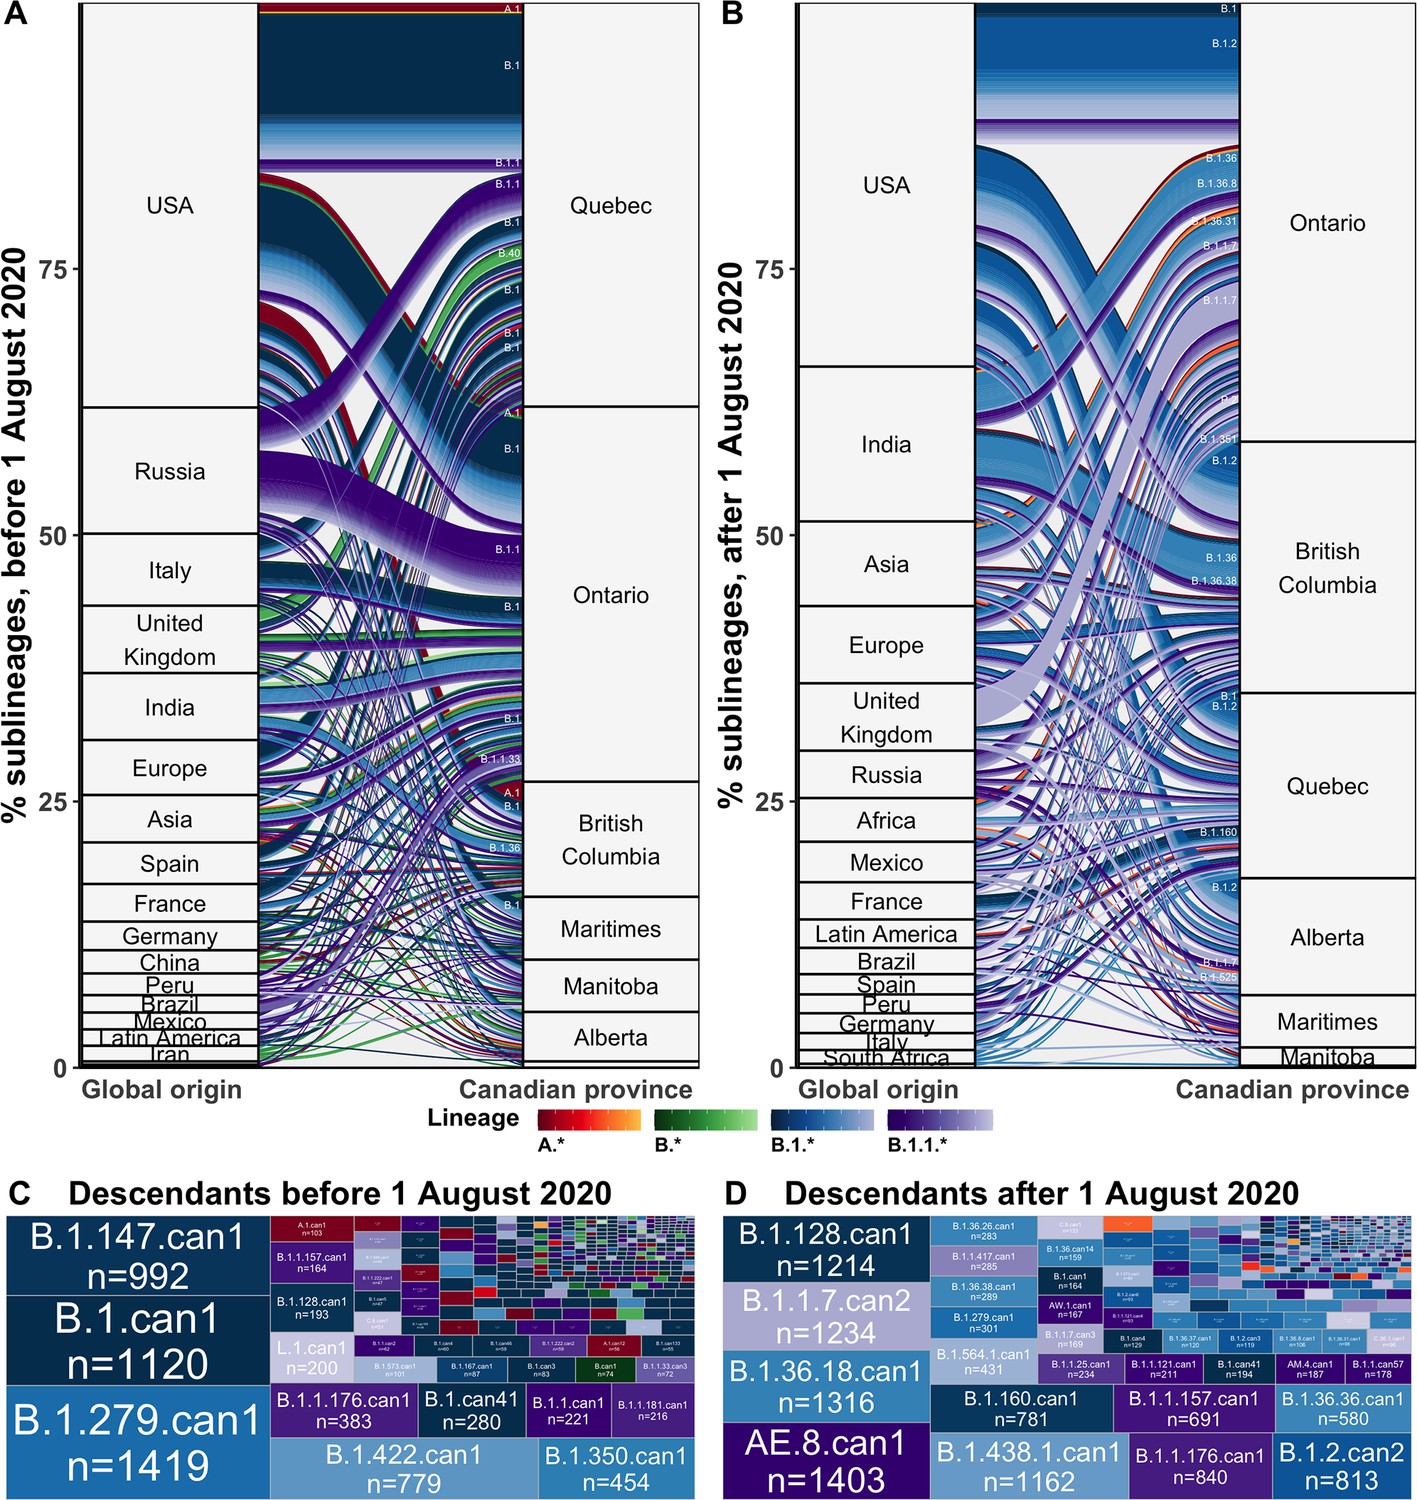
Flow of SARS-CoV-2 sublineages into Canadian provinces from global origins coloured by Pango lineage in (A) the first wave, before 1 August 2020, and (B) the second wave, from 1 August 2020 to 28 February 2021.
Locations’ relative size and lineage flows between location pairs represent the mean percent of sublineages across 10 subsamples for the 75% sampling strategy. Lineages by location pair associated with greater than 0.5% of sublineages and locations associated with more than 1% of sublineages were labelled. Sublineages’ relative sizes, based on the number of sampled unique Canadian descendants during the (C) first and (D) second wave. Canadian sublineages were named based on the predominant Pango lineage of descendants and a ‘can’ suffix with a numeric denoting their order of first Canadian sample date. Figure 3—figure supplement 1 shows the flow of singletons. Figure 3—figure supplement 2 summarizes the distribution of sublineage sizes. Figure 3—figure supplement 3 shows the distribution of all Canadian sublineages’ descendants’ sampling locations. Figure 3—figure supplement 4 stratifies second wave sublineage sizes by pre- and post-January 2021. Figure 3—figure supplement 5 stratifies sublineages’ overall size by global and Canadian descendants.
Figure 3—figure supplement 1
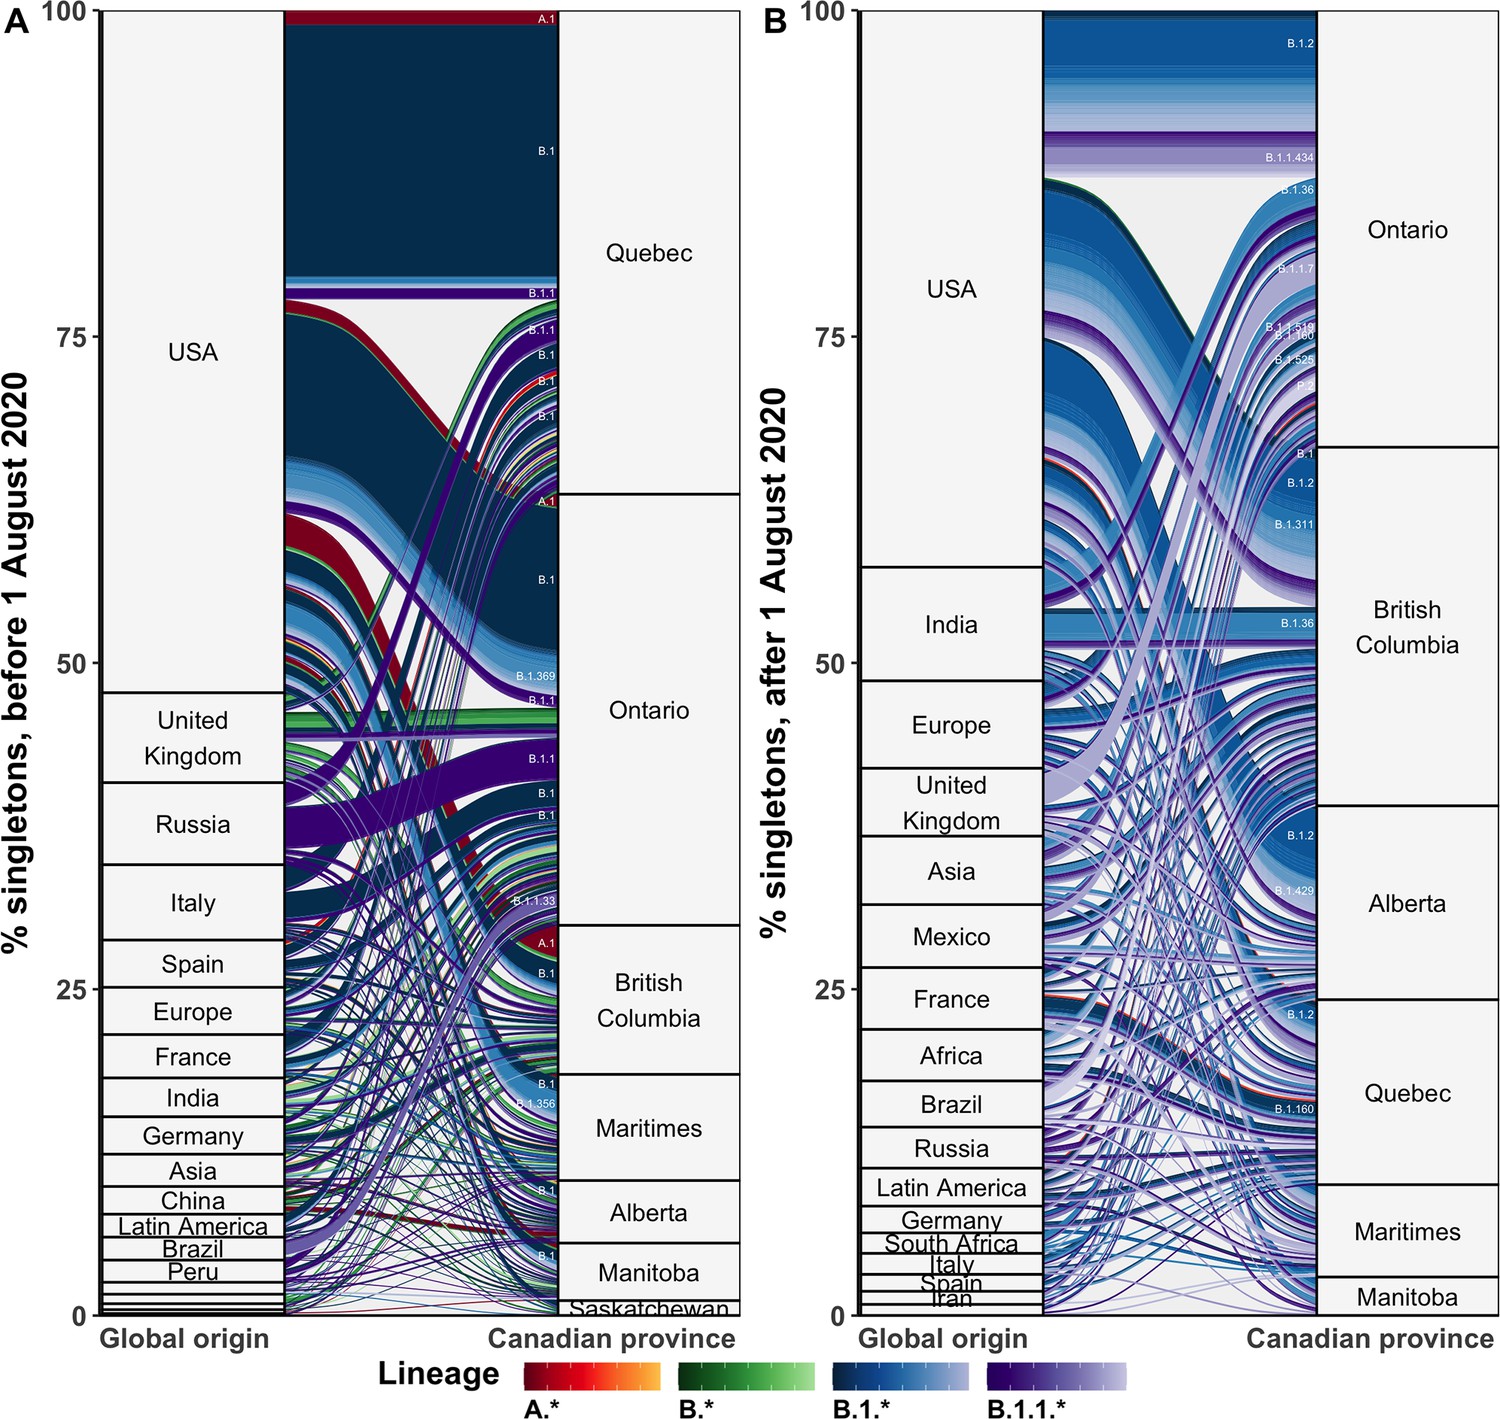
The flow of singletons from global origins to Canadian provinces by Pango lineage in the (A) first and (B) second waves.
Relative size of rectangles and flows represent the mean number of events from 10 independent subsamples using the 75% sampling strategy.
Figure 3—figure supplement 2
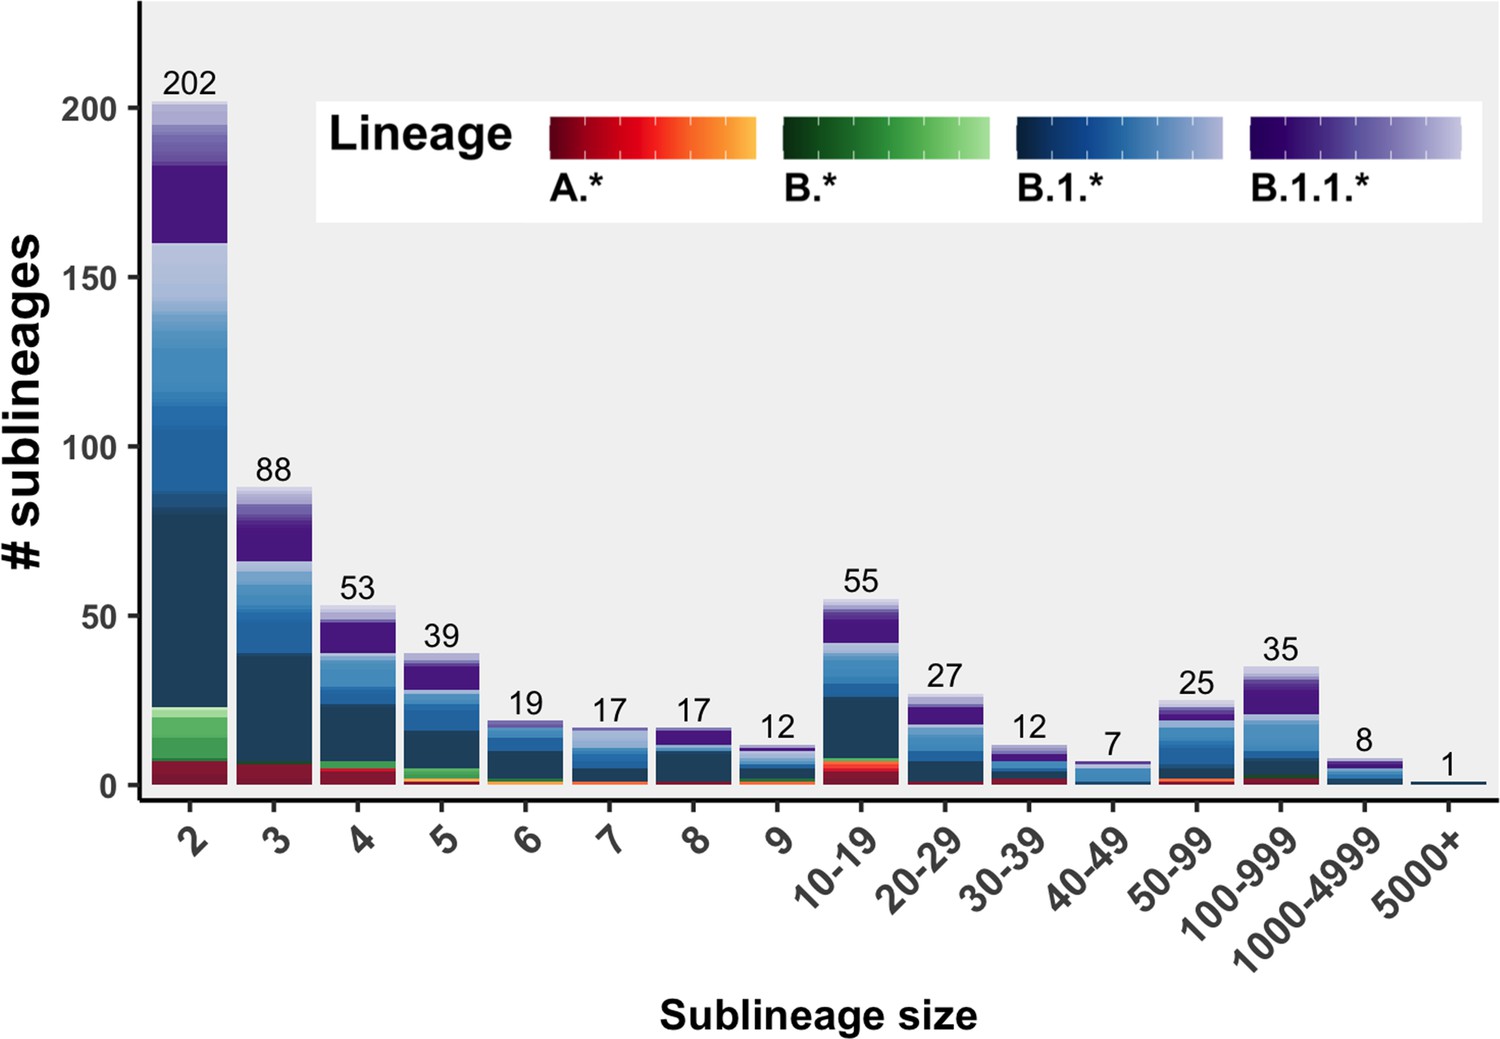
The distribution of sublineage sizes including Canadian and global descendants representing the highest likelihood bootstrap tree from the 75% Canadian sequences retained sampling strategy.
Figure 3—figure supplement 3
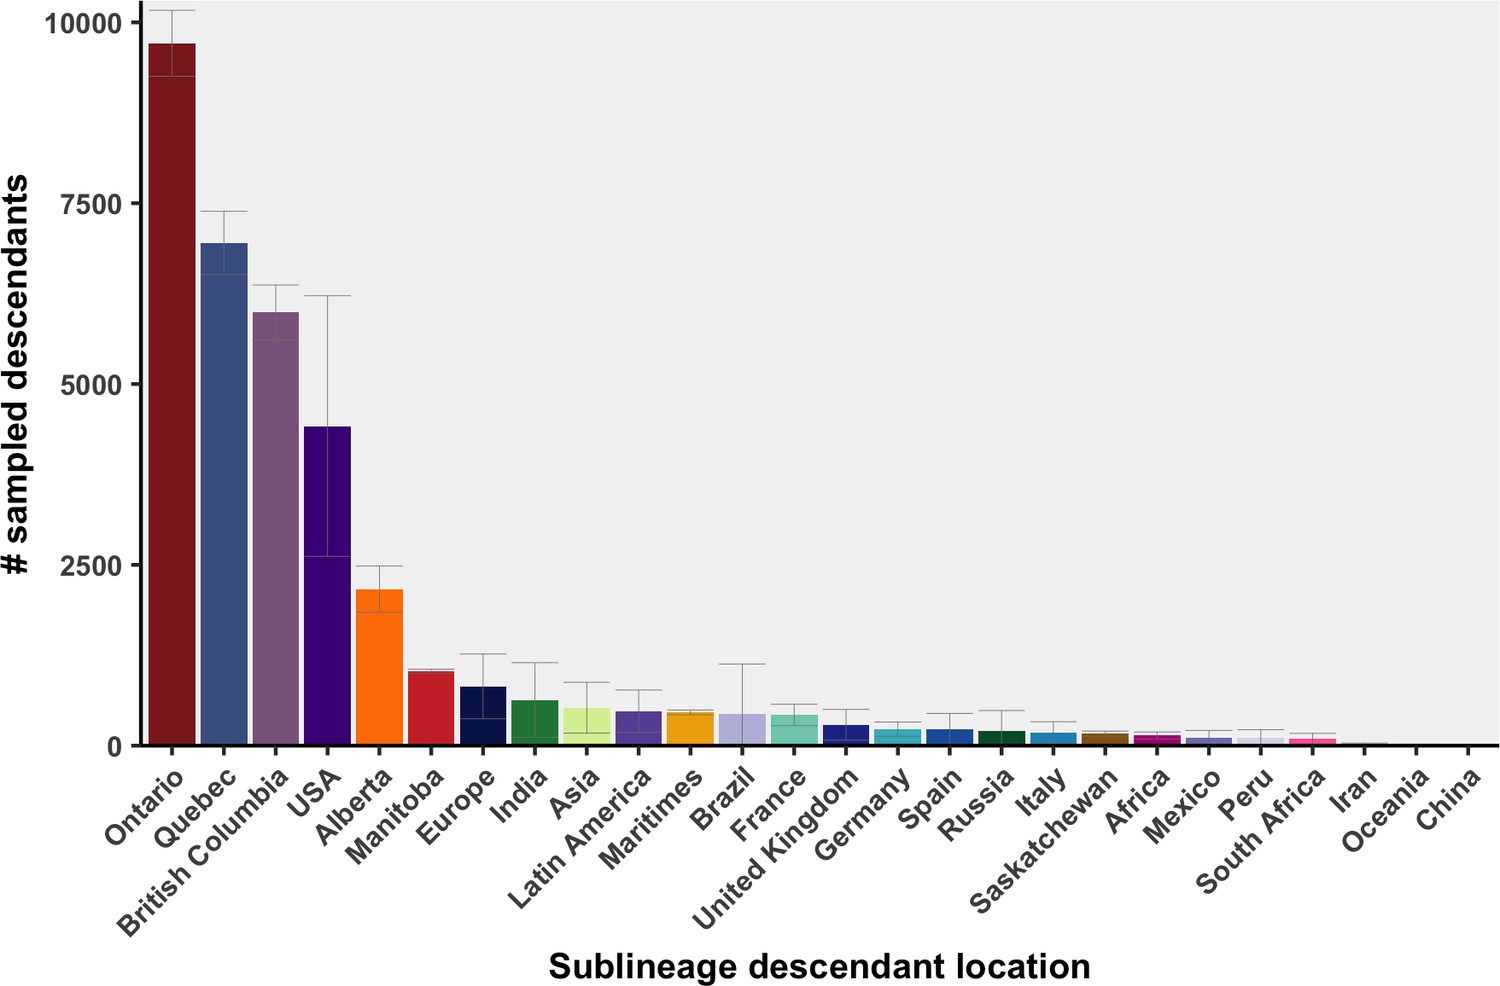
Distribution of sampling locations for descendants of Canadian SARS-CoV-2 sublineages.
Bar height represents the mean number of uniquely sampled descendants across 10 bootstraps, with 95% confidence intervals calculated using a t-distribution.
Figure 3—figure supplement 4
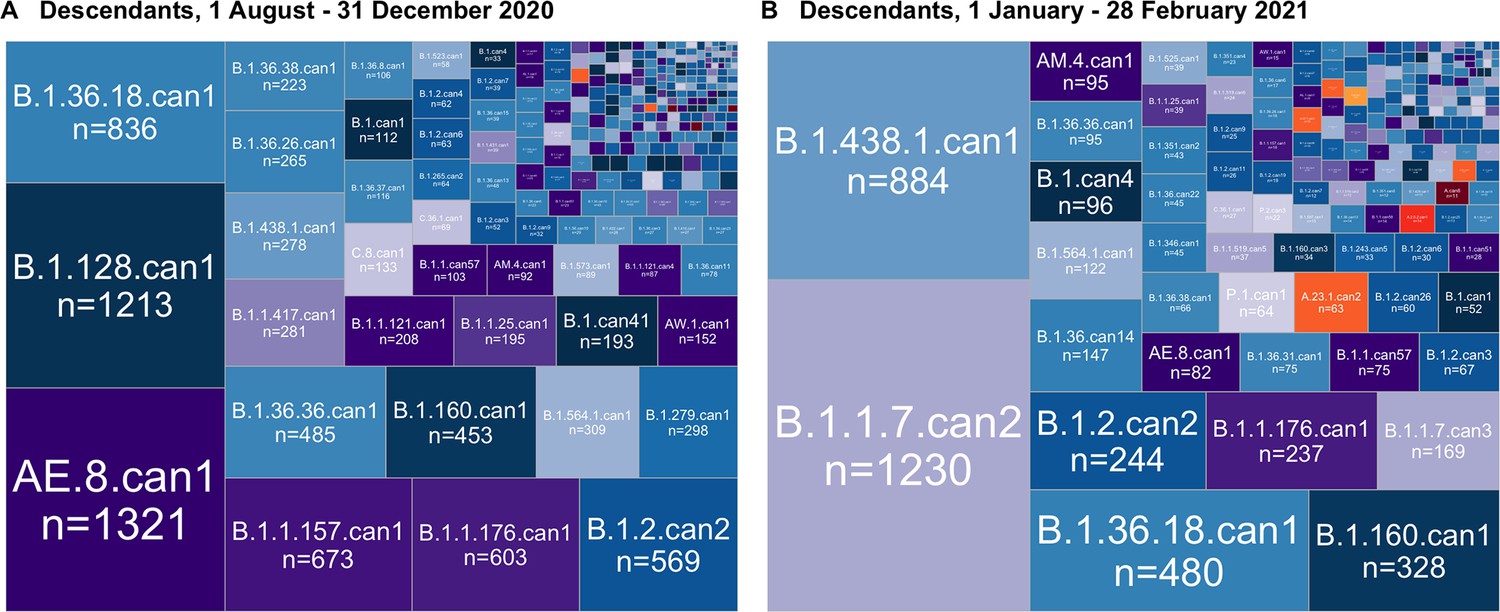
Canadian SARS-CoV-2 sublineages’ relative sizes, based on the number of sampled Canadian descendants during (A) the first half of the second wave, from 1 August to 31 December 2020, and (B) the second half of the second wave, after 1 January 2021.
Figure 3—figure supplement 5
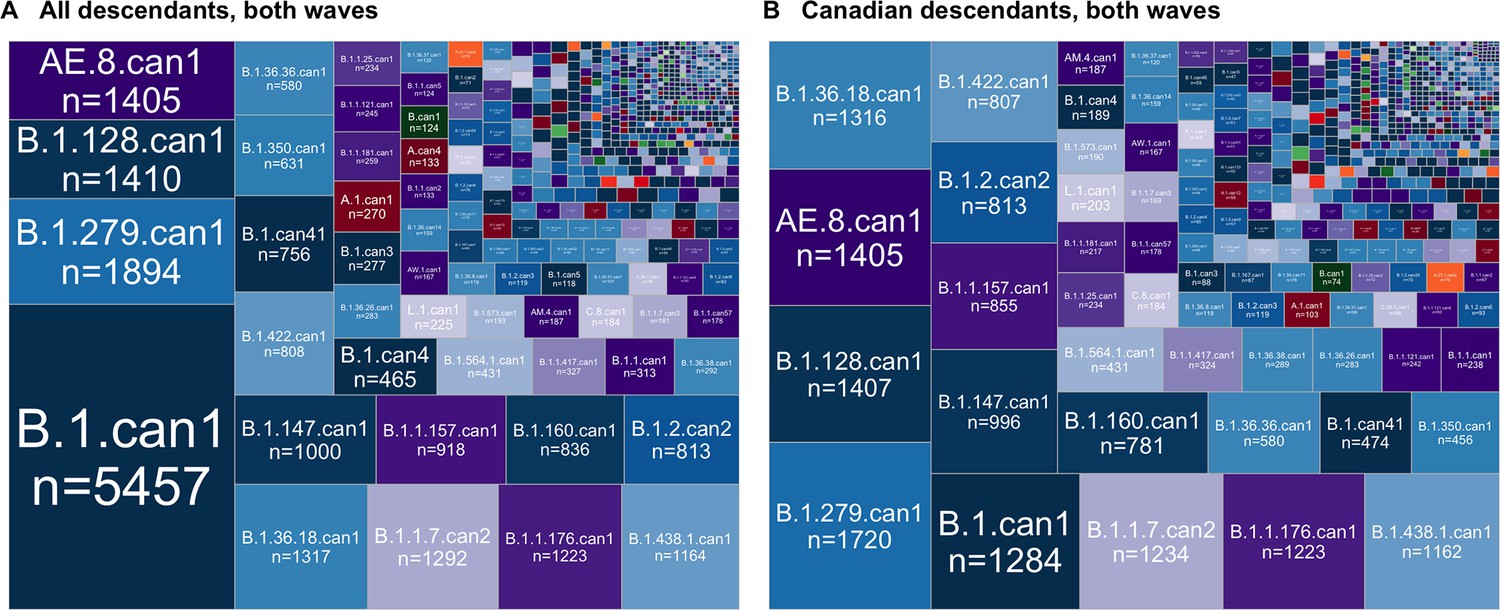
The relative sizes of Canadian SARS-CoV-2 sublineages across both waves when considering (A) all descendants, sampled globally and within Canada, and (B) only Canadian descendants.
Figure 4 with 2 supplements
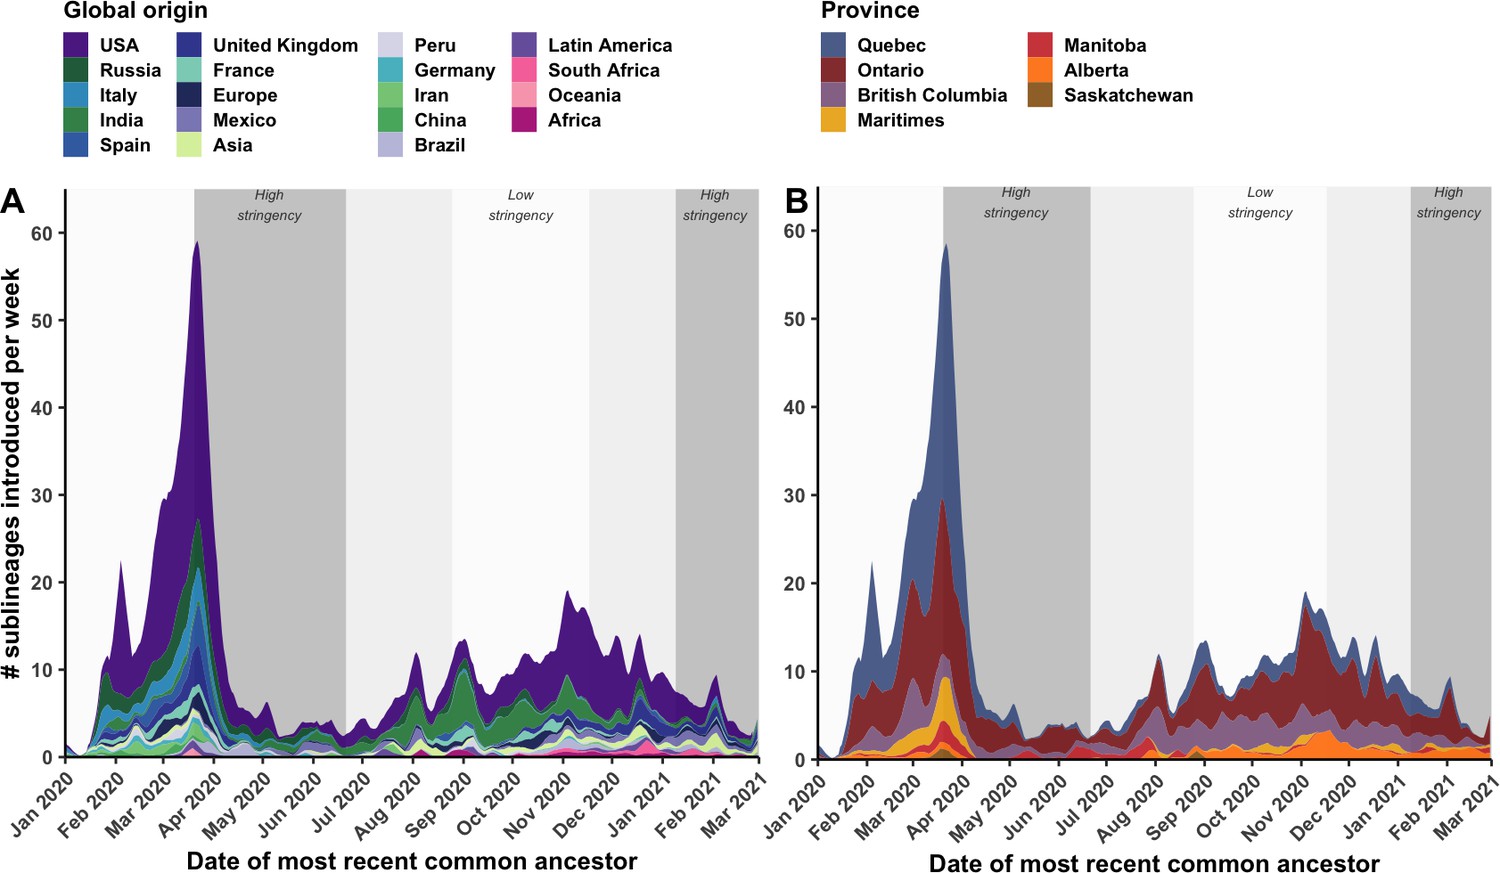
Weekly introduction rates of Canadian SARS-CoV-2 sublineages in the first two waves, in the context of changes in COVID-19 intervention stringency.
The weekly sublineage introduction rates were summarized as 7-day rolling means across bootstraps (A) by global origin and (B) by province of introduction. The background shading corresponds to periods of high and low stringency, based on Oxford COVID-19 Stringency Index. Figure 4—figure supplement 1 summarizes weekly singleton introduction rates. Figure 4—figure supplement 2 characterizes changes in sublineages’ size, detection lag, and lifespan over time.
Figure 4—figure supplement 1
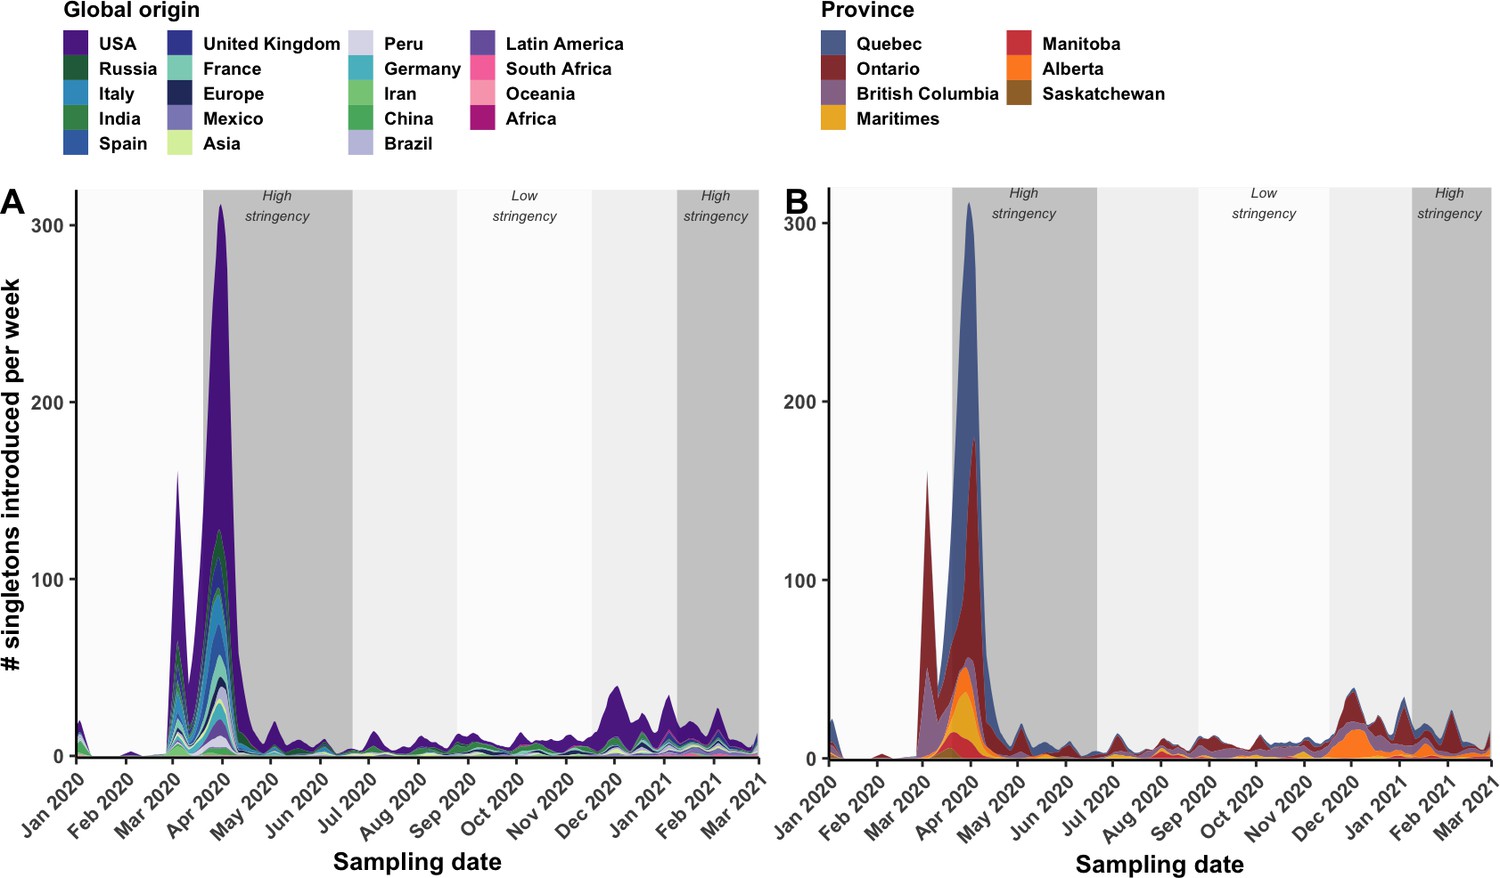
Weekly singleton introduction rates over time.
The 7-day rolling mean singletons introduced per week across bootstraps (A) by global origin or (B) by province of introduction. Singletons are Canadian sequences with inferred international parental state and no sampled descendants.
Figure 4—figure supplement 2
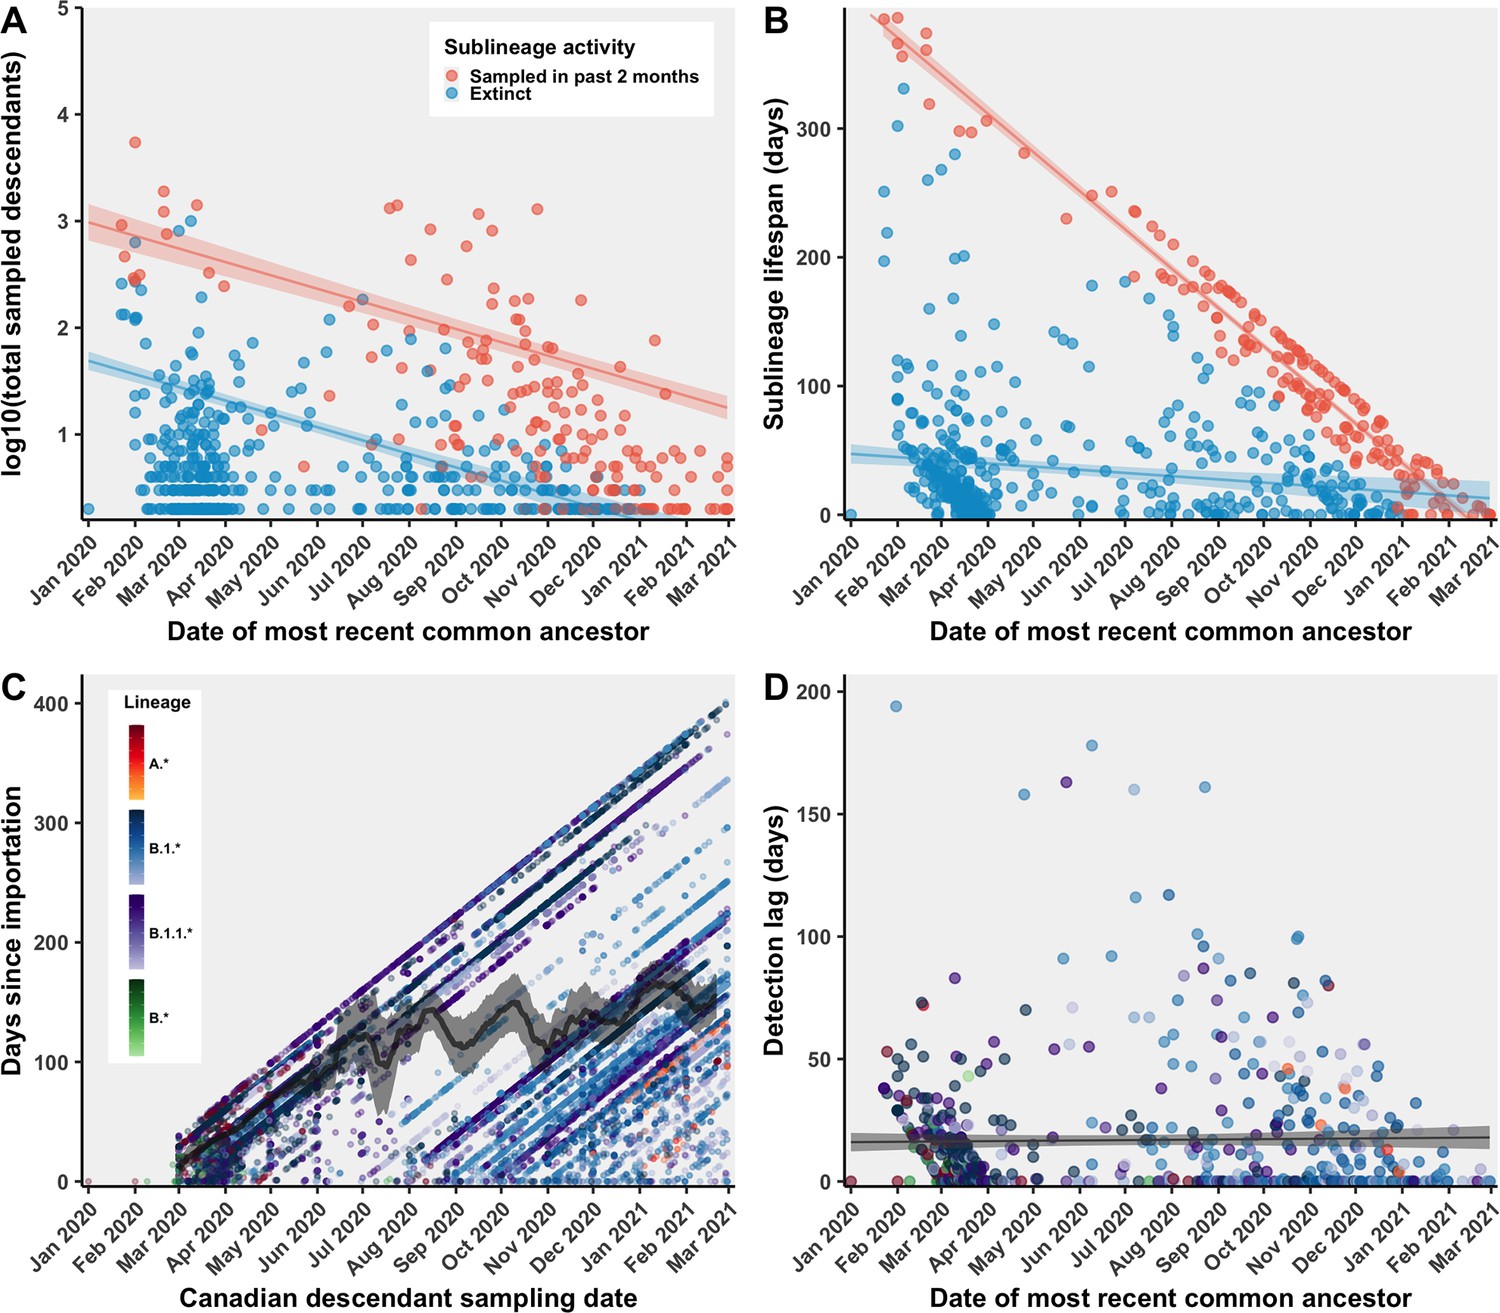
Characterization of Canadian SARS-CoV-2 sublineages over time.
(A) Negative binomial model of sublineage size (total number of unique sampled descendants) by most recent common ancestor, stratified by whether sublineages were active, that is, had any sampled Canadian sequences in the past two months, or extinct. (B) Sublineage transmission lifespan was calculated as the difference between the most recent Canadian sampling date and the time to most recent common ancestor. Sublineage lifespan was modelled by time to most recent common ancestor using multiple linear regression, stratified based on whether sublineages were sampled or extinct in the past 2 months. (C) For all sublineages’ Canadian descendants, the days since importation (difference between sampling date and date of most recent common ancestor) over time was evaluated by fitting a 14-day centred rolling mean with 95% confidence intervals (grey line). (D) Sublineage detection lag (the number of days between the first Canadian sample collection date and the date of the most recent common ancestor) was modelled over time using simple linear regression.
Figure 5 with 1 supplement
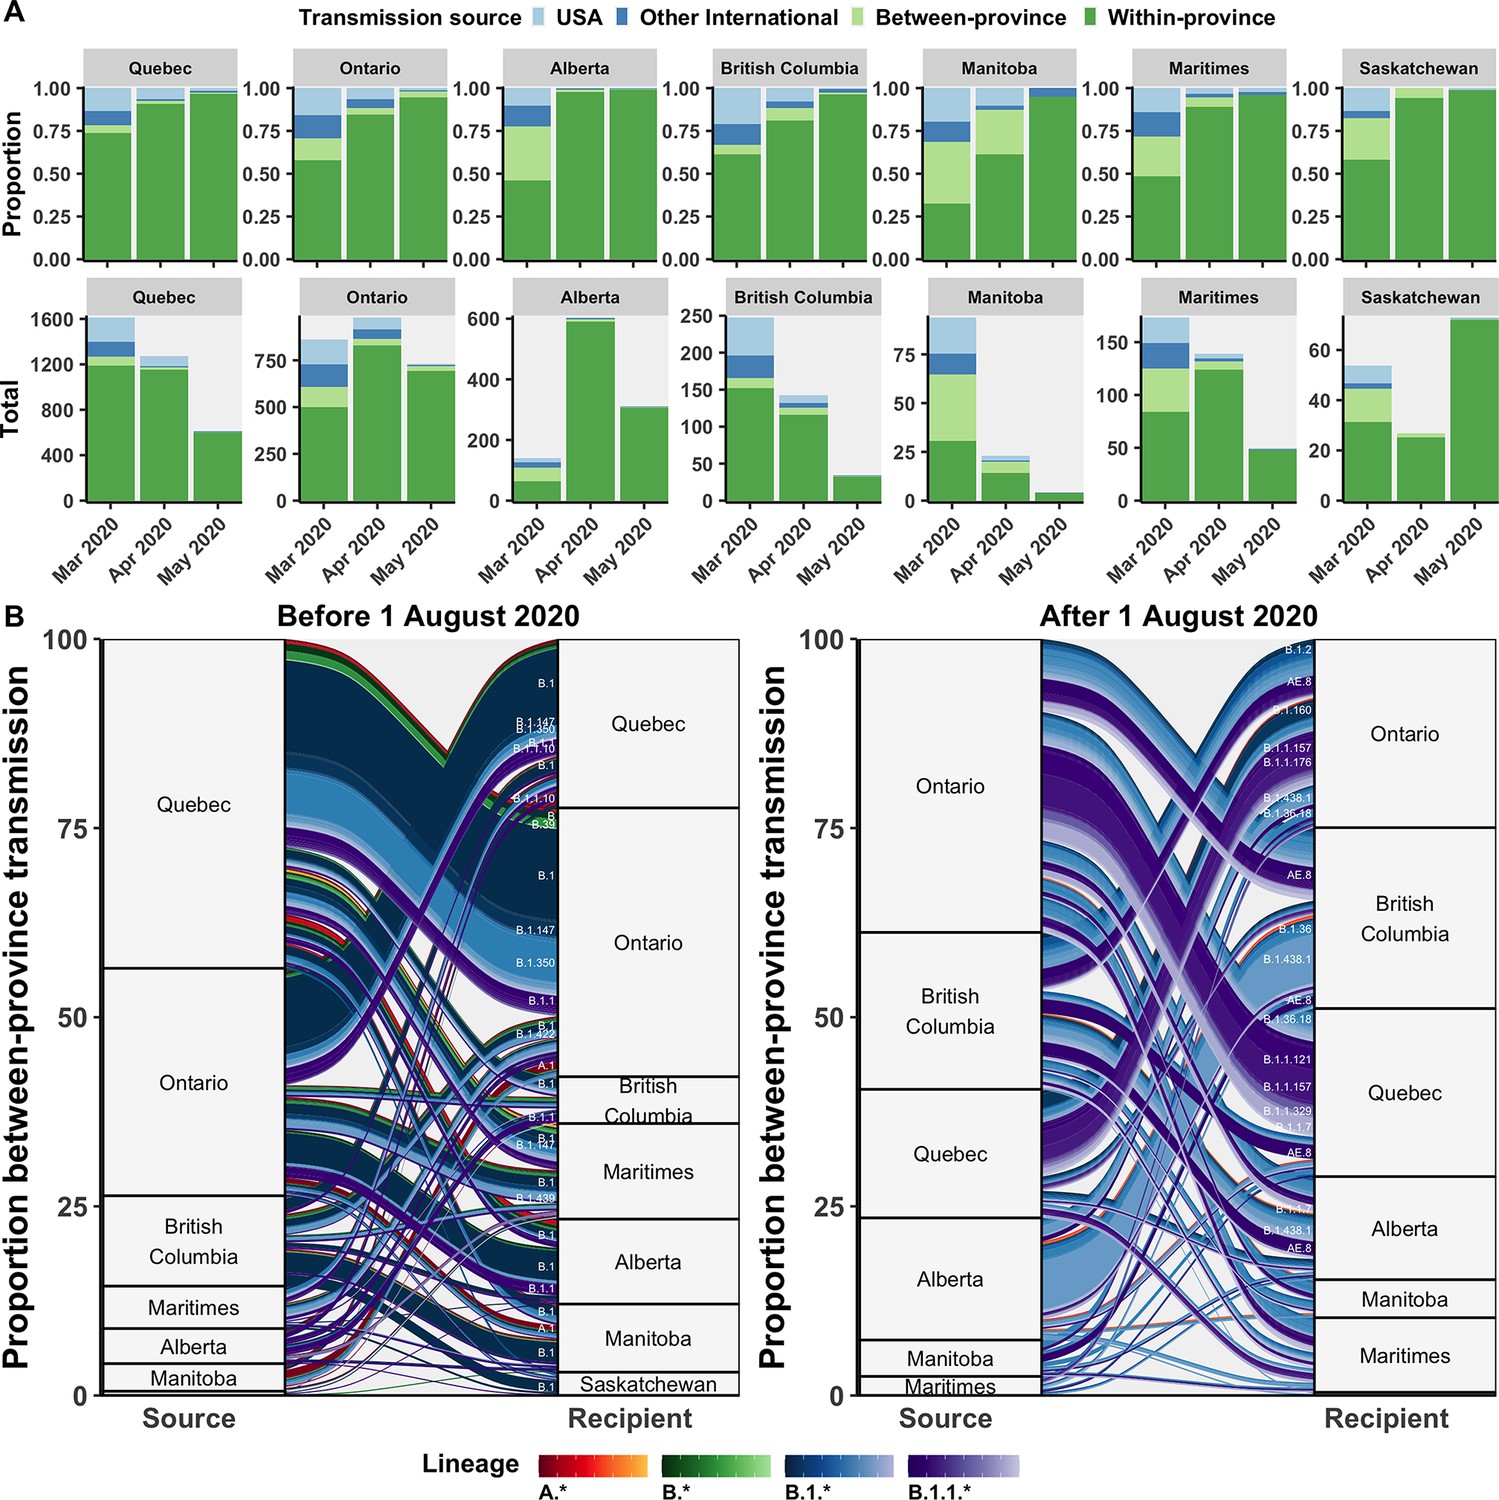
Relative contributions of international and domestic transmission sources.
(A) Proportional and total contributions of the USA, other international, between-province, and within-province transmission sources among all sampled tips by province and month between in March, April, and May 2020. (B) The proportional flow of lineages transmitted between-provinces among Canadian tips, stratified before and after August 2020. Values reflect the mean across bootstraps for the 75% subsampling strategy. Figure 5—figure supplement 1 depicts the total number of sampled transmission events with any international source across Canada in April 2020.
Figure 5—figure supplement 1
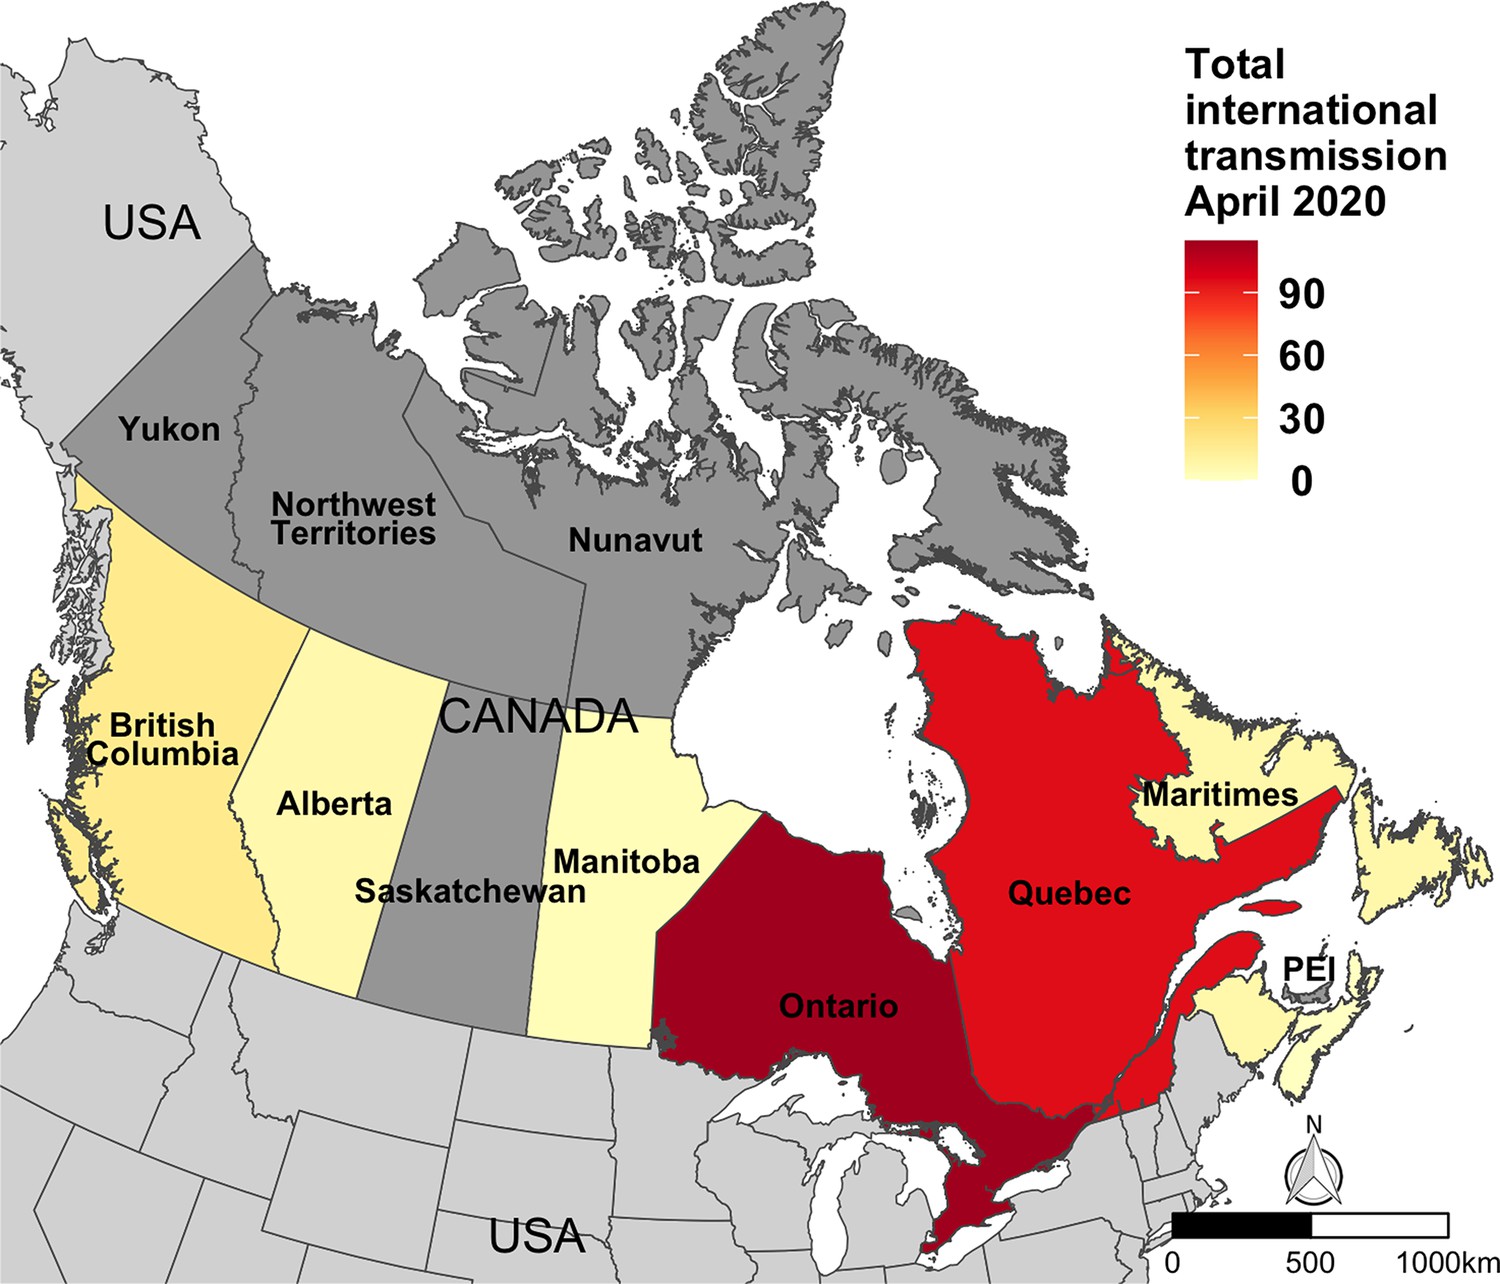
The mean number of sampled transmission events with an inferred international source across Canada in April 2020, immediately following the enactment of travel restrictions.
Nova Scotia, New Brunswick, and Newfoundland and Labrador were merged into Maritimes throughout the analysis.
Figure 6 with 5 supplements
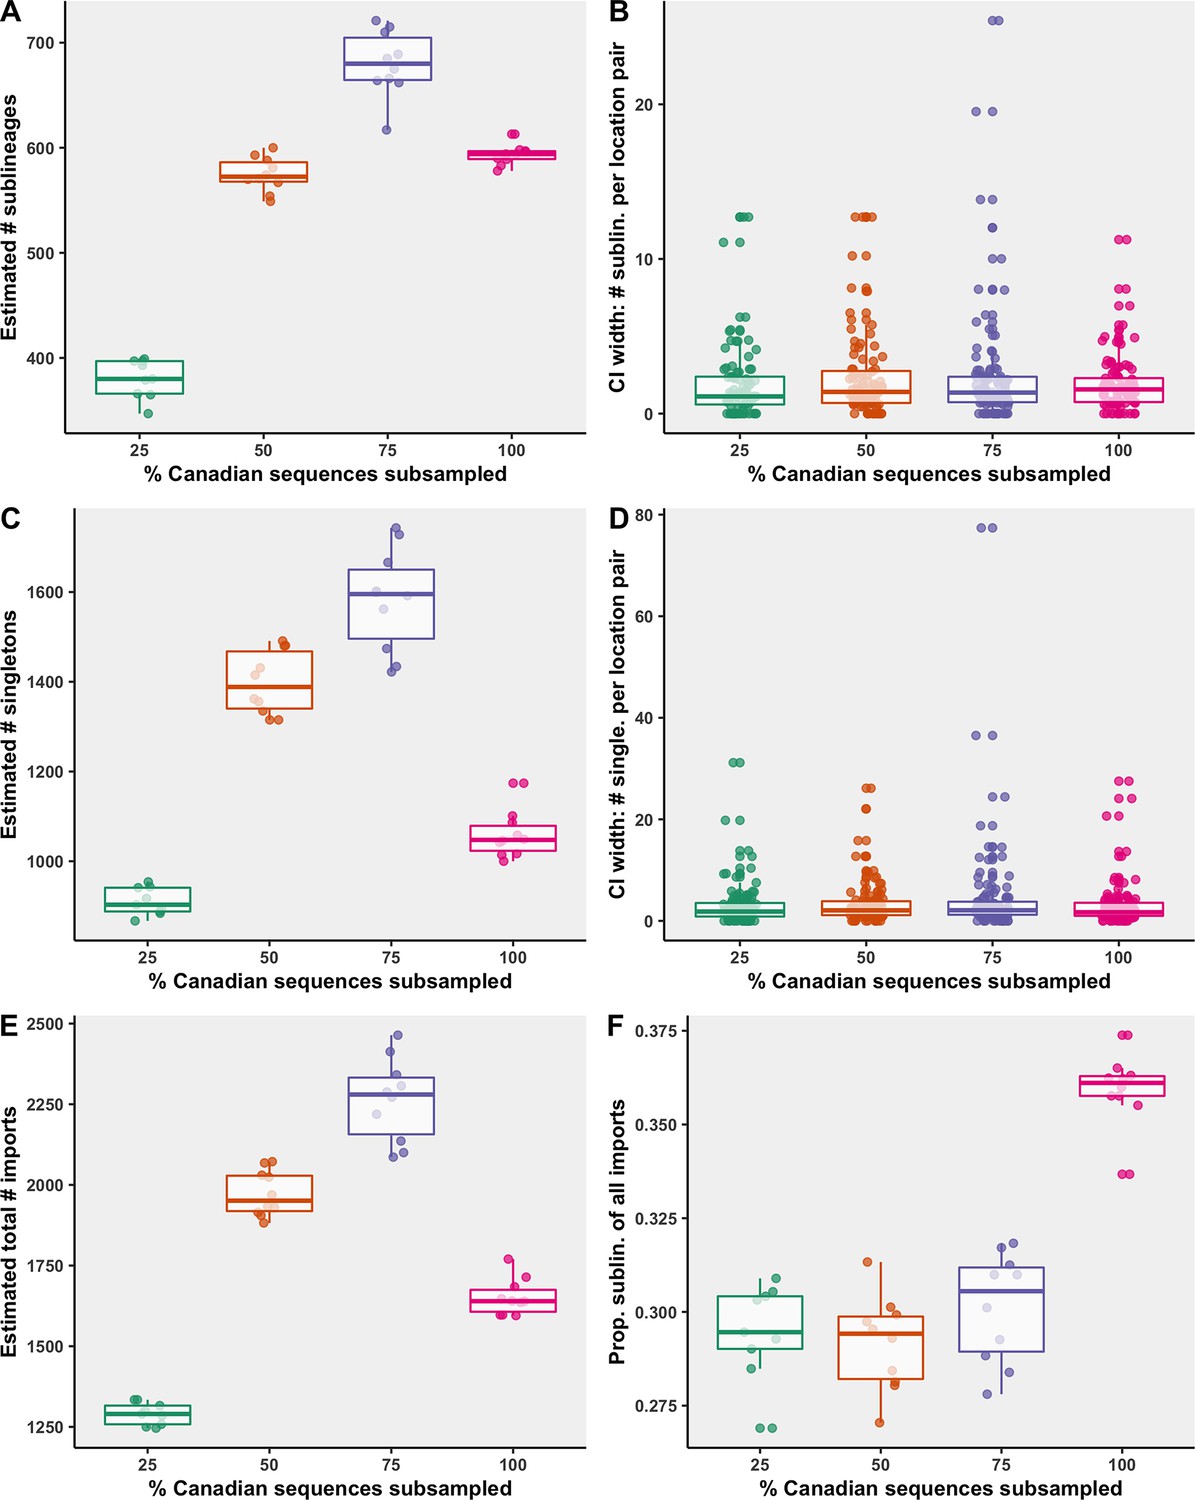
Subsampling sensitivity analysis, with 25–100% of Canadian sequences retained.
(A) The estimated number of sublineages across 10 bootstraps. (B) The distribution of 95% confidence interval widths for number of sublineages attributable to each location pair across 10 bootstraps. (C) The estimated number of singletons identified across 10 bootstraps for each subsampling strategy. (D) The distribution of 95% confidence interval widths for number of singletons attributable to each location pair across 10 bootstraps. (E) The estimated total number of importations, that is, the sum of sublineages and singletons, and (F) the proportion of sublineages among all importations. Subsampling strategies are further compared in regard to the relationship between sequences and cases by strategy in Figure 6—figure supplement 1; subsampled sequence densities in Figure 6—figure supplement 2; mean proportion of importations resulting in a sublineage by month and region in Figure 6—figure supplement 3; relative sublineage contributions in Figure 6—figure supplement 4; and finally sublineage introduction rates in Figure 6—figure supplement 5.
Figure 6—figure supplement 1
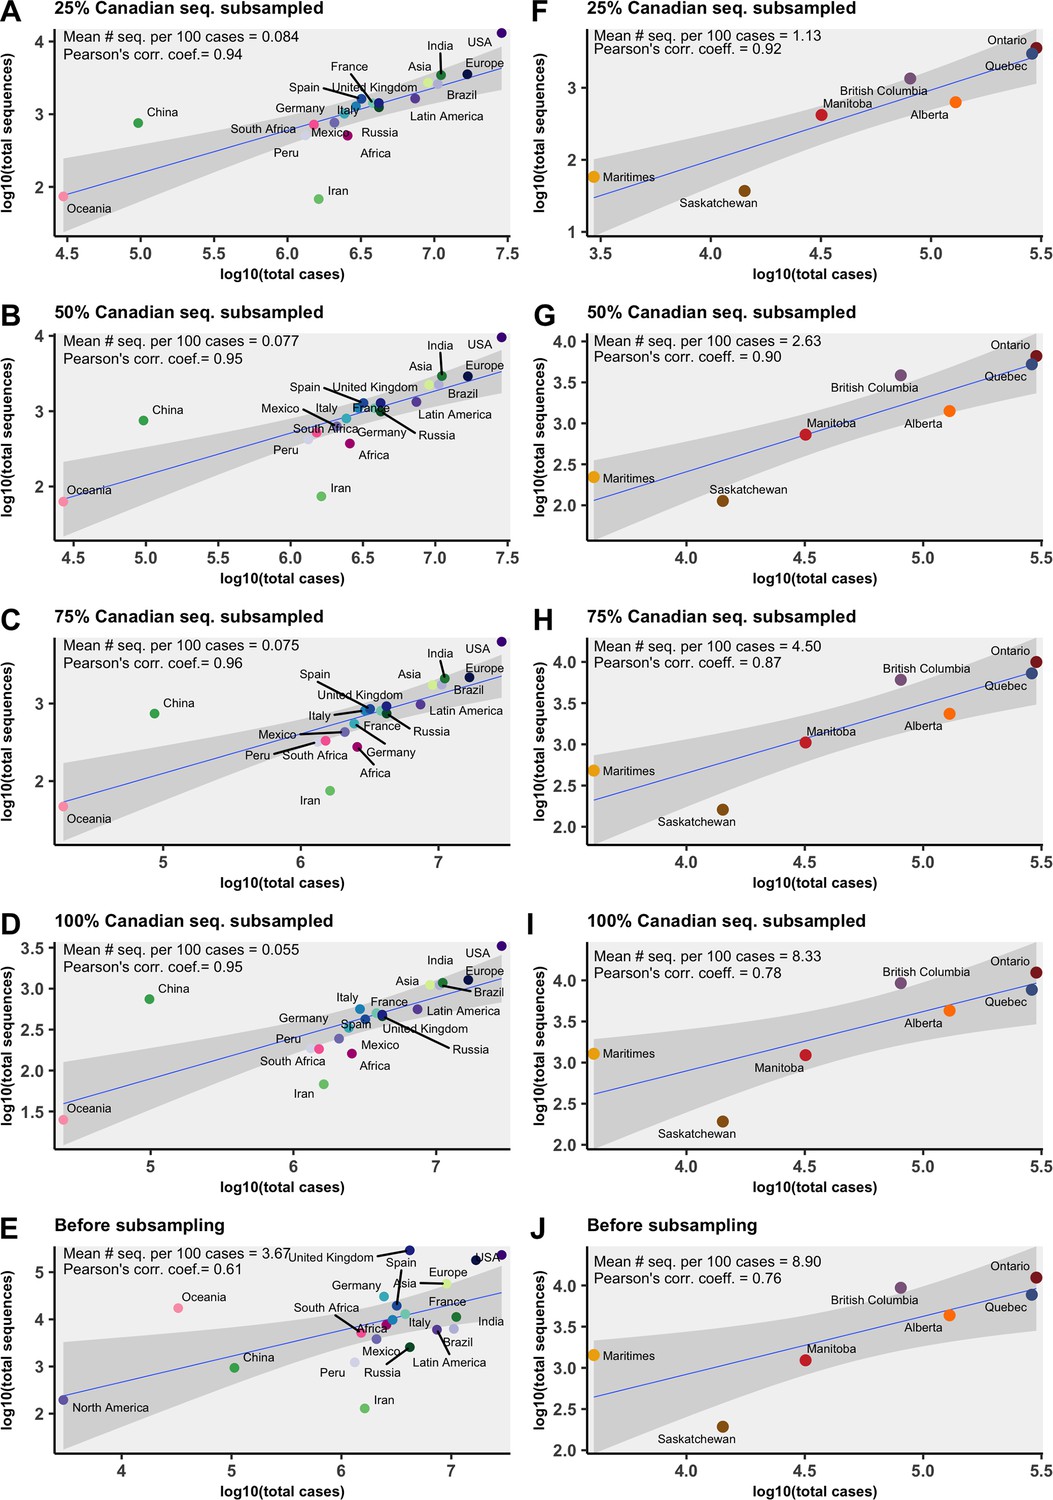
The relationship between total clean sequences available and total cases across global regions (A–E) and Canadian provinces (F–J) for all months in the study period for each subsampling strategy and before subsampling.
The mean number of sequences per 100 cases across all months is reported, as well as the Pearson’s correlation coefficient of non-log-transformed values. Subsampled data shown excludes temporal outliers.
Figure 6—figure supplement 2
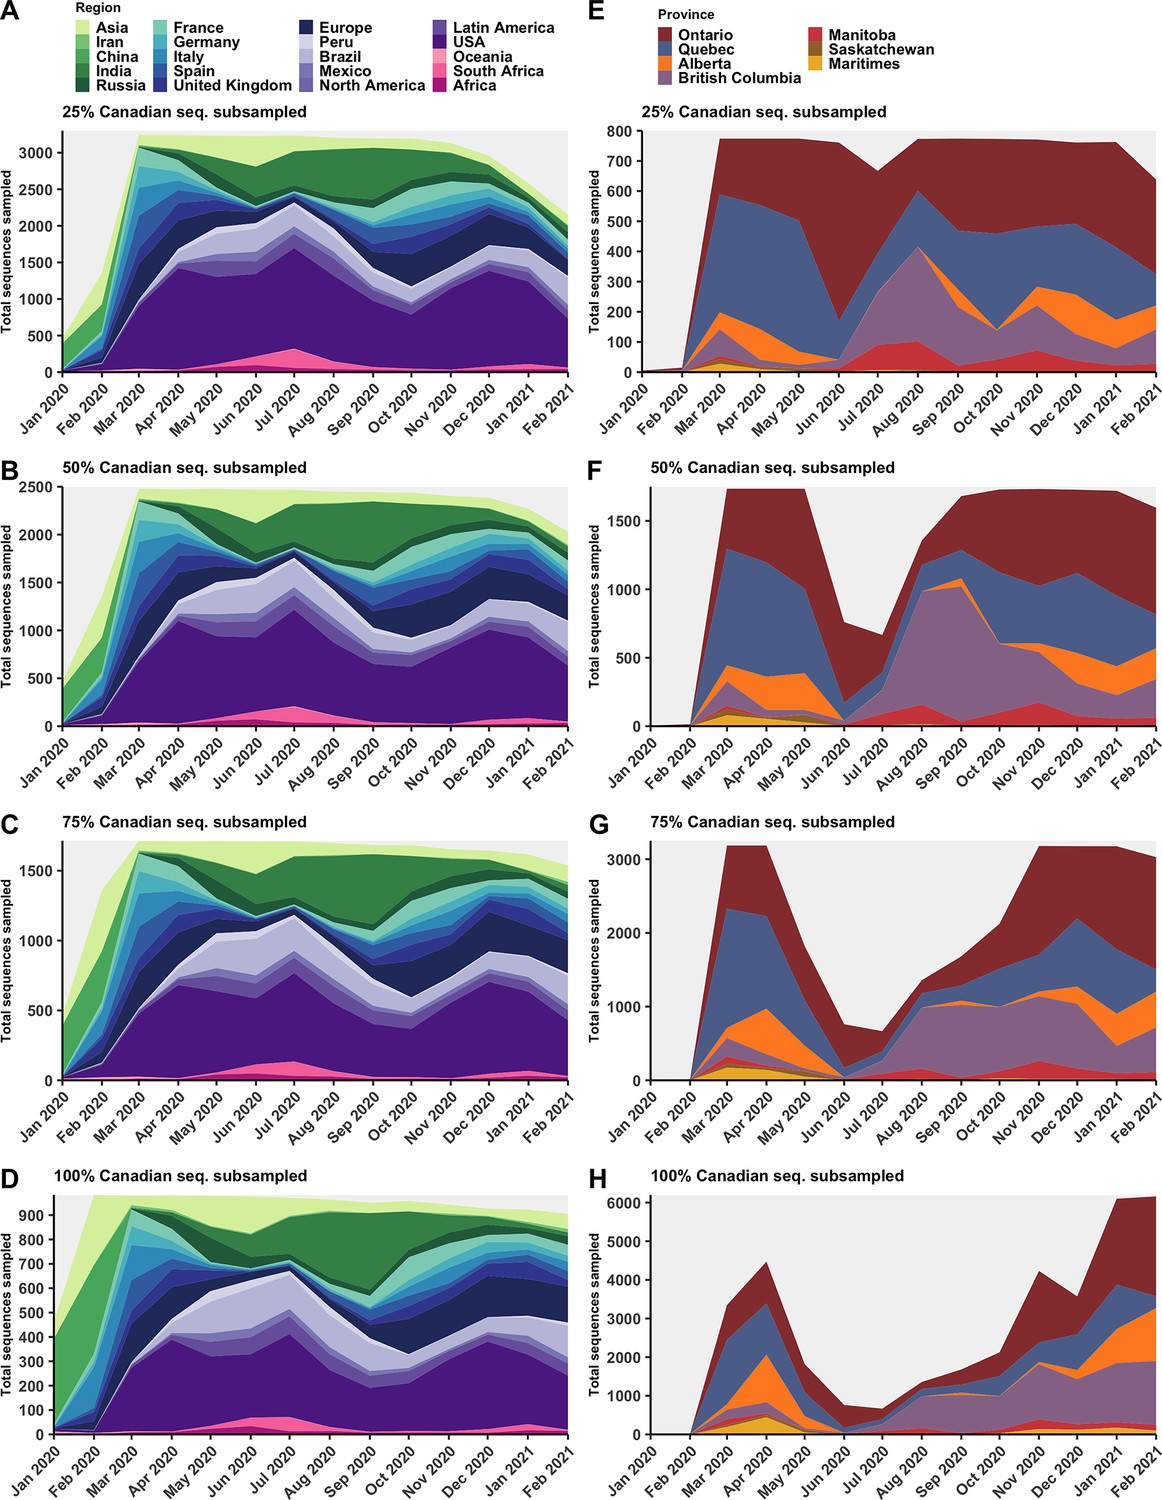
Subsampled sequence densities for global regions (A–D) and Canadian provinces (E–H) with 25–100% of Canadian available sequences retained.
Figure 6—figure supplement 3
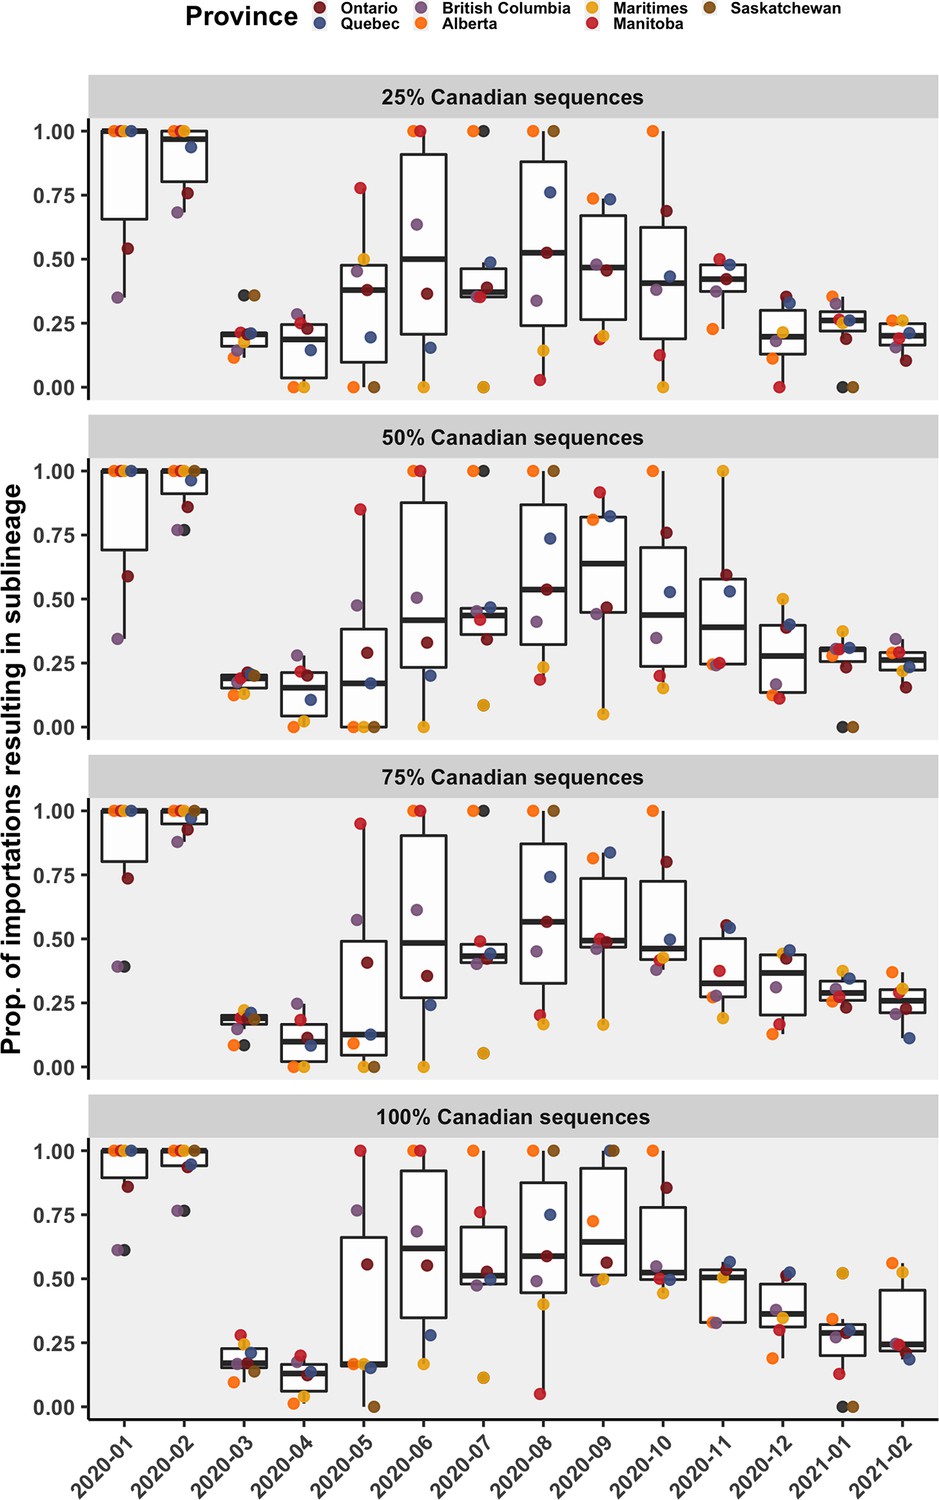
The mean proportion of importations resulting in a sublineage (versus a singleton), by month, province of introduction, and subsampling strategy.
Figure 6—figure supplement 4
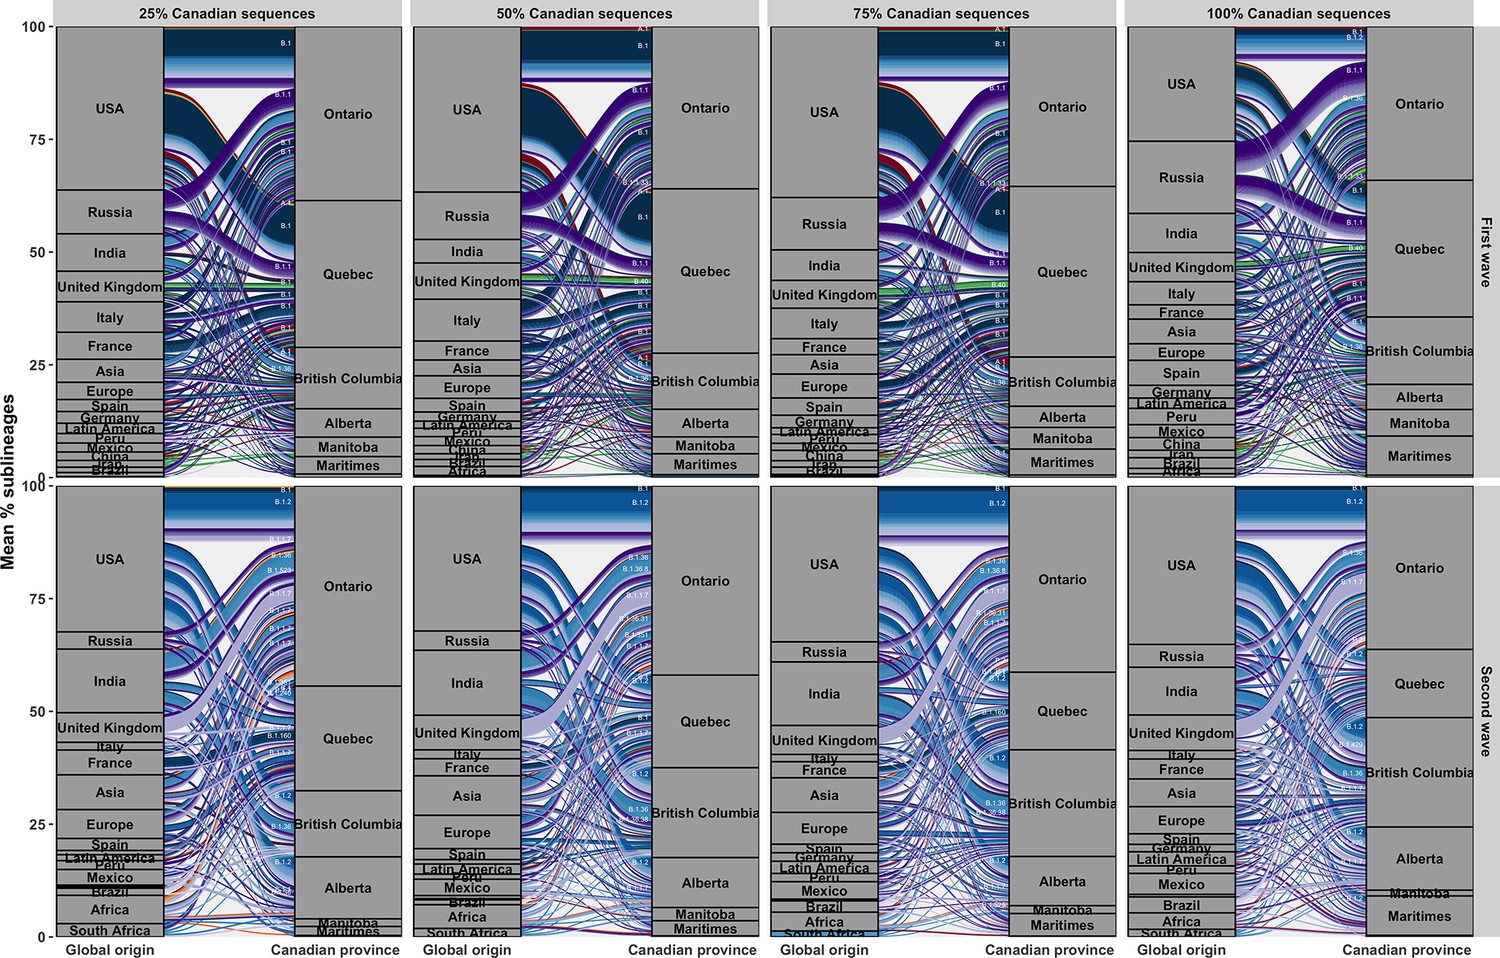
Comparative alluvial plots across subsampling strategies with 25–100% of Canadian sequences retained in the first and second waves (top and bottom rows).
Flow sizes represent the mean percent of sublineages associated with each location-pair.
Figure 6—figure supplement 5
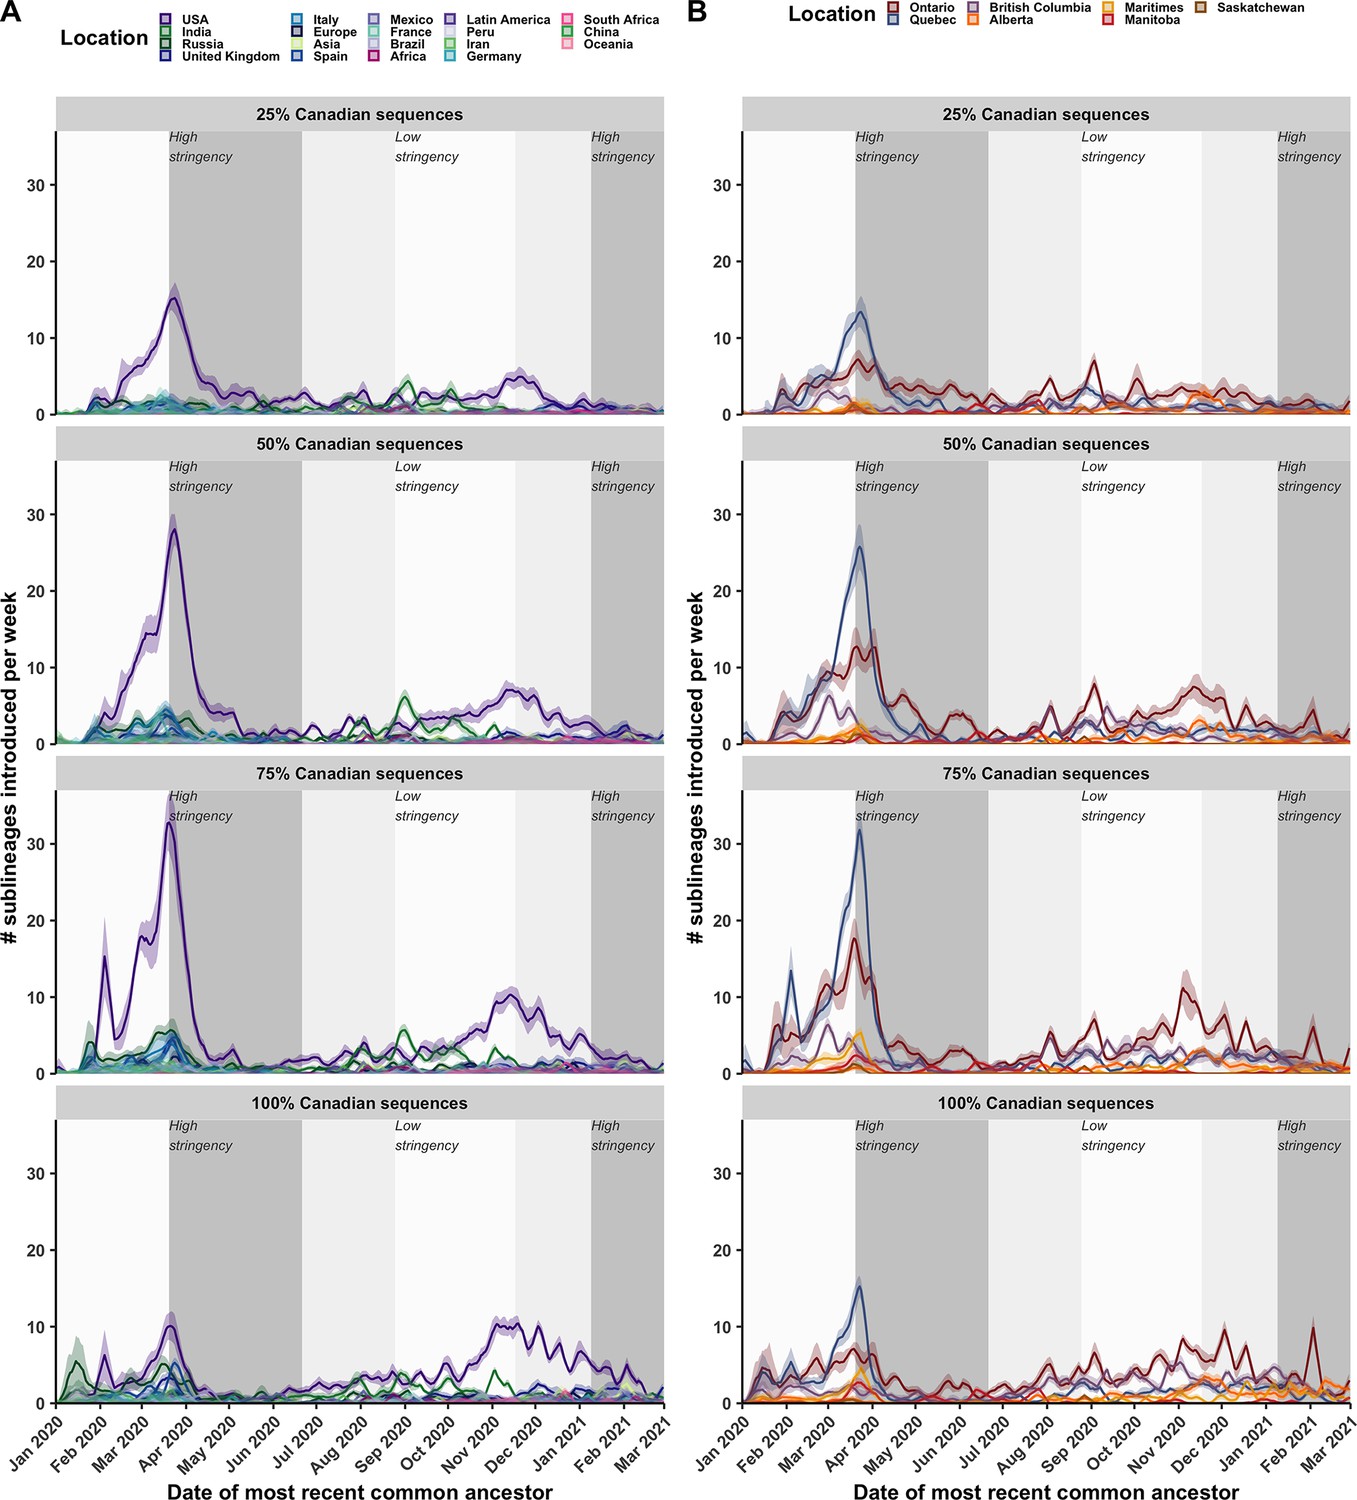
A comparison of the rolling sublineages introduced per week across subsampling strategies.
Sublineages introduced (A) by origin, (B) by province of introduction per week. Dashed lines represent the maximum stringency and reduction in stringency, respectively, of COVID-19 non-pharmaceutical interventions including travel restrictions. Mean estimates shown as non-stacked densities, with 95% confidence intervals as overlaid ribbons.
Additional files
-
Supplementary file 1
An acknowledgment of contributing laboratories who generated and uploaded viral genetic sequences and metadata to Global Initiative on Sharing All Influenza Data (GISAID).
- https://cdn.elifesciences.org/articles/73896/elife-73896-supp1-v1.csv
-
Supplementary file 2
Canadian COVID-19 Genomics Network (CanCOGen) consortium membership.
- https://cdn.elifesciences.org/articles/73896/elife-73896-supp2-v1.pdf
-
Supplementary file 3
Supplemental tables from subsampling sensitivity analysis.
- https://cdn.elifesciences.org/articles/73896/elife-73896-supp3-v1.pdf
-
Transparent reporting form
- https://cdn.elifesciences.org/articles/73896/elife-73896-transrepform1-v1.docx
Download links
A two-part list of links to download the article, or parts of the article, in various formats.
Downloads (link to download the article as PDF)
Open citations (links to open the citations from this article in various online reference manager services)
Cite this article (links to download the citations from this article in formats compatible with various reference manager tools)
Genomic epidemiology of the first two waves of SARS-CoV-2 in Canada
eLife 11:e73896.
https://doi.org/10.7554/eLife.73896


