Sigma oscillations protect or reinstate motor memory depending on their temporal coordination with slow waves
- Department of Movement Sciences, Movement Control and Neuroplasticity Research Group, Belgium
- LBI - KU Leuven Brain Institute, KU Leuven, Belgium
- Department of Health and Kinesiology, College of Health, University of Utah, United States
- Center for Advanced Research in Sleep Medicine, Centre Intégré Universitaire de Santé et de Services Sociaux du Nord-de-l'Ile de Montréal, Canada
- McConnell Brain Imaging Centre, Department of Neurology and Neurosurgery, Montreal Neurological Institute, McGill University, Canada
- Department of Psychology, Concordia University, Canada
- Department of Psychology, Université de Montréal, Canada
Figures
Figure 1
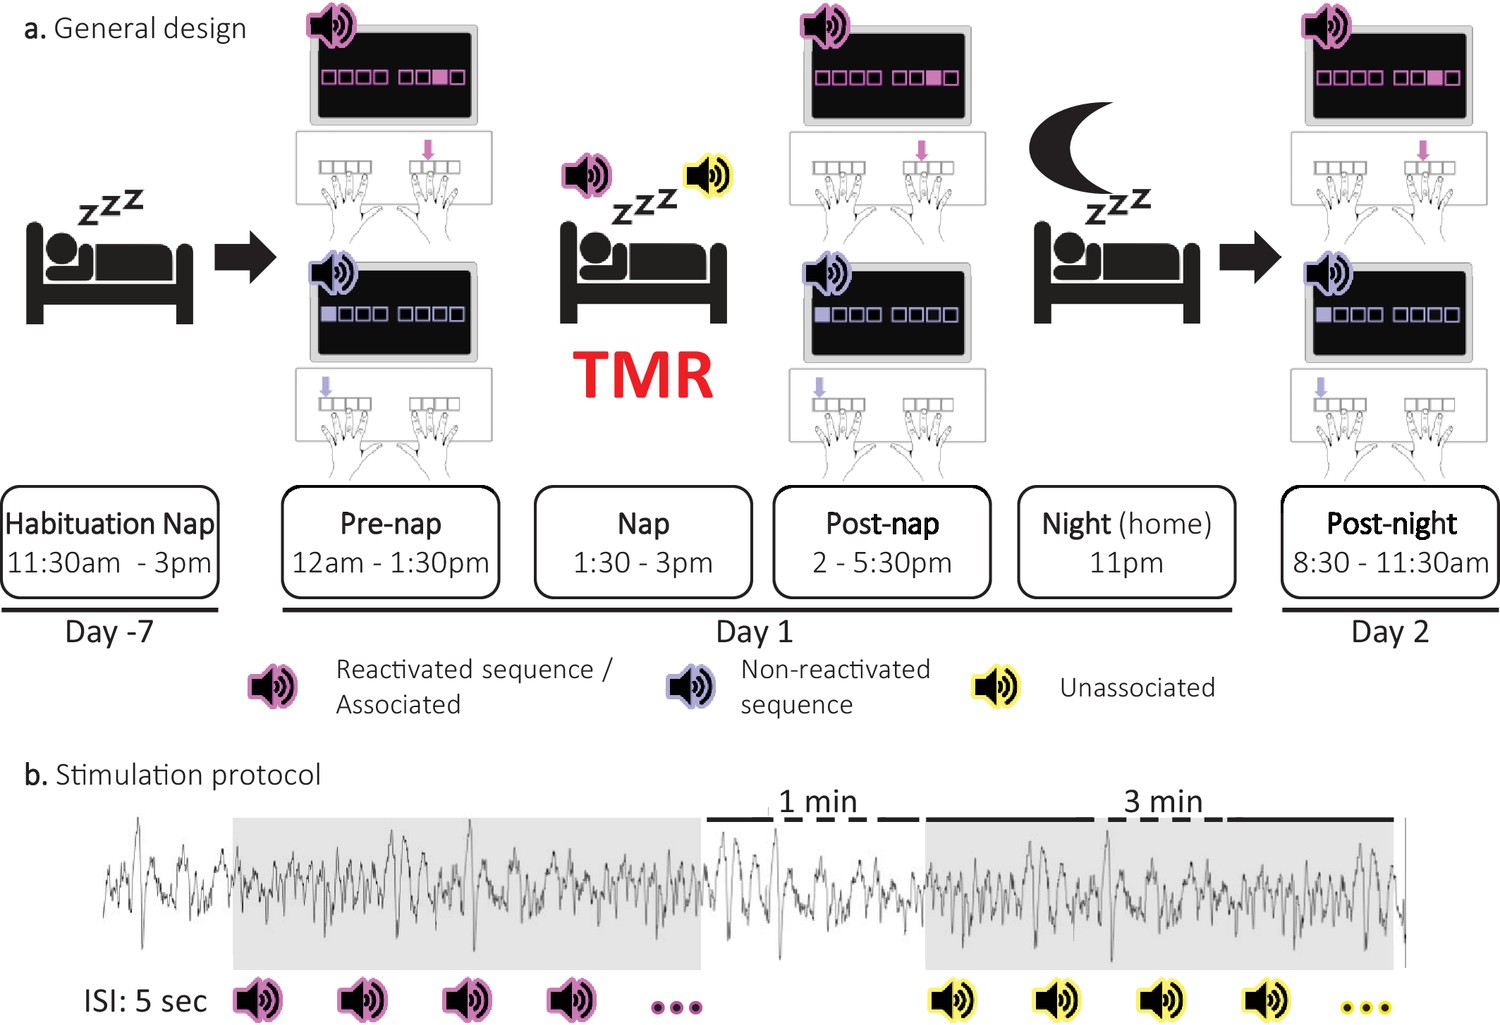
Experimental protocol.
(a) General design. Following a habituation nap that was completed approximately one week prior to the experiment, participants underwent a pre-nap motor task session, a 90 minute nap episode monitored with polysomnography during which targeted memory reactivation (TMR) was applied and a post-nap retest session. Participants returned to the lab the following morning to complete an overnight retest (post-night). During the motor task, two movement sequences were learned simultaneously and were cued by two different auditory tones. For each movement sequence, the respective auditory tone was presented prior to each sequence execution (i.e. one tone per sequence). One of these specific sounds was replayed during the subsequent sleep episode (Reactivated) and the other one was not (Non-reactivated). During the NREM 2–3 stages of the post-learning nap, two different sounds were presented. One was the sound associated (Associated) to one of the previously learned sequences, that is to the reactivated sequence, and one was novel, that is not associated to any learned material (Unassociated). (b) Stimulation protocol. Stimuli were presented during three-minute stimulation intervals of each cue type alternating with a silent 1 minute period (rest intervals). The inter-stimulus interval (ISI) was of 5 sec. The stimulation was manually stopped when the experimenter detected REM sleep, NREM1 or wakefulness.
Figure 2 with 2 supplements
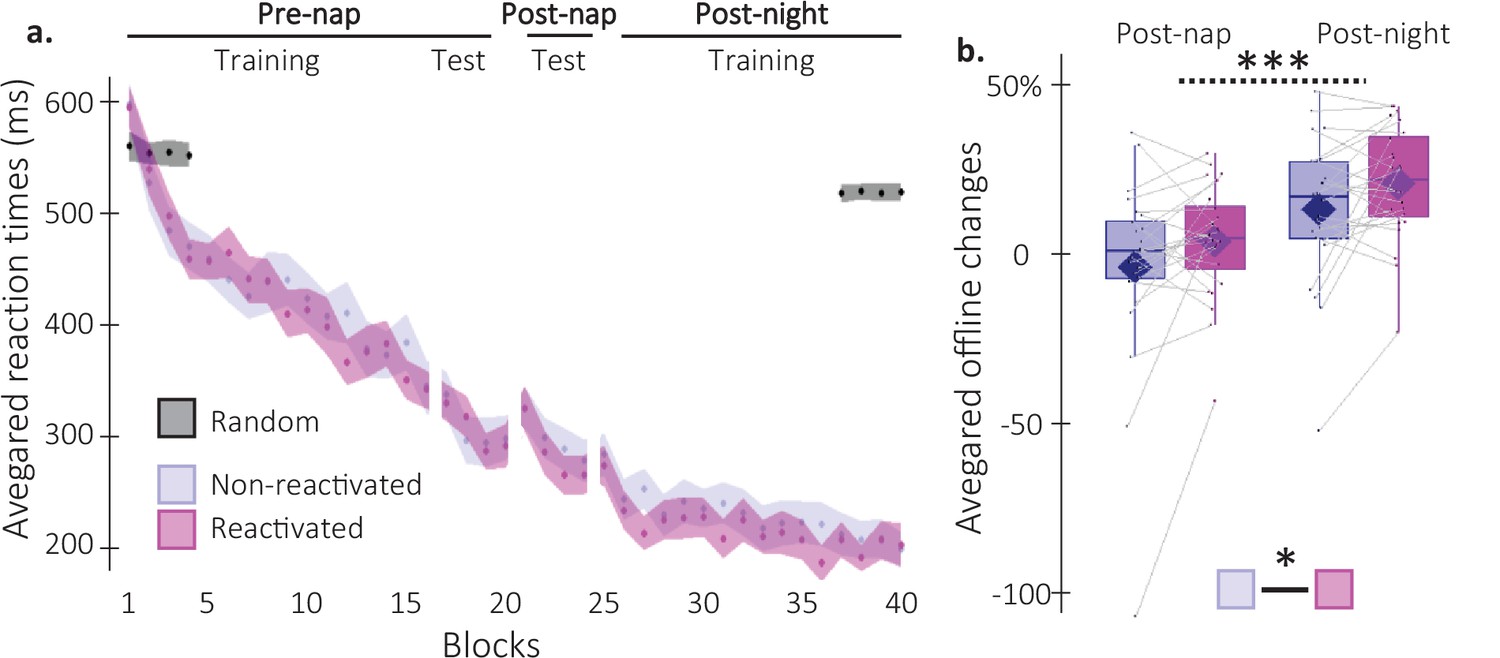
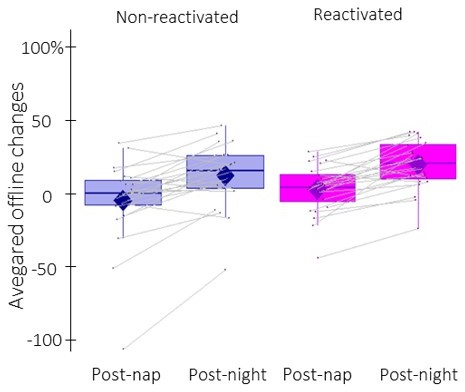
Behavioral results.
(a) Performance speed (N = 24; mean reaction time in ms) across participants plotted as a function of blocks of practice during the pre- and post-nap sessions (+/-standard error in shaded regions) for the reactivated (magenta) and the non-reactivated (blue) sequences and for the random SRTT (Black overlay). (b) Offline changes in performance speed (N = 24; % of change) averaged across participants (box: median (horizontal bar), mean (diamond) and first(third) as lower(upper) limits; whiskers: 1.5 x InterQuartile Range (IQR)) for post-nap and post-night time-points and for reactivated (magenta) and non-reactivated (blue) sequences. Using a repeated-measure ANOVA, the results highlighted a main effect of Time-point (***: p-value <0.001) and a main effect of Condition (*: p-value <0.05). Note that the main effect of condition is marginally significant when excluding the extreme participant (p=0.077).
Figure 2—figure supplement 1
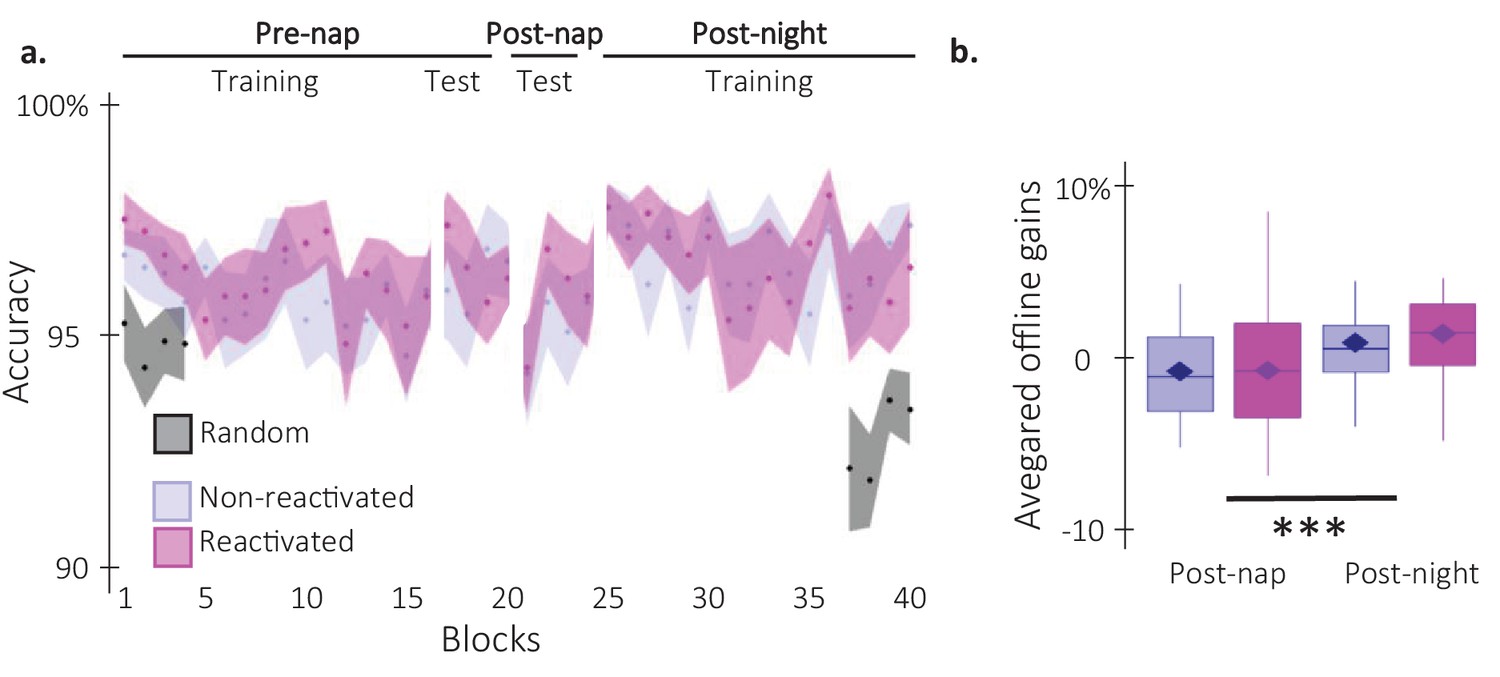
Behavioral results on performance accuracy.
(a) Performance accuracy (N = 24; mean percentage of correct responses) across participants plotted as a function of blocks of practice during the pre and post-nap sessions (+/-standard error) for the reactivated (magenta) and the non-reactivated (blue) sequences. Negative control analyses on the pre-nap training session revealed no main effects (Condition: F(1,23) = 0.74; pvalue = 0.4; Block: F(15,345) = 1.3; p-value = 0.2) nor interaction (F(15,345) = 0.39; p-value = 0.98) using a repeated-measure ANOVA. This was also the case for the pre-nap test (Condition: F(1,23) = 1.01; p-value = 0.75; Block: F(3,69) = 2.24; p-value = 0.88; Interaction: F(3,69) = 1.06; p-value = 0.37). (b) TMR effect. Offline gains in performance accuracy averaged across participants (N = 24; box: median and first(third) as lower(upper) limits; whiskers: 1.5 x InterQuartile Range (IQR)) for post-nap and post-night time-points and for reactivated (magenta) and non-reactivated (blue) sequences. Offline gains in performance accuracy were significantly higher at the post-night time-point as compared to the post-nap time point (F(1,23) = 18.84; p-value = 0.0002; η²=0.91). Yet, the offline gains in performance accuracy were not different between the reactivated and the non-reactivated sequences (F(1,23) = 0.54; p-value = 0.47). The interaction between the Condition and the Time-point was also not significant (F(1,23) = 0.2; p-value = 0.66).***: p-value <0.001 (rmANOVA).
Figure 2—figure supplement 2
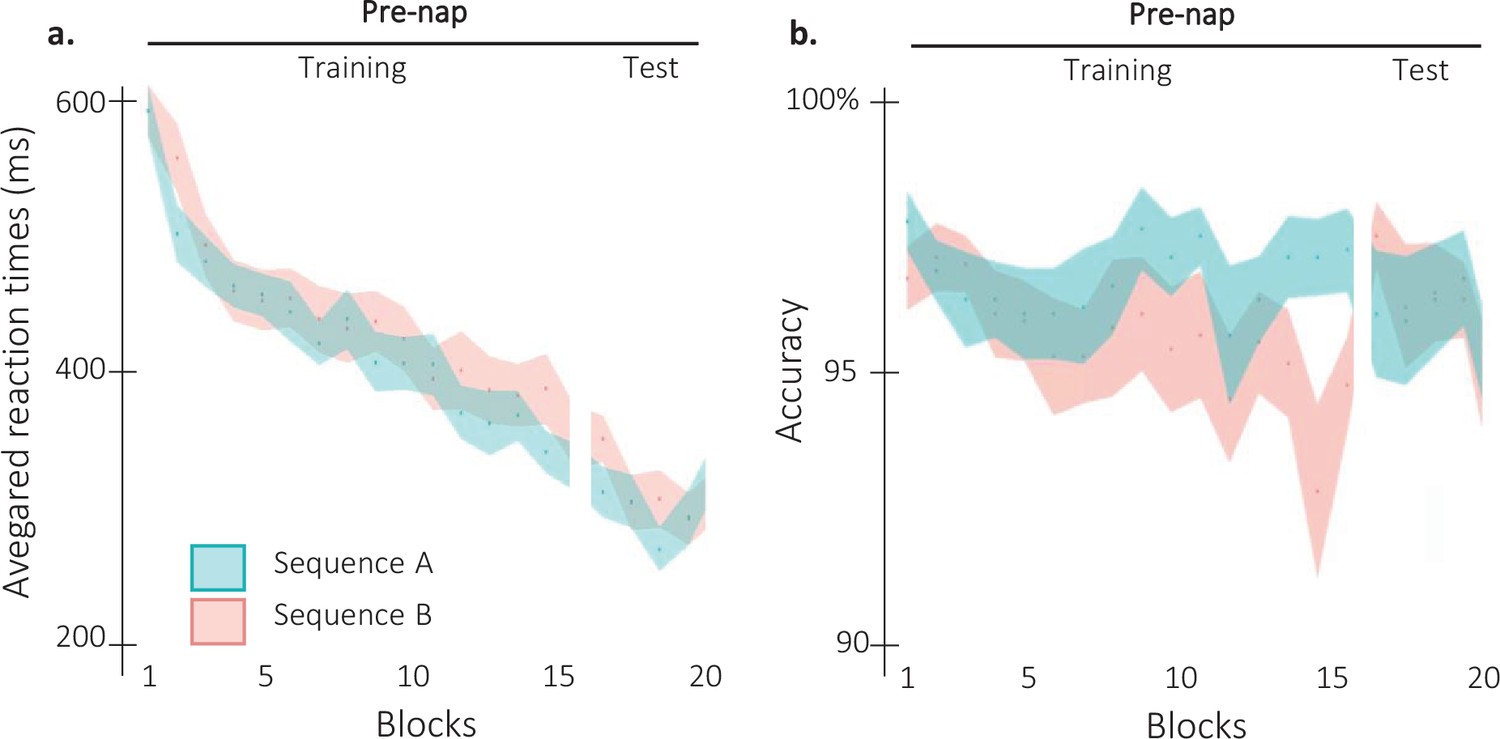
Behavioral results per sequence.
(a) Performance speed (N = 24; mean reaction time in ms and +/-standard error in shaded regions) across participants plotted as a function of blocks of practice during the pre-nap session (Training and Test) for the sequence A (1 6 3 5 4 8 2 7; Blue) and the sequence B (7 2 6 4 5 1 8 3; orange). Negative control analyses (rmANOVA) on the pre-nap training performances revealed no significant difference between the sequence A and the sequence B (main of effect Sequence: F(1,23) = 2.18; p-value = 0.15). The RT significantly decreased across blocks (Main effect of Block: F(15,345) = 34.82; p-value = 2.04e-26; η²=0.6). However, this decrease was not different between the two sequences (Block by Sequence interaction: F(15, 345)=1.11; p-value = 0.35). Pre-nap test performances showed no significant main effect of Sequence (F(1,23) = 0.99; p-value = 0.33) nor of Block (F(2,46) = 1.56; p-value = 0.22). The interaction between the Block and the Sequence was significant (F(2,46) = 3.37; p-value = 0.043; η²=0.13). However, as reactivation conditions were counterbalanced between sequences A and B, this small effect is not considered as confounding to test our hypothesis. (b) Performance accuracy (N = 24; mean percentage of correct responses +/-standard error in shaded regions) across participants plotted as a function of blocks of practice during the pre-nap session (Training and Test) for the sequence A (1 6 3 5 4 8 2 7; Blue) and the sequence B (7 2 6 4 5 1 8 3; orange). The rmANOVA performed on the pre-nap training highlighted a main effect of Sequence (F(1,23) = 7.28; p-value = 0.01; η²=0.24), but no significant effect of the Block factor nor interaction (F(15,345) = 1.3; p-value = 0.2 and F(15,345) = 1.03; p-value = 0.43, respectively). The sequence effect was not significant during the pre-nap test and no block effect or block by sequence interaction were observed (Sequence: F(1,23) = 0.25; p-value = 0.62; Block: F(3,69) = 0.22; p-value = 0.88; Interaction: F(3,69) = 0.41; p-value = 0.75).
Figure 3 with 3 supplements
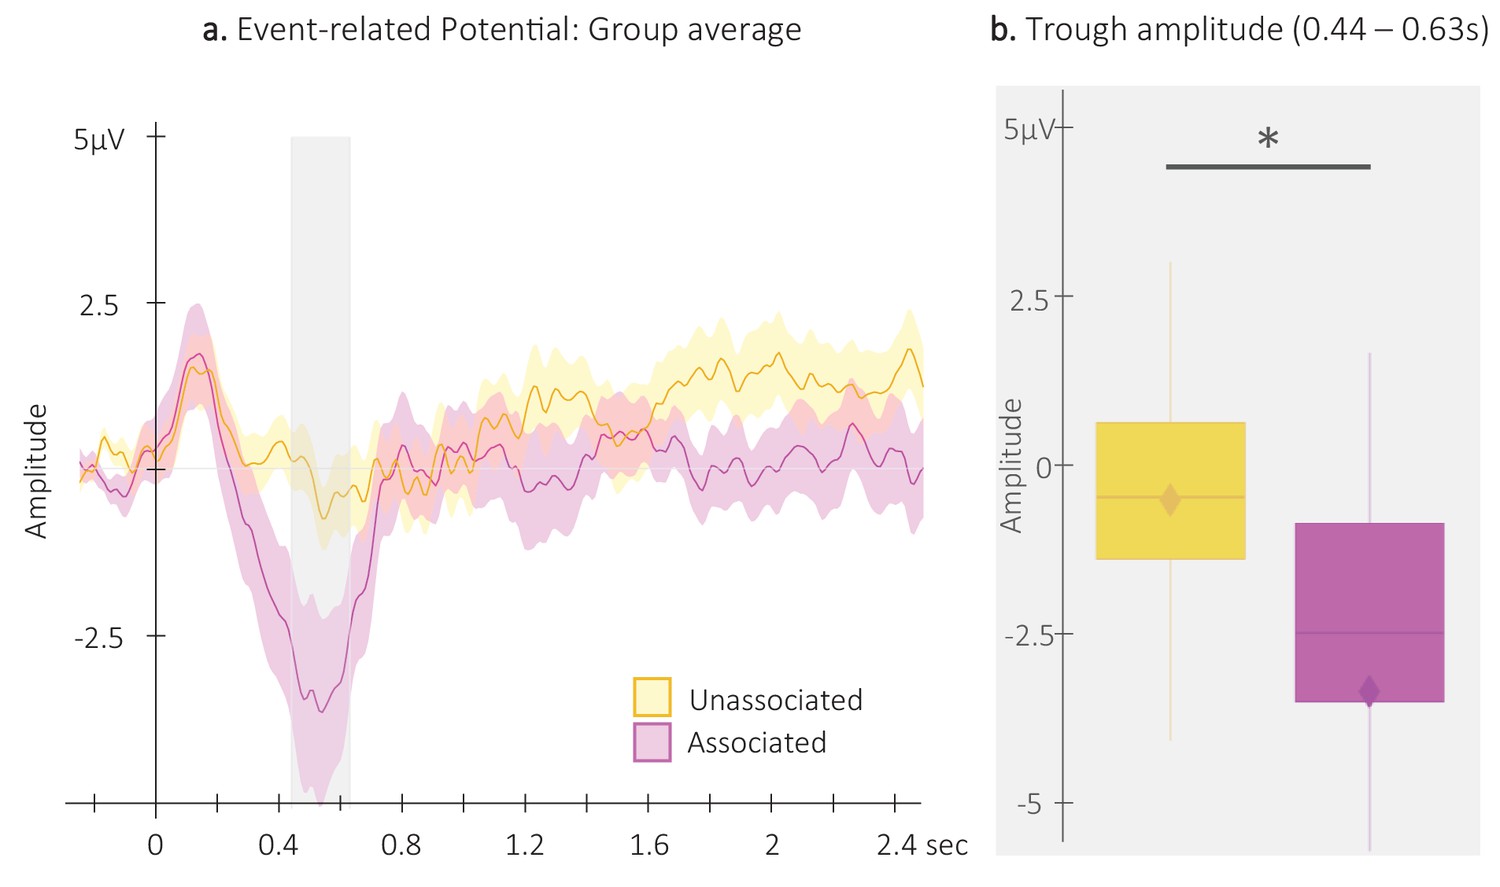
Event-related potentials (ERP).
(a) Potentials averaged across all EEG channels and all participants (N = 24; +/-standard error in shaded regions) evoked by the associated (magenta) and the unassociated (yellow) auditory cues from –0.3 to 2.5 s relative cue onset. The gray region represents the temporal window (trough) in which ERPs across conditions were significantly different from zero. (b) ERP amplitude (N = 24; box: median (horizontal bar), mean (diamond) and first(third) as lower(upper) limits; whiskers: 1.5 x IQR) extracted from the temporal window highlighted in panel a, that is at 0.44 – 0.63 s post-cue onset (trough) in each condition. *: p-value <0.05 (Wilcoxon signed-rank test).
Figure 3—figure supplement 1
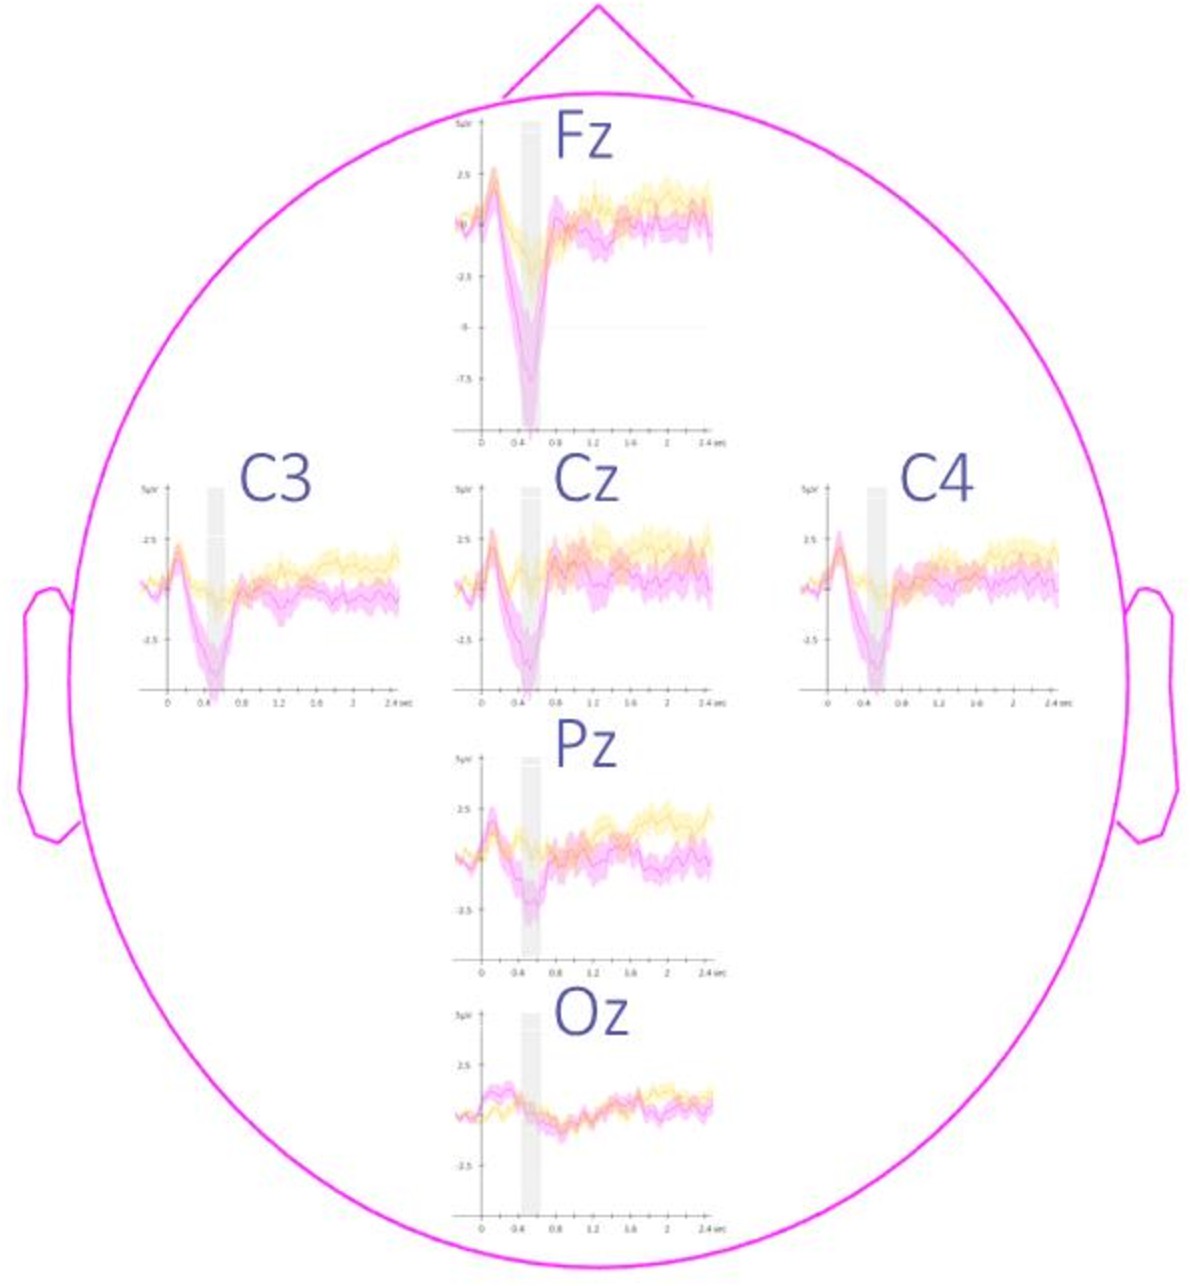
Topography of event-related potentials.
This figure depicts the channel level data corresponding to the analyses presented in Figure 3 in the main text. Potentials evoked by the associated (magenta) and the unassociated (yellow) auditory cues from –0.3 to 2.5 s relative to cue onset averaged across all participants (N = 24; +/-standard error). Note that the effect reported in the main manuscript across channels is more pronounced on the frontal (Fz) and the central (Cz, C3, and C4) electrodes. The gray region represents the temporal window (trough) in which ERPs across conditions were significantly different from zero.
Figure 3—figure supplement 2
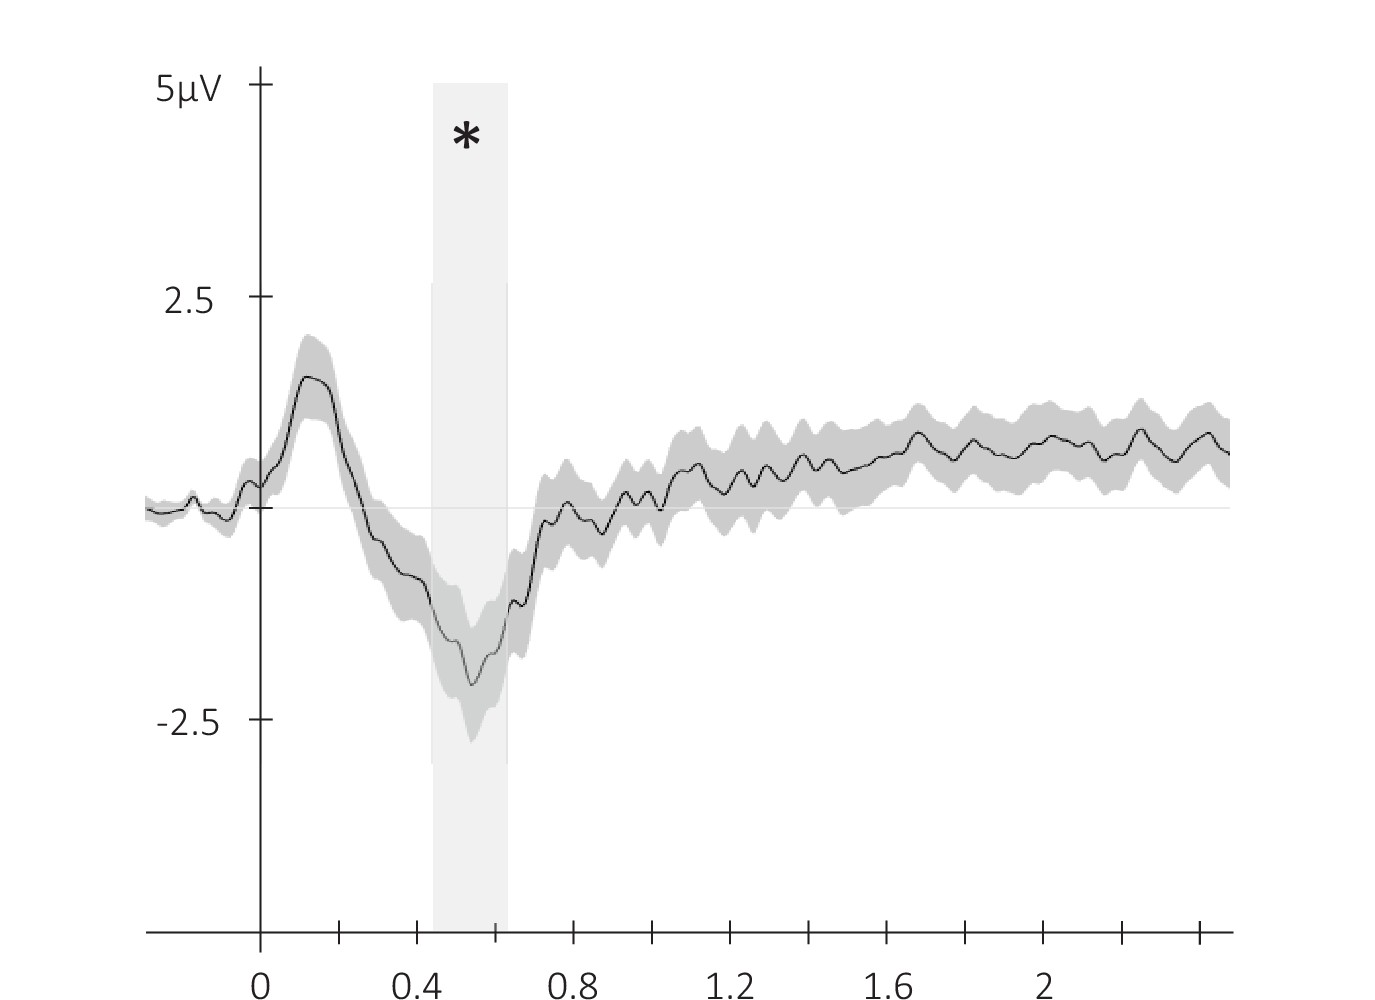
Event-related potential across conditions.
Potentials averaged across all participants and all EEG channels (N = 24; +/-standard error) evoked by the auditory cue regardless of its type from –0.3 to 2.5 s relative cue onset. The gray region represents the temporal window (trough) in which ERPs across conditions were significantly different from zero. *: p-value <0.05 (cluster-based permutation test).
Figure 3—figure supplement 3
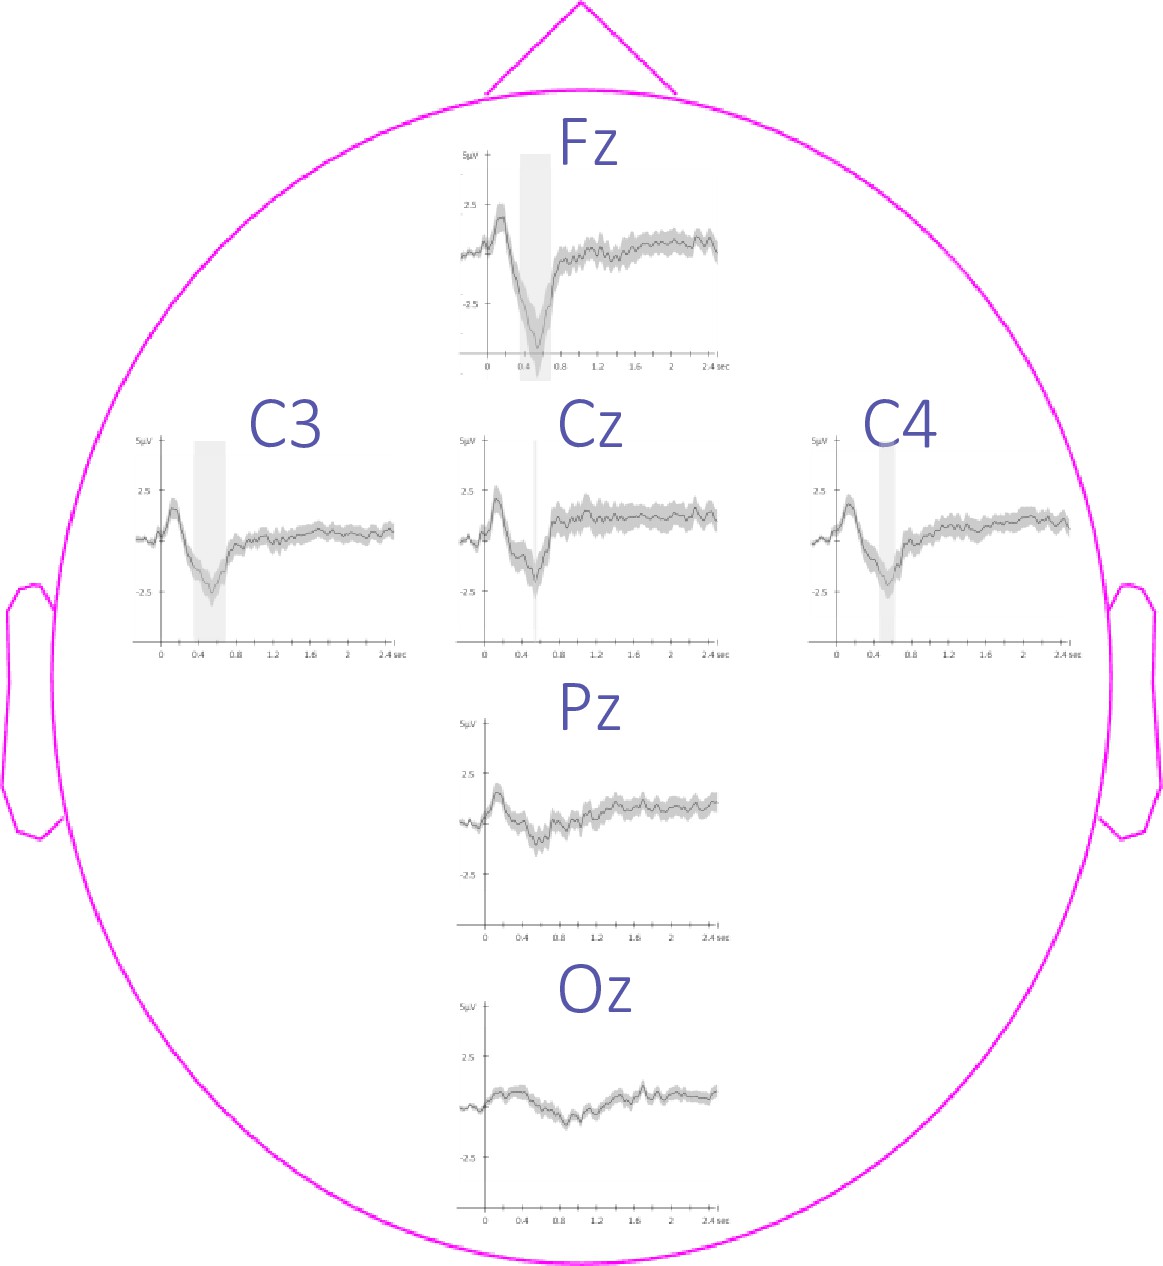
Topography of event-related potentials.
This figure depicts the channel level data corresponding to the analyses presented in Figure 3—figure supplement 2. Potentials evoked by the auditory cues from –0.3 to 2.5 sec relative to cue onset averaged across conditions and across participants (+/-standard error). The gray region represents the temporal window (trough) in which ERPs across conditions were significantly different from zero. Note that the effect reported in the main manuscript across channels is more pronounced on the frontal (Fz) and the central (Cz, C3, and C4) electrodes.
Figure 4

Detected Slow Waves (SWs).
(a) Average at the negative peak (N = 22; +/-standard error) across all detected slow waves on all channels during the associated (magenta) and unassociated (yellow) stimulation intervals as well as in the rest (i.e. unstimulated) intervals (gray). (b) Zoom on the negative peak of the detected SWs. Shaded regions represent SEM. (c) Peak-to-peak SW amplitude (μV) was higher for associated as compared to unassociated sounds (Student t-test). (d) SW density (number of SWs per total time in minutes spent in stimulation or rest intervals) was higher during stimulation as compared to rest intervals and for associated as compared to unassociated sounds (Wilcoxon signed-rank test). Box: median (horizontal bar), mean (diamond) and first(third) as lower(upper) limits; whiskers: 1.5 x IQR; *: p-value <0.05; **: p-value <0.01; ***: p-value <0.001; n.s.: not significant .
Figure 5
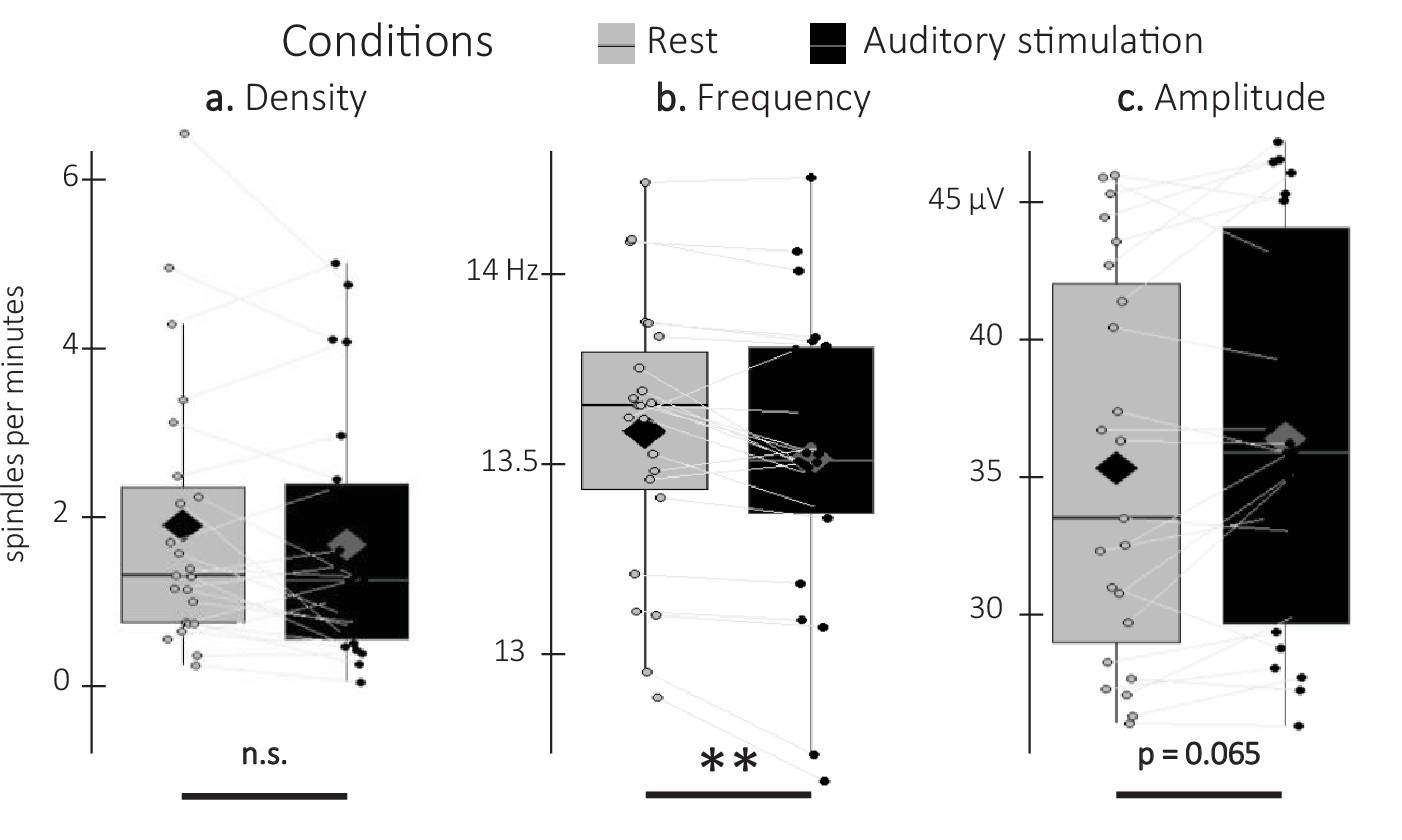
Detected spindles.
(a) Spindle density (number of spindles per total time in minute spent in stimulation or rest intervals) did not differ between stimulation intervals (irrespective of sound type; black) and rest (gray) intervals (Wilcoxon signed-rank test). (b) Spindle frequency (Hz) was lower during stimulation as compared to rest intervals (Student t-test). (c) Spindle amplitude (µV) was higher during stimulation as compared to rest intervals. All spindle features were averaged across channels (Wilcoxon signed-rank test). N = 23; Box: median (horizontal bar), mean (diamond) and first(third) as lower(upper) limits; whiskers: 1.5 x IQR; **: p-value <0.01; n.s.: not significant.
Figure 6 with 3 supplements
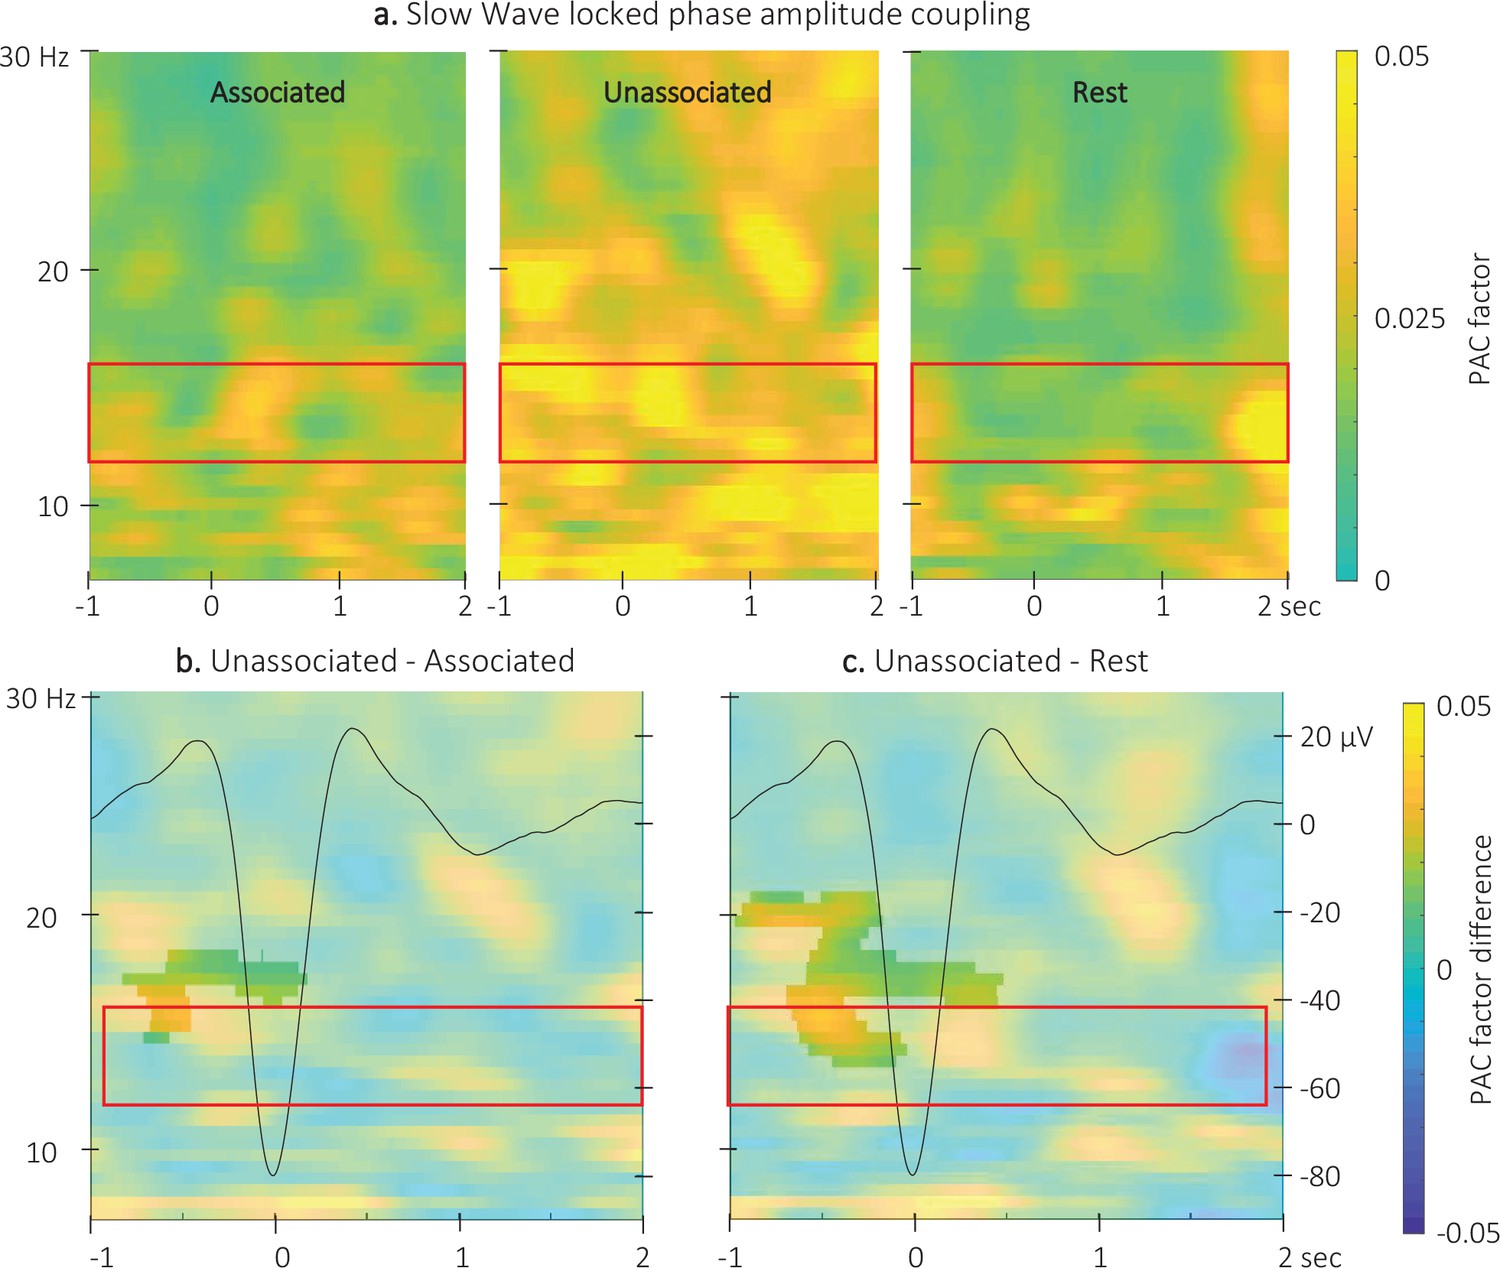
Event related phase-amplitude coupling locked to the detected slow wave negative peaks.
(a) Time-Frequency Representation (TFR) of group average (N = 22) coupling strength between the phase of the 0.5–2 Hz frequency band and the amplitude from 7 to 30 Hz (y-axis) from –1 to 2 s (x-axis) relative to SW negative peak for the three interval types. (b) ERPAC was significantly higher during the unassociated as compared to the associated sound intervals in the highlighted cluster (cluster-based permutation test). (c) ERPAC was significantly higher during the unassociated sound as compared to the rest intervals in the highlighted cluster (cluster-based permutation test). Red frames indicate the pre-registered sigma frequency band of interest. Superimposed on the TFR in panels b and c (black line): SW grand average across individuals and conditions (N = 22; y-axis on right).
Figure 6—figure supplement 1
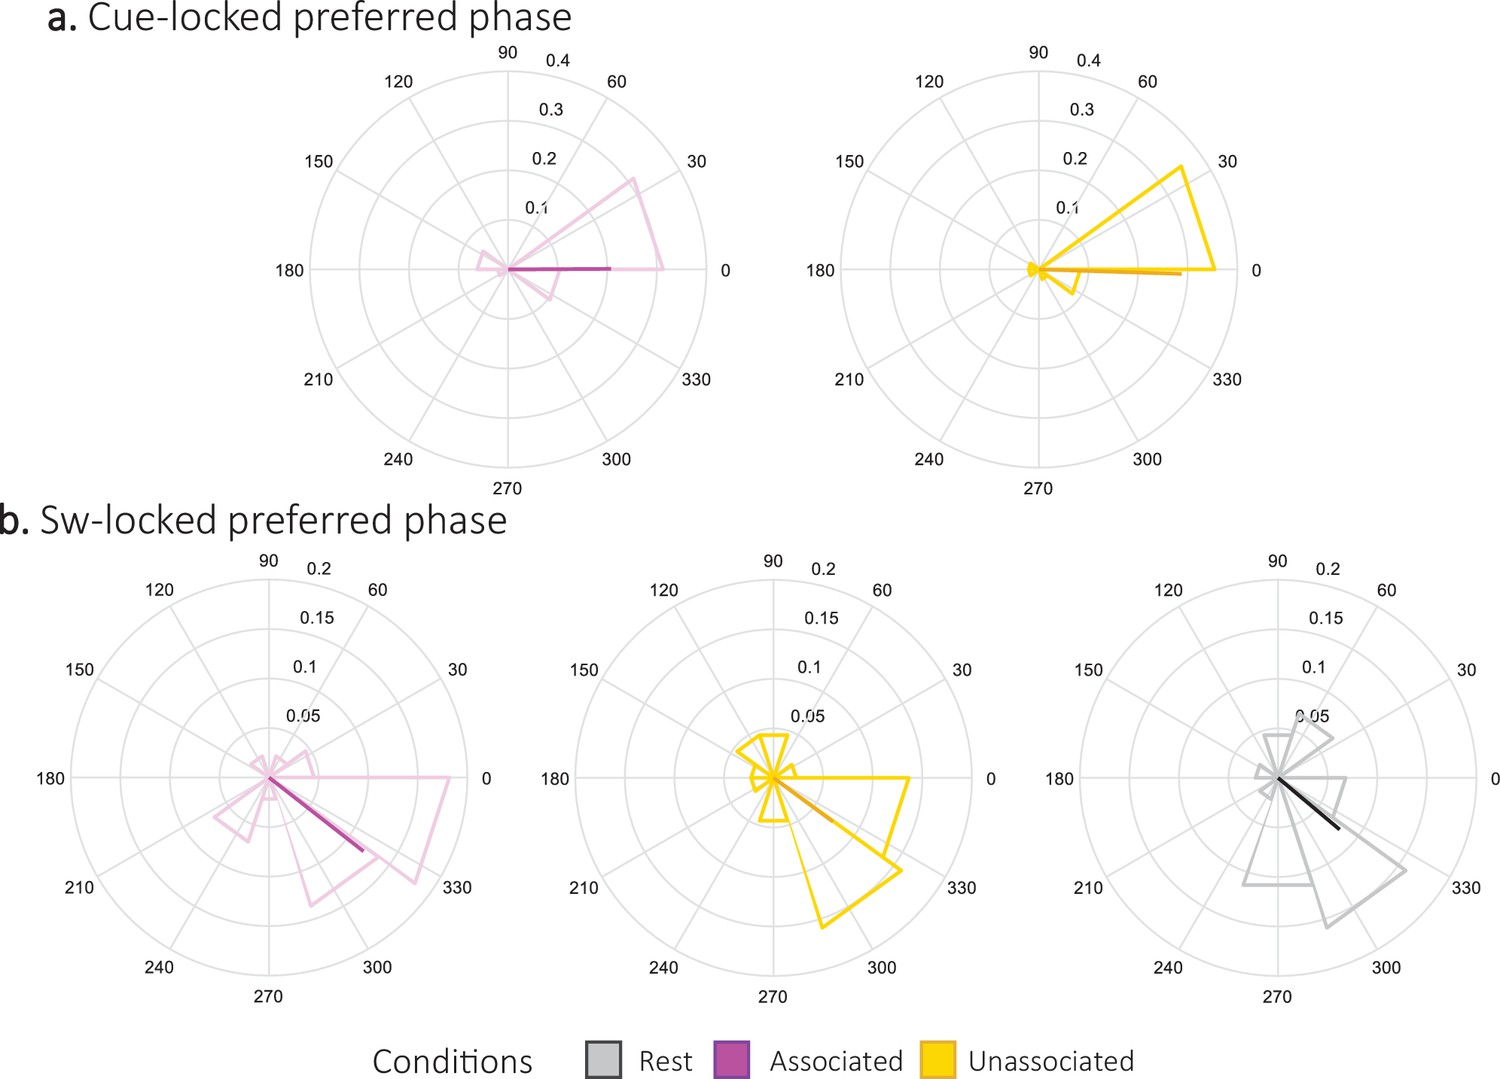
Preferred phase.
Density plot (and mean direction and resultant vector length in bold) of phases in degrees of the slow oscillation (SO) at the sigma band power peak during the 2.5 s following associated and unassociated cue (a,N = 24; magenta and yellow respectively). Phase of the SO at the sigma band power peak from 1 s pre- and 2 s post-trough of the detected SWs during associated, unassociated and rest intervals (b, N = 22; magenta, yellow, and gray respectively). To test for the presence of a coupling between slow oscillation phases and sigma band amplitude (Mikutta et al., 2019), we examined whether the amplitude of the sigma oscillations peaked at a preferred phase of the slow oscillation across trials within each stimulation condition and at rest. To this end, we computed the preferred phase which is defined as the phase at which the amplitude is maximum during each periods of interest (namely each trial). Next, we tested whether the preferred phases were uniformly distributed using Rayleigh test for non-uniformity of circular data (Berens, 2009); with a non-uniform distribution of the preferred phase being an indicator of coupling. Results show that the cue-locked preferred phases across trials were not distributed uniformly both following associated (Rayleigh z = 10.6, p-value = 7.7e-6 (7.7e-6 FDR-corrected)) and unassociated cues (Rayleigh z = 15.8, p-value = 4e-9 (8.1e-9 FDR-corrected)). Further, the phase at which the amplitude was the highest around the SW trough was also not distributed uniformly for SW occurring during associated (Rayleigh z = 9.7, p-value = 2e-5 (6e-5 FDR-corrected)), unassociated (Rayleigh z = 4.8, p-value = 0.007, (6.9e-3 FDR-corrected)) and rest (Rayleigh z = 5.7, p-value = 0.003 (3.8–3 FDR-corrected)) intervals. Altogether, these results indicate significant SW-sigma coupling during rest and stimulation intervals. Parametric Watson-Williams multi-sample test for equal means were used to test whether the distributions of preferred phases were different following the two cue types or during the different block of stimulation. The cue-locked preferred phase was not significantly different following associated cues as compared to unassociated cues (F(1,46) = 0.3, p-value = 0.9). Concerning the SW-locked, analyses revealed that none of the preferred phase of three conditions significantly differed (associated vs. unassociated: F(1,42) = 0;007, p-value = 0.94; associated vs. rest: F(1,42) = 0.01, p-value = 0.91; unassociated vs. rest: F(1,42) = 0.3, p-value = 0.87). Altogether, these results reveal that the highest peaks of the cue-evoked sigma amplitude were located on average at 359.2° [CI95: 372.7–345.7] regardless the cue type, whereas the preferred slow oscillation phase of sigma peak amplitude around the negative peak of the SW was located on average at 321.8° [CI95: 338.6–305] regardless the stimulation interval.
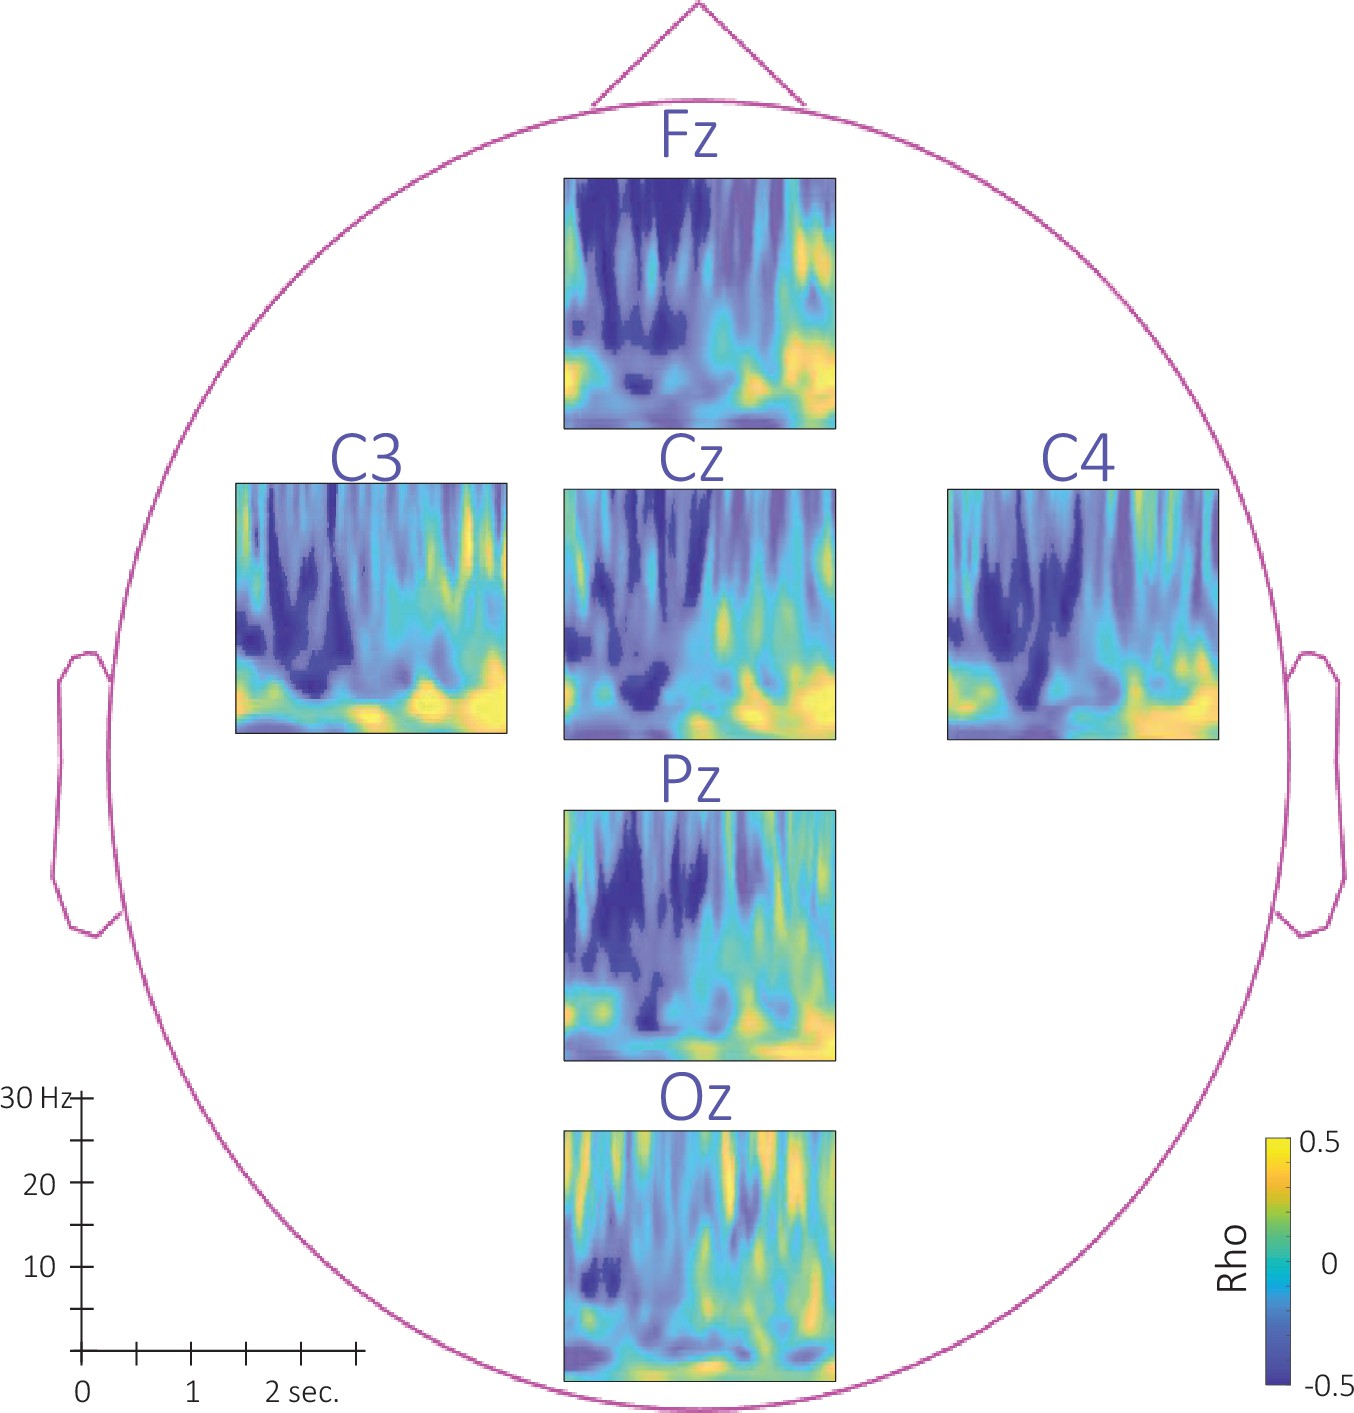
Figure 6—figure supplement 2
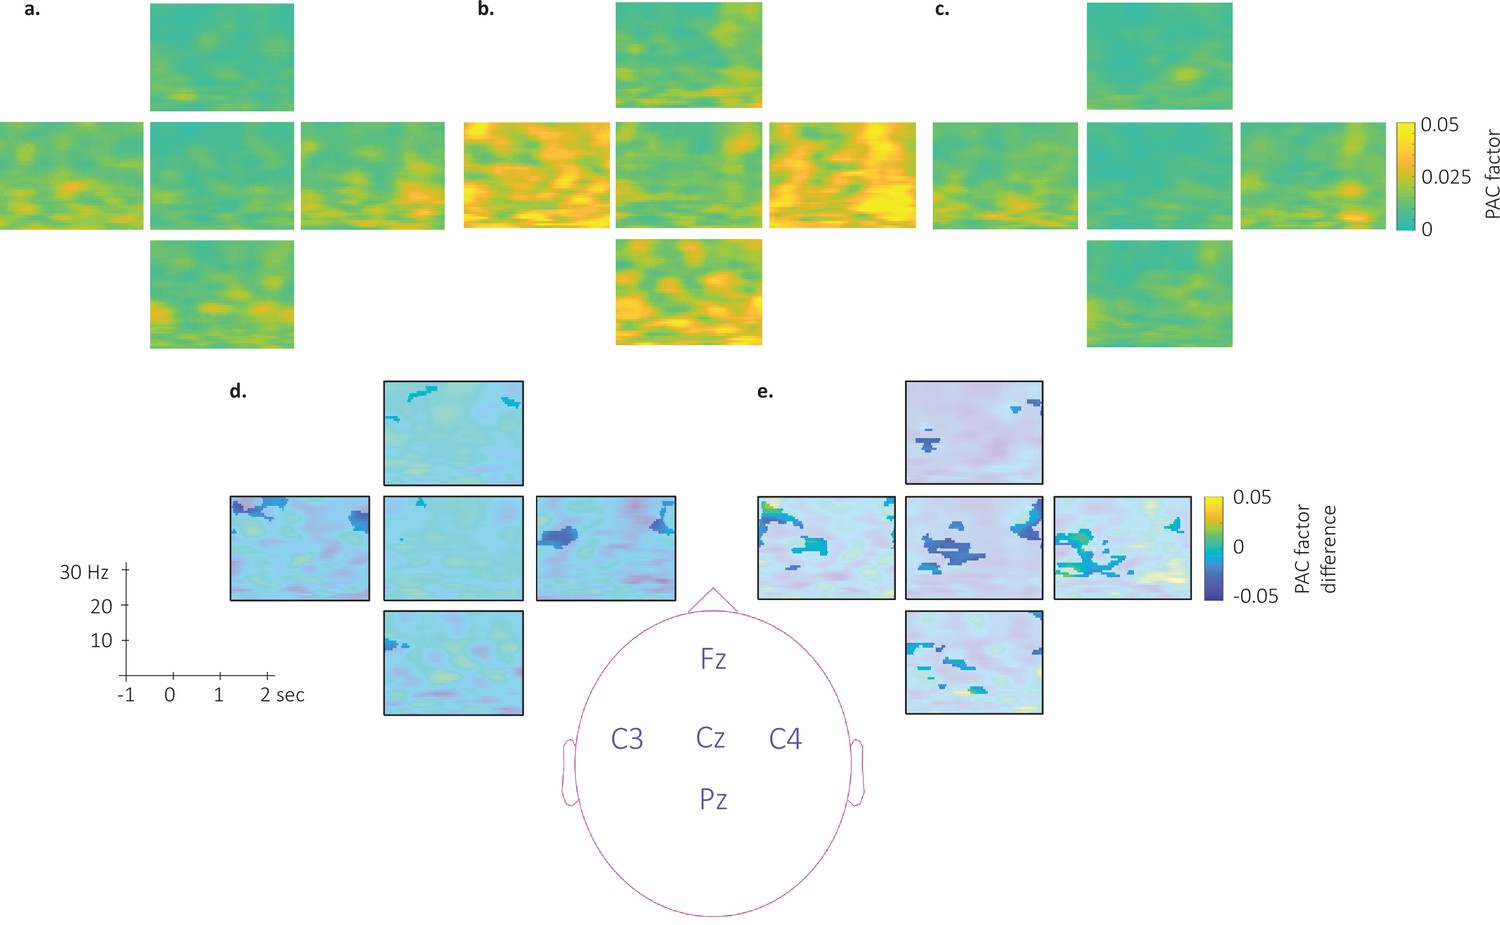
Topography of the phase-amplitude coupling locked to the detected slow wave negative peaks.
This figure depicts the channel level data corresponding to the analyses presented in Figure 6 in the main text. (a–c). Time-Frequency Representation (TFR) of group average (N = 22) coupling strength between the phase of the 0.5–2 Hz frequency band and the amplitude from 7 to 30 Hz (y-axis) and from –1 to 2 s (x-axis) relative to SW negative peak for the associated stimulation (a), the unassociated stimulation (b) and the rest stimulation (c) intervals. (d-e) Difference of phase-amplitude coupling locked to the detected slow wave negative peaks between unassociated and associated (d) and between unassociated and rest (e). PAC was significantly higher during the unassociated as compared to the associated sound intervals in the highlighted cluster (p-values <0.05). The effect reported in the main manuscript across channels is more pronounced on central (Cz, C3, and C4) electrodes. Note that Oz channel was discarded from SW-locked analyses as the number of detected SW could not allow appropriate PAC analyses.
Figure 6—figure supplement 3
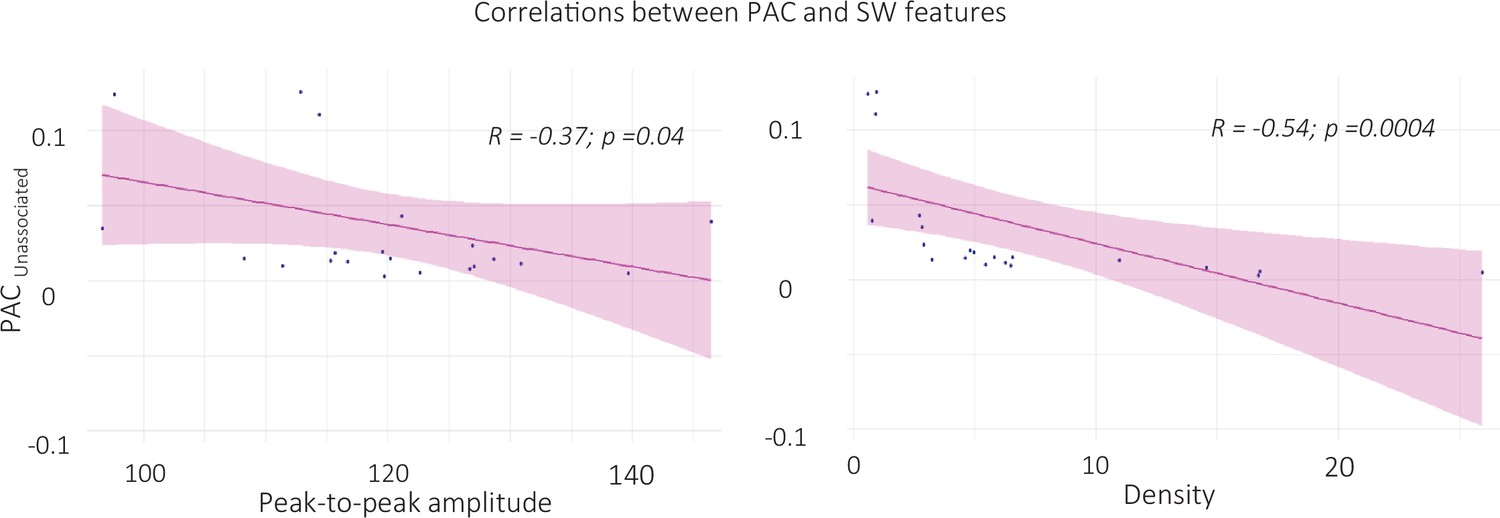
Correlation between SW-locked phase-amplitude coupling during unassociated intervals and SW features (left panel: peak-to-peak amplitude, right panel: density).
ERPAC value during unassociated stimulation intervals were extracted in the time-frequency window where ERPAC was significantly greater for unassociated as compared to associated and rest conditions (i.e. from –0.5 to 0.5 and from 14 to 18 Hz, see Figure 7 in the main text). ERPAC negatively correlated with the properties of the SWs detected during unassociated intervals (N = 22). Specifically, the higher the PAC, the lower SW density (t=–2.9, df = 20, p-value = 0.004, right panel) and the peak-to-peak amplitude (S=2460, p-value = 0.037, left panel) during unassociated intervals (Pearson correlations).
Figure 7 with 1 supplement

Correlation between power difference and TMR Index.
(a) Time-Frequency Representation (TFR) of the rho values issued from the correlation between the TMR index and the difference between the power elicited by the associated auditory cues and the unassociated ones (N = 24). Highlighted, the negative clusters in which the TMR index is significantly correlated with the difference in power (cluster-based permutation test). Red frame indicates the pre-registered sigma frequency band of interest. Superimposed on the TFR (black line): Grand average across individuals (N = 24) and conditions of event related potentials elicited by the auditory cues (y-axis on right). (b) Negative correlation between the difference in power elicited by the associated and unassociated cues (0.35–1 s post-cue, 12–16 Hz) and the TMR index (dots represent individual datapoints).
Figure 7—figure supplement 1
Topography of the correlation between power difference and TMR Index.
This figure depicts the channel level data corresponding to the analyses presented in Figure 7 in the main text. Time-Frequency Representation (TFR) of the rho values issued from the correlation the TMR index and the difference between the power elicited by the associated auditory cues and the unassociated ones (N = 24; from 0 to 2.5 s post-cue and from 5 to 30 Hz). Highlighted, the negative clusters in which the TMR index is significantly correlated with the difference in power (cluster-based permutation test). Note that the effect reported in the main manuscript across channels is consistent with individual channel data although smaller at Oz.
Figure 8 with 1 supplement
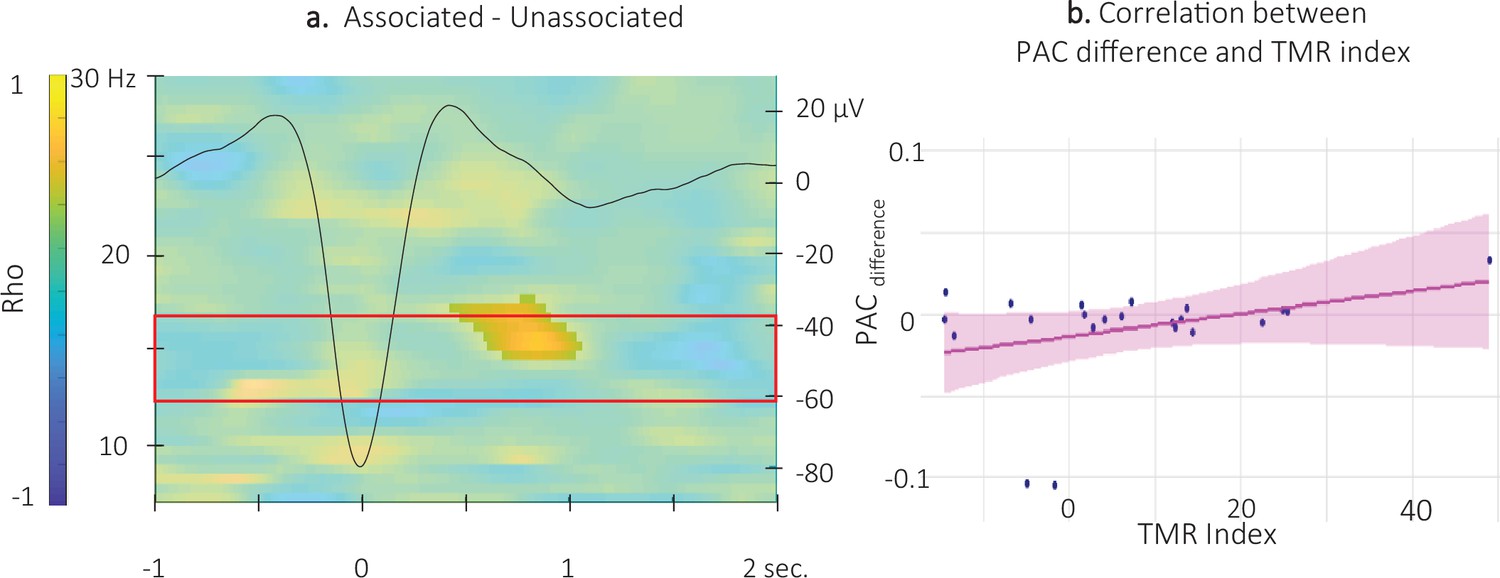
Correlation between SW-locked event related phase-amplitude coupling difference and TMR Index.
(a) Time-Frequency Representation (TFR) of the rho values issued from the correlation between the TMR index and the difference between the SW-locked ERPAC during the associated vs. unassociated stimulation intervals (N = 22). Highlighted, the positive cluster in which the TMR index is significantly correlated with the difference in SW-locked ERPAC (cluster-based permutation test). Superimposed on the TFR (black line): SW grand average across individuals and conditions. Red frame highlights the pre-registered sigma frequency band of interest. (b) Positive correlation between the SW-locked ERPAC difference (0.55–1.05 s post negative peak, 14.5–17 Hz) and the TMR index (dots represent individual datapoints).
Figure 8—figure supplement 1

Topography of the correlation between SW-locked phase-amplitude coupling difference and TMR Index.
This figure depicts the channel level data corresponding to the analyses presented in Figure 8 in the main text. Time-Frequency Representation (TFR) of the rho values issued from the correlation between the TMR index and the difference between the SW-locked PAC during the associated vs. unassociated stimulation intervals (N = 22). Highlighted, the positive cluster in which the TMR index tends to be correlated (p-value = 0.12) with the difference in SW-locked PAC (cluster-based permutation test). The effect reported in the main manuscript across channels is more pronounced on central (Cz) and frontal (Fz) electrodes. Note that Oz channel was discarded from SW-locked analyses as the number of detected SW could not allow appropriate PAC analyses.
Author response image 1
Offline changes in performance speed averaged across participants (box: median (horizontal bar), mean (diamond) and first(third) as lower(upper) limits; whiskers: 1).
5 x InterQuartile Range (IQR) for post-nap and post-night time-points and for reactivated (magenta) and non-reactivated (blue) sequences.
Author response image 2
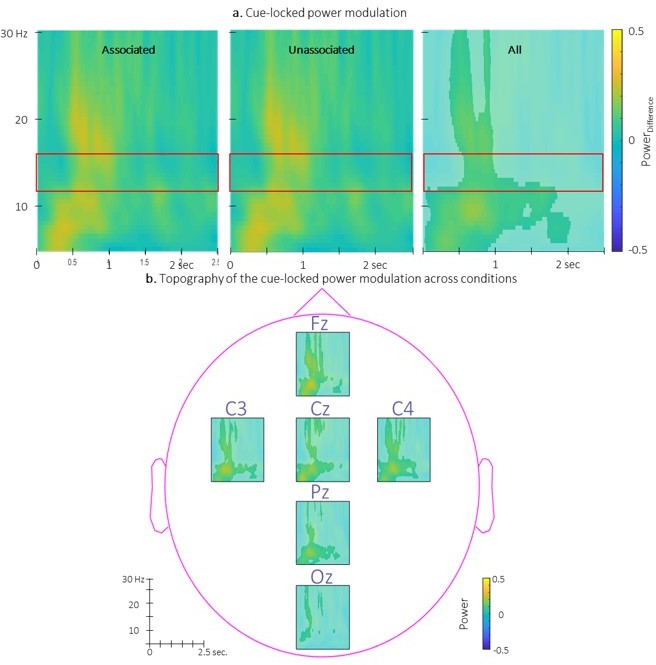
Time-Frequency Representation (TFR) of group average of the power modulation evoked by the auditory cues averaged across all EEG channels from 5 to 30 Hz (y-axis) from 0 to 2.
5 sec (x-axis) relative to cue onset for the two conditions (left: associated; middle: unassociated) and collapsed across conditions (right). b. Topography of the TFR of the group average collapsed across conditions. Power modulation was significantly higher than zero in response to auditory cues regardless the condition in the highlighted cluster. Red frames indicate the pre-registered sigma frequency band of interest..
Tables
Table 1
Participant characteristics and sleep characteristics leading up to the experimental session and vigilance assessments at time of testing.
| N | 24 (12 females) |
|---|---|
| Age (yrs) | 21.9 ranging from 18 to 27 |
| Edinburgh Handedness (Oldfield, 1971) | 78.6 [57.1–100] |
| Epworth Sleepiness Scale (Hoddes et al., 1972) | 7 [5.9–8.1] |
| Beck Depression Scale (Beck et al., 1996) | 1.5 [0.9–2.2] |
| Beck Anxiety Scale (Beck et al., 1988) | 1.8 [1.1–2.4] |
| PSQI (Buysse et al., 1989) | 3 [2.2–3.8] |
| Chronoscore (CRQ)(51) | 48.8 [45.6–51.9] |
| Sleep durationa | |
| Mean across the 3 nights (minutes) | |
| Night 1 | 481.5 [461.5–501.5] |
| Night 2 | 488.2 [471.2–505.2] |
| Night 3 | 502 [482.1–521.8] |
| St. Mary’s questionnaire on Night 3 quality | |
| Quality | 4.7 [4.3–5.1] |
| Duration (minutes) | 443.5 [423.3–463.8] |
| Psychomotor Vigilance Taskb | |
| Pre-nap | 300.2ms [289.7–310.6] |
| Post-nap | 297.5ms [288.9–306] |
| Post-night | 294.7ms [285.1–304.2] |
| One-way rmANOVA results | F(2,46)=1.47; P-value = 0.24 |
| Stanford sleepiness score | |
| Pre-nap Session | 2.4 [2.1–2.7] |
| Post-nap Session | 2.7 [2.3–3.1] |
| Post-night Session | 2.3 [1.9–2.7] |
| One-way rmANOVA results | F(2,46)=1.69; P-value = 0.2 |
-
Notes. Values are means [lower and upper limit of the 95% Confidence Interval - CI]. PSQI = Pittsburgh Sleep Quality Index; CRQ = Circadian Rhythm Questionnaire. REM: Rapid Eye Movement. a Sleep duration was computed as the mean across the actigraphy data and the sleep diary for the three nights before the experimental day. b Median of reaction times computed across the 100 trials of each session.
Additional files
-
Supplementary file 1
Sleep and stimulation characteristics (N=24).
- https://cdn.elifesciences.org/articles/73930/elife-73930-supp1-v2.docx
-
Supplementary file 2
Mean number [lower and upper limit of the 95% CI] of sleep events across participants detected at the single channel level per condition of blocks (either stimulation associated/unassociated or rest).
- https://cdn.elifesciences.org/articles/73930/elife-73930-supp2-v2.docx
-
Supplementary file 3
List of the deviations from the pre-registered analyses followed by their justification.
These deviations are marked with a # in the main manuscript.
- https://cdn.elifesciences.org/articles/73930/elife-73930-supp3-v2.docx
-
Transparent reporting form
- https://cdn.elifesciences.org/articles/73930/elife-73930-transrepform1-v2.pdf
Download links
A two-part list of links to download the article, or parts of the article, in various formats.
Downloads (link to download the article as PDF)
Open citations (links to open the citations from this article in various online reference manager services)
Cite this article (links to download the citations from this article in formats compatible with various reference manager tools)
Sigma oscillations protect or reinstate motor memory depending on their temporal coordination with slow waves
eLife 11:e73930.
https://doi.org/10.7554/eLife.73930


