High-resolution mapping demonstrates inhibition of DNA excision repair by transcription factors
- Department of Internal Medicine, University of New Mexico Comprehensive Cancer Center, University of New Mexico, United States
- School of Molecular Biosciences, Washington State University, United States
- Department of Chemistry, Georgia State University, United States
- Center for Reproductive Biology, Washington State University, United States
Figures
Figure 1 with 6 supplements
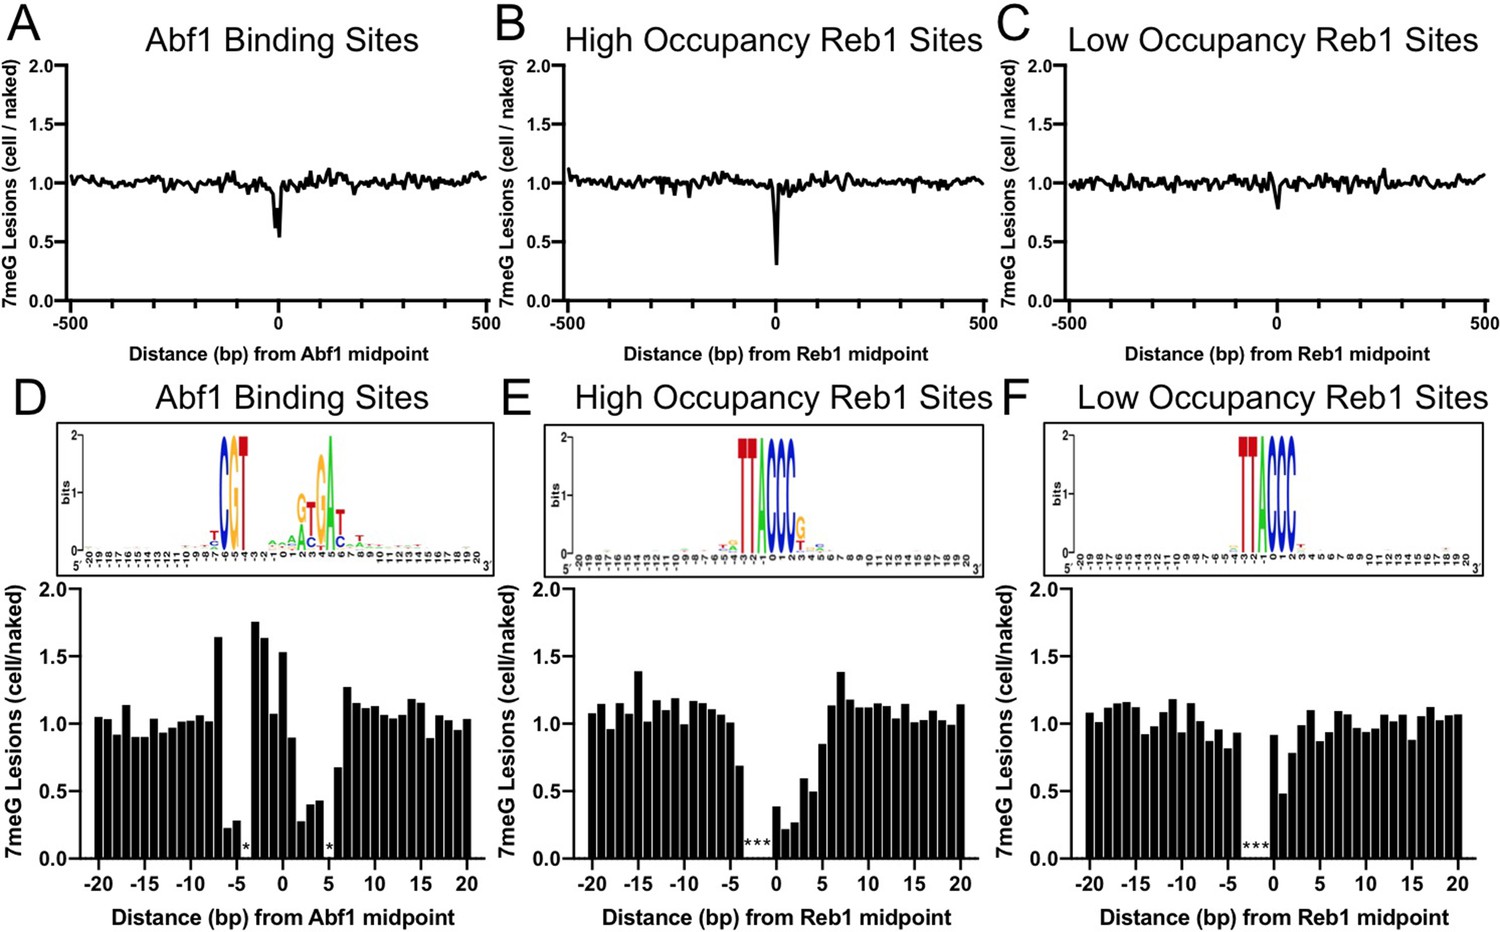
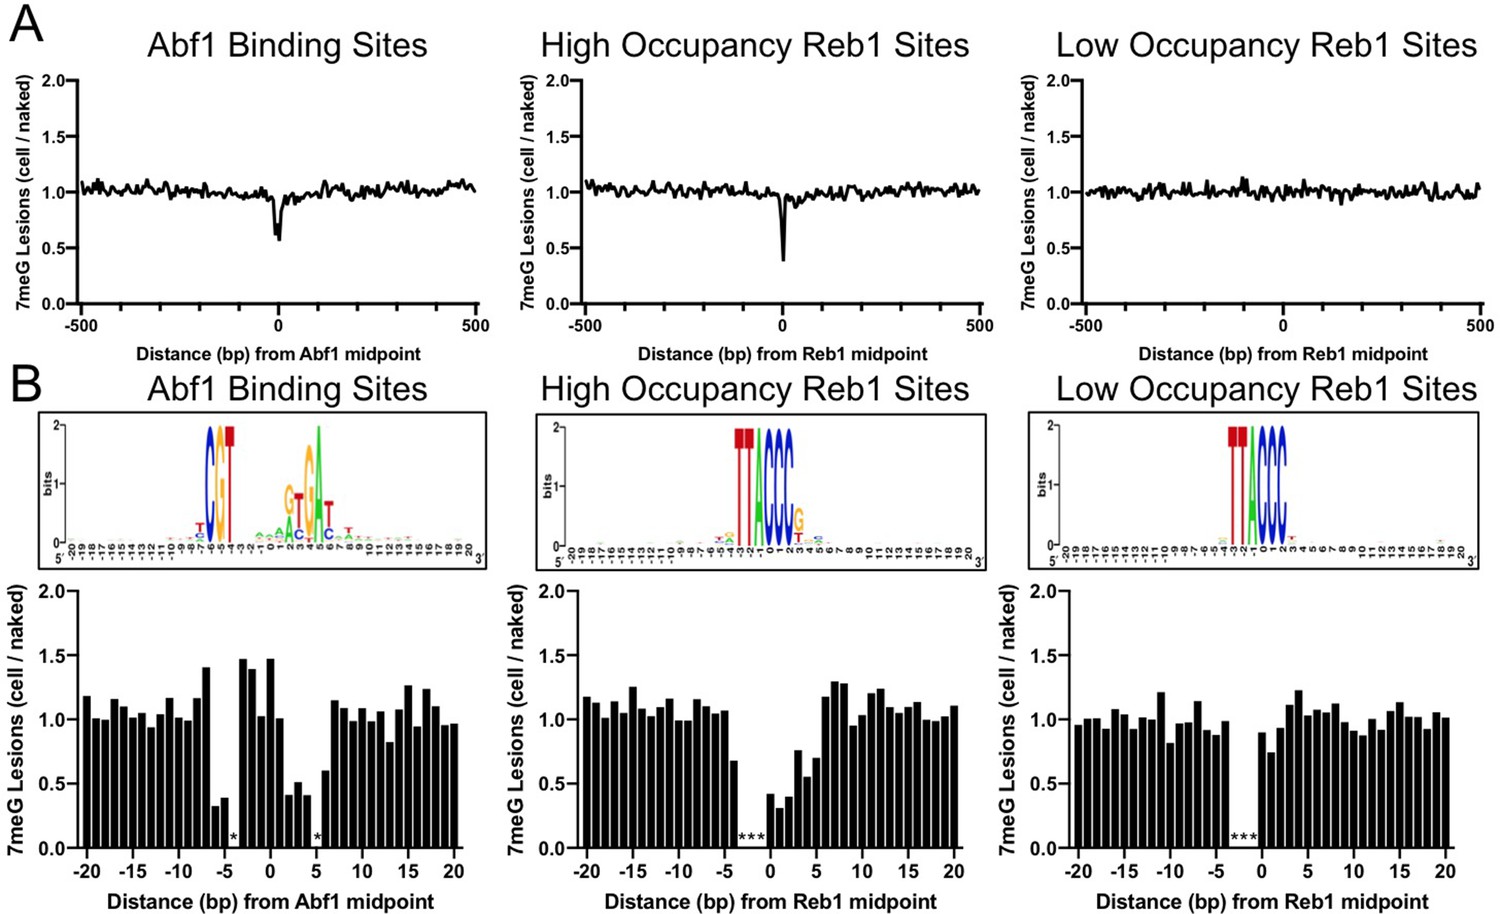
Formation of 7-methylguanine (7meG) lesions at ARS binding factor 1 (Abf1) and rDNA enhancer binding protein 1 (Reb1) binding sites.
(A) Distribution of 7meG damage at 661 Abf1 binding sites and the flanking DNA in methyl methanesulfonate (MMS)-treated yeast cells. The cellular (i.e. mag1Δ–0 hr) 7meG levels in 5 bp non-overlapping moving windows were normalized to damage in naked yeast DNA. The normalized ratio was scaled to 1.0 and plotted along the aligned Abf1 sites. (B) Distribution of 7meG at 784 ‘high-occupancy’ Reb1 binding sites and the flanking DNA. N-methylpurine-sequencing (NMP)-seq data was analyzed at Reb1 binding sites. (C) Distribution of 7meG at 472 ‘low-occupancy’ Reb1 binding sites. (D–F) High-resolution plots showing 7meG formation in the Abf1, ‘high-occupancy’, and ‘low-occupancy’ Reb1 binding motif and the immediately adjacent DNA. The top panel depicts the consensus motif sequence for each transcription factor. The lower panel shows the normalized damage levels and each column points to a specific position at the binding site. Asterisks indicate conserved motif positions with exclusive A or T nucleotides and are not 7meG-forming sequences.
-
Figure 1—source data 1
Source data for 7-methylguanine formation at Abf1 binding sites.
- https://cdn.elifesciences.org/articles/73943/elife-73943-fig1-data1-v2.xlsx
-
Figure 1—source data 2
Source data for 7-methylguanine formation at Reb1 binding sites.
- https://cdn.elifesciences.org/articles/73943/elife-73943-fig1-data2-v2.xlsx
Figure 1—figure supplement 1
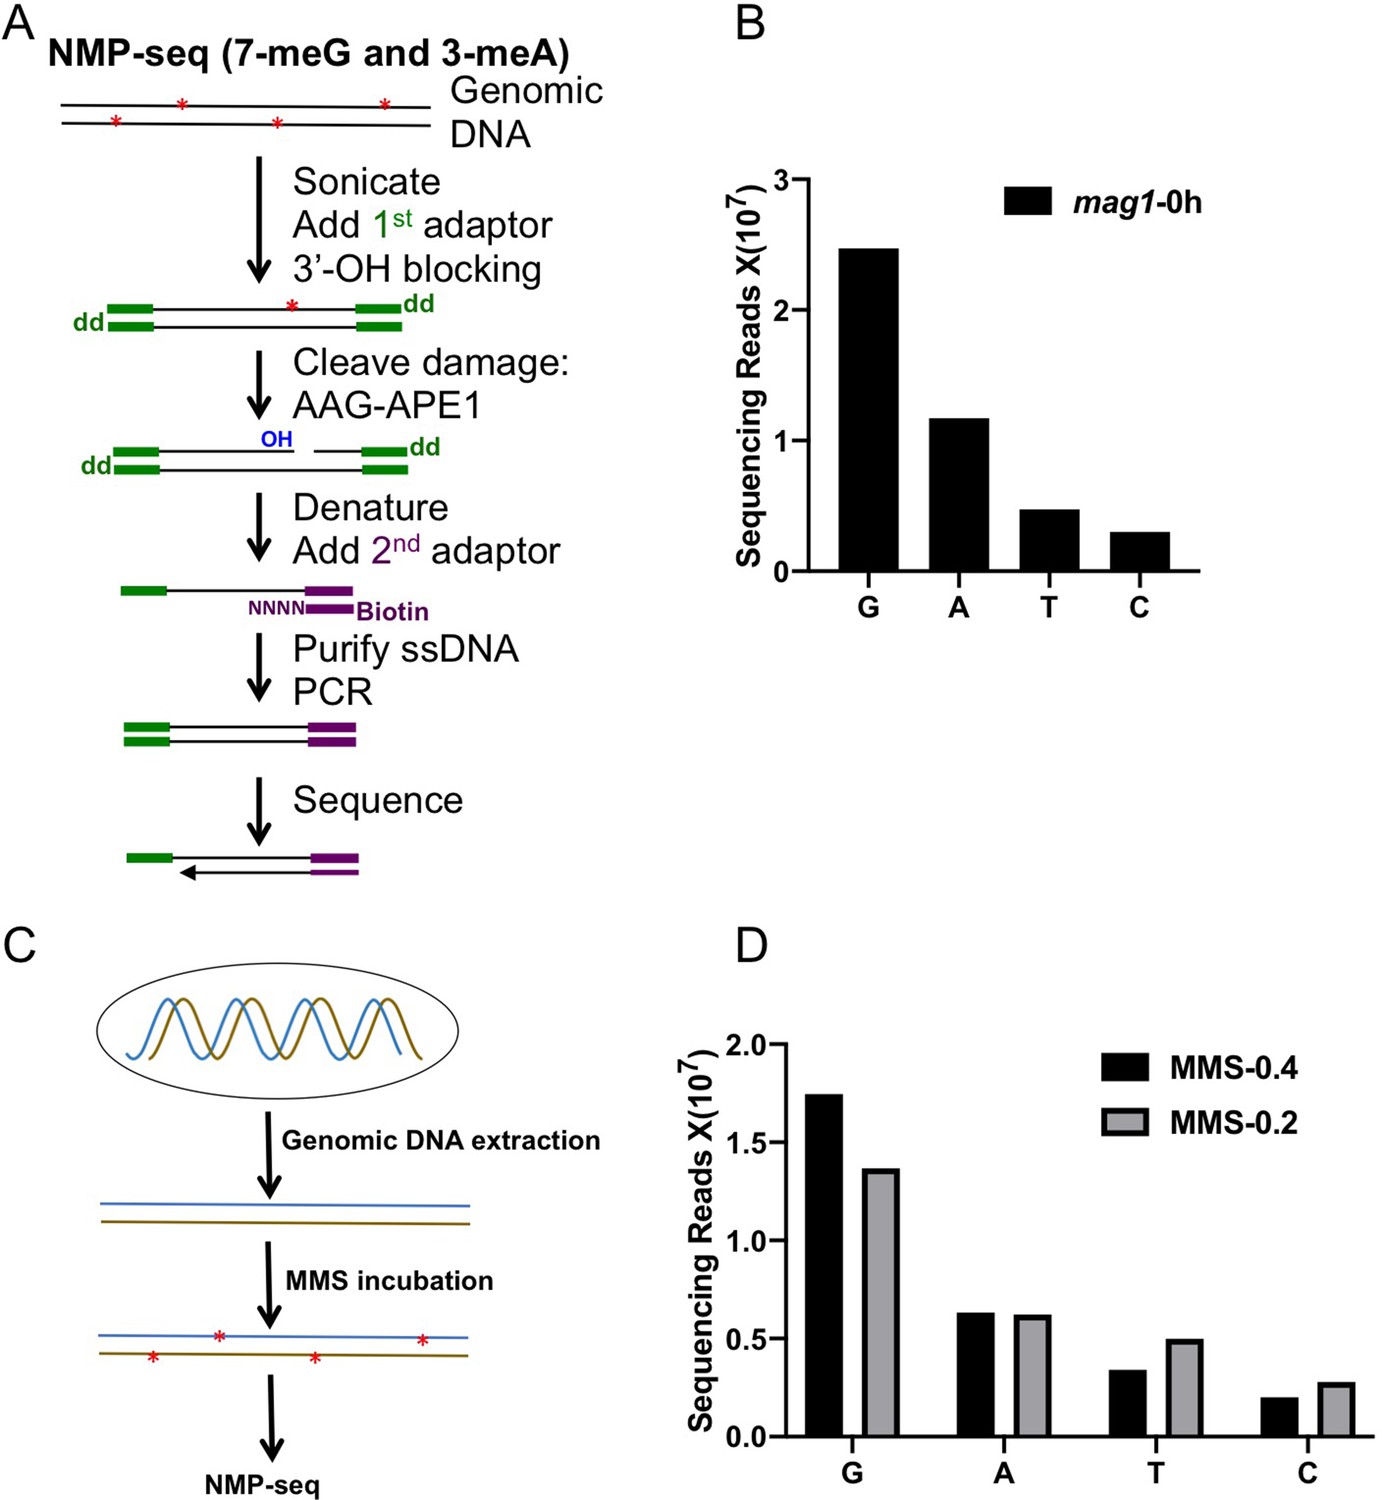
NMP-seq methodology and damage mapping in naked yeast genomic DNA.
(A) NMP-seq methodology. Genomic DNA was first sonicated to short fragments (~400 bp) and ligated to the 1st adaptor (green). After blocking all free 3’-OH groups with terminal transferase and dideoxy-ATP (dd), DNA fragments were digested with AAG and APE1 to generate a new nick with a ligatable 3’-OH group at the NMP damage site. After denaturing to obtain single-stranded DNA, the new 3’ end is ligated to a splint adaptor (2nd adaptor; purple) and the ligation occurs exactly at the damage site. The biotin on the 2nd adaptor allows purification of ligation product with the Streptavidin beads. The purified product is used as the template for PCR amplification, using primers complementary to the 1st and 2nd adaptors. The resulting library is sequenced on an Iron Torrent sequencer using a sequencing primer complementary to the 2nd adaptor. (B) NMP-seq read counts in MMS-treated mag1 cells (0.4% MMS for 10 min). (G) and (A) reads are associated with 7meG and 3meA lesions in the genome. (C) Schematic for damage mapping in naked yeast genomic DNA. It differs from mapping cellular NMP lesions by inducing damage in purified DNA, instead of cellular DNA bound by proteins. (D) NMP-seq read counts for naked genomic DNA treated with 0.4 or 0.2% of MMS for 10 min.
Figure 1—figure supplement 2
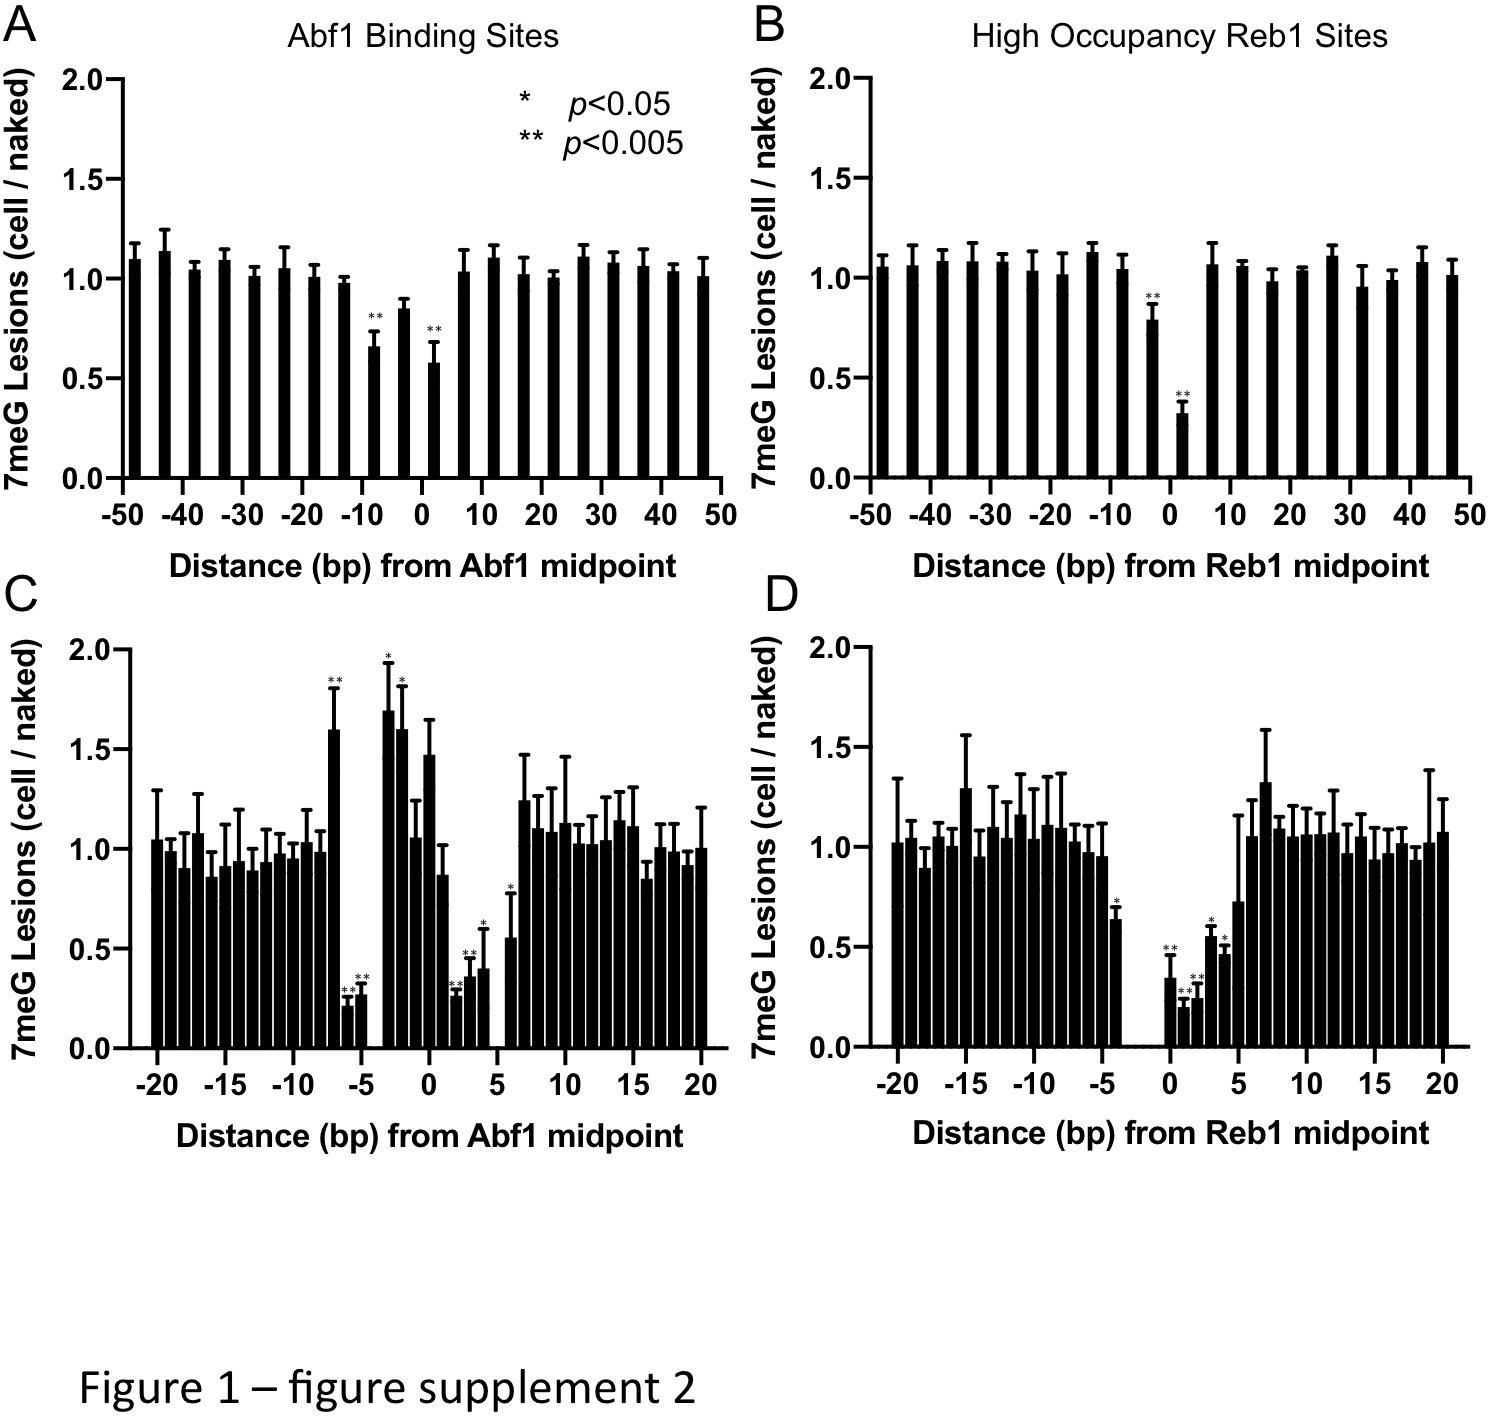
Statistical analysis of 7meG formation at TF binding sites and the flanking DNA.
(A) Formation of 7meG was significantly reduced at the central motif of Abf1 binding sites. Abf1 binding sites were randomly grouped into five bins and 7meG levels were analyzed in each bin. The average and standard deviation of 7meG formation among the five bins were shown in 5 bp moving windows. Details of the statistical analysis were described in Supplemental Materials and Methods. (B) Same as (A), but 7meG formation at ‘high-occupancy’ Reb1 sites was analyzed. (C) and (D) show the statistical analysis of 7meG at single nucleotide resolution for Abf1 and ‘high-occupancy’ Reb1 binding sites, respectively. Positions with significantly changed damage formation relative to the flanking region (i.e. first bar on the left) are labeled by *p<0.05 or **p<0.005.
Figure 1—figure supplement 3
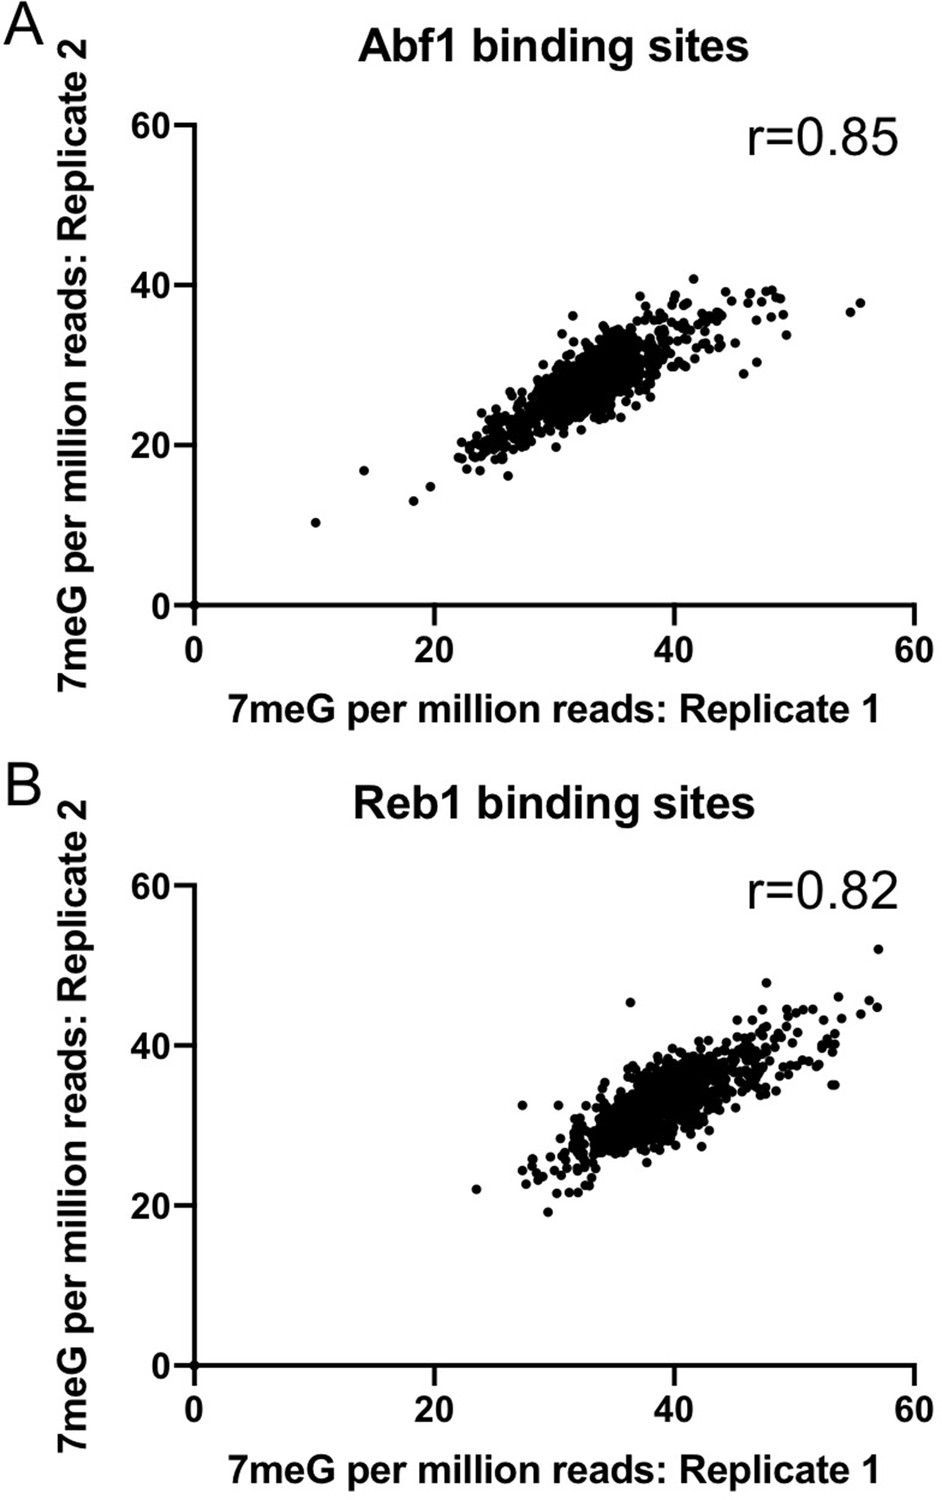
Reproducibility of two independent NMP-seq datasets generated in the mag1∆ strain.
Pearson correlation coefficient analysis of replicate 1 and replicate 2 was performed to test the reproducibility of NMP-seq data at Abf1 (A) and Reb1 (B) binding sites.
Figure 1—figure supplement 4
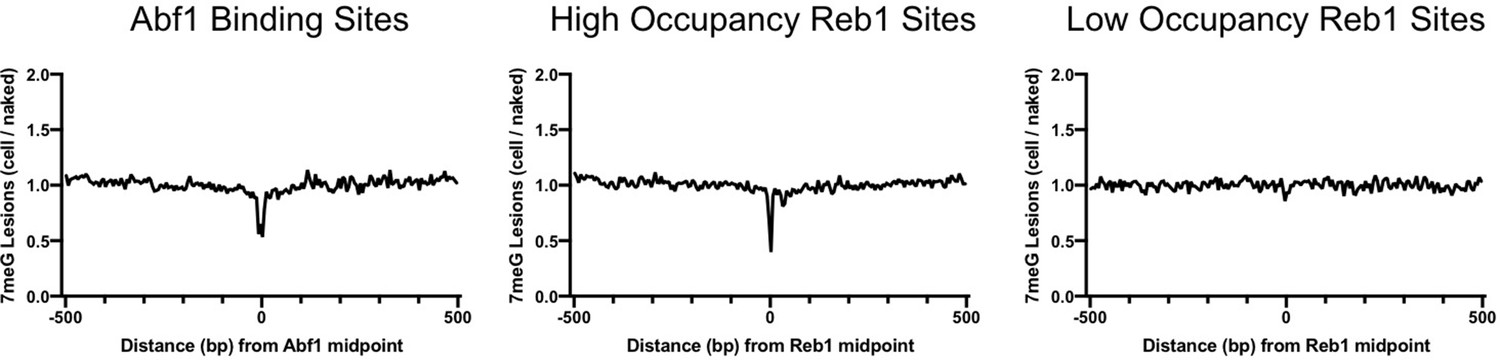
Independent repeat of 7meG formation at Abf1 and Reb1 binding sites in mag1∆ cells.
(A) The average cellular 7meG damage level (normalized to naked DNA) in a 5 bp non-overlapping moving window spanning 500 bp around the midpoint of Abf1, ‘high-occupancy’ Reb1, and ‘low-occupancy’ Reb1 sites. (B) Normalized 7meG damage levels at each individual position in the binding motif and its immediately adjacent DNA for Abf1, ‘high-occupancy’ Reb1, and ‘low-occupancy’ Reb1 sites.
Figure 1—figure supplement 5
Formation of 7meG in wild-type (WT) cells.
The average 7meG damage levels (normalized to naked DNA) in 5 bp moving windows in WT-0 h cells. These cells were treated with MMS and immediately harvested without repair incubation.
Figure 1—figure supplement 6
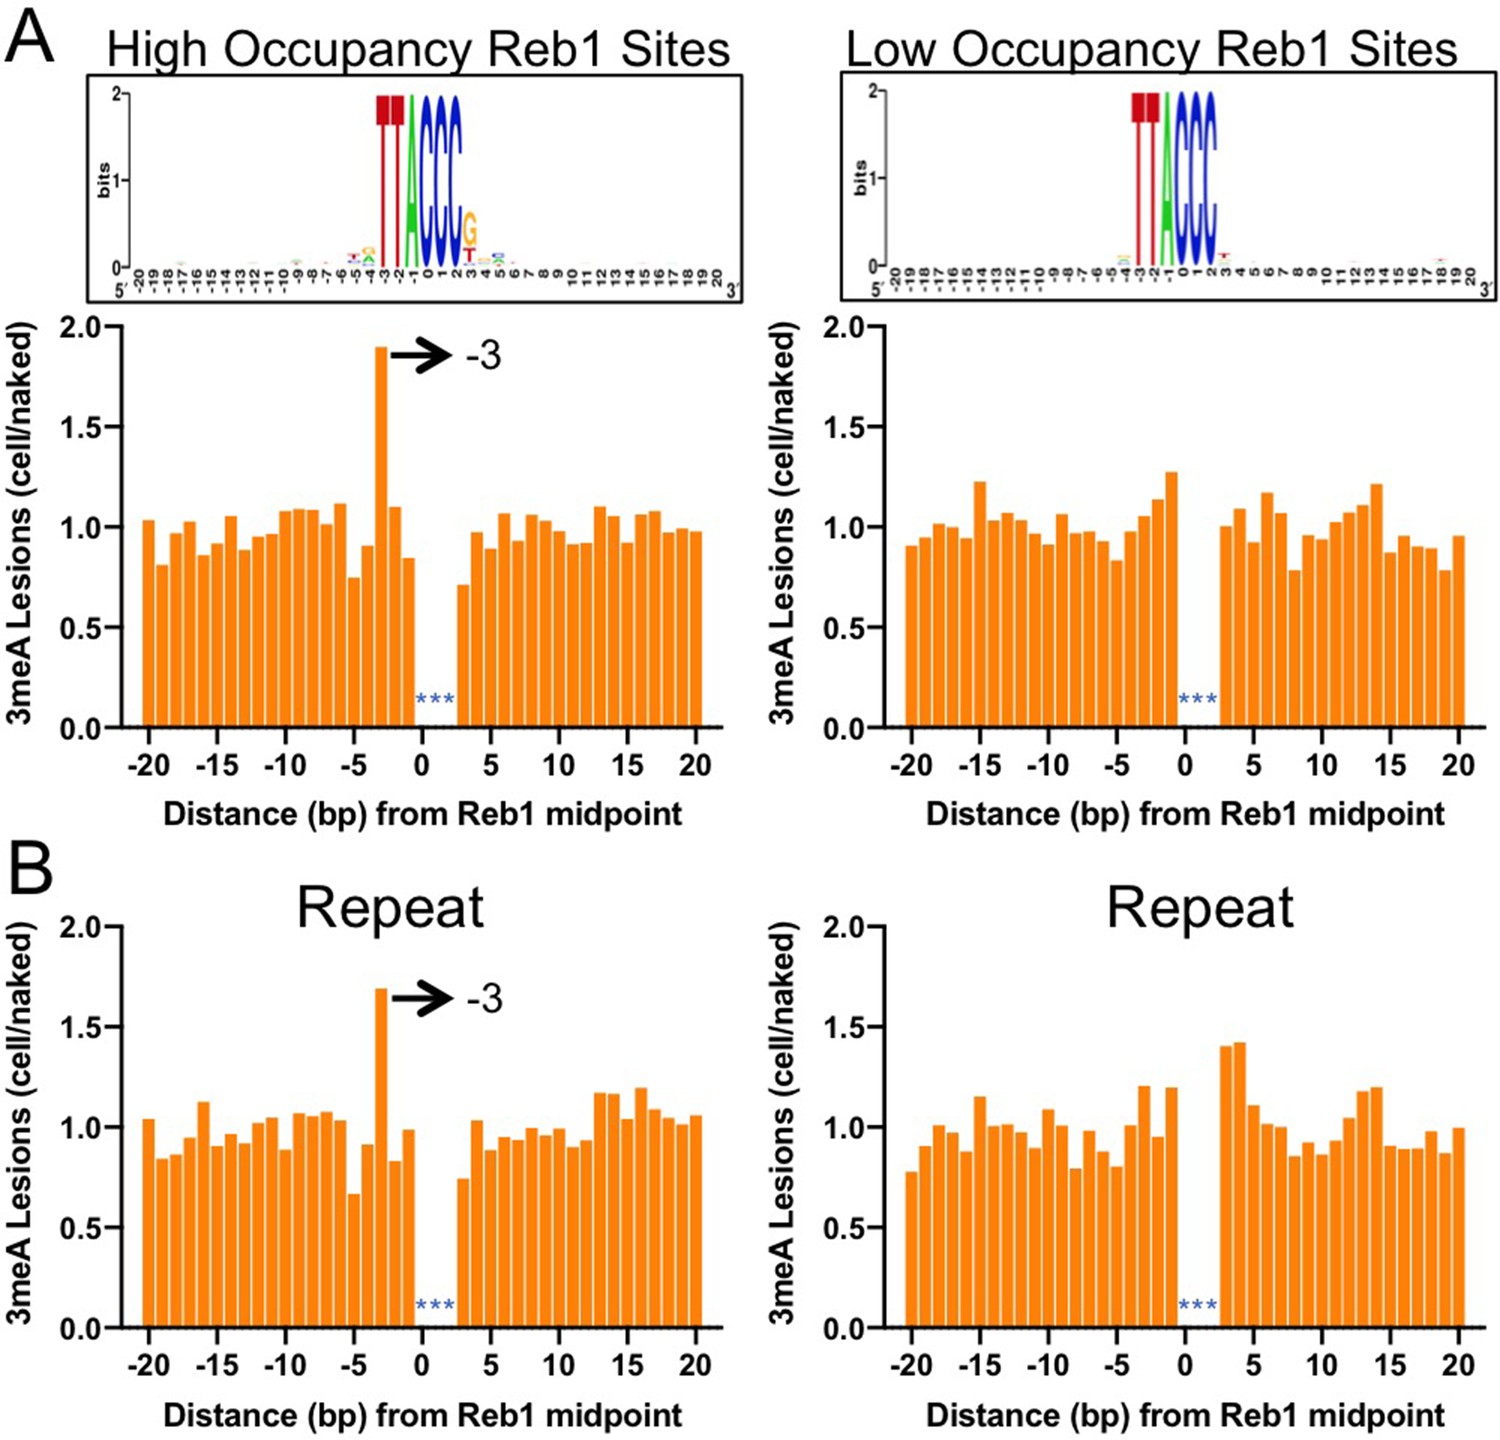
A hotspot of 3meA damage in the Reb1 motif.
(A) Left panel shows cellular 3meA reads (normalized to naked DNA) at ‘high-occupancy’ Reb1 binding sites. Right panel indicates 3meA reads at ‘low-occupancy’ Reb1 binding sites. Data was generated in the mag1 mutant cells. (B) An independent repeat of the NMP-seq experiment in mag1 cells showing high 3meA formation at the −3 position of Reb1 motif. Left and right panels show 3meA formation at ‘high-occupancy’ and ‘low-occupancy’ Reb1 binding sites, respectively.
Figure 2 with 3 supplements
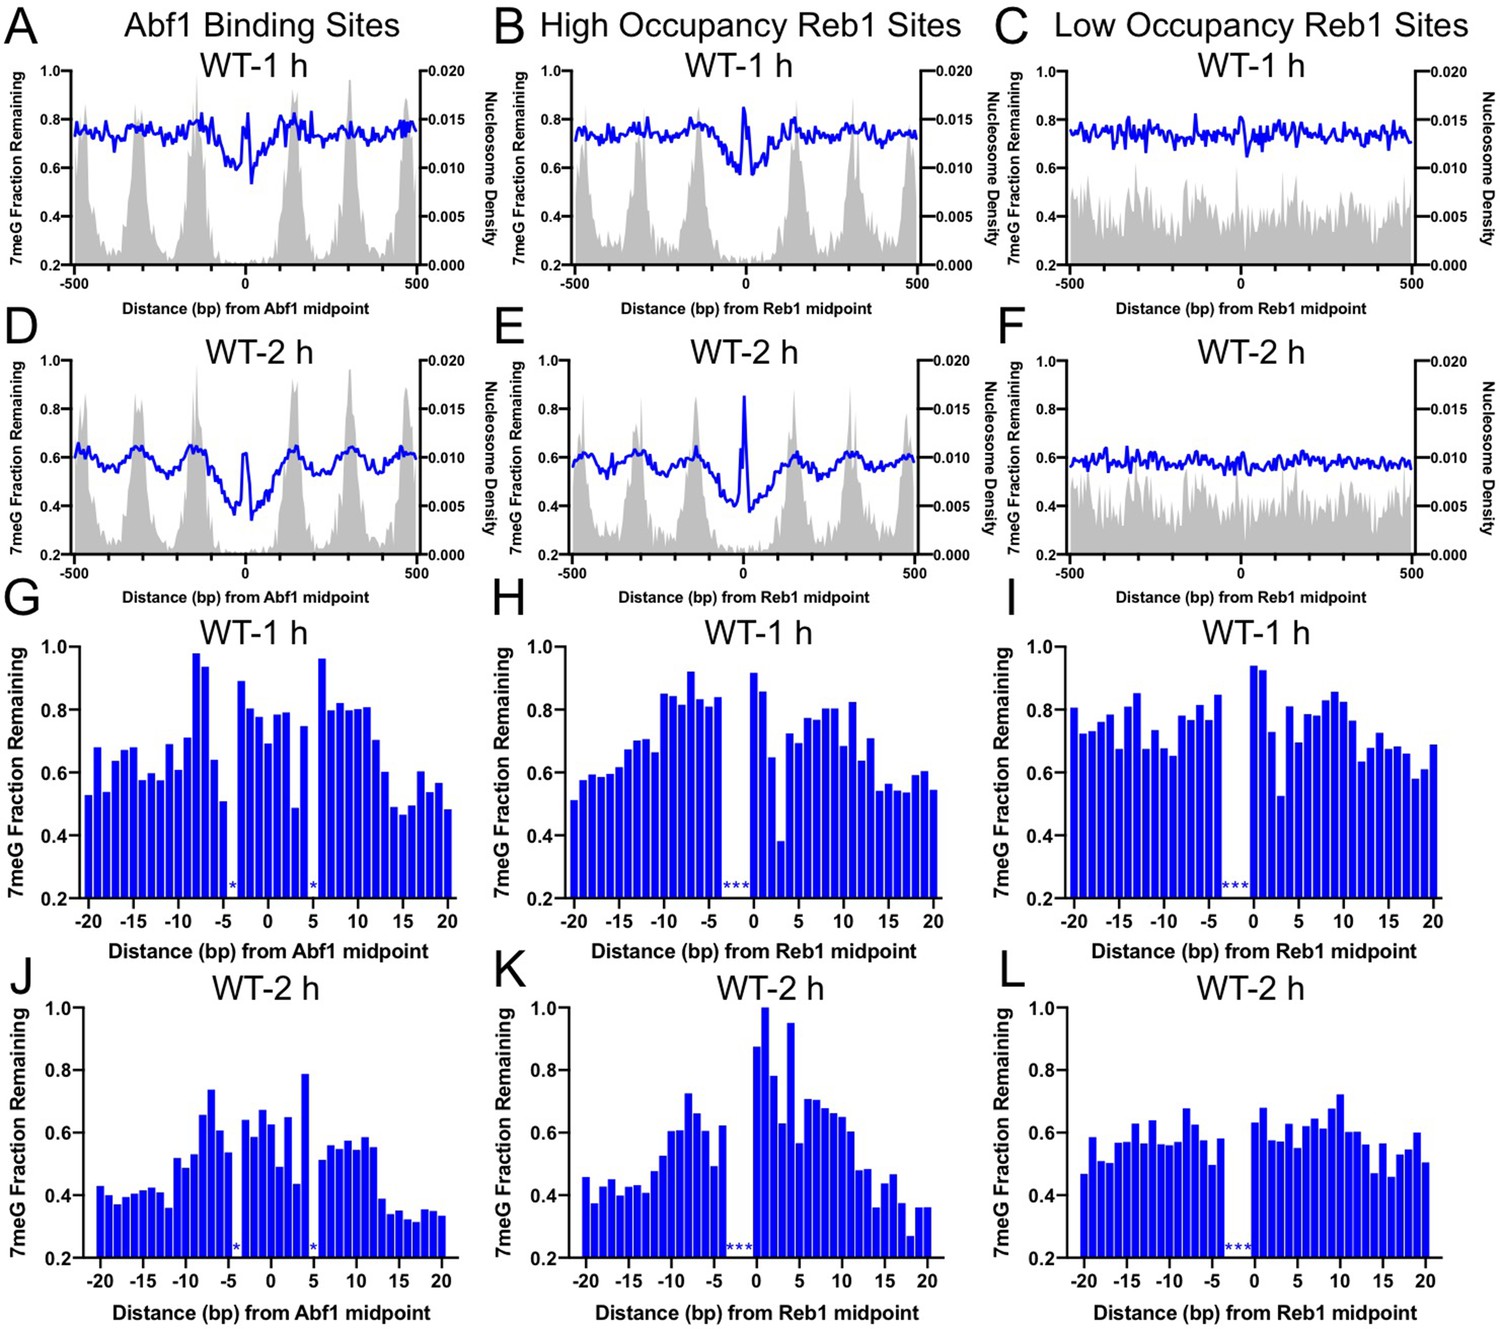
Base excision repair (BER) of 7meG lesions at ARS binding factor 1 (Abf1) and rDNA enhancer binding protein 1 (Reb1) binding sites.
(A) The fraction of remaining 7meG lesions (blue line) after 1 hr repair at Abf1 binding sites in WT cells. Remaining 7meG at the binding sites and in the flanking DNA (up to 500 bp in each direction) was shown. The binding sites were obtained from the published ORGANIC method (Kasinathan et al., 2014). The plot shows the average remaining damage in 5 bp non-overlapping moving windows. The nucleosome density, which was analyzed using the published yeast MNase-seq data (Weiner et al., 2015), was plotted as the gray background. (B) Repair of 7meG lesions at ‘high-occupancy’ Reb1 binding sites. Data shows fraction of remaining damage at 1 hr. (C) Fraction of remaining 7meG at ‘low-occupancy’ Reb1 binding sites at 1 hr. (D–F) Fraction of remaining 7meG lesions after 2 hr repair for Abf1, ‘high-occupancy’ Reb1, and ‘low-occupancy’ Reb1 binding sites, respectively. (G–I) High-resolution analysis of remaining 7meG after 1 hr repair at Abf1, ‘high-occupancy’ Reb1, and ‘low-occupancy’ Reb1 sites, respectively. Damage remaining between –20 and 20 bp relative to the TF motif midpoint was shown. (J) to (L) high-resolution analysis of remaining 7meG after 2 hr repair.
-
Figure 2—source data 1
Source data for remaining 7-methylguanine at Abf1 binding sites after 2 hr repair.
- https://cdn.elifesciences.org/articles/73943/elife-73943-fig2-data1-v2.xlsx
-
Figure 2—source data 2
Source data for remaining 7-methylguanine at Reb1 binding sites after 2 hr repair.
- https://cdn.elifesciences.org/articles/73943/elife-73943-fig2-data2-v2.xlsx
Figure 2—figure supplement 1
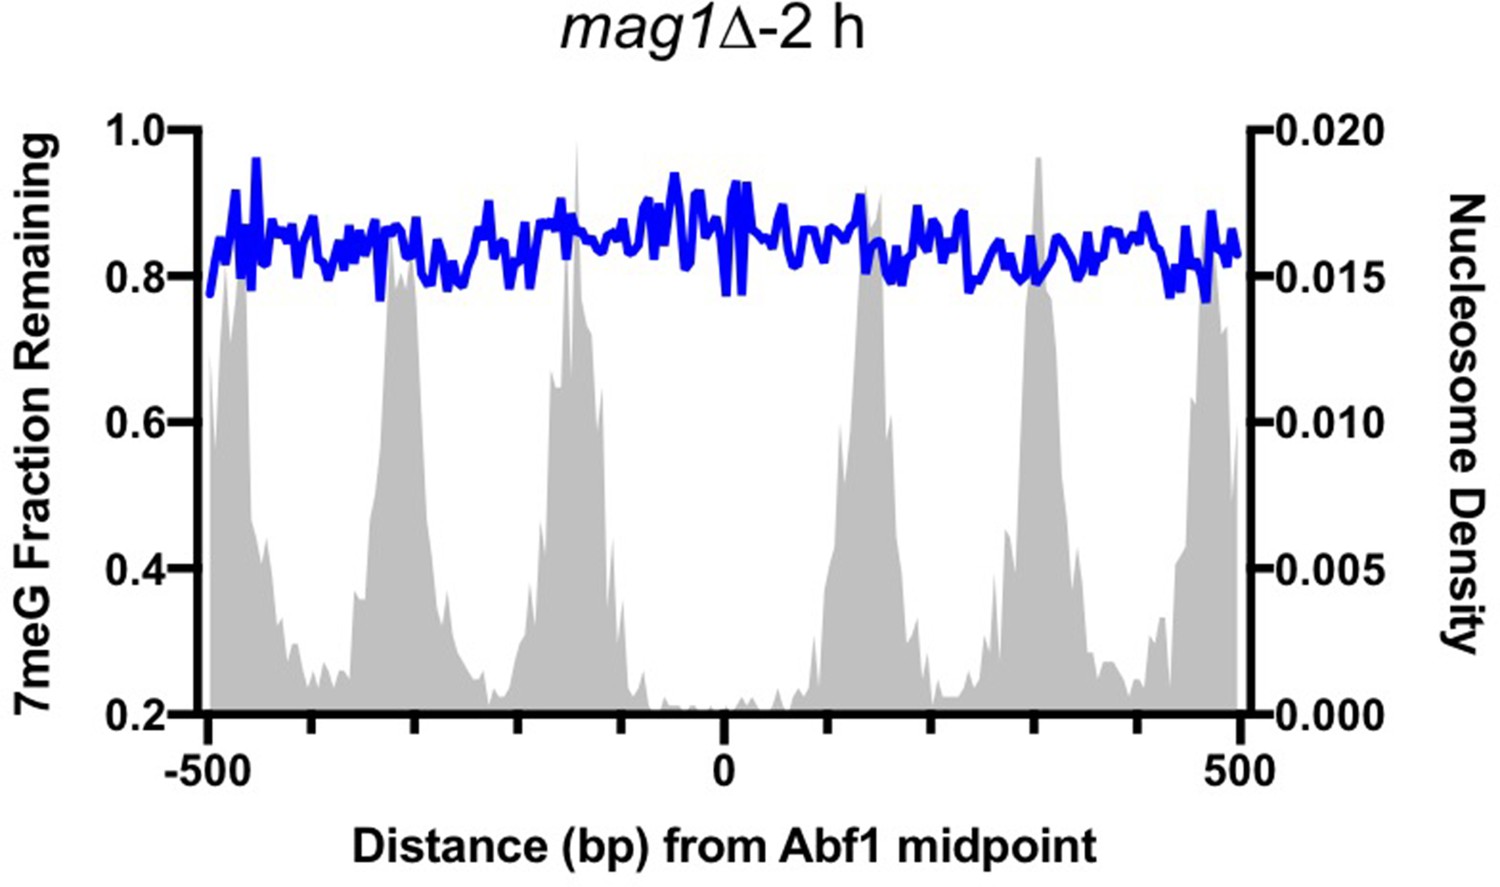
Repair of 7meG damage in base excision repair (BER)-deficient yeast cells (i.e. mag1∆).
Data shows average fraction of remaining damage at Abf1 binding sites after 2 hr repair incubation.
Figure 2—figure supplement 2
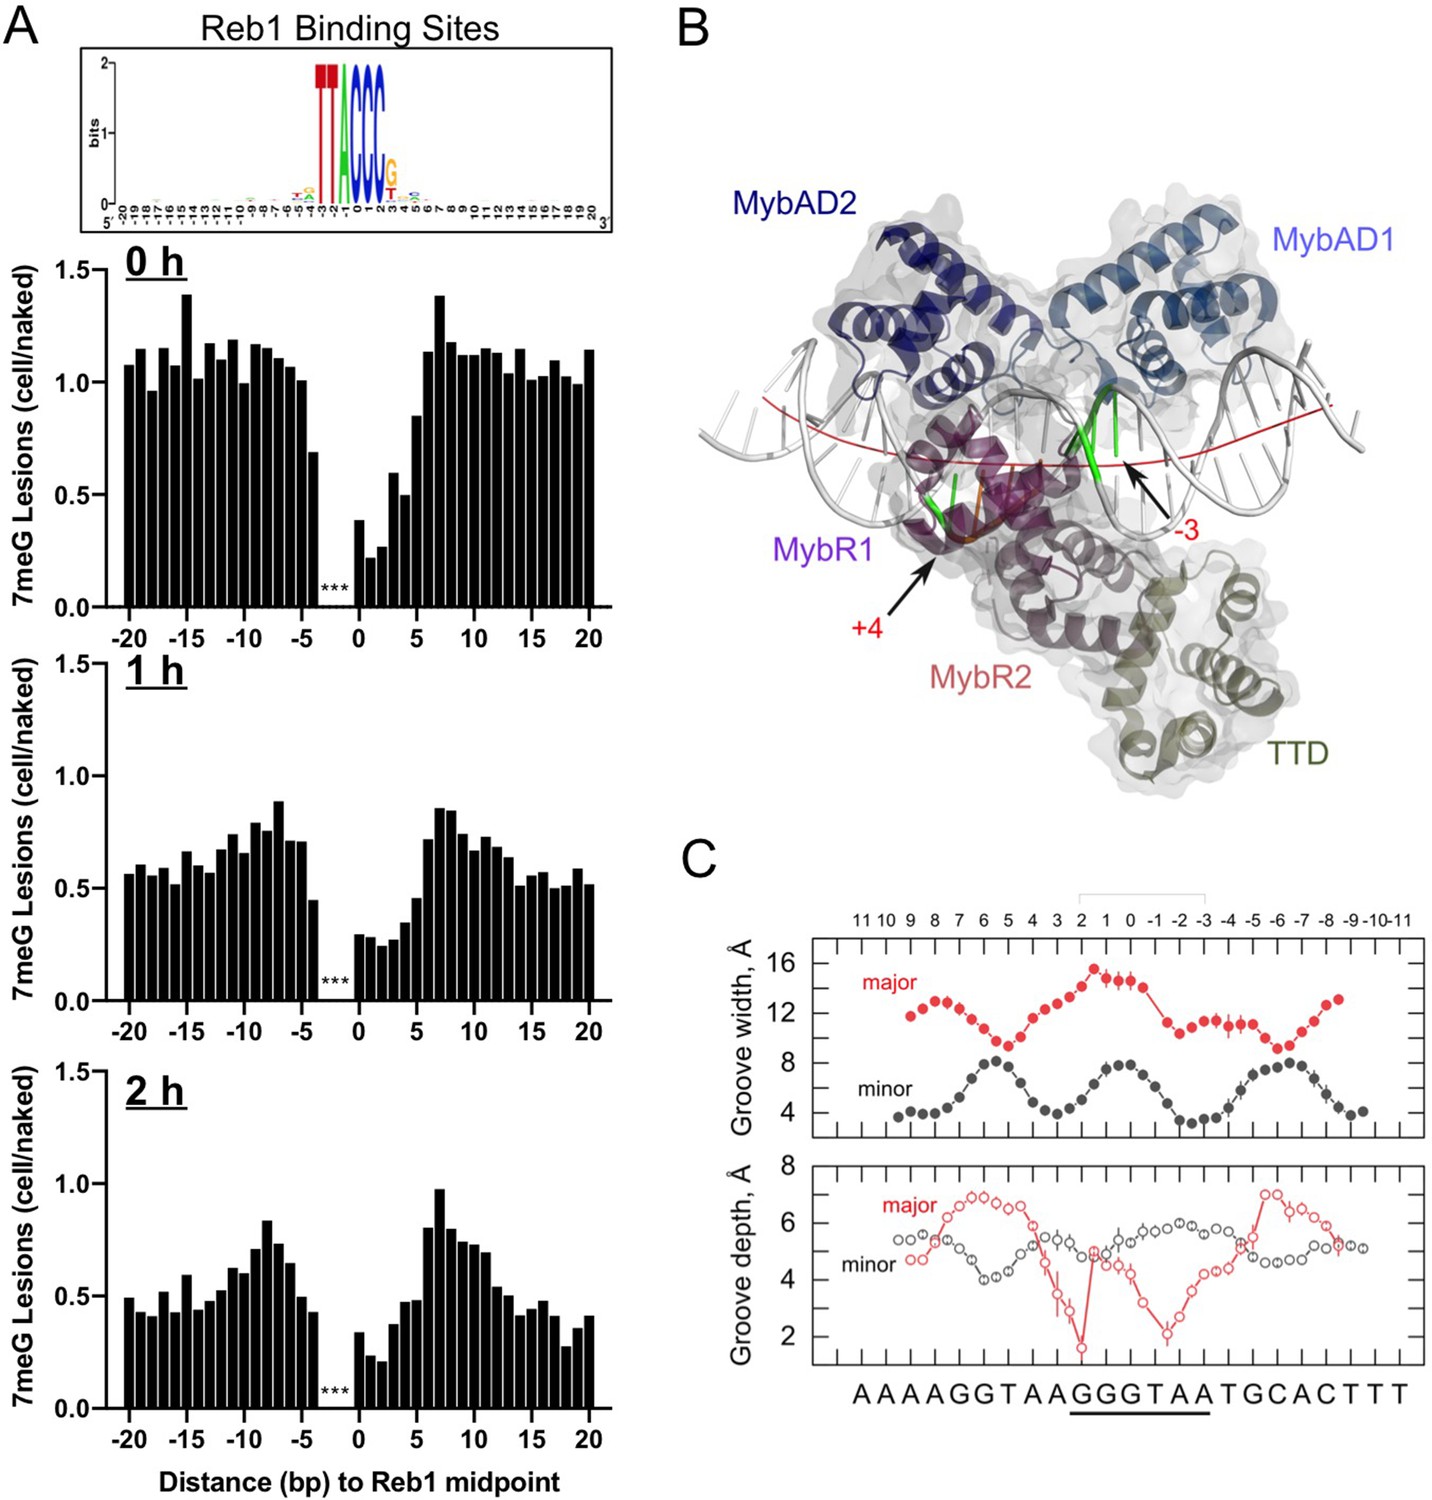
Summary of DNA damage, base excision repair (BER), and their correlation with the Reb1–DNA complex structure.
(A) High-resolution NMP-seq analysis at ‘high-occupancy’ Reb1 sites for initial damage (0 hr) and repair kinetics (1 hr and 2 hr repair). Graphs show average 7meG damage of Reb1 sites after normalization to naked DNA. Note: repair analysis is different from data shown in Figure 2 in that the remaining damage was normalized to naked DNA for this figure, not the 0 hr. (B) One of the Schizosaccharomyces pombe Reb1/DNA complexes in the co-crystal structure (PDB: 5eyb). The Reb1 DNA-binding domain (DBD) was colored by domain structure, with the C-terminal transcription termination domain (TTD) also shown. Positions –3 and +4 are highlighted. The fitted curvature in helical axis is shown in red. (C) Widths and depths of the major and minor grooves along Reb1-bound DNA (consensus is 5’-GGGTAA-3’), reported as averages ± SD for the two complexes in the asymmetric unit.
Figure 2—figure supplement 3
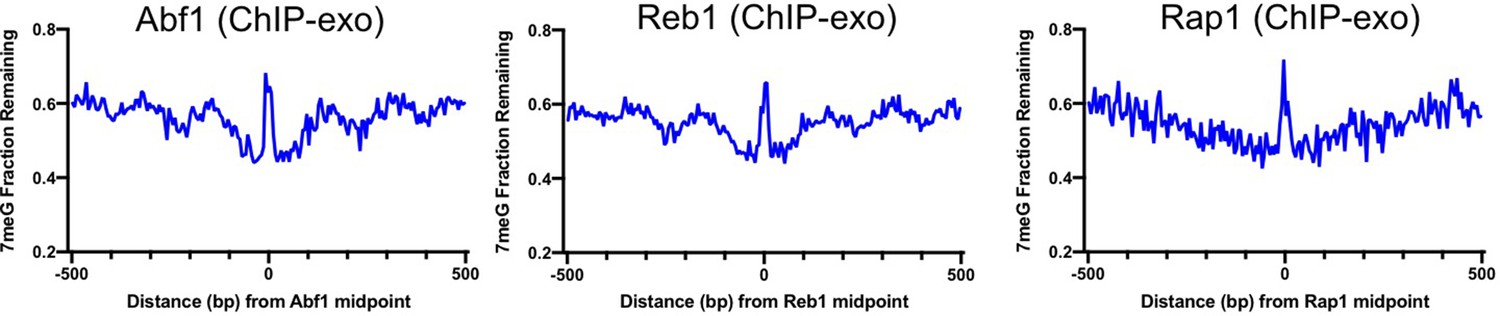
Inhibition of 7meG repair at transcription factor (TF) binding sites mapped by ChIP-exo.
Fraction of remaining 7meG lesions at 2 hr in WT cells at Abf1 (left), Reb1 (middle), and Rap1 (right) binding sites identified by ChIP-exo.
Figure 3 with 1 supplement
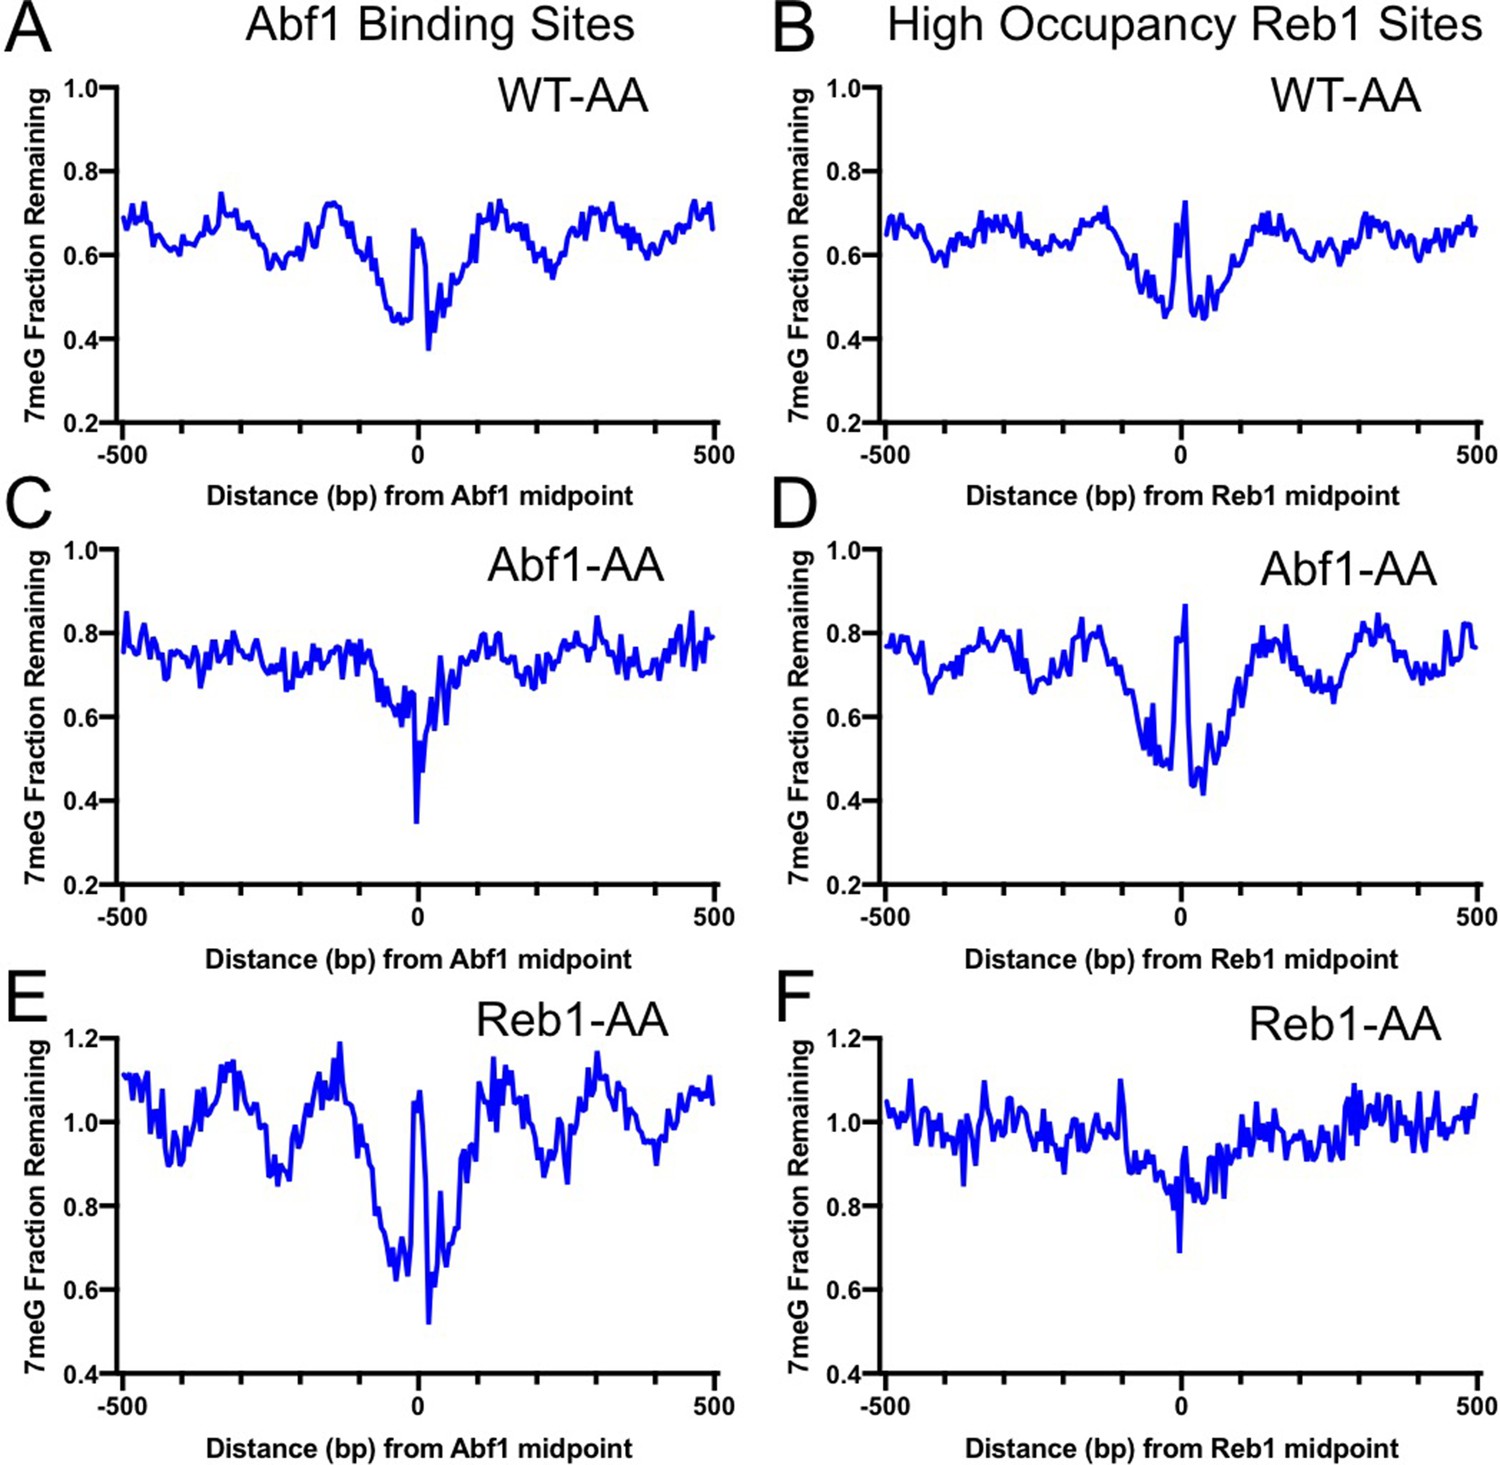
Base excision repair (BER) of 7meG lesions in anchor-away (AA) yeast strains.
(A) Fraction of remaining 7meG lesions after 2 hr repair (normalized to 0 hr) in rapamycin-treated WT-AA cells at Abf1 binding sites. (B) Remaining 7meG at ‘high-occupancy’ Reb1 binding sites in rapamycin-treated WT-AA cells. (C) and (D) Fraction of remaining 7meG at 2 hr in Abf1-AA cells after rapamycin treatment at Abf1 and ‘high-occupancy’ Reb1 sites, respectively. (E) and (F) Remaining 7meG at 2 h in Reb1-AA cells after rapamycin-mediated protein depletion at Abf1 and Reb1 sites.
Figure 3—figure supplement 1

Depletion of Abf1 or Reb1 restores 7meG damage formation at the corresponding binding sites in yeast.
(A) Lethality caused by Abf1 or Reb1 depletion on rapamycin-containing YPD plates. Yeast strains, WT-AA, Abf1-AA, and Reb1-AA, were grown on regular YPD or YPD with 1 μg/ml rapamycin. Pictures were taken after growing at 30°C for 72 hr. (B–D) Distribution of 7meG lesions at Abf1 (left) and Reb1 (right) binding sites in WT-AA, Abf1-AA, and Reb1-AA cells. All the three strains were pre-treated with rapamycin for 1 hr, followed by MMS treatment for 10 min. Damage was mapped with NMP-seq.
Figure 4 with 1 supplement

Repair of 7-methylguanine (7meG) in the ARS binding factor 1 (Abf1) and rDNA enhancer binding protein 1 (Reb1) target genes.
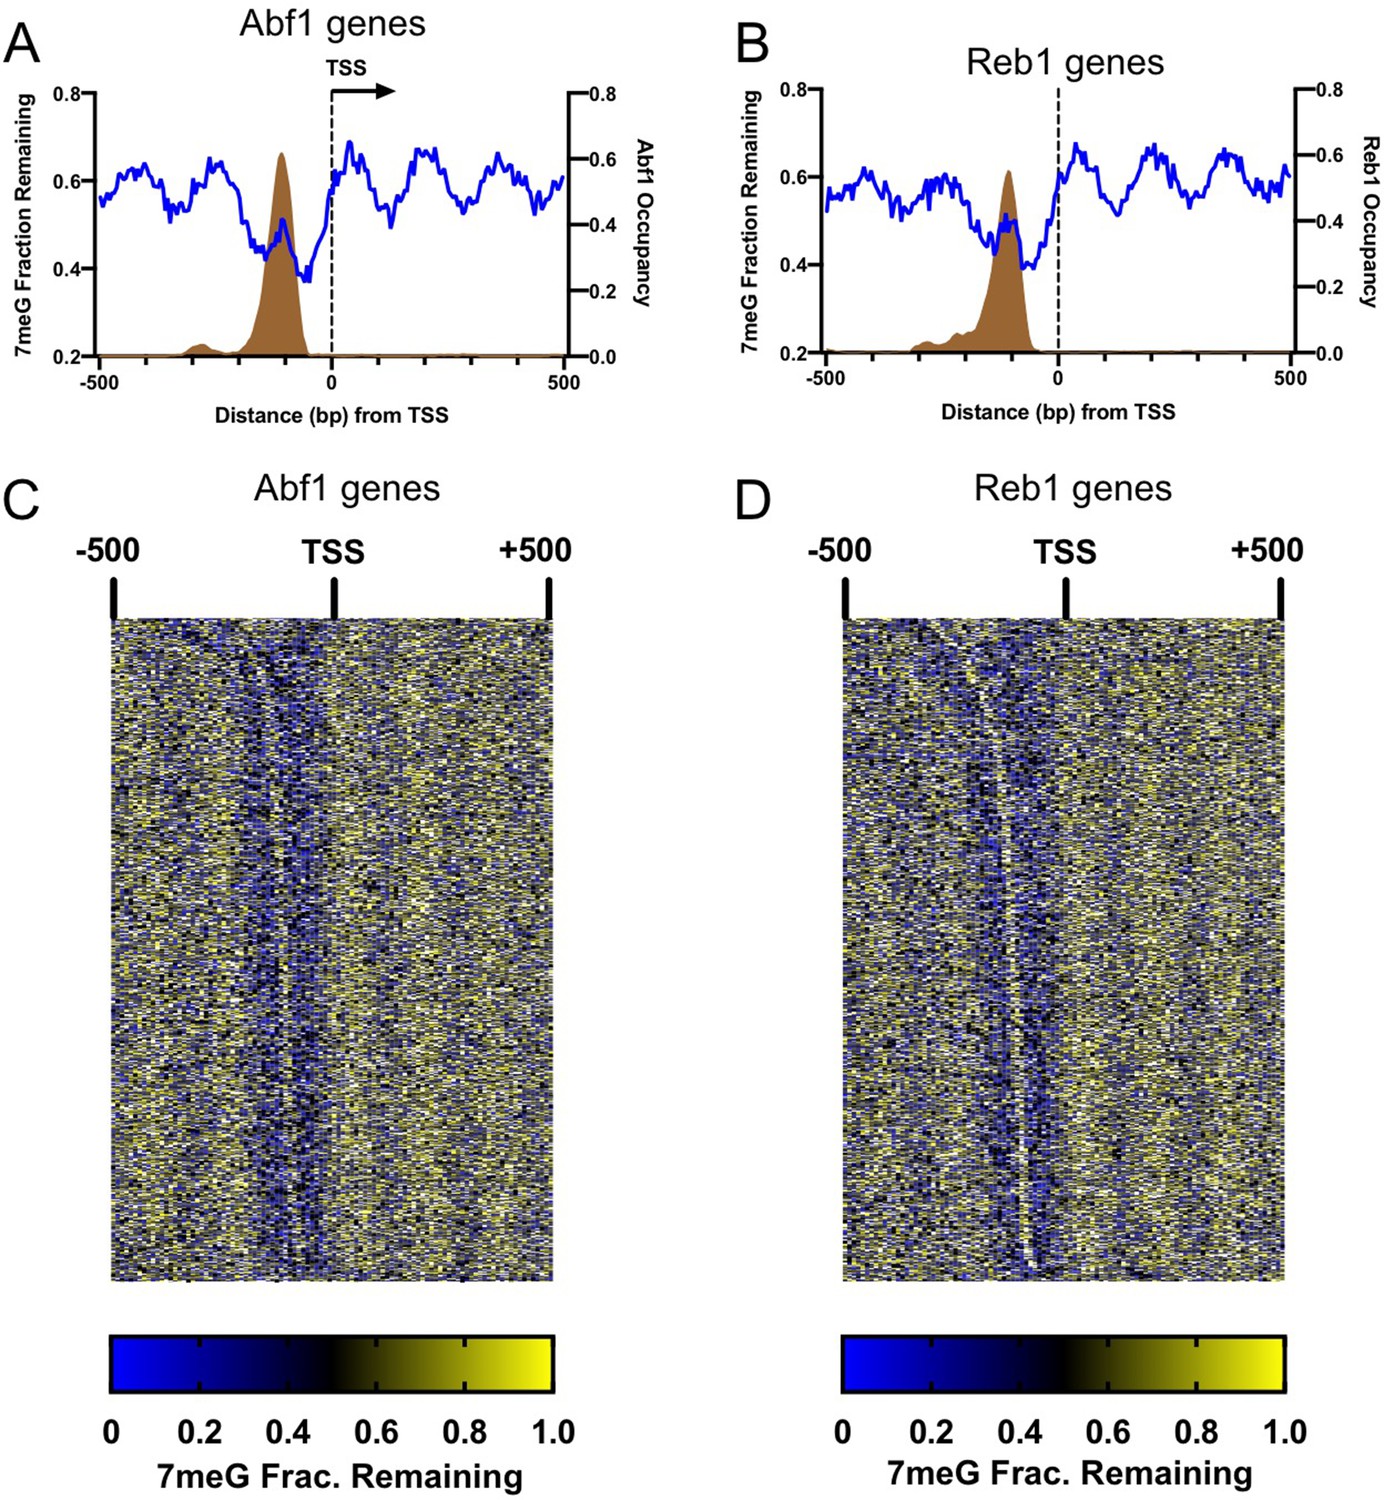
(A) Average fraction of remaining 7meG lesions (blue line) after 2 hr repair in all yeast genes in WT cells. Genes (n = 5205) were aligned at the TSS (position 0) and repair was plotted in accordance with gene transcriptional direction. The average damage in 5 bp moving windows is shown from upstream 500 bp to downstream 500 bp relative to the TSS. The gray background indicates nucleosome peak density. (B) Average fraction of remaining 7meG lesions after 2 hr repair in WT cells in Abf1-linked genes (n = 697). (C) Average fraction of remaining 7meG lesions after 2 hr repair in WT cells in Reb1-linked genes (n = 708). (D–F) Fraction of remaining 7meG at 2 hr in Abf1-depleted cells for all genes, Abf1-linked, and Reb1-linked genes. (G–I) Fraction of remaining 7meG at 2 h in Reb1-depleted cells for all genes, Abf1-linked, and Reb1-linked genes.
Figure 4—figure supplement 1
Damage peaks overlap with Abf1 or Reb1 binding sites in gene promoters.
(A) Remaining 7meG and Abf1 occupancy in Abf1-linked genes. Blue line indicates 7meG damage in WT-2 h cells and brown area depicts Abf1 occupancy. Abf1 occupancy was plotted using the published ORGANIC binding data. Genes were aligned at the (TSS), and repair and TF occupancy were analyzed from 500 bp upstream to 500 bp downstream relative to the TSS in the gene transcriptional direction. (B) Remaining 7meG and Reb1 occupancy in Reb1-linked genes. (C) Heat map of remaining 7meG after 2 hr repair (normalized to 0 hr) in each Abf1-linked gene. Genes were sorted by the distance between Abf1 binding sites and the TSS (e.g. genes with longer distance shown on the top of the heat map). Each row represents one gene and data shows remaining damage in each 10 bp bin. (D) Same as (C), but shows heat map of remaining damage in Reb1-linked genes.
Figure 5 with 1 supplement
Repair of 3-methyladenine (3meA) at transcription factor (TF) binding sites.
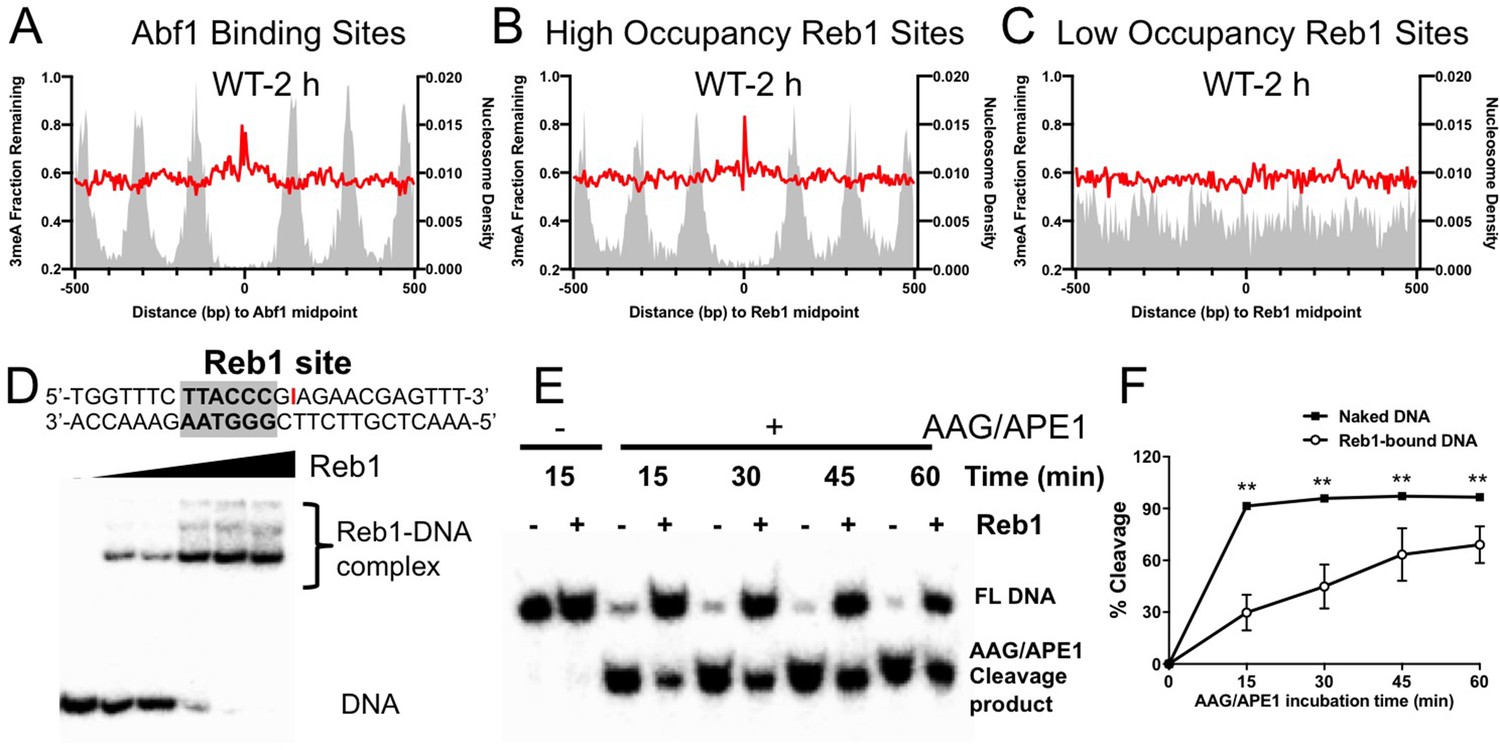
(A) Average fraction of remaining 3meA lesions (red line) at Abf1 binding sites mapped with the ORGANIC method. Data shows fraction of remaining 3meA lesions in 5 bp non-overlapping moving windows along the binding sites in WT cells at 2 hr. (B) and (C) fraction of remaining 3meA damage at ‘high-occupancy’ and ‘low-occupancy’ Reb1 binding sites, respectively. (D) The upper panel shows synthesized double-stranded DNA containing a Reb1 binding site. The inosine damage (red) was incorporated at the +4 position on the Reb1 motif strand. The lower panel shows gel shift data with DNA alone or DNA incubated with increasing amounts of purified Reb1 protein. DNA was labeled with 32P on the 5’ end of the motif strand. (E) Cleavage of the inosine-containing DNA or DNA complexed with Reb1 protein by AAG/APE1 enzymes. The substrates (naked DNA or DNA-Reb1 complex) were incubated with AAG and APE1 enzymes to cleave the damage site. DNA was analyzed on denaturing polyacrylamide gels to separate the full-length DNA (FL DNA) and the cleavage product. (F) Quantification of the repair gels. Graph shows the percent of cleaved DNA (lower band) relative to total DNA (lower and upper bands) at different incubation time points. Average cleavage and standard deviation from four independent repair experiments are shown (**p<0.005 by t-tests).
-
Figure 5—source data 1
Unedited gel shift data showing binding of Reb1 protein to DNA.
- https://cdn.elifesciences.org/articles/73943/elife-73943-fig5-data1-v2.docx
-
Figure 5—source data 2
Cleavage of the inosine-containing DNA or DNA complexed with Reb1 protein.
Four independent repair gels are included in this source data.
- https://cdn.elifesciences.org/articles/73943/elife-73943-fig5-data2-v2.docx
-
Figure 5—source data 3
Gel shift data showing Reb1 binding to undamaged (top) and damaged (bottom) DNA.
- https://cdn.elifesciences.org/articles/73943/elife-73943-fig5-data3-v2.docx
-
Figure 5—source data 4
Gel shift data showing Reb1 binding to DNA (damage is incorporated into the bottom strand).
- https://cdn.elifesciences.org/articles/73943/elife-73943-fig5-data4-v2.docx
-
Figure 5—source data 5
Cleave of inosine-containing DNA (naked DNA) or DNA bound by Reb1 by AAG/APE1.
The damage was placed at the +4 position of the non-motif strand.
- https://cdn.elifesciences.org/articles/73943/elife-73943-fig5-data5-v2.docx
Figure 5—figure supplement 1
Repair inhibition at the +4 position of Reb1 binding sites.
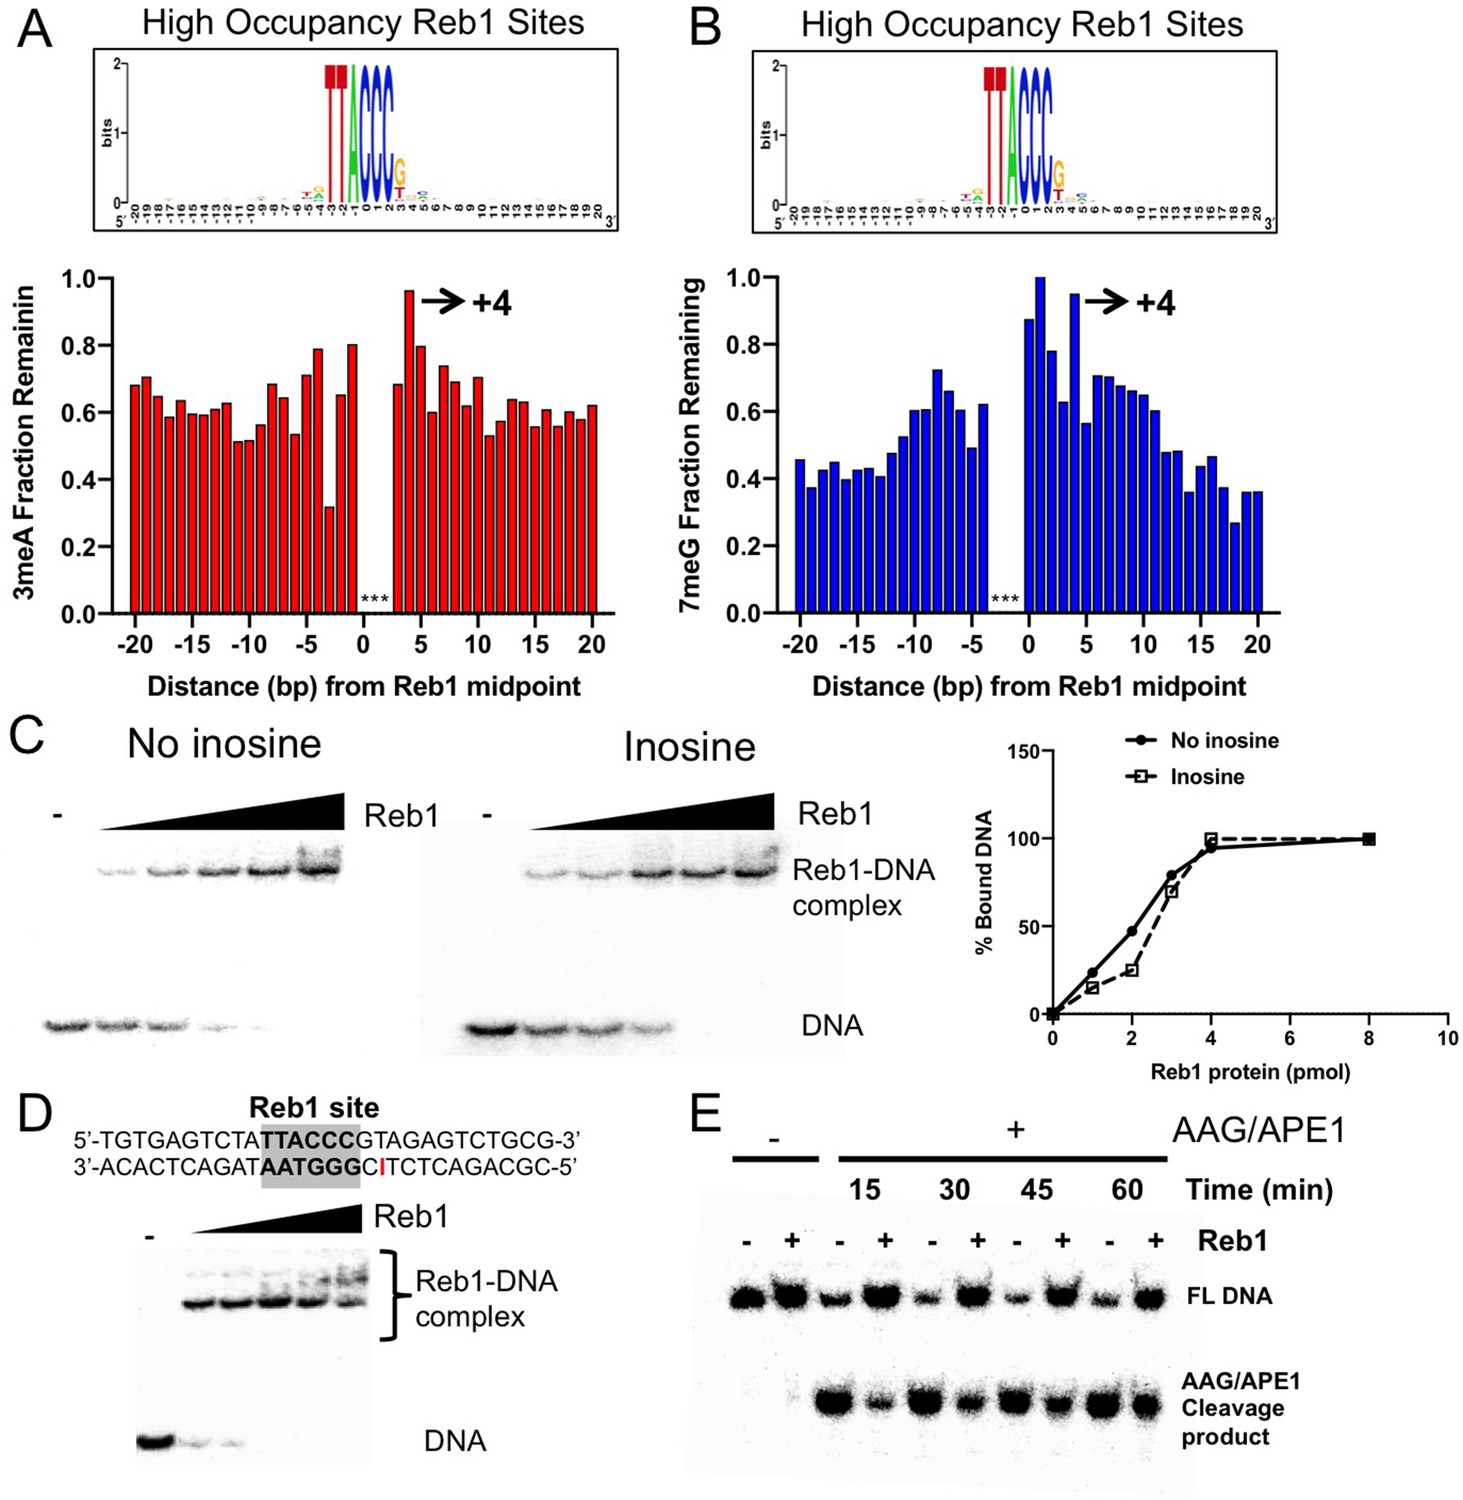
(A) Fraction of remaining 3meA damage at ‘high-occupancy’ Reb1 binding sites. Each bar indicates one nucleotide position in the binding motif and its adjacent DNA. The consensus motif sequence is shown on the top. (B) Fraction of remaining 7meG damage at ‘high-occupancy’ Reb1 binding sites. (C) Gel shift assays analyzing binding of synthesized double-stranded oligonucleotides with purified Reb1 protein. Left: DNA without damage. Middle: DNA containing inosine at the +4 position. Right: quantification of EMSA gels. (D) The top panel shows DNA substrate with an inosine incorporated at the +4 position on the non-motif strand. The lower panel shows binding between the DNA and Reb1 protein. (E) Cleave of inosine-containing DNA (naked DNA) or DNA bound by Reb1 by AAG/APE1. The damage was placed at the +4 position of the non-motif strand.
Figure 6
Comparison of cyclobutane pyrimidine dimer (CPD) and 7-methyladenine (7meG) repair at transcription factor (TF) binding sites.
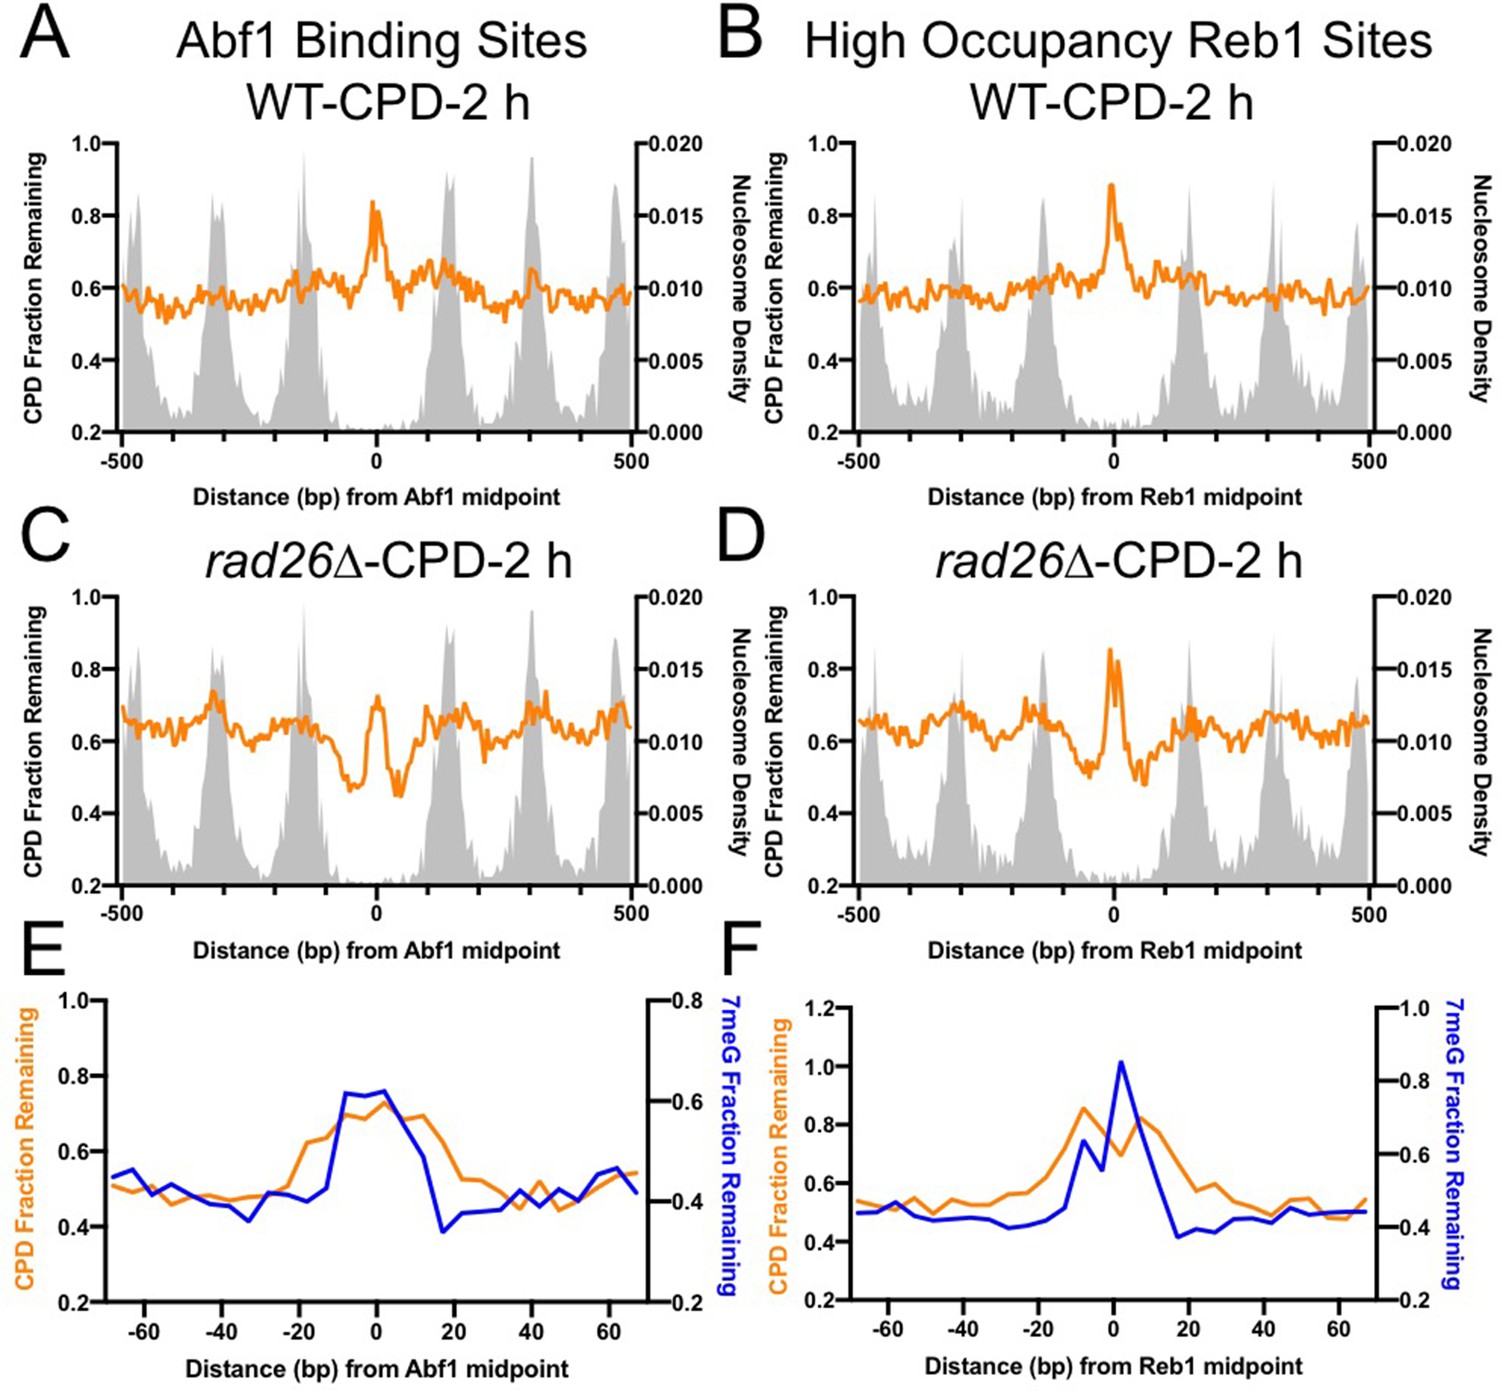
(A) Fraction of remaining CPDs at Abf1 binding sites in WT-2 hr cells. Similar to NMP-seq data analysis, the number of CPD-seq reads at 2 hr was normalized to initial damage reads at 0 hr. The resulting fraction of remaining CPDs was plotted at Abf1 binding sites and flanking DNA up to 500 bp. The average remaining damage in 5 bp non-overlapping moving windows was shown. (B) Fraction of remaining CPDs was analyzed at ‘high-occupancy’ Reb1 binding sites. (C) Fraction of remaining CPDs at Abf1 binding sites in the rad26Δ mutant strain, in which CPD repair is mainly conducted by GG-NER. (D) Fraction of remaining CPDs at Reb1 binding sites in the rad26Δ mutant cells. (E) and (F) comparison between GG-NER (orange line) and BER (blue line) at Abf1 and Reb1 binding sites, respectively. GG-NER was analyzed using CPD-seq data (2 hr relative to 0 hr) generated in rad26Δ cells. BER analysis was conducted with NMP-seq data.
Author response image 1

Damage levels at 0, 1, and 2 hr for Abf1 binding sites plotted in the same graph.
Additional files
-
Transparent reporting form
- https://cdn.elifesciences.org/articles/73943/elife-73943-transrepform1-v2.pdf
-
Source code 1
Mapping NMP-seq reads to yeast reference genome and identify the lesion site.
The code consists of the bioinformatics pipeline using bowtie2, samtools, and bedtools to identify NMP lesions in the yeast genome.
- https://cdn.elifesciences.org/articles/73943/elife-73943-code1-v2.zip
-
Source code 2
Intersect NMP-seq lesions with yeast nucleosomes and TFBSs.
The code uses the intersect function of bedtools to identify NMP lesions in yeast nucleosomes and TF binding sites.
- https://cdn.elifesciences.org/articles/73943/elife-73943-code2-v2.zip
Download links
A two-part list of links to download the article, or parts of the article, in various formats.
Downloads (link to download the article as PDF)
Open citations (links to open the citations from this article in various online reference manager services)
Cite this article (links to download the citations from this article in formats compatible with various reference manager tools)
High-resolution mapping demonstrates inhibition of DNA excision repair by transcription factors
eLife 11:e73943.
https://doi.org/10.7554/eLife.73943


