Global cellular response to chemical perturbation of PLK4 activity and abnormal centrosome number
- Lunenfeld-Tanenbaum Research Institute, Sinai Health System, Canada
- Department of Molecular Genetics, University of Toronto, Canada
Figures
Figure 1 with 1 supplement

Concentration-dependent effect of centrinone B on centriole number.
(A) RPE-1 cells were serially grown for 12 days and treated with DMSO or the indicated concentration of centrinone B. Relative cell number compared to a DMSO-treated control was determined and plotted. Three independent replicates plotted with mean with standard deviation shown. Significant p-values (<0.05) from Dunnett post hoc test using ‘DMSO’ as control after one-way ANOVA shown. (B) RPE-1 cells were treated with DMSO or 200 or 500 nM centrinone B for 4 days and prepared for Western blot probing for the indicated proteins. Ponc.S indicates total protein. (C) RPE-1 cells were treated as in (B), fixed for immunofluorescence and stained for p53. (D) RPE-1 cells were treated as in (B), fixed for immunofluorescence and stained for CEP135. Examples of cells with no centrosomes or one centrosome are shown. Inset magnified 3×. See Figure 1—source data 1.
-
Figure 1—source data 1
Source data for Figure 1.
- https://cdn.elifesciences.org/articles/73944/elife-73944-fig1-data1-v1.xlsx
Figure 1—figure supplement 1
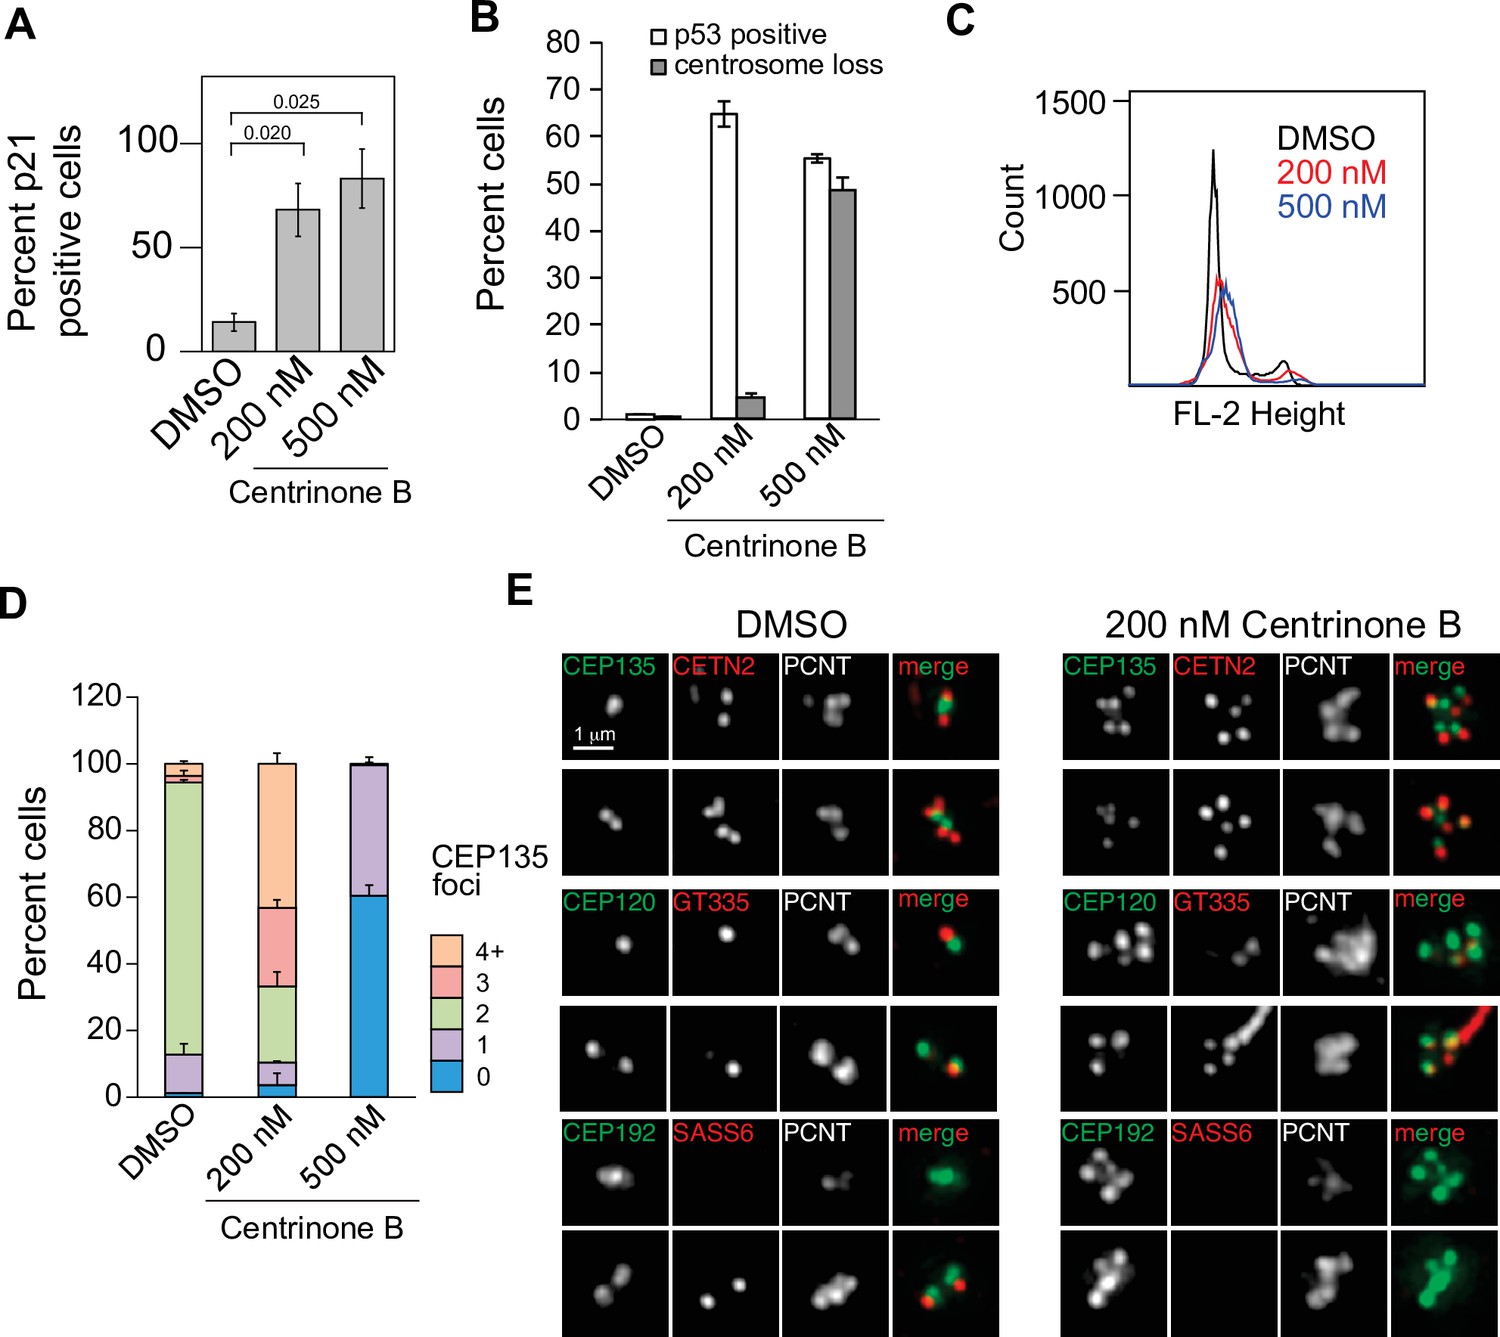
Characterization of growth arrest and centriole abnormalities after PLK4 inhibition.
(A) RPE-1 cells were treated with DMSO, or 200 or 500 nM centrinone B for 4 days. Fixed cells were immunostained for p21 and the percent p21-positive cells was quantified. Mean and standard deviation shown (n=2, N≥100). Significant p-values (<0.05) from Dunnett post hoc test using 'DMSO' as control after a one-way ANOVA are shown. (B) Cells prepared as in Figure 1C were automatically analyzed for nuclear p53 or manually scored for the presence or absence of CEP135 foci. Mean and standard deviation shown (n=3, N≥100). (C) RPE-1 cells treated as in (A) were fixed, stained with propidium iodide, and subjected to flow cytometry to analyze DNA content. The results from a representative experiment are shown. (D) Cells prepared as in Figure 1D were manually scored for CEP135 foci. Means and standard deviation shown (n=3, N≥100). (E) RPE-1 cells treated with DMSO or 200 nM centrinone B for 4 days were fixed and stained for the indicated proteins. Two representative images per condition are shown. See Figure 1—figure supplement 1—source data 1.
-
Figure 1—figure supplement 1—source data 1
Source data for Figure 1—figure supplement 1.
- https://cdn.elifesciences.org/articles/73944/elife-73944-fig1-figsupp1-data1-v1.xlsx
Figure 2 with 2 supplements
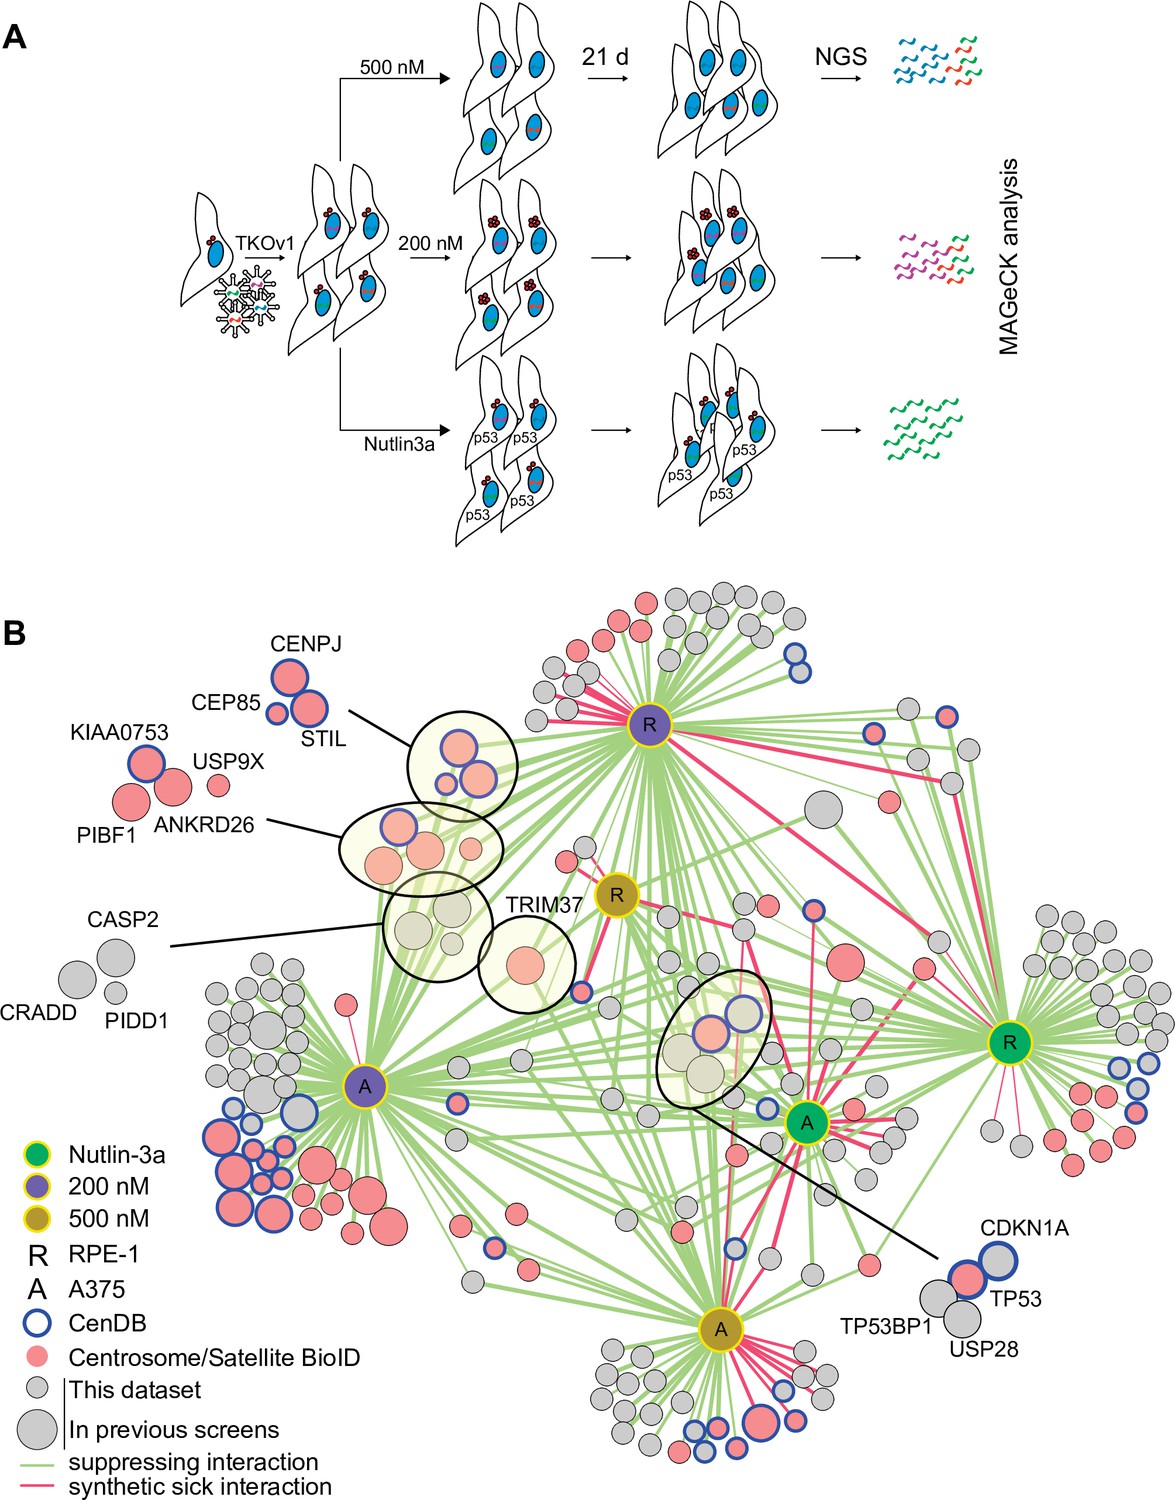
CRISPR/Cas9 screen to interrogate response to abnormal centrosome number.
(A) Schematic outlining our screening procedures. Cells expressing Cas9 were infected with the TKOv1 genome-wide CRISPR sgRNA library and subsequently grown for 21 days in the presence of DMSO, 200 nM centrinone B, 500 nM centrinone B, or 600 nM Nutlin-3a. Genomic DNA was prepared and sgRNA counts in each pool of cells were determined using next-generation sequencing (NGS) and analyzed using model-based analysis of genome-wide CRISPR-Cas9 knockout (MAGeCK). Screens were performed in technical triplicate. (B) The significant hits (p<0.05) from all screens were combined to form a network. Each unique cell and drug combination used for screening were set as hubs (i.e., RPE-1 200 nM centrinone B). All other nodes represent genes identified. Edges connect identified genes with a screening condition with edge weight inversely proportional to false discovery rate (FDR). The general layout using the automated yFiles organic method from Cytoscape was preserved while individual nodes were manually arranged to facilitate visualization. Selected complexes and protein nodes are circled and highlighted. Except for the hubs, large nodes represent genes identified by previous PLK4 inhibition screens (see Supplementary file 1).
Figure 2—figure supplement 1
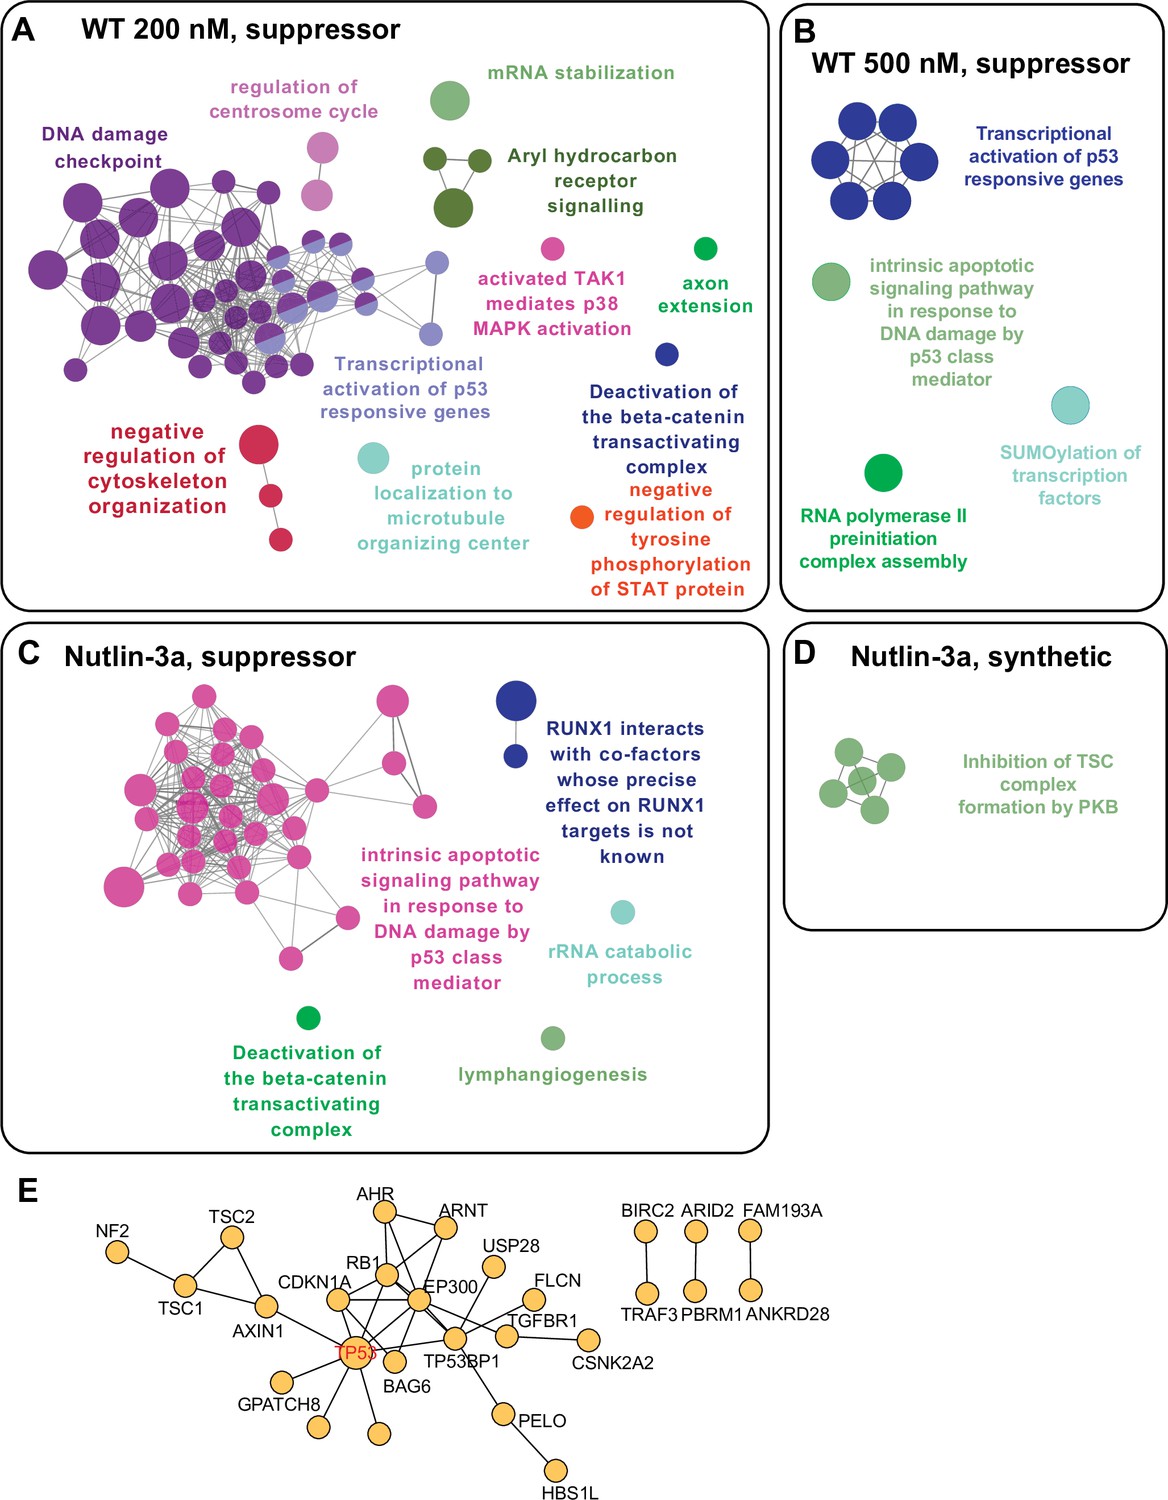
Bioinformatic analysis of CRISPR/Cas9 screens.
(A–D) Biological process enrichment from significant genes scoring in each screen using RPE-1 cells. Screen type indicated in each figure. (E) Protein-protein interaction network of genes identified as suppressors in the Nutlin-3a screen.
Figure 2—figure supplement 2

Comparison of PLK4 screens.
(A–E) Venn diagrams showing the overlap among the hits from screens performed in this study. Screen conditions indicated in each panel. Genes from selected overlap regions are shown. (F) Comparison of genes identified using 200 nM centrinone B in both RPE-1 and A375 (200 nM) and after PLK4 overexpression in RPE-1 cells (Evans). Genes identified in RPE-1 cells colored red, genes identified in A375 cells underlined. (G) Comparison of genes from 500 nM screens performed here in RPE-1 and A375 cells (500 nM) with other PLK4 inhibition screens performed using RPE-1 cells (Meitinger, Lambrus, and Fong). Color scheme identical to panel F.
Figure 3 with 2 supplements

TRIM37 is a centrosome-associated protein.
(A) RPE-1 Cas9 cells were stably infected with virus directing the expression of one of two sgRNAs against TRIM37 or empty vector. Selected cells were treated with DMSO, or 200 or 500 nM centrinone B for 4 days, fixed and stained for CEP135 and foci counted. Means and standard deviation shown (n=3, N≥169). (B) Cells from (A) were also processed for Western blotting using the indicated antibodies. FL – full length. p60 – p60 fragment. Ponc.S indicates total protein. (C) Asynchronous RPE-1 cells were fixed and stained with the indicated antibodies. Pairwise merged images are shown (bottom). (D) Asynchronus RPE-1 Cas9 cells were fixed and stained for TRIM37, PCNA, and CEP120. The number of TRIM37-positive centrosomes was manually determined for each cell cycle stage. Means from each replicate are shown as open circles. Resulting mean and standard deviation shown (n=3, N≥96). p-value from one-way ANOVA. (E) and (F) RPE-1 Cas9 cells were fixed and stained for the indicated antibodies. Examples of different cell cycles stages and TRIM37 localizations are shown in (E) and (F), respectively. Arrowhead in (E) indicates TRIM37 preference for one of two centrosomes. M/D: mother/daughter, M: mother, D: daughter. (G) Quantification of cells shown in (E) and (F). Individual data points shown as open circles. REsulting mean and standard deviation show (n=3, N = ≥94). Significant p-values (< 0.05) from a pairwise t-test between G1 and S/G2 populations indicated. (H) RPE-1 TRIM37-/- cells stably expressing FB-TRIM37 were fixed, stained with the indicated antibody, and imaged using 3D-SIM. Two representative images are shown. (I) RPE-1 TRIM37-/- cells stably expressing the indicated construct (FB = FLAG BirA) were pre-extracted, fixed, and stained for the indicated protein. (J) Centrosomal TRIM37 signal from cells in (I) was quantified. Means from each replicate are shown as open circles. Resulting mean and standard deviation shown (n=3, N≥84). Significant p-values (< 0.05) from Dunnett post hoc test using ‘WT’ as control after one-way ANOVA shown. Note that the results from (I) and (J) and those in Figure 7—figure supplement 1C, E are from the same experiment therefore ‘FLAG-BirA’ and ‘WT’ are duplicated in these panels. See Figure 3—source data 1.
-
Figure 3—source data 1
Source data for Figure 3.
- https://cdn.elifesciences.org/articles/73944/elife-73944-fig3-data1-v1.xlsx
Figure 3—figure supplement 1

Characterization of TRIM37 gene disrupted lines.
(A) Samples from control RPE-1 Cas9 (empty) or cells expressing the indicated TRIM37 sgRNA were collected and subjected to Sanger sequencing. Underline indicates sgRNA position and arrow indicates predicted Cas9 cleavage site. (B) Sequences from (A) were analyzed using CRISPR TIDE. Efficiency and indel distribution are shown. (C) The indicated cell lines were analyzed by Western blotting for TRIM37. ‘Clone 1’ indicates single RPE-1 TRIM37-/- clonal line. ‘Pool’ represents RPE-1 and A375 TRIM37-/- pools. Ponc.S indicates total protein. (D) Genomic DNA from clonal RPE-1 TRIM37-/- gene disruption analyzed using Synthego CRISPR analysis tool. WT sequence is shown at bottom. sgRNA sequence is underlined and PAM colored red. Vertical line indicates predicted Cas9 cleavage site. The deconvolved sequences indicate alleles with 1 and 2 nucleotide deletions. (E) RPE-1 and clonal RPE-1 TRIM37-/- cells were pre-extracted and fixed for immunofluorescence using the indicated antibodies. Insets enlarged 3× and 4× as indicated. (F) TRIM37 intensity at the centrosome was automatically determined in interphase and mitotic cells. Means from each replicate are shown as open circles. Resulting mean and standard deviation shown (interphase; n=3, N≥209, mitotic; n=3, N=15). Significant p-values (< 0.05) from a pairwise t-test comparing WT and TRIM37-/- cells are shown. (G) RPE-1 and RPE-1 TRIM37-/- cells were treated with control siRNA (GL2), or siRNA directed against TRIM37. The centrosomal intensity of TRIM37 was determined in interphase and mitotic cells. Means from each replicate are shown as open circles. Resulting mean and standard deviation shown (interphase; n=3, N≥179, mitotic n=3, N≥15). Significant p-values (< 0.05) from a pairwise test comparing control siRNA to TRIM37 siRNA are shown. Figure 3—figure supplement 1—source data 1.
-
Figure 3—figure supplement 1—source data 1
Source data for Figure 3—figure supplement 1.
- https://cdn.elifesciences.org/articles/73944/elife-73944-fig3-figsupp1-data1-v1.xlsx
Figure 3—figure supplement 2
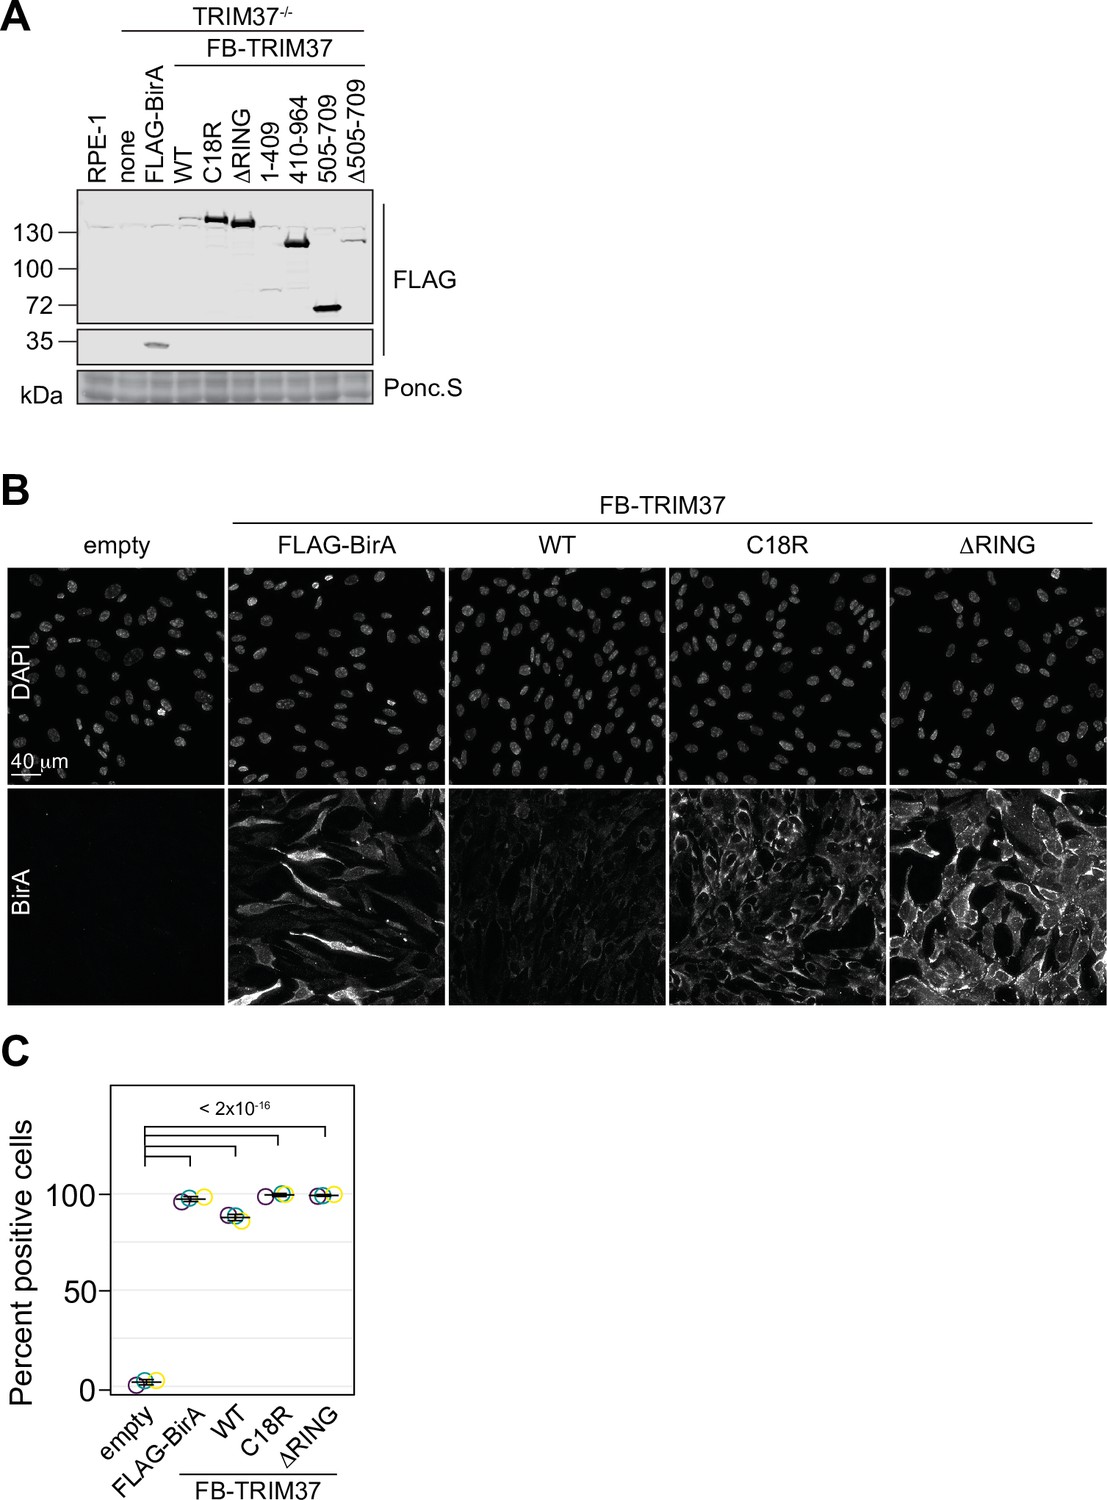
Characterization of clonal TRIM37-/- rescue lines.
(A) WT RPE-1 or TRIM37-/- cells stably expressing FLAG-BirA or the indicated FB-TRIM37 mutant were processed for Western blot using an anti-FLAG antibody. Ponc.S indicates total protein.
(B) RPE-1 TRIM37-/- cells stably expressing FLAG-BirA or the indicated FB-TRIM37 mutant were fixed and stained for BirA. (C) Quantification of cells in (B). The number of cells with a fluorescence intensity above a threshold were scored as positive. Individual data points from each replicate are shown as open circles. Resulting mean and standard deviation shown (n=3, N≥240). Significant p-values (< 0.05) from Dunnett post hoc test using ‘empty’ as control after one-way ANOVA shown. See Figure 3—figure supplement 2—source data 1.
-
Figure 3—figure supplement 2—source data 1
Source data for Figure 3—figure supplement 2.
- https://cdn.elifesciences.org/articles/73944/elife-73944-fig3-figsupp2-data1-v1.xlsx
Figure 4 with 3 supplements
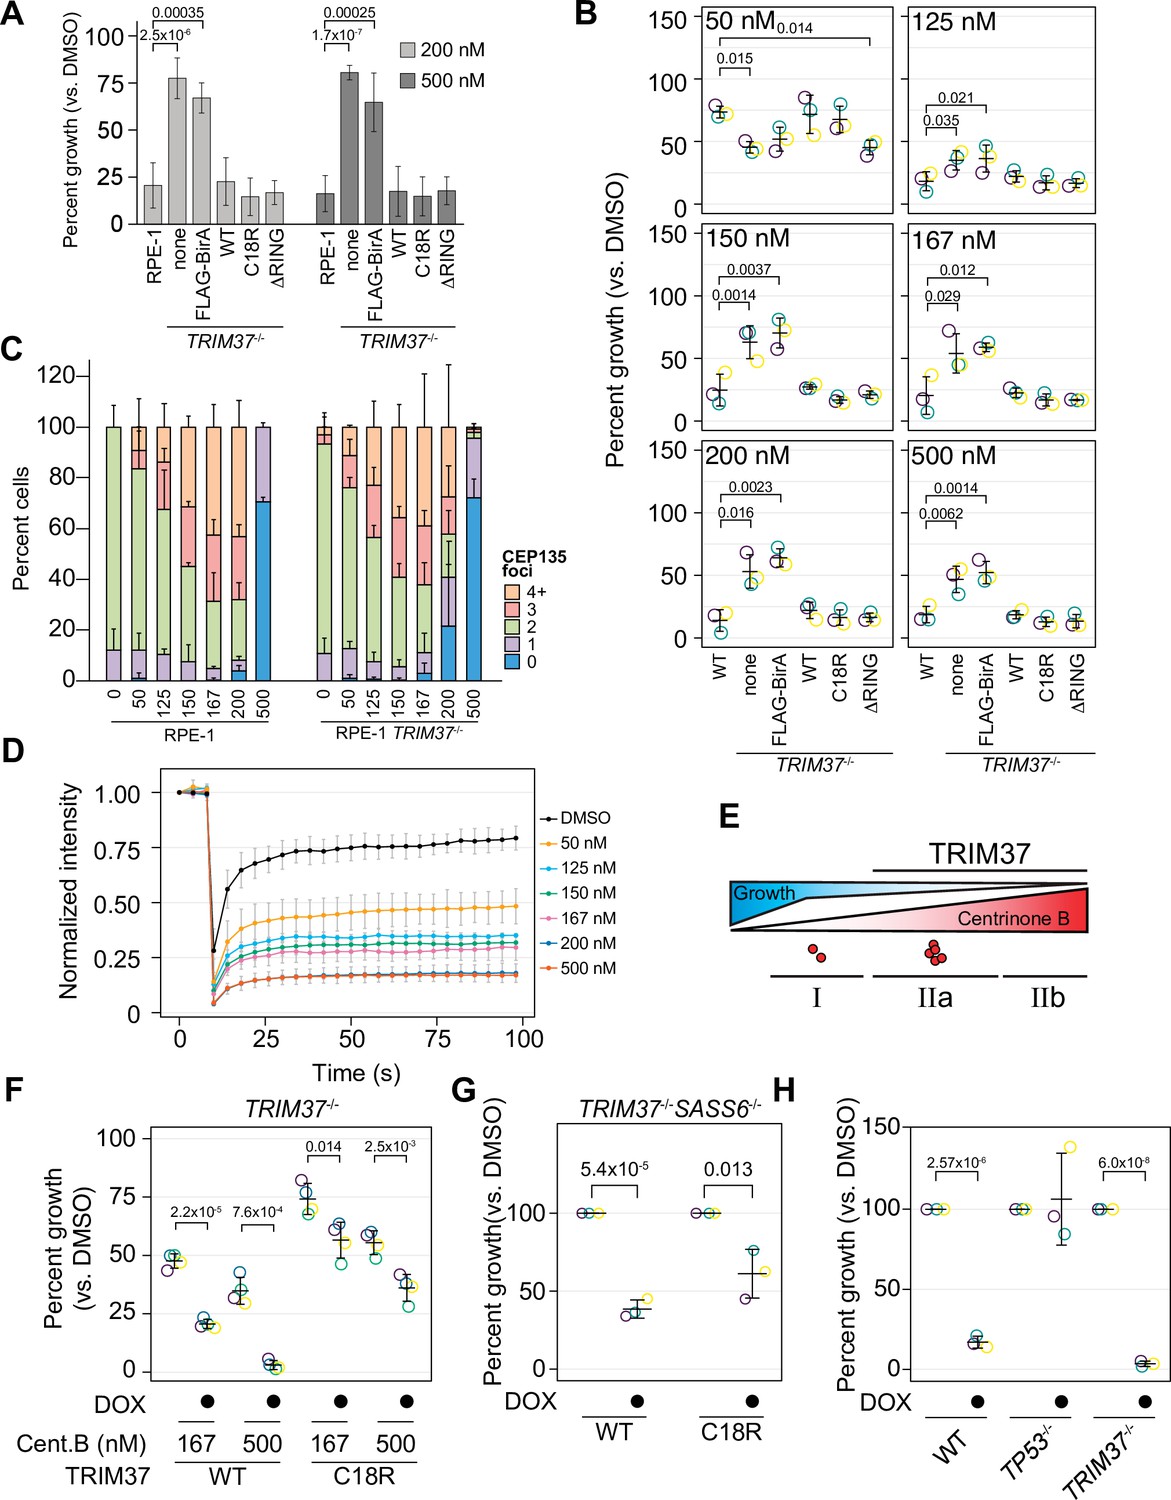
TRIM37 E3-independent activity is required for growth arrest.
(A) WT RPE-1, TRIM37-/- (none), and TRIM37-/- cells expressing FLAG-BirA (FB) or the indicated FB-TRIM37 (WT, C18R, ΔRING) construct were seeded for clonogenic assays and grown in DMSO or the indicated concentration of centrinone B for 14 days. Colony density was quantified and growth compared to that in DMSO determined. Means and standard deviation shown (n=3). Significant p-values (< 0.05) from a Dunnett post hoc test using 'RPE-1' as a control after one-way ANOVA shown. (B) WT RPE-1, TRIM37-/- (pool), and TRIM37-/- expressing FB or the indicated FB-TRIM37 construct were seeded for clonogenic assays and grown in DMSO or the indicated concentration of centrinone B for 14 days. Colony density was quantified and growth compared to that in DMSO determined. Means from each replicate are shown as open circles. Resulting mean and standard deviation shown (n=3). Significant p-values (< 0.05) from Dunnett post hoc test using ‘WT’ as control after one-way ANOVA shown. Note that the results from this experiment and those in Figure 7 are from the same experiment; therefore ‘WT’, ‘TRIM37-/- none’, ‘TRIM37-/- FLAG-BirA’, and ‘TRIM37-/- WT’ are duplicated in these panels. (C) WT or TRIM37-/- (pools) RPE-1 cells were treated with DMSO (0) or the indicated concentration of centrinone B (nM) for 4 days before fixing and staining for CEP135. CEP135 foci per cell were manually counted. Mean and standard deviation shown (n=3, N≥55 per condition). (D) RPE-1 cells were transfected with GFP-PLK4kin + L1 and treated with DMSO or the indicated concentration of centrinone B for 16 hr. The mean and standard deviation among the independent replicates is shown (n=3, N≥12). (E) Model showing growth inhibition ‘phases’. Growth is inhibited as a function of centrinone B. Phases dependent on TRIM37 are indicated. Red dots indicate centrosome number. (F) RPE-1 TRIM37-/- cells expressing DOX-inducible TRIM37-3xFLAG or TRIM37 C18R-3xFLAG were seeded for clonogenic assays in the absence and presence of doxycycline and DMSO or the indicated concentration of centrinone B. After incubation for 14 days, colony density was quantified and growth compared to that in DMSO determined. Means from each replicate are shown as open circles. Resulting mean and standard deviation shown (n=4). Significant p-values (< 0.05) from pairwise t-tests comparing -DOX and +DOX samples are shown. (G) RPE-1 TRIM37-/- SASS6-/- cells expressing DOX-inducible TRIM37-3xFLAG or TRIM37 C18R-3xFLAG were seeded for clonogenic assays in the absence and presence of doxycycline. After incubation for 14 days, colony density was quantified and growth compared to that in DMSO determined. Means from each replicate are shown as open circles. Resulting mean and standard deviation shown (n=3). Significant p-values (< 0.05) from pairwise t-tests comparing -DOX and +DOX samples are shown. (H) The indicated RPE-1 line expressing inducible PLK4-3xFLAG were seeded for clonogenic assays in the absence and presence of doxycycline. After incubation for 14 days, colony density was quantified and growth compared to that in DMSO determined. Means from each replicate are shown as open circles. Resulting mean and standard deviation shown (n=3). Significant p-values (<0.05) from pairwise t-tests comparing -DOX and +DOX samples are shown. See Figure 4—source data 1.
-
Figure 4—source data 1
Source data for Figure 4.
- https://cdn.elifesciences.org/articles/73944/elife-73944-fig4-data1-v1.xlsx
Figure 4—figure supplement 1

Cellular response to varying centrinone B treatments.
(A) WT RPE-1 and a pooled RPE-1 TRIM37-/- line stably expressing FLAG-BirA of the indicated FB-TRIM37 fusion protein were harvested and analyzed by Western blot using an anti-FLAG antibody. Ponc.S indicates total protein. (B) WT A375 and a pooled A375 TRIM37-/- line stably expressing FLAG-BirA of the indicated FB-TRIM37 fusion protein were harvested and analyzed by Western blot using an anti-FLAG antibody. Ponc.S indicates total protein. (C) WT A375, TRIM37-/- (pool), and TRIM37-/- expressing FB or the indicated FB-TRIM37 construct were seeded for clonogenic assays and grown in DMSO or the indicated concentration of centrinone B for 14 days. Colony density was quantified and growth compared to that in DMSO determined. Means from each replicate are shown as open circles. Resulting mean and standard deviation shown (n=3). Significant p-values (< 0.05) from Dunnett post hoc test using ‘WT’ as control after one-way ANOVA shown. (D) WT RPE-1 or TRIM37-/- cells were treated with DMSO or the indicated concentration of centrinone B for 4 days. Samples were prepared for Western blot and probed for p53 and p21. PS indicates total protein. Band intensity was determined and normalized to DMSO for each cell line. Means from each replicate are shown as open circles. Resulting mean and standard deviation shown (n=3). (E) WT or TRIM37-/- (pool) A375 cells were treated with the indicated concentration of centrinone B (nM) for 4 days before fixing and staining for CEP135. CEP135 foci per cell were manually counted. Mean and standard deviation shown (n=3, N≥63 per condition). See Figure 4—figure supplement 1—source data 1.
-
Figure 4—figure supplement 1—source data 1
Source data for Figure 4—figure supplement 1.
(Excel file).
- https://cdn.elifesciences.org/articles/73944/elife-73944-fig4-figsupp1-data1-v1.xlsx
Figure 4—figure supplement 2

Comparison of protein abundance in stable and inducible cell lines.
(A) The indicated cell lines were grown in the absence or presence of doxycycline for 3 days (TRIM37-/-: RPE-1 TRIM37-/-; WT:RPE-1, FB-TRIM37: FB-TRIM37 expressed in TRIM37-/-, pInducer TRIM37 expressed in WT: RPE-1 and T37-/-: RPE-1 TRIM37-/-). Cells were prepared for Western blot and probed for TRIM37. Ponc.S indicates total protein. (B) Quantification of (A). Relative intensities from each replicate are shown as open circles. Resulting mean and standard deviation shown (n = 3). Significant p-values (< 0.05) from Dunnett post hoc test using ‘RPE1’ as control after one-way ANOVA shown. Only RPE-1, TRIM37-/- pInducer TRIM37 +DOX, and RPE-1 pInducer TRIM37 +DOX were compared. RPE-1 and FB-TRIM37 were compared using a pairwise t-test. (C) The indicated cell lines from (A) were also fixed and stained for TRIM37 and γ-tubulin. The total centrosomal intensity in the TRIM37 channel was determined. Means from each replicate are shown as open circles. Resulting mean and standard deviation shown (n = 3, N ≥ 164). Significant p-value (< 0.05) from a pairwise t-test is shown. (D) RPE-1 TRIM37-/- cells expressing inducible WT or C18R TRIM37 were grown in the absence or presence of doxycycline for 3 days. Samples were processed for Western blot and probed for TRIM37. Ponc.S indicates total protein. (E) Quantification of (D). Relative intensities from each replicate are shown as open circles. Resulting mean and standard deviation shown (n = 3). The doxycycline-induced samples were compared using a pairwise t-test. Significant p-values (< 0.05) are shown. See Figure 4—figure supplement 2—source data 1.
-
Figure 4—figure supplement 2—source data 1
Source data for Figure 4—figure supplement 2.
- https://cdn.elifesciences.org/articles/73944/elife-73944-fig4-figsupp2-data1-v1.xlsx
Figure 4—figure supplement 3

Characterization of SASS6-/- and pInducer PLK4 cell lines.
(A) WT RPE-1, TRIM37-/- and TRIM37-/- SASS6-/- cells were prepared for Western blot and probed for SASS6. Ponc.S indicates total protein. (B) WT RPE-1, TRIM37-/- and TRIM37-/-/SASS6-/- cells were seeded for clonogenic assays and grown in DMSO or the indicated concentration of centrinone B for 14 days. Colony density was quantified and growth compared to that in DMSO determined. Means from each replicate are shown as open circles. Resulting mean and standard deviation shown (n = 5). Significant p-values (< 0.05) from Dunnett post-hoc test using ‘WT’ as control after one-way ANOVA shown. (C) RPE-1 TRIM37-/-/SASS6-/- cells expressing inducible WT or C18R TRIM37 were grown in the absence or presence of doxycycline for 3 d. Samples were prepared for Western blot and probed for TRIM37. Ponc.S indicates total protein. (D) Quantification of the induced samples in (C). Individual data points shown as open circles. Resulting mean and standard deviation shown. WT and C18R were compared using a pairwise t-test and significant p-value (< 0.05) is shown. (E) WT RPE-1, TP53-/- and TRIM37-/- expressing inducible PLK4-3xFLAG were grown in the absence and presence of doxycycline for 16 h. Cells were fixed and stained for CEP135. The number of CEP135 foci was manually counted. Means and standard deviation are shown (n = 2, N ≥ 54 per condition). See Figure 4—figure supplement 3—source data 1.
-
Figure 4—figure supplement 3—source data 1
Source data for Figure 4—figure supplement 3.
- https://cdn.elifesciences.org/articles/73944/elife-73944-fig4-figsupp3-data1-v1.xlsx
Figure 5
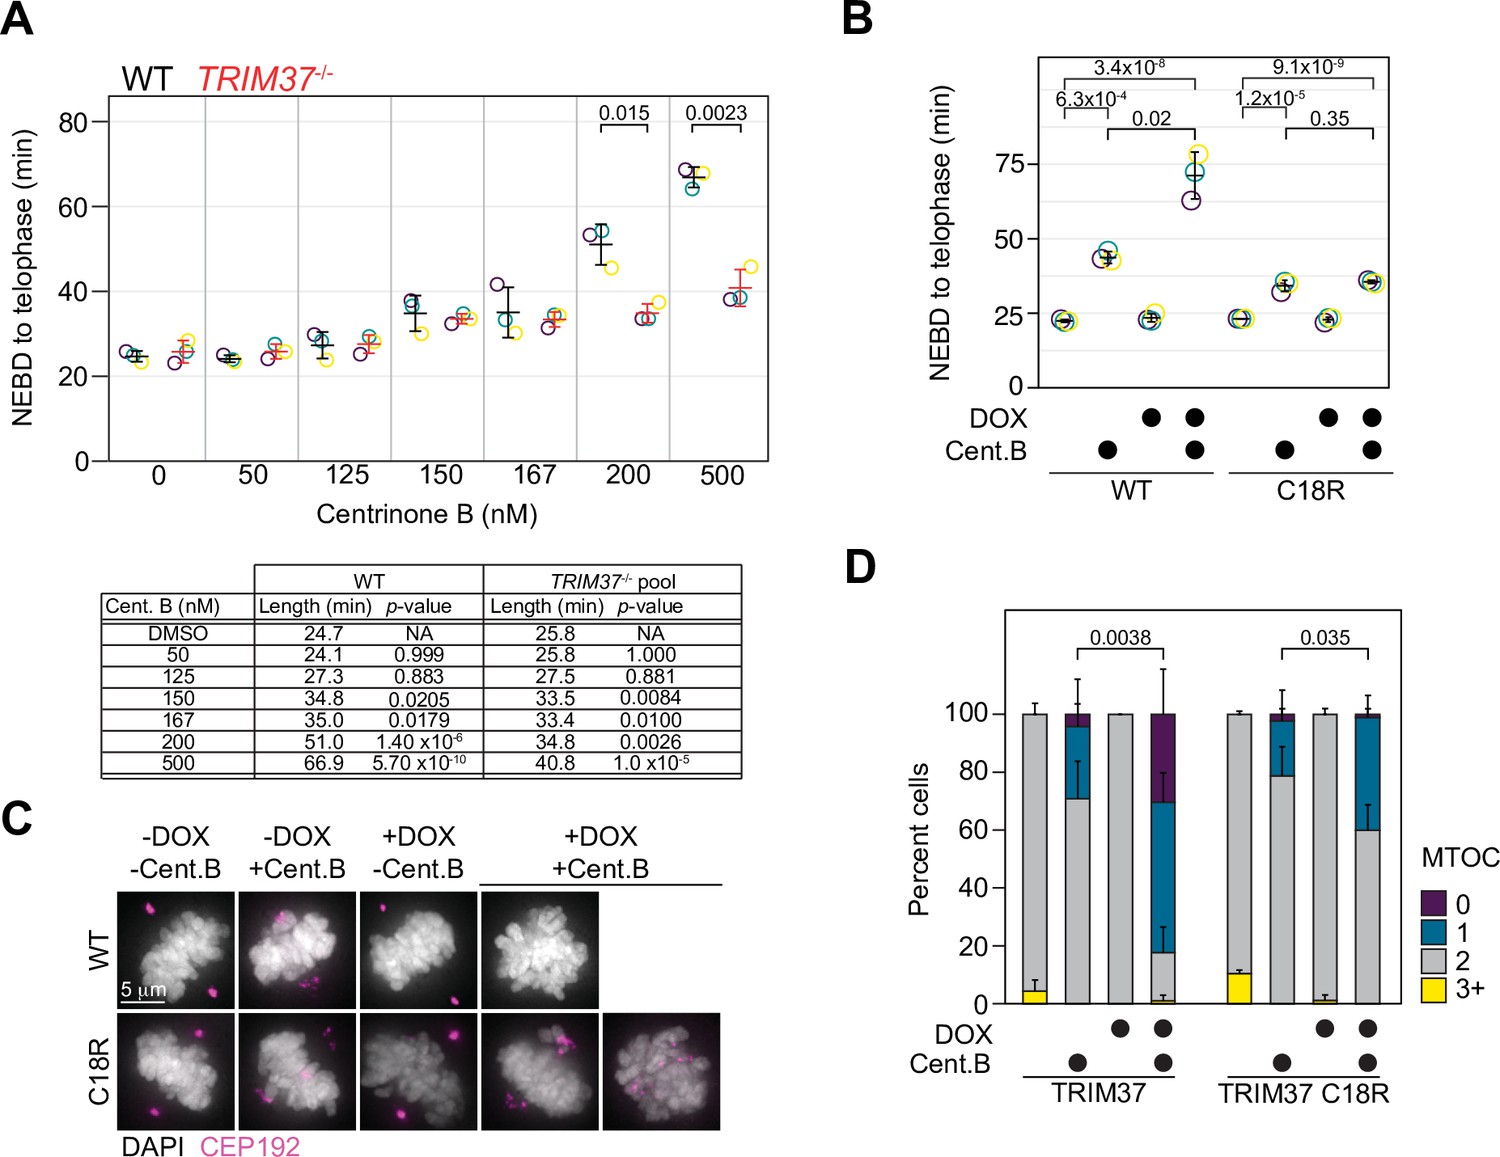
TRIM37 displays E3-dependent and -independent mitotic activities.
(A) WT RPE-1 and TRIM37-/- cells were incubated with DMSO (0) or the indicated concentration of centrinone B for 3 days before live imaging for 24 hr. The time from nuclear envelope breakdown (NEBD) to telophase was determined. Means from each replicate are shown as open circles. Resulting mean and standard deviation shown (n=3). Significant p-values (< 0.05) from pairwise t-tests comparing WT and TRIM37-/- samples are shown. (n=3, N≥30). Table below indicates average mitotic length and p-value from a Dunnett post hoc test using ‘DMSO’ as control after one-way ANOVA. (B) RPE-1 TRIM37-/- cells were treated with DMSO or 500 nM centrinone B (Cent.B) in the absence or presence of doxycycline (DOX) for 3 days before live imaging for 24 hr. The time from NEBD to telophase was determined. Means from each replicate are shown as open circles. Resulting mean and standard deviation shown (n=3). Significant p-values (< 0.05) from Dunnett post hoc test using ‘uninduced, DMSO treated’ cells as a control after a one-way ANOVA are shown (n=3, N≥46). (C) RPE-1 TRIM37-/- cells expressing the indicated TRIM37 protein (WT or C18R) were treated with DMSO or 500 nM centrinone B (Cent.B) in the absence or presence of DOX for 3 days before fixing and staining for CEP192. Representative images shown. (D) The number of discernable microtubule organizing centers (MTOCs) characterized by the accumulation of CEP192 in cells from (C) was quantified. Means and standard deviation shown (n=3, N≥29). For each TRIM37 construct, the number of cells incubated with centrinone B and with two MTOCs in uninduced and induced samples was compared using a pairwise t-test. Significant p-values (< 0.05) are shown. See Figure 5—source data 1.
-
Figure 5—source data 1
Source data for Figure 5.
- https://cdn.elifesciences.org/articles/73944/elife-73944-fig5-data1-v1.xlsx
Figure 6 with 2 supplements
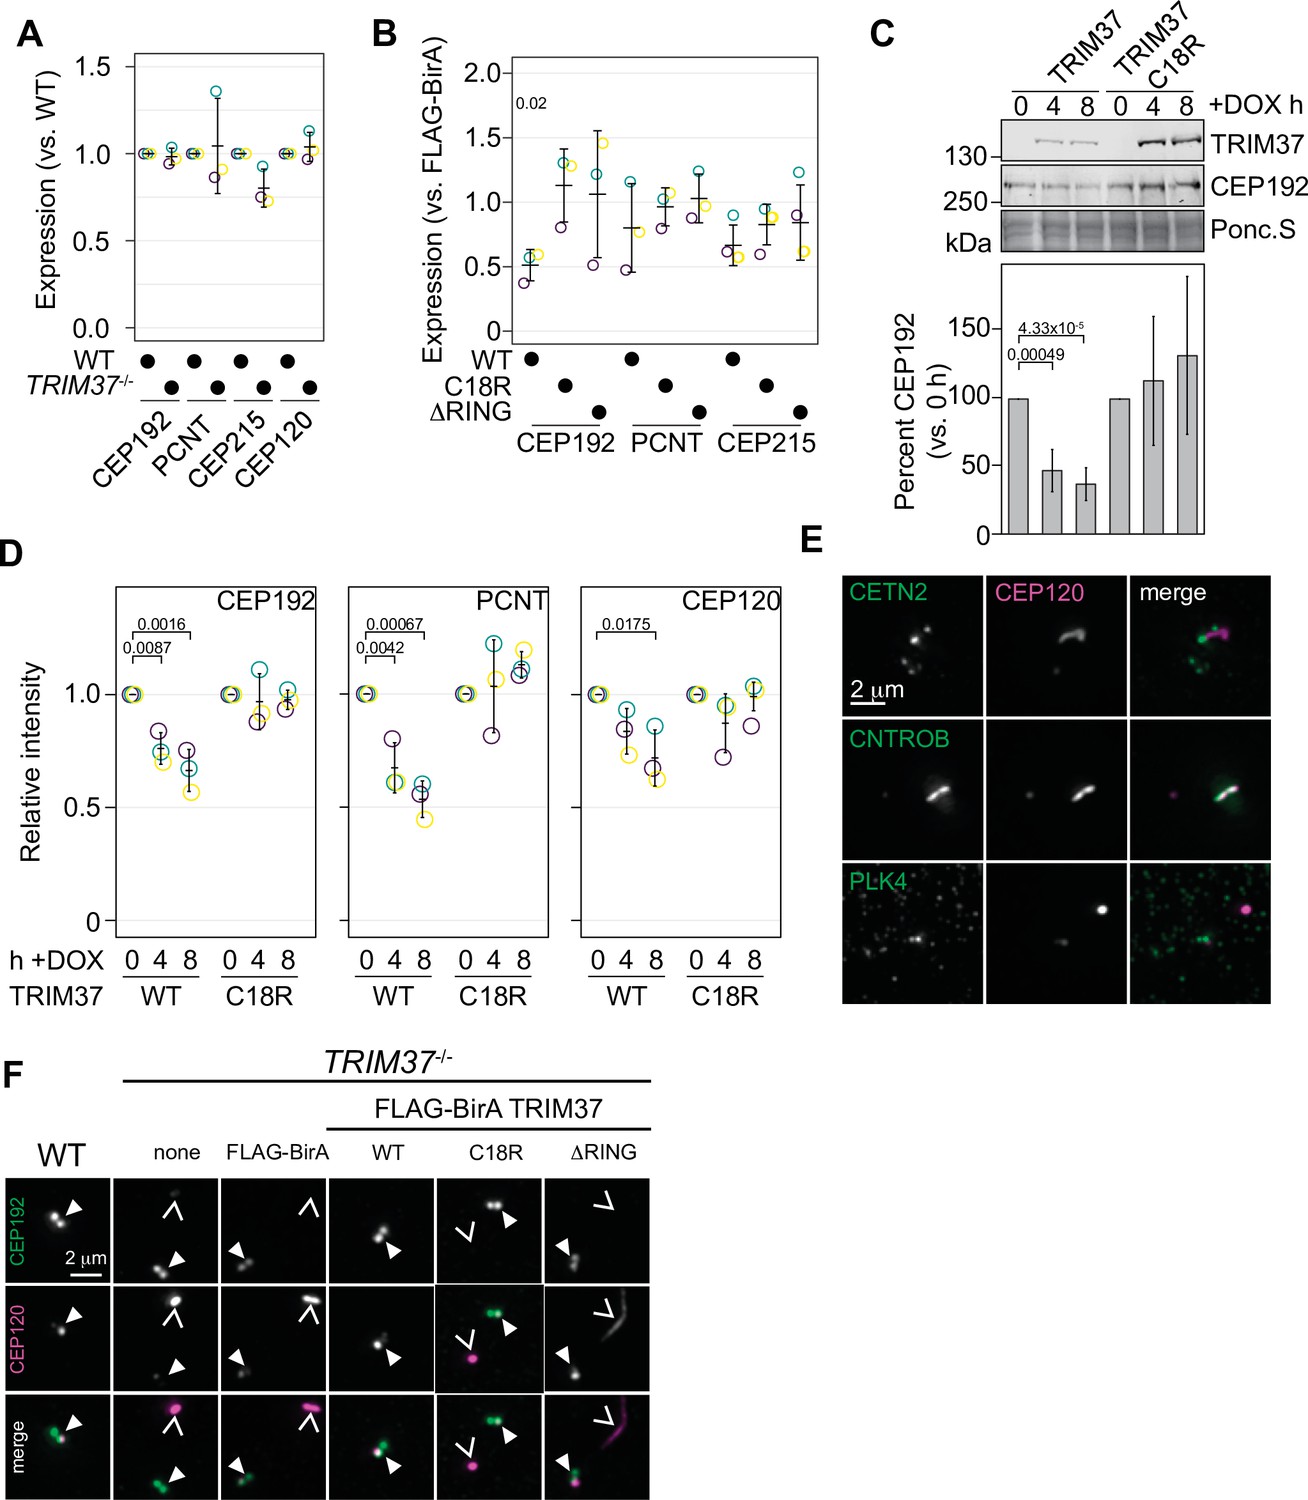
TRIM37 negatively regulates centriole and centrosome proteins.
(A) WT RPE-1 and TRIM37-/- cells were processed for Western blot and probed for the indicated proteins. Band intensity was quantified and expressed as expression compared to WT cells. Relative intensity from each replicate are shown as open circles. Resulting mean and standard deviation shown (n=3). Data was tested by pairwise t-test between WT and TRIM37-/-. No significant differences were observed. (B) TRIM37-/- RPE-1 cells stably expressing FLAG-BirA or the indicated FB-TRIM37 protein were processed for Western blot and probed for the indicated proteins. Band intensity was quantified and expressed as expression compared to cells expressing FLAG-BirA. Relative intensity from each replicate are shown as open circles. Resulting mean and standard deviation shown (n=3). Significant p-values (< 0.05) from Dunnett post hoc test using FLAG-BirA as a control after a one-way ANOVA are shown. The band intensity from FLAG-BirA cells was set to ‘1’ and is omitted from the plot for clarity. (C) WT RPE-1 cells expressing doxycline-inducible TRIM37-3xFLAG (WT) or TRIM37 C18R-3xFLAG (C18R) were induced with doxycycline for 0, 4, or 8 hr. At each time point, extracts were prepared and analyzed by Western blot for the indicated protein (right). Ponc.S indicates equal loading. CEP192 abundance was quantified and normalized to the intensity at time 0 hr (bottom). Mean and standard deviation shown (n=3). Significant p-values (< 0.05) from Dunnett post hoc test using time 0 hr as a control after a one-way ANOVA are shown. (D) Cells from (C) were also fixed and immunostained for the indicated proteins. The centrosomal intensity from mitotic cells was determined. Intensity values were normalized to 0 hr. Means from each replicate are shown as open circles. Resulting mean and standard deviation shown (n=3, N=60). Significant p-values (< 0.05) from Dunnett post hoc test using time 0 hr as a control after a one-way ANOVA are shown. (E) RPE-1 TRIM37-/- cells were fixed and stained for CEP120 and the indicated proteins. (F) RPE-1 (WT) or TRIM37-/- cells stably expressing FLAG-BirA or the indicated FB-TRIM37 protein were fixed and stained for the indicated protein. Arrowhead indicates centrosome defined by CEP192. Caret mark indicates ectopic structure defined by CEP120. See Figure 6—source data 1.
-
Figure 6—source data 1
Source data for Figure 6.
- https://cdn.elifesciences.org/articles/73944/elife-73944-fig6-data1-v1.xlsx
Figure 6—figure supplement 1
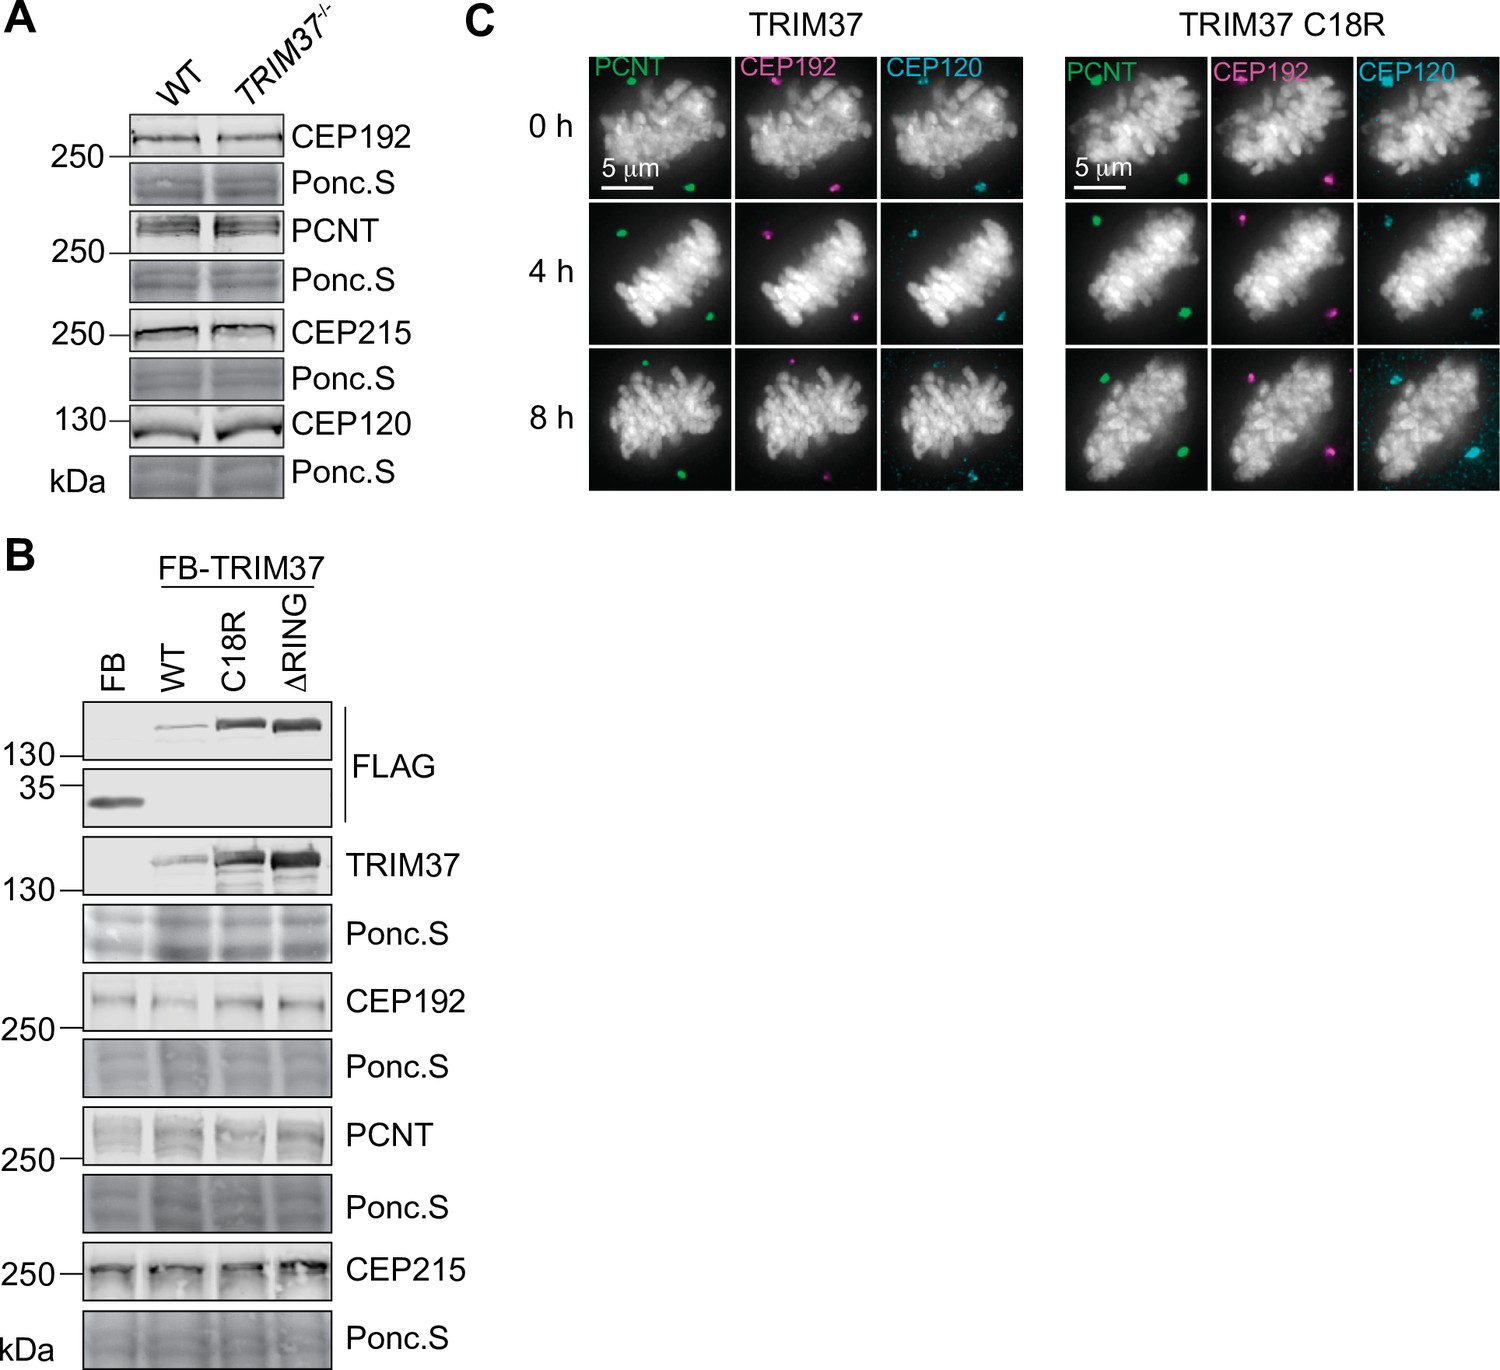
TRIM37 negatively regulates pericentriolar material (PCM) and centriole proteins.
(A) WT RPE-1 and TRIM37-/- cells were processed for Western blot and probed for the indicated protein. Ponc.S indicates total protein. Quantification in Figure 6A. (B) TRIM37-/- RPE-1 cells stably expressing FLAG-BirA (FB) or the indicated FB-TRIM37 protein were processed for Western blot and probed for the indicated protein. Ponc.S indicates total protein. Quantification in Figure 6B. (C) RPE-1 TRIM37-/- cells expressing inducible TRIM37 or TRIM37 C18R were induced with doxycycline for the indicated time. Cells were fixed and stained for the indicated protein. Sample images of mitotic cells quantified in Figure 6D.
Figure 6—figure supplement 2
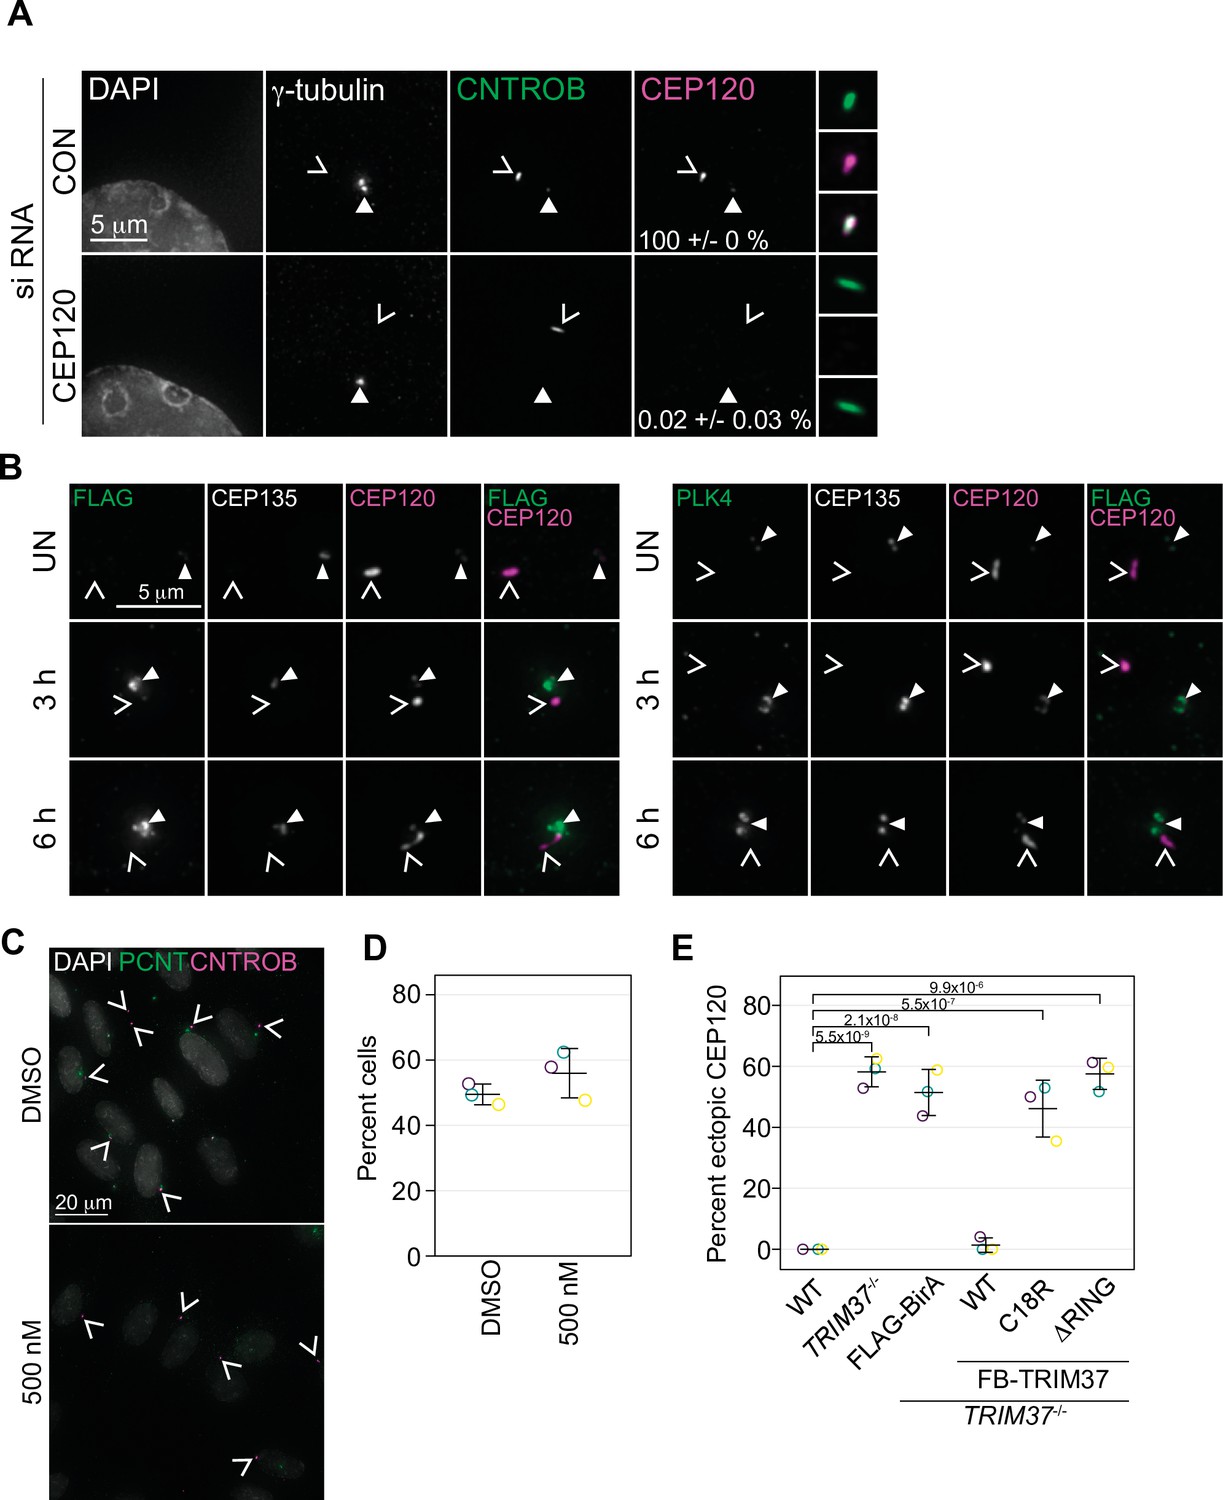
Characterization of ectopic centrosomal aggregates.
(A) RPE-1 cells were treated with non-targeting (CON) siRNA or siRNA targeting CEP120 (CEP120). Cells were fixed after 72 hr and stained for the indicated protein. Closed arrowhead indicates centrosome based on γ-tubulin. Caret mark (open arrowhead) indicates ectopic structures based on CEP120 and/or CNTROB. Cells were manually scored for the number of cells with ectopic CNTROB structures that also co-stained with CEP120 (mean with standard deviation). (B) TRIM37-/- RPE-1 cells expressing inducible PLK4-3xFLAG were treated with doxycycline. Cells were harvested at the indicated time, fixed and stained for FLAG (left panels) or PLK4 (right panels) and the indicated proteins. Closed arrowhead indicates the centrosome based on CEP135 and the caret mark indicates ectopic structures based on the non-centrosomal CEP120 signal. (C) TRIM37-/- RPE-1 cells were grown in the absence and presence of 500 nM centrinone B for 3 days. Cells were fixed and stained for the indicated proteins. (D) Quantification of cells in (C). The number of cells with non-centrosomal CNTROB was scored. Means and standard deviation shown. Control samples were compared to centrinone B treated using a pairwise t-test and no significant difference was observed. (E) RPE-1 (WT), RPE-1 TRIM37-/- or RPE-1 TRIM37-/- cells expressing FLAG-BirA or the indicated FB-TRIM37 protein were fixed and stained for CEP120. The percent cells exhibiting non-centrosomal CEP120 was quantified. Individual replicates are shown as open circles. Resulting mean and standard deviation shown (n=3, N>35). Significant p-values (< 0.05) from a Dunnett post-hoc test using 'WT' as a control after a one-way ANOVA shown. See Figure 6—figure supplement 2—source data 1.
-
Figure 6—figure supplement 2—source data 1
Source data for Figure 6—figure supplement 2.
- https://cdn.elifesciences.org/articles/73944/elife-73944-fig6-figsupp2-data1-v1.xlsx
Figure 7 with 2 supplements
TRIM37 promotes PLK4 phosphorylation in an E3-dependent manner.
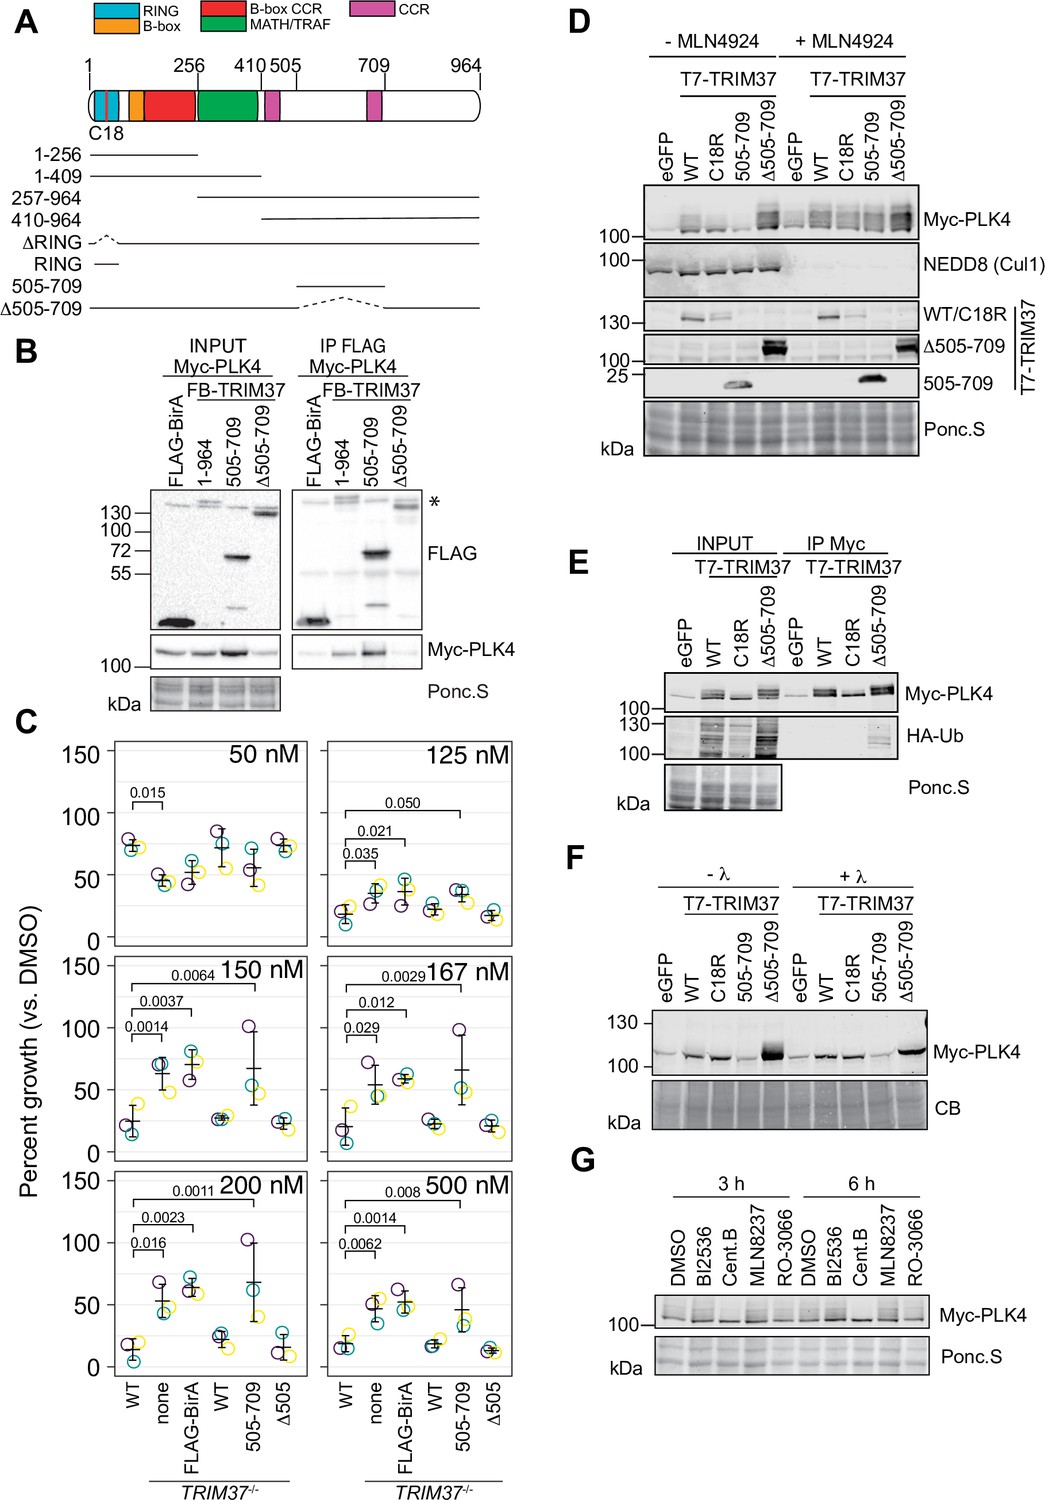
(A) TRIM37 domain schematic. Constructs used for structure-function experiments indicated below. (B) RPE-1cells were transfected to express Myc-PLK4 and FLAG-BirA or the indicated FB-TRIM37 fusion protein (top). Cells were lysed and subjected to anti-FLAG immunoprecipitation. Input and immunoprecipitates were analyzed by immunoblotting for the FLAG-BirA fusions (FLAG) or for Myc-PLK4. Ponc.S indicates total protein. * indicates position of FLAG-Cas9. (C) WT RPE-1, TRIM37-/- and TRIM37-/- expressing FB or the indicated FB-TRIM37 construct were seeded for clonogenic assays and grown in DMSO or the indicated concentration of centrinone B for 14 days. Colony density was quantified and growth compared to that in DMSO determined. Means from each replicate are shown as open circles. Resulting mean and standard deviation shown (n=3). Significant p-values (< 0.05) from Dunnett post hoc test using ‘WT’ as a control after one-way ANOVA shown. Note that the results from this experiment and those in Figure 4B are from the same experiment; therefore ‘WT’, ‘TRIM37-/- none’, ‘TRIM37-/- FLAG-BirA’, and ‘TRIM37-/- WT’ are duplicated in these panels. (D) HEK293T cells transfected to express Myc-PLK4 and the indicated protein (top) were grown overnight and subsequently treated with DMSO or MLN4924 for 22 hr and MG132 for the final 4 hr. Cell extracts were prepared and probed by Western blot using the indicated antibodies. Ponc.S indicates total protein. (E) HEK293T cells were transfected to express Myc-PLK4, HA-Ub, and the indicated protein (top). Cells were harvested after 48 hr and subjected to immunoprecipitation using anti-Myc antibodies. Input and immunoprecipitates were analyzed by immunoblotting for PLK4 and HA-Ub. Ponc.S indicates total protein. (F) HEK293T cells were transfected to express Myc-PLK4 and eGFP or the indicated T7-TRIM37 protein (top) for 48 hr. MG132 was added for the final 4 hr. Lysates were mock treated (-λ) or incubated with λ-phosphatase (+λ) and subsequently subjected to immunoblot for PLK4. (CB) indicates total protein. (G) HEK293T cells were transfected to express Myc-PLK4 and T7-TRIM37 Δ505–709 for 48 hr. Cells were treated with the indicated inhibitor (top) for 3 or 6 hr and analyzed by immunoblot for PLK4. Ponc.S indicates total protein. See Figure 7—source data 1.
-
Figure 7—source data 1
Source data for Figure 7.
- https://cdn.elifesciences.org/articles/73944/elife-73944-fig7-data1-v1.xlsx
Figure 7—figure supplement 1

Characterization of TRIM37 interactions with PLK4.
(A) RPE-1cells were transiently transfected to express Myc-PLK4 and FLAG-BirA or the indicated FB-TRIM37 construct (top). Cells were lysed and subjected to anti-FLAG immunoprecipitation. Input and immunoprecipitates were analyzed by immunoblotting with the indicated antibodies. Ponc.S indicates total protein. * indicates position of FLAG-Cas9. (B) RPE-1 TRIM37-/- cells stably expressing the indicated FB-TRIM37 protein were fixed and stained using an anti-BirA antibody. (C) Cells as in (B) were pre-extracted, fixed and stained for the indicated protein (FB: FLAG-BirA). (D) Quantification of cells in (B). Means from each replicate are shown as open circles. Resulting mean and standard deviation shown (n=3, N≥296). Significant p-values (< 0.05) from Dunnett post-hoc test using ‘empty’ as a control after a one-way ANOVA are shown. (E) Quantification of cells in (C). Means from each replicate are shown as open circles. Resulting mean and standard deviation shown (n=3, N≥78). Samples stained with α-FLAG were compared using a pairwise t-test. For samples stained with α-TRIM37, significant p-values (< 0.05) from Dunnett post hoc test using ‘WT’ as a control after a one-way ANOVA are shown. Note that the results from the α-TRIM37 samples and those in Figure 3I and J are from the same experiment; therefore ‘FLAG-BirA’ and ‘WT’ are duplicated in these panels. (F) RPE-1 TRIM37-/- cells expressing the inducible FB-TRIM37 protein indicated were grown for 3 days in the absence and presence of doxycycline. Samples were prepared for Western blot and probed for TRIM37. (CB) indicates total protein. (G) RPE-1 TRIM37-/- cells expressing the indicated inducible TRIM37 construct were seeded for clonogenic assays in the absence and presence of doxycycline and DMSO or the indicated concentration of centrinone B. After incubation for 14 days, colony density was quantified and growth compared to that in DMSO determined. Means from each replicate are shown as open circles. Resulting mean and standard deviation shown (n=3). Significant p-values (< 0.05) from pairwise t-tests comparing -DOX and +DOX for each line are shown. (H) WT RPE-1 and TRIM37-/- cells were transfected to express GFP-PLK4. FRAP analyses were performed after treating cells with DMSO or 500 nM centrinone B (cent.) for 16 hr. The mean and standard deviation among the independent replicates is shown (n=3, N≥10). (I) WT RPE-1 cells were treated with control siRNA (siCON) or siRNA against TRIM37 (siTRIM37) for 72 hr. Cells were transfected to express GFP-PLK4 after 48 hr and further treated with DMSO or 500 nM centrinone B (cent.) for the final 16 hr before performing FRAP analyses. The mean and standard deviation among the independent replicates is shown (n=3, N≥10). See Figure 7—figure supplement 1—source data 1.
-
Figure 7—figure supplement 1—source data 1
Source data for Figure 7—figure supplement 1.
- https://cdn.elifesciences.org/articles/73944/elife-73944-fig7-figsupp1-data1-v1.xlsx
Figure 7—figure supplement 2

Summary of TRIM37 rescue constructs used and resulting phenotypes.
(A) Table summarizing TRIM37 rescue constructs, expression system, and relative phenotypes.
Figure 8
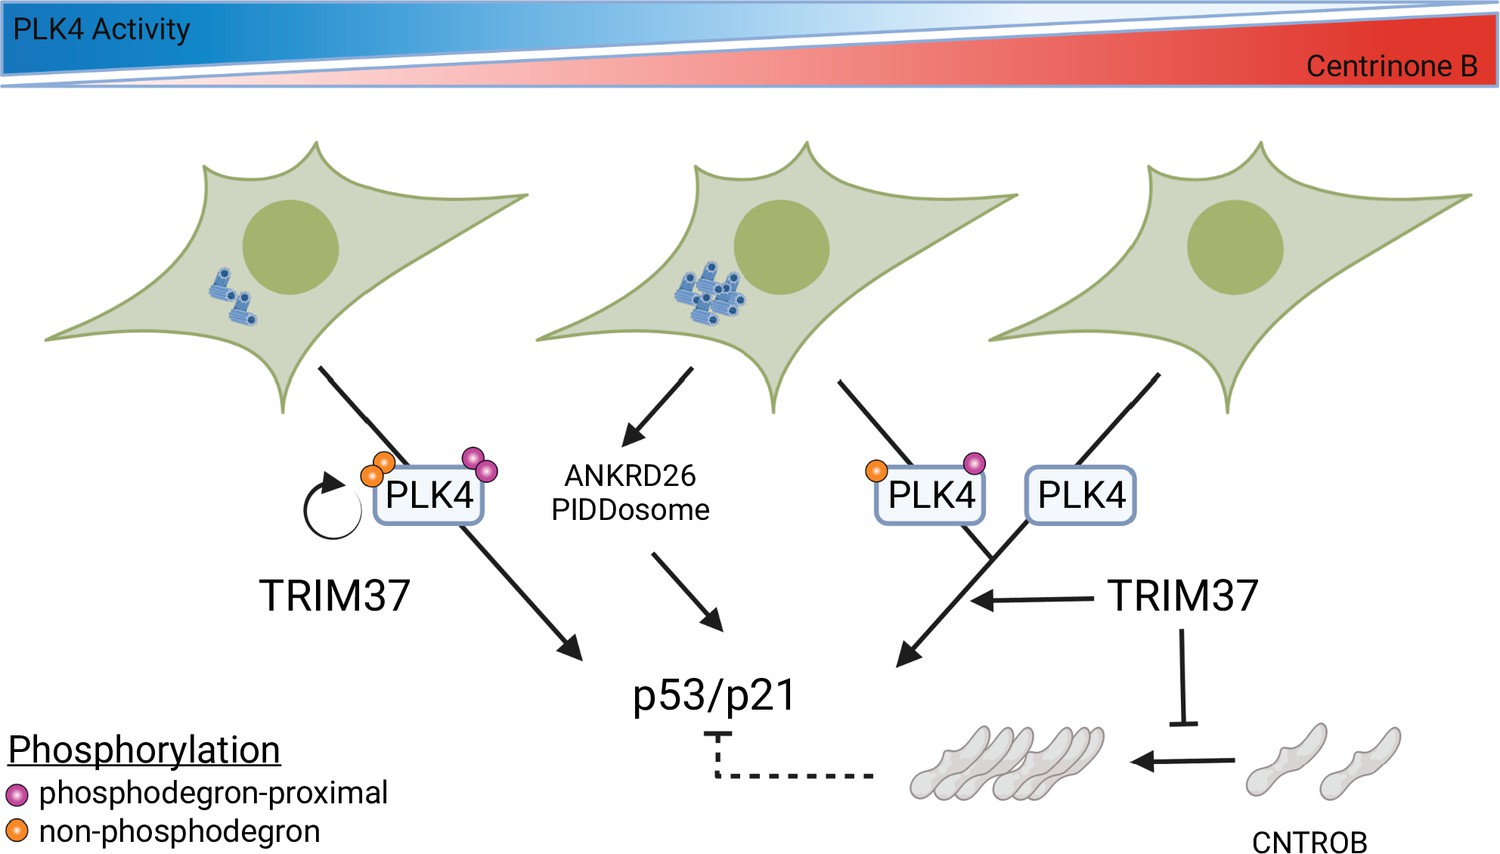
Model for growth arrest and TRIM37 growth arrest activity.
PLK4 activity decreases in a dose-dependent manner upon centrinone B addition. TRIM37 promotes PLK4 auto-phosphorylation (orange circles) outside the phosphodegron region (purple circles). PLK4 inhibition initially results in TRIM37-independent growth arrest. Continued addition of centrinone B results in centrosome overduplication that is detected by the ANKRD26/PIDDosome pathway in addition to a TRIM37-dependent growth arrest pathway. Complete inhibition of PLK4 results in TRIM37-dependent growth arrest. TRIM37 also prevents the appearance of CNTROB-dependent aggregates. We hypothesize that these aggregates might affect p53/p21 activation (dotted lines) (created with https://biorender.com/).
Author response image 1
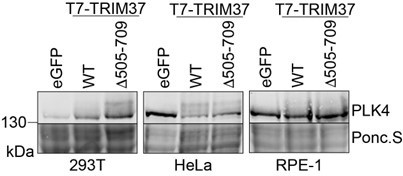
TRIM37-dependent PLK4 modification is observed in multiple cell lines.
293T, HeLa and RPE-1 cells were transfected with plasmids to express Myc-PLK4 and one of eGFP, T7-TRIM37 or T7-TRIM37D505-709. Cells were incubated for 48 with 30 µm MG132 added for the final 7 h. Cells were harvested directly in SDS-PAGE sample buffer and prepared for Western blot to detect PLK4. Ponc.S indicates total protein. A representative experiment from 3 Western blots is shown.
Tables
Key resources table
| Reagent type (species) or resource | Designation | Source or reference | Identifiers | Additional information |
|---|---|---|---|---|
| Cell line (human) | RPE-1, Epithelial (female, immortalized with hTERT) | ATCC | CRL-4000 | |
| Cell line (human) | A375, Epithelial (female, malignant melanoma) | ATCC | CRL-1619 | |
| Cell line (human) | RPE-1 Cas9 | Zimmermann et al., 2018 | ||
| Cell line (human) | A375 Cas9 | Hart et al., 2015 | ||
| Cell line (human) | HEK 293T, Epithelial (female, fetal kidney) | ATCC | CRL-3216 | |
| Cell line (human) | RPE-1 TRIM37-/- (clone) | This study | Created by transfecting RPE-1 Cas9 with sgRNA TRIM37 1. Single clones selected and screened for TRIM37 disruption by PCR and Western blot. | |
| Cell line (humanl) | RPE-1 TRIM37-/- (pool) | This study | Created by transfecting RPE-1 Cas9 with sgRNA TRIM37 e5. Pools selected by treatment with centrinone B. | |
| Cell line (human) | A375 TRIM37-/- (pool) | This study | Created by transfecting A375 Cas9 with sgRNA TRIM37 e5. Pools selected by treatment with centrinone B. | |
| Recombinant DNA reagent (plasmid, viral library) | TKOv1 library | Hart et al., 2015 | ||
| Recombinant DNA reagent (plasmid) | plentiGuide-Puro | Sanjana et al., 2014 | ||
| Recombinant DNA reagent (plasmid) | pLgP TRIM37sg1 | This study | Cloning details in Materials and methods | |
| Recombinant DNA reagent (plasmid) | pLgP TRIM37sg2 | This study | Cloning details in Materials and methods | |
| Recombinant DNA reagent (plasmid) | pcDNA5-FRT/TO-Myc-PLK4 | This study | Cloning details in Materials and methods | |
| Recombinant DNA reagent (plasmid) | pcDNA5 FLAG-BirA | Gupta et al., 2015 | Cloning details in Materials and methods | |
| Recombinant DNA reagent (plasmid) | pcDNA5 FLAG-BIrA-TRIM37 | Gupta et al., 2015 | Cloning details in Materials and methods | |
| Recombinant DNA reagent (plasmid) | pcDNA5 FLAG-BirA-TRIM37 C18R | This study | Cloning details in Materials and methods | |
| Recombinant DNA reagent (plasmid) | pcDNA5 FLAG-BirA-TRIM37 RING | This study | Cloning details in Materials and methods | |
| Recombinant DNA reagent (plasmid) | pcDNA5 FLAG-BirA-TRIM37 ΔRING | This study | Cloning details in Materials and methods | |
| Recombinant DNA reagent (plasmid) | pcDNA5 FLAG-BirA-TRIM37 1–256 | This study | Cloning details in Materials and methods | |
| Recombinant DNA reagent (plasmid) | pcDNA5 FLAG-BirA-TRIM37 257–964 | This study | Cloning details in Materials and methods | |
| Recombinant DNA reagent (plasmid) | pcDNA5 FLAG-BirA-TRIM37 1–409 | This study | Cloning details in Materials and methods | |
| Recombinant DNA reagent (plasmid) | pcDNA5 FLAG-BirA-TRIM37 410–964 | This study | Cloning details in Materials and methods | |
| Recombinant DNA reagent (plasmid) | pcDNA5 FLAG-BirA-TRIM37 505–709 | This study | Cloning details in Materials and methods | |
| Recombinant DNA reagent (plasmid) | pcDNA5 FLAG-BirA-TRIM37 Δ505–709 | This study | Cloning details in Materials and methods | |
| Recombinant DNA reagent (plasmid) | pSIN FLAG-BirA | This study | Cloning details in Materials and methods | |
| Recombinant DNA reagent (plasmid) | pSIN FLAG-BirA-TRIM37 | This study | Cloning details in Materials and methods | |
| Recombinant DNA reagent (plasmid) | pSIN FLAG-BIrA-TRIM37 C18R | This study | Cloning details in Materials and methods | |
| Recombinant DNA reagent (plasmid) | pSIN FLAG-BirA-TRIM37 ΔRING | This study | Cloning details in Materials and methods | |
| Recombinant DNA reagent (plasmid) | pSIN FLAG-BirA-TRIM37 505–709 | This study | Cloning details in Materials and methods | |
| Recombinant DNA reagent (plasmid) | pSIN FLAG-BirA-TRIM37 Δ505–709 | This study | Cloning details in Materials and methods | |
| Recombinant DNA reagent (plasmid) | pInduce PLK4 3xFLAG | This study | Cloning details in Materials and methods | |
| Recombinant DNA reagent (plasmid) | pcDNA3-HA-ubiquitin | This study | ||
| Recombinant DNA reagent (plasmid) | pcDNA5-FRT/TO-eGFP | Kean et al., 2011 | ||
| Recombinant DNA reagent (plasmid) | p T7 TRIM37 | This study | Cloning details in Materials and methods | |
| Recombinant DNA reagent (plasmid) | p T7 TRIM37 C18R | This study | Cloning details in Materials and methods | |
| Recombinant DNA reagent (plasmid) | p T7 TRIM37 505–709 | This study | Cloning details in Materials and methods | |
| Recombinant DNA reagent (plasmid) | p T7 TRIM37 Δ505–709 | This study | Cloning details in Materials and methods | |
| Recombinant DNA reagent (plasmid) | pcDNA5 eGFP PLK4 | Yamamoto and Kitagawa, 2019 | ||
| Recombinant DNA reagent (plasmid) | pcDNA5 eGFP PLK4 kinase +L1 | Yamamoto and Kitagawa, 2019 | ||
| Sequence-based reagent | NGS outer FOR | Hart et al., 2015 | AGGGCCTATTTCCCATGATTCCTT | |
| Sequence-based reagent | NGS outer REV | Hart et al., 2015 | TCAAAAAAGCACCGACTCGG | |
| Sequence-based reagent | TRIM37 sgRNA 1 forward | This study | CACCGACTTCAGGAGGTGGAGCACC | |
| Sequence-based reagent | TRIM37 sgRNA 1 reverse | This study | AAACGGTGCTCCACCTCCTGAAGTC | |
| Sequence-based reagent | TRIM37 sgRNA 2 forward | This study | CACCGTCGTAGCTGGAGTGGAGCAC | |
| Sequence-based reagent | TRIM37 sgRNA 2 reverse | This study | AAACGTGCTCCACTCCAGCTACGAC | |
| Sequence-based reagent | TRIM37 sgRNA 1 IVT forward | This study | GGATCCTAATACGACTCACTATAGGGACTTCAGGAGGTGGAGCACC | |
| Sequence-based reagent | TRIM37 sgRNA 1 IVT reverse | This study | TTCTAGCTCTAAAACGGTGCTCCACCTCCTGAAGTCCC | |
| Sequence-based reagent | TRIM37 sgRNA 1 check forward | This study | TCTGGCCCACTTTGTATTCTCT | |
| Sequence-based reagent | TRIM37 sgRNA 1 check reverse | This study | CCAGGTCAGGAGATCGAGAC | |
| Sequence-based reagent | TRIM37 sgRNA exon 5 IVT forward | This study | GGATCCTAATACGACTCACTATA GTCTGCCATCAGTGTGCACTT | |
| Sequence-based reagent | TRIM37 sgRNA exon 5 IVT reverse | This study | TTCTAGCTCTAAAACAAGTGCACACTGATGGCAGA | |
| Sequence-based reagent | TRIM37 exon 5 check forward | This study | AAGCACATGCCCAAAATGTAGT | |
| Sequence-based reagent | TRIM37 exon 5 check reverse | This study | GGGTCCATCAAACCACACAAAC | |
| Sequence-based reagent | cr_tracr_RNA | This study | GTTTTAGAGCTAGAAATAGCAAGTTAAAATAAGGCTAGTCCGTT ATCAACTTGAAAAAGTGGCACCGAGTCGGGCTTTT | |
| Sequence-based reagent | IVT forward | This study | TAATACGACTCACTATAG | |
| Sequence-based reagent | IVT reverse | This study | AAAAGCACCGACTCGGTG | |
| Sequence-based reagent | TRIM37 forward | This study | ACTAGGCGCGCCAGATGAACAGAGCGTGGAG | |
| Sequence-based reagent | TRIM37 reverse | This study | TTAGGCGGCCGCTTACCTTCCACTATTTTCATCTGTATTG | |
| Sequence-based reagent | TRIM37 256 reverse | This study | TTAGGCGGCCGCTTACATGGGCTTCCGATGAACTTG | |
| Sequence-based reagent | TRIM37 257 forward | This study | ACTAGGCGCGCCAGCATCTTTTGTTACCACTCCTG | |
| Sequence-based reagent | TRIM37 409 reverse | This study | TTAGGCGGCCGCTTATTGAAAGAAAGTTGGTGAACGTAC | |
| Sequence-based reagent | TRIM37 410 forward | This study | ACTAGGCGCGCCAAAATCCCGGGACCAGCATTG | |
| Sequence-based reagent | TRIM37 RING reverse | This study | TTAGGCGGCCGCTTAATCAAGCTGTTGTGTTACTTCTTC | |
| Sequence-based reagent | TRIM37 505 forward | This study | ACTAGGCGCGCCACAGAATGAAGATTATCATCACGAGC | |
| Sequence-based reagent | TRIM37 709 reverse | This study | TTAGGCGGCCGCTTACATGTCTCCAGAAGCAGCAC | |
| Sequence-based reagent | TRIM37 710 forward | This study | ACTAGGCGCGCCACAGACAAGCCTTTTTTCTGCTG | |
| Sequence-based reagent | TRIM37 Δ 505–709 forward | This study | CAGACAAGCCTTTTTTCTG | |
| Sequence-based reagent | TRIM37 Δ 505–709 reverse | This study | AATCTTCTCCTCATCTTCTTC | |
| Sequence-based reagent | TRIM37 C18R forward | This study | TCCCGCAATTTCTCCATACGAATGAAACATCGGAAAACC | |
| Sequence-based reagent | TRIM37 C18R reverse | This study | GGTTTTCCGATGTTTCATTCGTATGGAGAAATTGCGGGA | |
| Sequence-based reagent | TRIM37 Δ RING forward | This study | GCTCCACTCCAGCTACGA | |
| Sequence-based reagent | TRIM37 Δ RING reverse | This study | TCGGAAAACCTCAGCAATG | |
| Sequence-based reagent | Remove FLAG-BirA reverse | This study | GGTACCAAGCTTAAGTTTAAAC | |
| Sequence-based reagent | Remove FLAG-BirA forward | This study | GGGGGATCTGGCCCCGGC | |
| Sequence-based reagent | T7 tag forward | This study | CAGCCTCCGGACTCTAGCGTTTAAACTTAAGCTTGGTACCATGG CCAGCATGACCGGCGGCCAGCAG | |
| Sequence-based reagent | T7 tag reverse | This study | CTCTGTTCATCTGGCGCGCCGCCGCCGGGGCCAGATCCCCCA CCCATCTGCTGGCCGCCGGTCATGCT | |
| Sequence-based reagent | PLK4 for | This study | TTGGCGCGCCAATGGCGACCTGCATCGGG | |
| Sequence-based reagent | PLK4 rev | This study | CCGCTCGAGTTAACATTCTTGTTGGATTATCTCA | |
| Sequence-based reagent | CEP120 siRNA siGENOME | Comartin et al., 2013 | GAUGAGAACGGGUGUGUAU | |
| Sequence-based reagent | TRIM37 siRNA ON-TARGETplus SMARTpool | This study, Dharmacon | GGACUUUGCUGGAGGUUAA, AUACGAAACUCCACAAAUA, AGAGUGAGUUGAUAUCUAA, GAAUGUAGAAGCUGUAAGA | |
| Sequence-based reagent | Non-target #4 | Dharmacon | AUGAACGUGAAUUGCUCAA | |
| Sequence-based reagent | Luciferase GL2 control | Dharmacon | CGUACGCGGAAUACUUCGA | |
| Antibody | Anti-CEP135 (rabbit, polyclonal) | Bird and Hyman, 2008 | IF (1:1000) | |
| Antibody | Anti-p53 (mouse, monoclonal) | Santa Cruz Biotechnology | sc-126 | Western blot (1:250) IF (1:250) |
| Antibody | p21 (mouse, monoclonal) | Santa Cruz Biotechnology | sc-817 | Western blot (1:200) IF (1:200) |
| Antibody | Mdm2 (mouse, monoclonal) | MilliporeSigma | MABE340 | Western blot (1:200) |
| Antibody | γ-Tubulin (mouse, monoclonal) | MilliporeSigma | T6557 | Western blot (1:1000) |
| Antibody | TRIM37 (rabbit, polyclonal) | Bethyl Laboratories | A301-174A | Western blot (1:250) IF (1:250) |
| Antibody | CEP120 (rat, polyclonal) | PMID:29741480 | Western blot (1:1000) IF (1:4000) | |
| Antibody | CETN2 (mouse, monoclonal) | MilliporeSigma | 04-1624 | IF (1:1000) |
| Antibody | FLAG (mouse, monoclonal) | MilliporeSigma | F7425 | Western blot (1:1000) IF (1:1000) |
| Antibody | PLK4 (mouse, monoclonal) | MilliporeSigma | MABC544 | Western blot (1:500) IF(1:250) |
| Antibody | BirA (mouse, monoclonal) | Novus Biologicals | NBP2-59939 | IF (1:1000) |
| Antibody | Centrobin (rabbit, polyclonal) | Proteintech | 26880-1-AP | IF (1:1000) |
| Antibody | CEP192 (rabbit, polyclonal) | Bethyl Laboratories | A302-324 | IF (1:1000) |
| Antibody | CEP192 (rabbit, polyclonal) | Pelletier et al., 2004 | Western blot (1:500) | |
| Antibody | PCNT (rabbit, polyclonal) | Abcam | ab4448 | Western blot (1:500) IF (1:1000) |
| Antibody | PCNT (mouse, monoclonal) | Abcam | ab28144 | IF (1:1000) |
| Antibody | SASS6 (rabbit, polyclonal) | Dammermann et al., 2004 | Western blot (1:5000) | |
| Antibody | SASS6 (goat, polyclonal) | Santa Cruz Biotechnology | sc-81431 | IF (1:300) |
| Antibody | Glutamylated tubulin (GT335) (mouse, monoclonal) | Adipogen | AG-20B-0020-C100 | IF (1:1000) |
| Antibody | CEP97 (goat, polyclonal) | Santa Cruz Biotechnology | sc-100028 | IF (1:250) |
| Antibody | CEP215 (rabbit, polyclonal) | MilliporeSigma | 06-1398 | Western blot (1:500) IF (1:1000) |
| Antibody | T7 (mouse, monoclonal) | MilliporeSigma | 69522-3 | Western blot (1:1000) |
| Antibody | HA (mouse, monoclonal) | Covance | MMS-101R | Western blot (1:500) |
| Antibody | Myc (goat, polyclonal) | Abcam | ab9132 | Immunoprecipitation (1 μg) |
| Antibody | Anti-mouse Alexa Fluor 488 (donkey, polyclonal) | Thermo Fisher Scientific | A21202 | IF (1:500) |
| Antibody | Anti-rabbit Alexa Fluor 568 (donkey, polyclonal) | Thermo Fisher Scientific | A10042 | IF (1:500) |
| Antibody | Anti-rat Alexa Fluor 647 (donkey, polyclonal) | Jackson ImmunoResearch Laboratories | 712-605-153 | IF (1:500) |
| Antibody | Anti-goat Alexa Fluor 647 (donkey, polyclonal) | Thermo Fisher Scientific | A21447 | IF (1:500) |
| Antibody | Anti-mouse HRP | Bio-Rad Laboratories | 170-6516 | Western blot (1:5000) |
| Antibody | Anti-rabbit HRP | Bio-Rad Laboratories | 170-6515 | Western blot (1:5000) |
| Antibody | Anti-rabbit IRDye 800CW | LI-COR | 926-32211 | Western blot (1:10,000) |
| Antibody | Anti-mouse IRDye 680RD | LI-COR | 926-8070 | Western blot (1:10,000) |
| Chemical compound, drug | DAPI | Invitrogen/Thermo Fisher Scientific | D21490 | 500 ng/mL |
| Chemical compound, drug | Prolong Gold antifade reagent | Life Technologies/Thermo Fisher Scientific | P36930 | |
| Chemical compound, drug | Centrinone B | Tocris Bioscience | 1384545 | Used as indicated |
| Chemical compound, drug | Nutlin-3a | Cayman Chemical | 10004372-1 | 600 nM |
| Chemical compound, drug | RO-3306 | Selleck Chemicals | S7747 | 10 mM |
| Chemical compound, drug | BI-2536 | ChemieTek | CT-BI2536 | 100 nM |
| Chemical compound, drug | MLN8237 | Selleck Chemicals | S1133 | 200 nM |
| Chemical compound, drug | MG132 | Selleck Chemicals | S2619 | 10 mM |
| Chemical compound, drug | G418 | WISENT Bioproducts | 400-130-IG | Used as indicated |
| Chemical compound, drug | SiR-DNA | Spirochrome | CY-SC007 | 200 nM |
| Software | SoftWoRx software | RRID:SCR_019157 | ||
| Software | CellProfiler Image Analysis Software | Broad Institute | RRID:SCR_007358 | |
| Software | R Project for Statistical Computing | RRID:SCR_001905 | ||
| Software | Fiji | Max Planck Institute of Molecular and Cell Biology and Genetics; Dresden; Germany | RRID:SCR_002285 | |
| Software | NIS-Elements | RRID:SCR_014329 | ||
| Software | LI-COR Image Studio Software | RRID:SCR_015795 | ||
| Commercial assay or kit | HiScribe T7 High Yield RNA Synthesis Kit | New England Biolabs | E2040S | |
| Commercial assay or kit | Agencourt RNAClean XP | Beckman Coulter | A63987 | |
| Commercial assay or kit | QIAamp DNA Blood Maxi Kit | Qiagen | 51194 | |
| Commercial assay or kit | QIAprep Spin Miniprep Kit | Qiagen | 27106 | |
| Commercial assay or kit | Lipofectamine RNAiMAX | Life Technologies/Thermo Fisher Scientific | 13778-150 | |
| Commercial assay or kit | Lipofectamine 3000 Transfection Reagent | Life Technologies/Thermo Fisher Scientific | L3000015 | |
| Commercial assay or kit | KAPA HiFi HotStart ReadyMix | Kapa Biosystems | KK2601 | |
| Commercial assay or kit | Q5 Site-Directed Mutagenesis Kit | New England Biolabs | E0554S | |
| Commercial assay or kit | Gibson Assembly Master Mix | New England Biolabs | E2611 | |
| Commercial assay or kit | QuikChange Multi Site Directed Mutagenesis Kit | Agilent | 200513 |
Additional files
-
Supplementary file 1
Summary of screening data.
- https://cdn.elifesciences.org/articles/73944/elife-73944-supp1-v1.xlsx
-
Supplementary file 2
Gene enrichment details for RPE-1 screens.
- https://cdn.elifesciences.org/articles/73944/elife-73944-supp2-v1.xlsx
-
Supplementary file 3
Reagents used in this study.
- https://cdn.elifesciences.org/articles/73944/elife-73944-supp3-v1.xlsx
-
MDAR checklist
- https://cdn.elifesciences.org/articles/73944/elife-73944-mdarchecklist1-v1.docx
-
Source data 1
All original Western blot files (.zip file).
- https://cdn.elifesciences.org/articles/73944/elife-73944-data1-v1.zip
-
Source data 2
All unaltered original images for Western blot labeled with 1395 relevant bands.
(.zip file).
- https://cdn.elifesciences.org/articles/73944/elife-73944-data2-v1.zip
Download links
A two-part list of links to download the article, or parts of the article, in various formats.
Downloads (link to download the article as PDF)
Open citations (links to open the citations from this article in various online reference manager services)
Cite this article (links to download the citations from this article in formats compatible with various reference manager tools)
Global cellular response to chemical perturbation of PLK4 activity and abnormal centrosome number
eLife 11:e73944.
https://doi.org/10.7554/eLife.73944


