Constructing an atlas of associations between polygenic scores from across the human phenome and circulating metabolic biomarkers
- MRC Integrative Epidemiology Unit (IEU), Population Health Sciences, Bristol Medical School, University of Bristol, United Kingdom
Figures
Figure 1
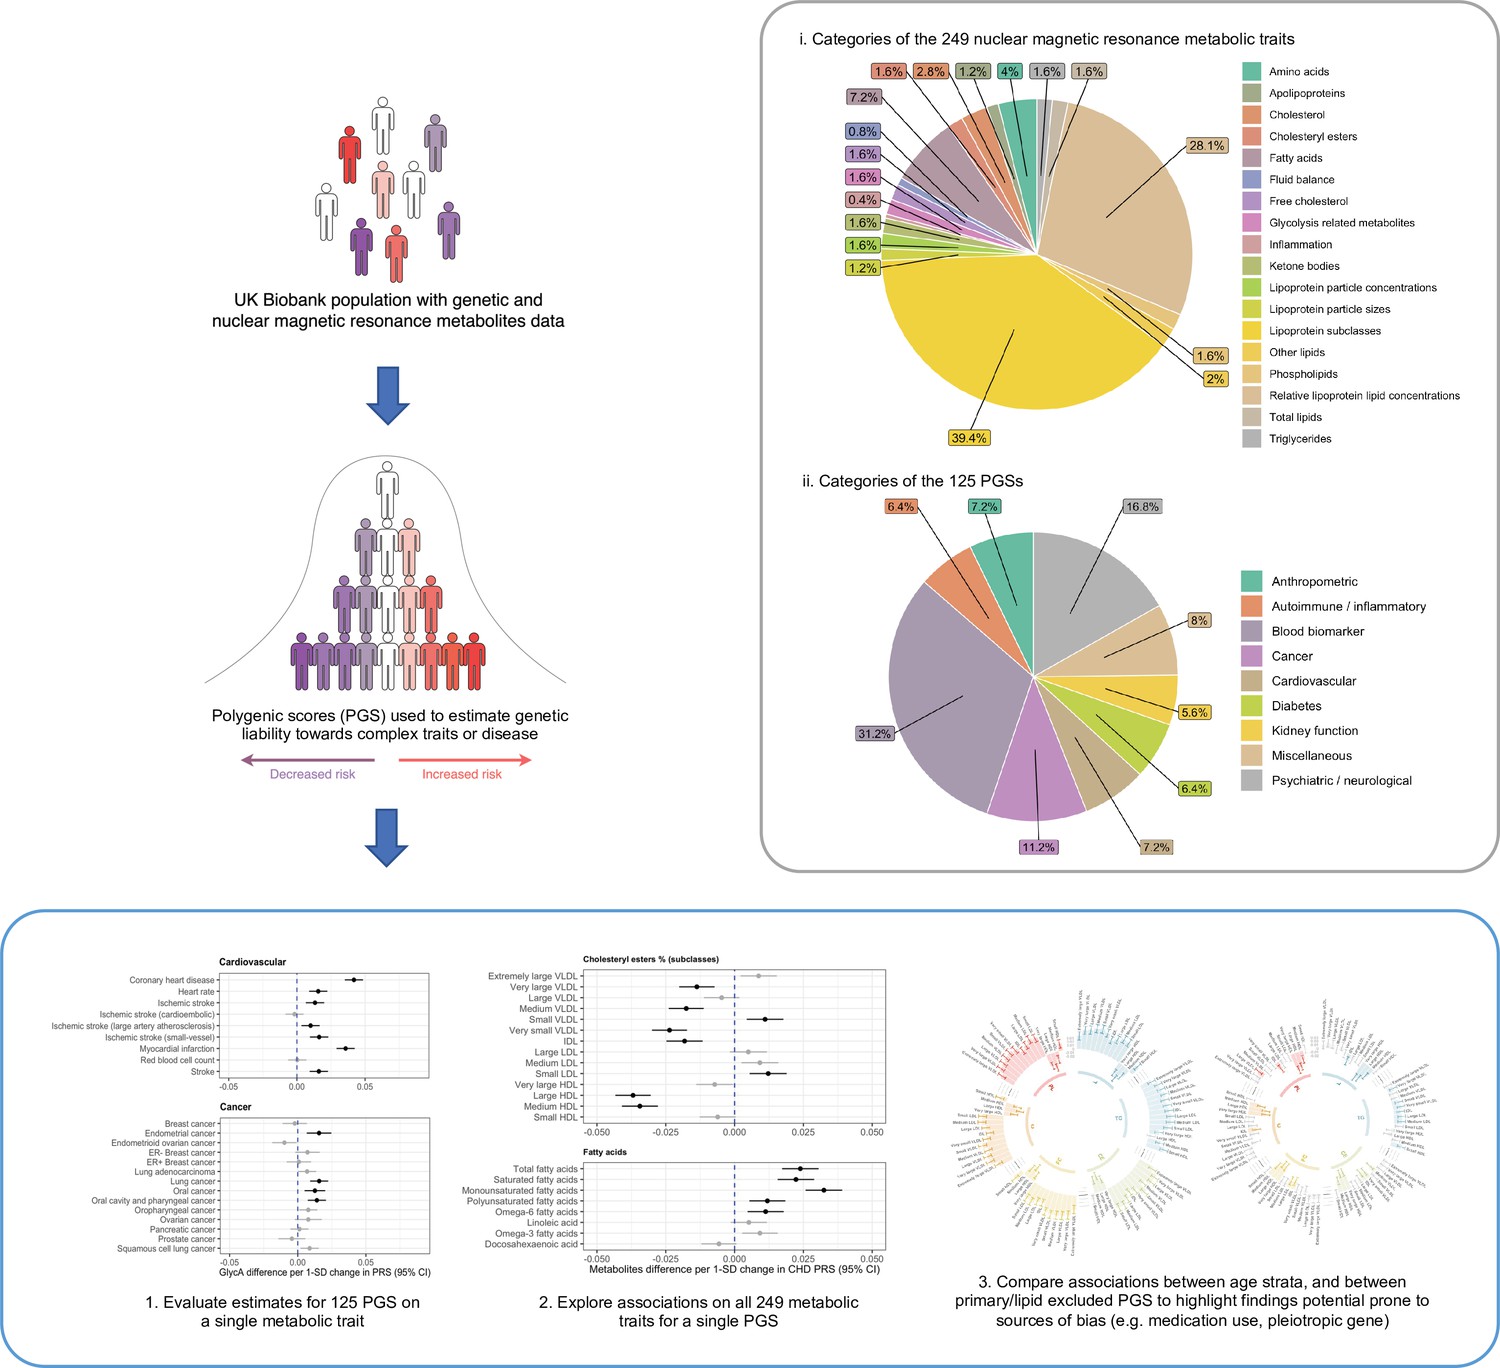
A schematic diagram depicting the data composition and analytical approach undertaken in this study.
Figure 2 with 2 supplements
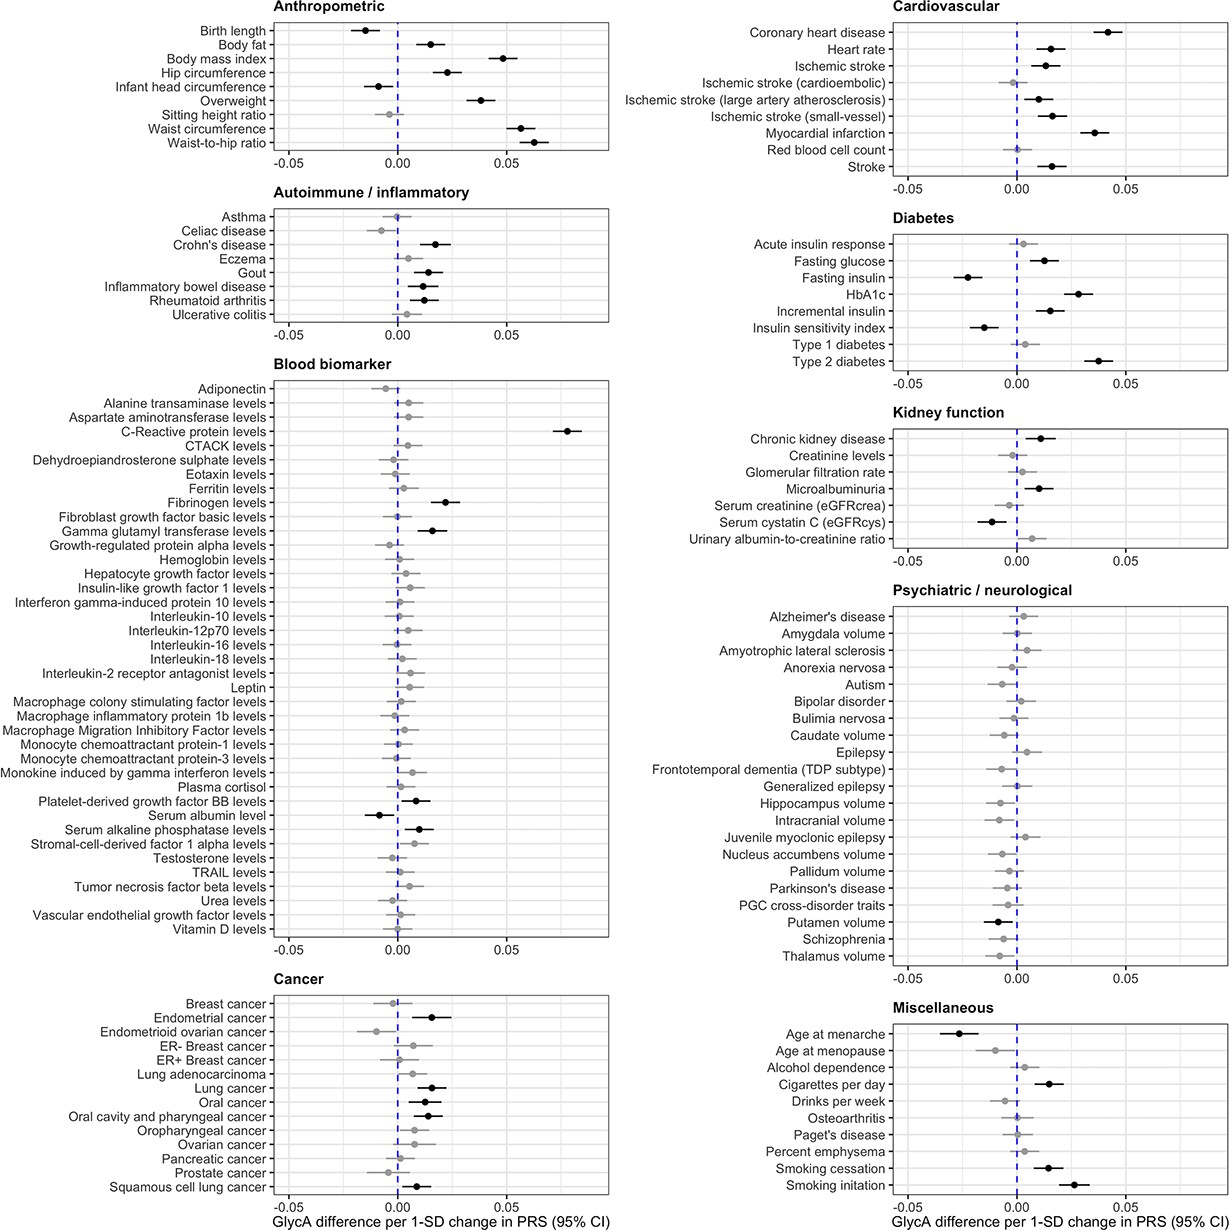
Forest plots depicting results from a systematic evaluation of 125 polygenic scores and their associations with circulating glycoprotein acetyls (GlycA).
Associations were assessed by linear regression on up to 83,004 individuals in the UK Biobank. Error bars represent the 95% confidence intervals for the effect estimates. Results coloured in grey are associations which did not surpass a false discovery date of less than 0.05 to account for multiple testing.
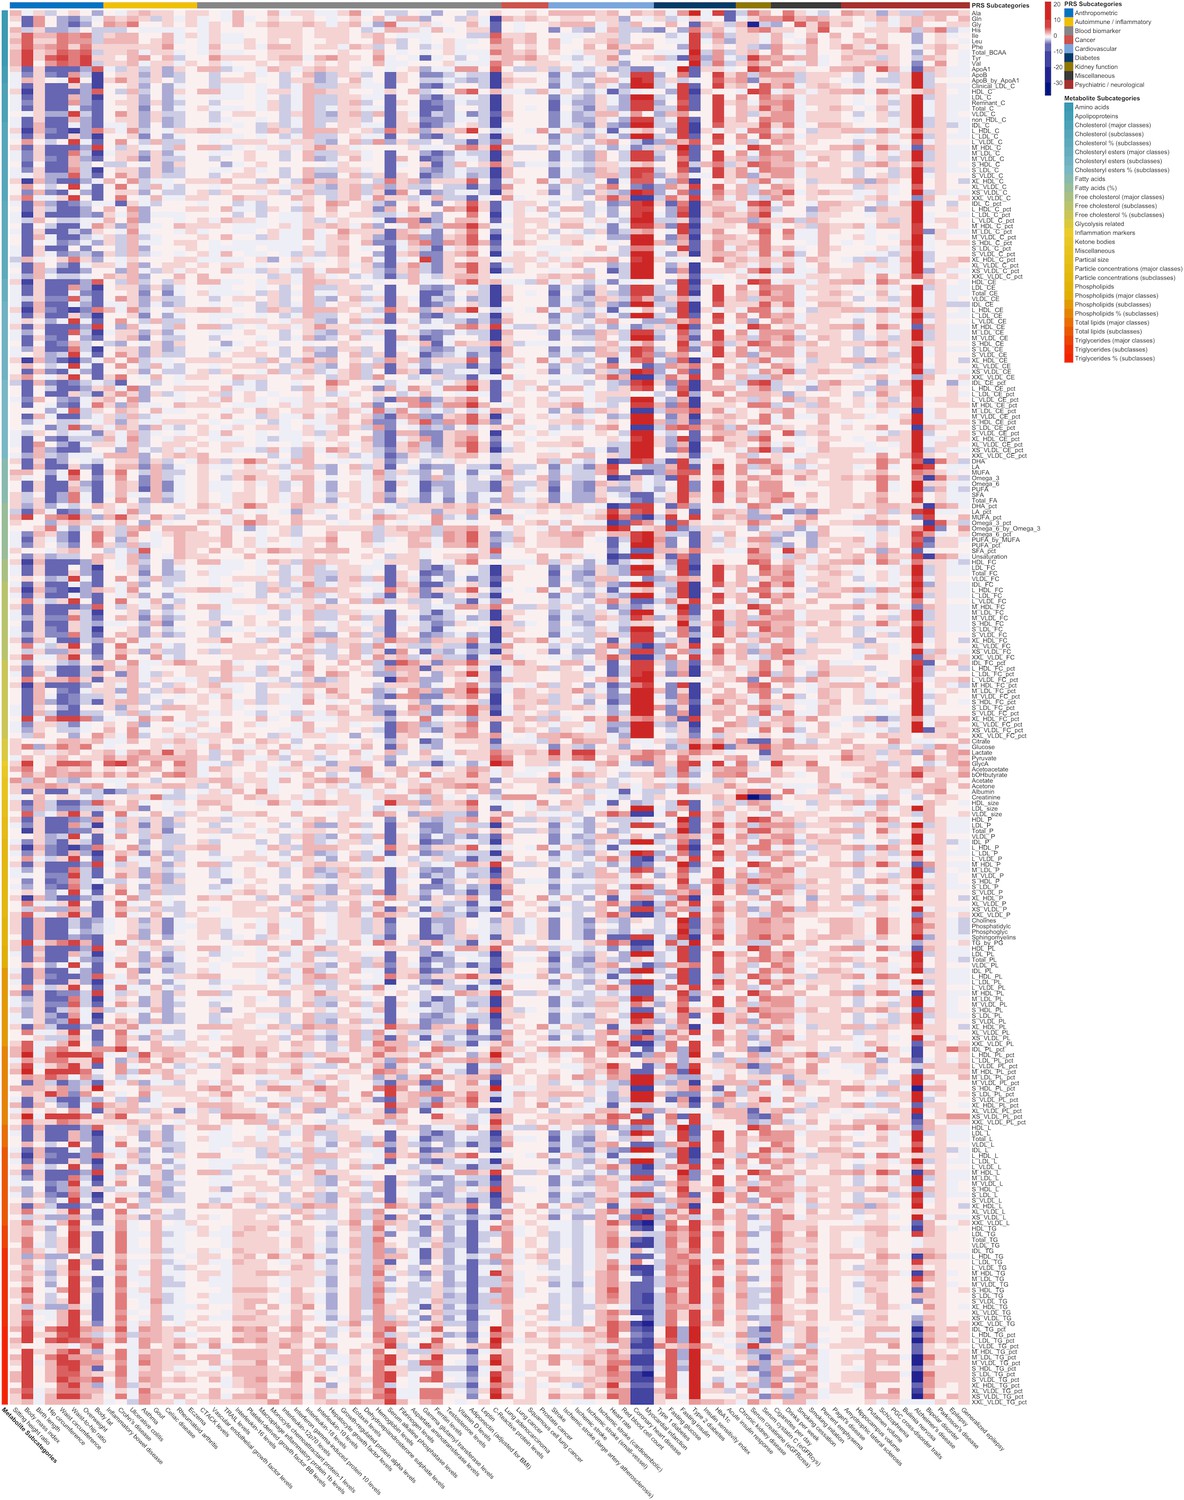
Figure 2—figure supplement 1

Heatmap showing the Z scores of associations between metabolites and PGS that were derived using the lenient criteria (i.e. variant-trait associations with p < 0.05 and linkage disequilibrium (LD) r2 < 0.1).
Associations were assessed by linear regression on up to 83,004 individuals in the UK Biobank. Each row represents a metabolite, and each column represents a PGS. Metabolites and PGS are grouped by their subcategories, which are annotated on the left and top of the heatmap, respectively. Dark red represents a high positive Z score and dark blue represents a high negative Z score.
Figure 2—figure supplement 2
Heatmap showing the Z scores of associations between metabolites and PGS that were derived using the more stringent criteria (i.e. variant-trait associations with p < 5 × 10⁻⁸ and linkage disequilibrium (LD) r2 < 0.001).
Associations were assessed by linear regression on up to 83,004 individuals in the UK Biobank. Each row represents a metabolite, and each column represents a PGS. Metabolites and PGS are grouped by their subcategories, which are annotated on the left and top of the heatmap, respectively. Dark red represents a high positive Z score, and dark blue represents a high negative Z score.
Figure 3
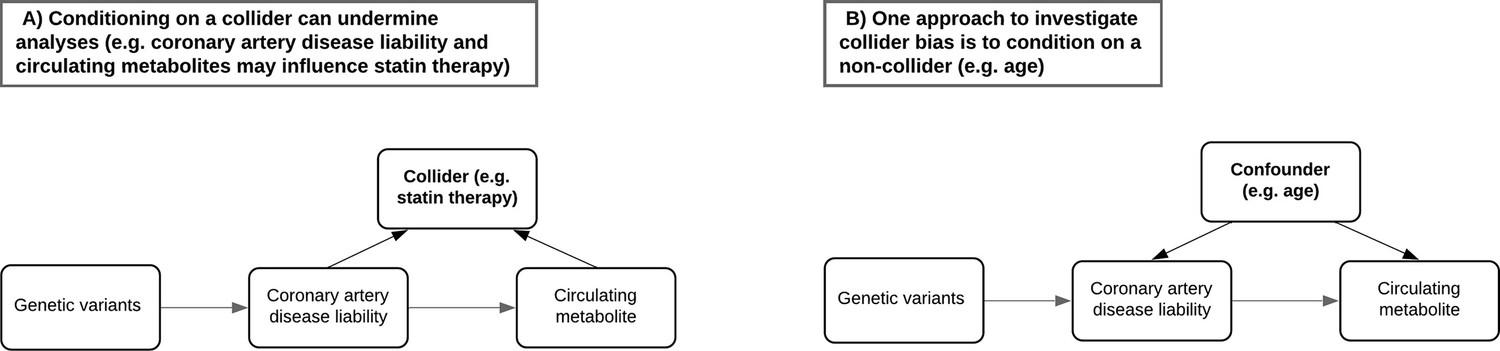
Directed acyclic graphs illustrating the potential collider bias involved in the causal relationship between the coronary artery disease polygenic score and circulating metabolites.
(A) The likelihood of participants in UK Biobank taking medication such as statins is influenced by having a higher genetic predisposition to coronary artery disease but may also be influenced by certain metabolic traits measured on the nuclear magnetic resonance (NMR) panel (e.g. having elevated low-density lipoprotein cholesterol levels). Either stratifying or adjusting for statin use in regression models may therefore induce collider bias into the association between disease liability and metabolic traits. (B) Age is commonly adjusted for in association analyses due to its role as a confounder and cannot be a collider (i.e. exposures and outcomes cannot influence the age of participants). Stratifying samples by age therefore enables the analysis of exposure–outcome associations in a group of participants with relatively consistent confounding effect from age, leading to more robust association estimates in the lower age tertile where the percentage of participants who are regularly taking medication is low. Furthermore, comparisons with participants in the highest age tertile can help highlight associations between polygenic scores and metabolic traits most likely distorted by potential colliders such as statins in the full sample.
Figure 4 with 1 supplement
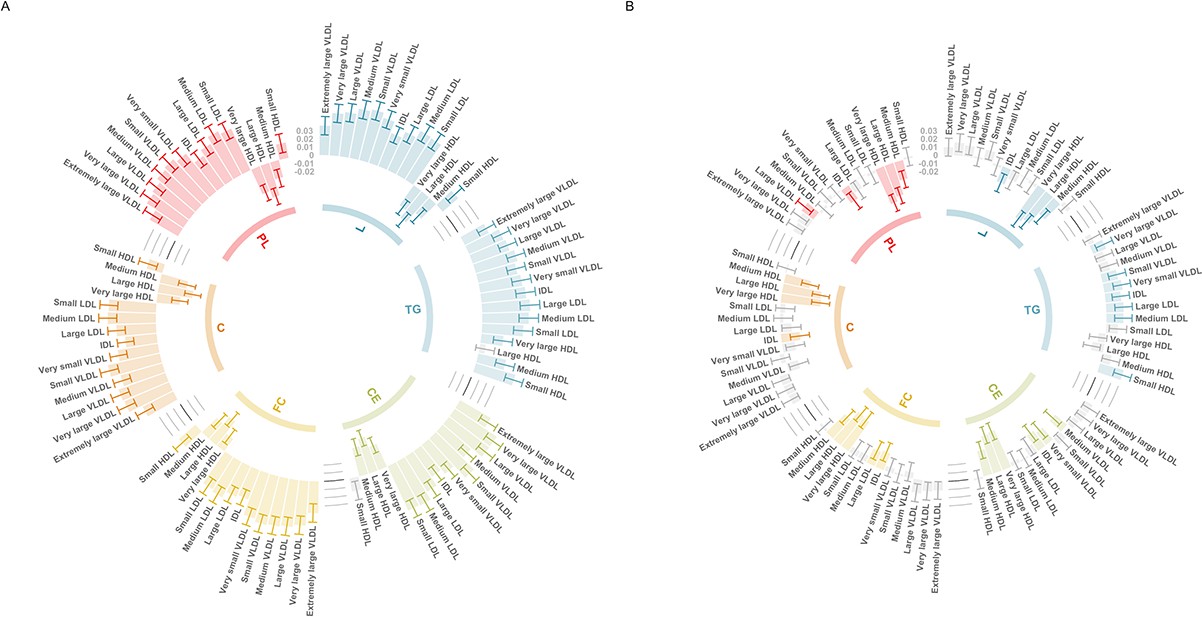
Circos plots illustrating the utility of age-stratified analyses in UK Biobank to investigate potential sources of bias when evaluating associations between polygenic scores (PGS) and circulating metabolites.
Associations were assessed by linear regression on up to 83,004 individuals in the UK Biobank. Error bars represent confidence intervals of the effect estimates between the coronary heart disease (CHD) PGS and traits from the six subclasses: L = total lipids, TG = triglycerides, CE = cholesteryl esters, FC = free cholesterol, C = cholesterol, PL = phospholipids. Grey bars represent associations not robust to multiple testing based on p > 0.05/19. These barcharts are oriented such that those extending to the outer rim reflect a positive association between the CHD PGS and metabolic traits whereas those extending inwards indicate inverse associations. (A) Analyses undertaken for participants in the lowest age tertile (mean age = 47.3 years, 5% statin users) and (B) the corresponding results for the oldest age tertile (mean age = 65.3 years, 29% statin users).
Figure 4—figure supplement 1
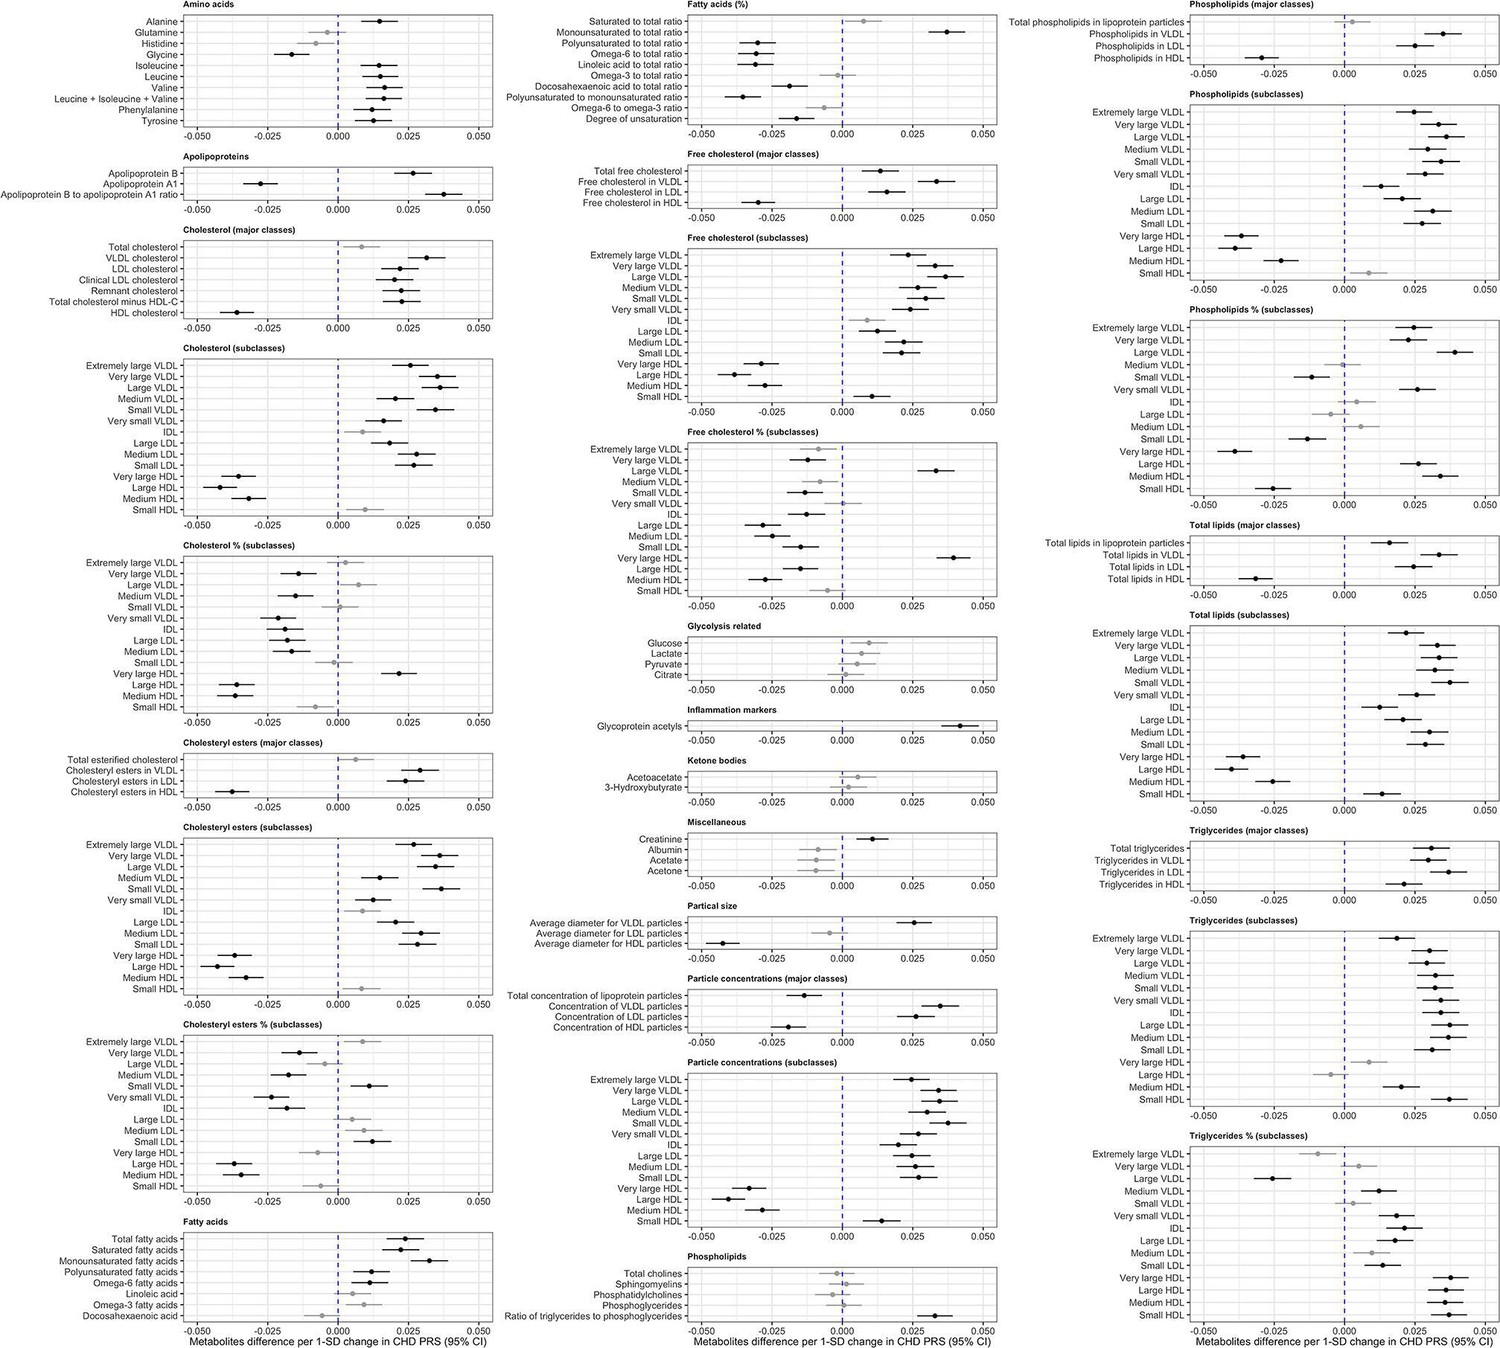
A forest plot illustrating the associations between the polygenic score (PGS) for coronary heart disease (CHD) with 249 circulating metabolic traits in UK Biobank.
Associations were assessed by linear regression on up to 83,004 individuals in the UK Biobank. Error bars represent 95% confidence intervals of the effect estimates. Associations are coloured and clustered based on subclasses of metabolic traits: HDL = high-density lipoprotein lipids, IDL = intermediate-density lipoprotein lipids, LDL = low-density lipoprotein lipids, VLDL = very low-density lipoprotein lipids. Grey estimates represent associations not robust to multiple testing with p value >0.05/19.
Additional files
-
Supplementary file 1
Supplementary tables.
(a) Genome-wide association studies used to derive weights for polygenic risk scores in this study. (b) Metabolic traits analyses in this study from the UK Biobank nuclear magnetic resonance (NMR) panel. (c) Principal component analysis of the NMR metabolites data. (d) Associations with the body mass index polygenic risk score. (e) Mendelian randomization results with very low-density lipoprotein (VLDL) particle size as the exposure and complex traits as the outcome. (f) Polygenic risk scores association for 125 complex traits with glycoprotein acetyls levels. (g) Mendelian randomization results for complex traits and disease liability with glycoprotein acetyls as an outcome. (h) Mendelian randomization results using weighted median and MR-Egger for complex traits and disease liability with glycoprotein acetyls as an outcome. (i) Genetic instruments for glycoprotein acetyls. (j) Mendelian randomization results with glycoprotein acetyls as our exposure and complex traits/diseases as our outcome. (k) Genetic instruments for five proteins contributing to NMR signal of glycoprotein acetyls. (l) Mendelian randomization results with each of the five acute-phase proteins as the exposure and complex traits/diseases as the outcome. (m) Mendelian randomization results using alpha1-antitrypsin as the exposure and gamma glutamyl transferase as the outcome. (n) Associations with the coronary artery disease polygenic score in the full sample. (o) Associations with the coronary artery disease polygenic risk score in the youngest and oldest age tertiles. (p) List of lipid-associated genes removed from polygenic scores in sensitivity analysis. (q) Associations with the Alzheimer’s disease polygenic risk score. (r) Associations with the Alzheimer’s disease polygenic risk score (excluding lipid loci).
- https://cdn.elifesciences.org/articles/73951/elife-73951-supp1-v1.xlsx
-
Transparent reporting form
- https://cdn.elifesciences.org/articles/73951/elife-73951-transrepform1-v1.pdf
Download links
A two-part list of links to download the article, or parts of the article, in various formats.
Downloads (link to download the article as PDF)
Open citations (links to open the citations from this article in various online reference manager services)
Cite this article (links to download the citations from this article in formats compatible with various reference manager tools)
Constructing an atlas of associations between polygenic scores from across the human phenome and circulating metabolic biomarkers
eLife 11:e73951.
https://doi.org/10.7554/eLife.73951


