Arbidol inhibits human esophageal squamous cell carcinoma growth in vitro and in vivo through suppressing ataxia telangiectasia and Rad3-related protein kinase
- Pathophysiology Department, The School of Basic Medical Sciences, Zhengzhou University, China
- China-US Hormel Cancer Institute, China
- Collaborative Innovation Center of Henan Province for Cancer Chemoprevention, Zhengzhou University, China
- State Key Laboratory of Esophageal Cancer Prevention and Treatment, China
- Department of Animal Science and Biotechnology, Kyungpook National University, Republic of Korea
- Cancer Chemoprevention International Collaboration Laboratory, China
Figures
Figure 1

Arbidol inhibits ESCC cell proliferation.
(a) The structure of Arbidol. (b) KYSE150, KYSE450, and shantou human embryonic esophageal (SHEE) cell viability was detected by the IN Cell Analyzer. KYSE150 and KYSE450 cells were treated with different concentrations of Arbidol (0, 6.25, 12.5, 25, 50, and 100 μM) for 24 hr and 48 hr and evaluated by 4’,6-diamidino-2-phenylindole. IC50 values were calculated by SPSS 24.0 software (IBM, USA). (c) KYSE150, KYSE450, and SHEE cells were treated with Arbidol (0, 6.25, 12.5, 25, 50, and 100 μM) at different concentrations as indicated for 24 hr and 48 hr. Cell viability was then determined by IN Cell Analyzer. (d) The effect of different concentrations of Arbidol (0, 2.5, 5, 10, and 20 μM) on SHEE, KYSE150, and KYSE450 cells for 0, 24, 48, 72, and 96 hr. Data were analyzed by homogeneity of variance and one-way analysis of variance (ANOVA). Asterisks indicate a significant decrease *p<0.05, **p<0.01, ***p<0.001, respectively. (e) Arbidol effectively inhibits anchorage-independent cell growth. Colony numbers were counted using an IN Cell Analyzer. Data were analyzed by homogeneity of variance and one-way ANOVA. Asterisks indicate a significant difference, *p<0.05, ** p<0.01, and ***p<0.001, n=3, compared with the control group. (f) Arbidol effectively inhibits colony formation in esophageal squamous cell carcinoma (ESCC) cell lines. KYSE150 (200/well) and KYSE450 (400/well) cells were seeded in 6-well plates and treated with different concentrations of Arbidol (0, 2.5, 5, 10, and 20 μM). The numbers of cell colonies were counted after 10–14 days. Data were analyzed by homogeneity of variance and one-way ANOVA. Asterisks indicate a significant difference, *p<0.05, ** p<0.01, and ***p<0.001, n=3, compared with the control group.
Figure 2 with 1 supplement
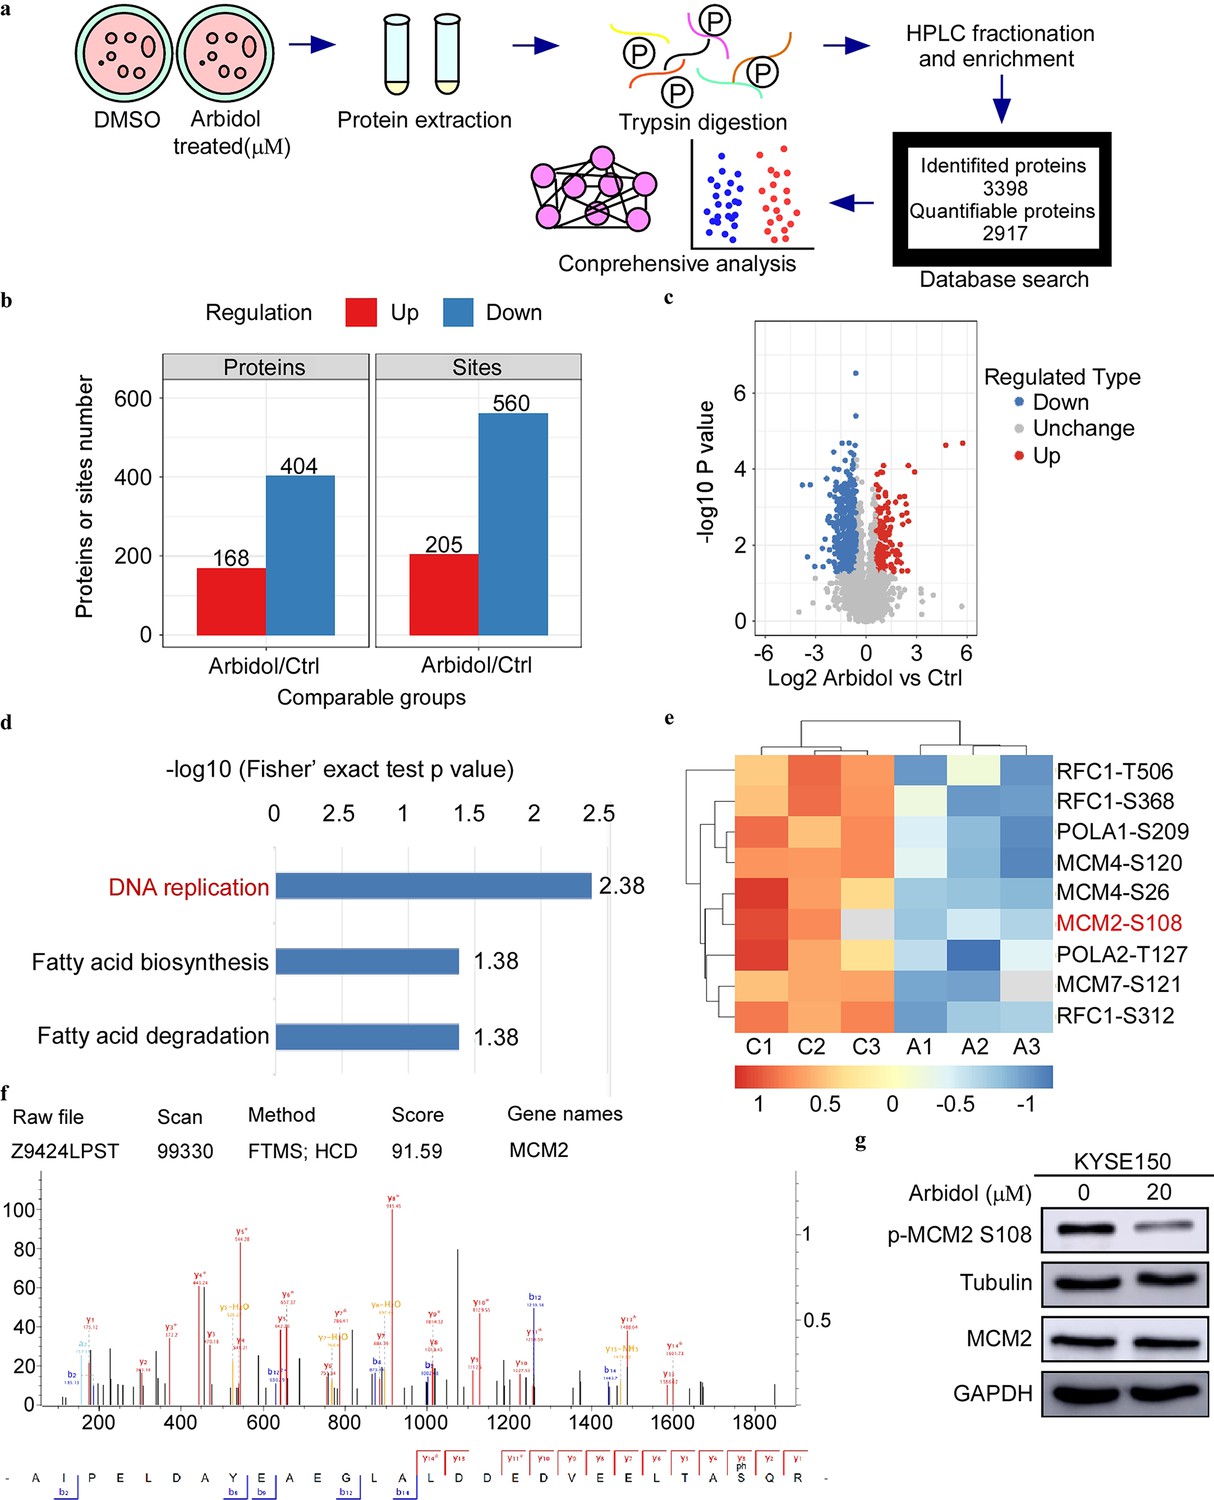
Phosphoproteomics reveals that Arbidol inhibits tumors through minichromosome maintenance-ataxia telangiectasia and Rad3-related (MCM-ATR) signal pathway.
(a) The mass spectrometry workflow of phosphorylated proteomics analysis of KYSE150 cells after 24 hr treatment with Arbidol. (b) Histogram shows the regulation of phosphorylation sites compared to the control group. (c) The volcano plot shows that 375 phosphorylation sites changed significantly. (d) Kyoto Encyclopedia of Genes and Genome (KEGG) analysis indicated that three downregulated pathways were enriched. (e) Phosphorylation proteomics analysis of esophageal squamous cell carcinoma (ESCC) cell after 20 μM Arbidol treatment. The different phosphorylation sites were plotted as heat maps. (f) Distribution of peptide mass error and length of protein peptides identified in this study. (g) Western blot analysis shows that the phosphorylation of MCM2 S108 is markedly downregulated after 24 hr of Arbidol treatment.
-
Figure 2—source data 1
The original data of western blot in Figure 2.
- https://cdn.elifesciences.org/articles/73953/elife-73953-fig2-data1-v2.tif
Figure 2—figure supplement 1

Arbidol did not bind directly to CDC7.
The KYSE150 cell lysate (500 μg) was incubated with sepharose 4B beads conjugated with Arbidol or sepharose 4B beads alone. Western blot analysis was used to analyze the pull-down protein.
-
Figure 2—figure supplement 1—source data 1
Arbidol did not bind directly to CDC7.
- https://cdn.elifesciences.org/articles/73953/elife-73953-fig2-figsupp1-data1-v2.tif
Figure 3 with 1 supplement
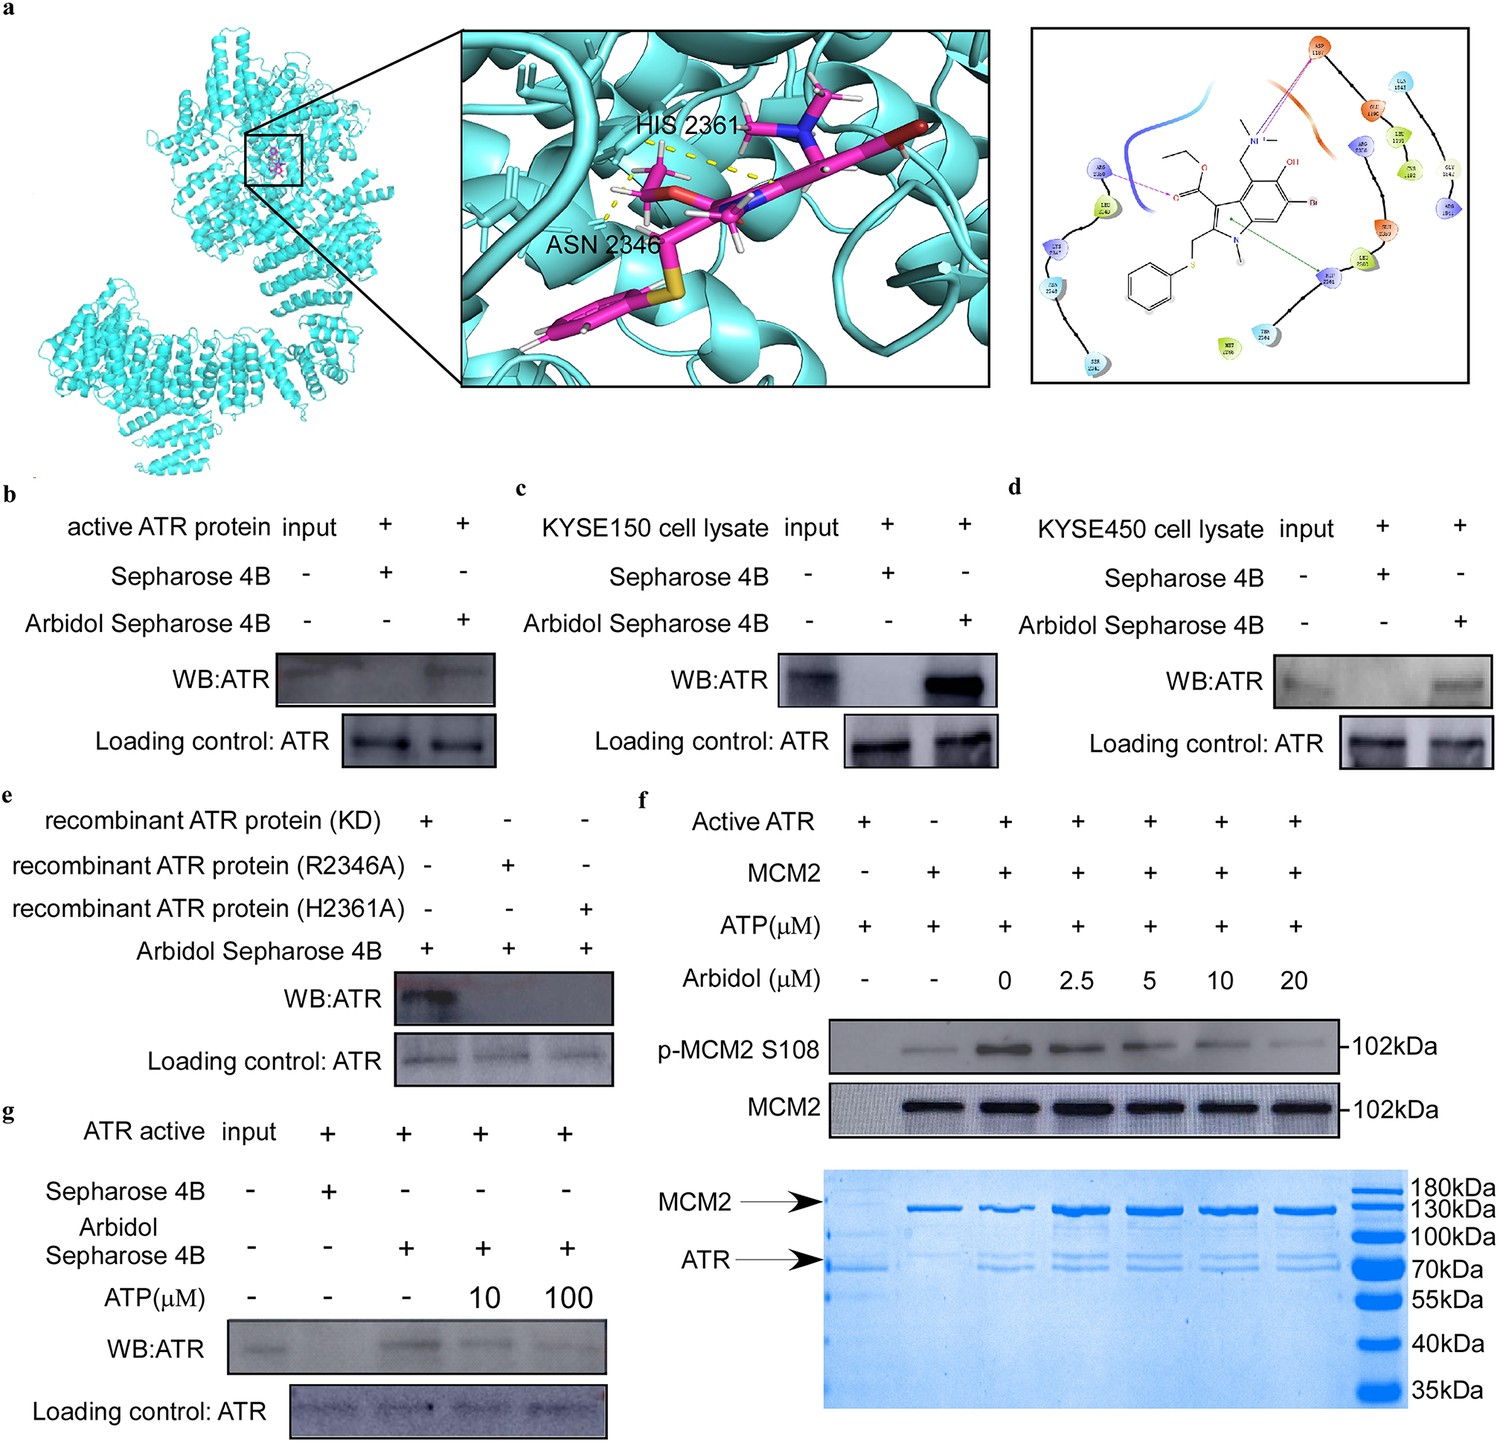
Arbidol targets ataxia telangiectasia and Rad3-related (ATR) protein to affect the DNA replication pathway in ESCC.
(a) Computational docking was used to identify the binding site of Arbidol and ATR. (b-d) Arbidol directly binds to ATR. The ATR pure protein (1 μg) (b) and esophageal squamous cell carcinoma (ESCC) cell lysate (500 μg) (c, d) were incubated with sepharose 4B beads conjugated with Arbidol or sepharose 4B beads alone. Western blot analysis was used to analyze the pull-down protein. (e) The Arbidol pull-down assay and amino acid site mutation of ATR protein. (f) In vitro kinase assay. Arbidol attenuated the phosphorylation of minichromosome maintenance 2 (MCM2) by inhibiting the kinase activity of ATR. Purified MCM2 protein was used as the substrate for the in vitro kinase assay with 200 ng active ATR (SignalChem) at room temperature for 15 min. (g) ATP competition assay. ATR pure protein (1 μg) was incubated for 16 hr with sepharose 4B beads conjugated with Arbidol, and with ATP (10 μg or 100 μg) or sepharose 4B beads alone. Western blot analysis was used to analyze the pull-down protein.
-
Figure 3—source data 1
The original data of western blot in Figure 3.
- https://cdn.elifesciences.org/articles/73953/elife-73953-fig3-data1-v2.tif
Figure 3—figure supplement 1

Purified MCM2 and ATR protein.
(a) Coomassie blue-stained gel of purified minichromosome maintenance 2 (MCM2), the black arrow indicates MCM2. (b) Mutant ataxia telangiectasia and Rad3-related (ATR) protein purified by coomassie bright blue staining gel; wild type protein was loaded into the first lane, mutant ATR protein was loaded into the the second and third lanes.
Figure 4 with 2 supplements
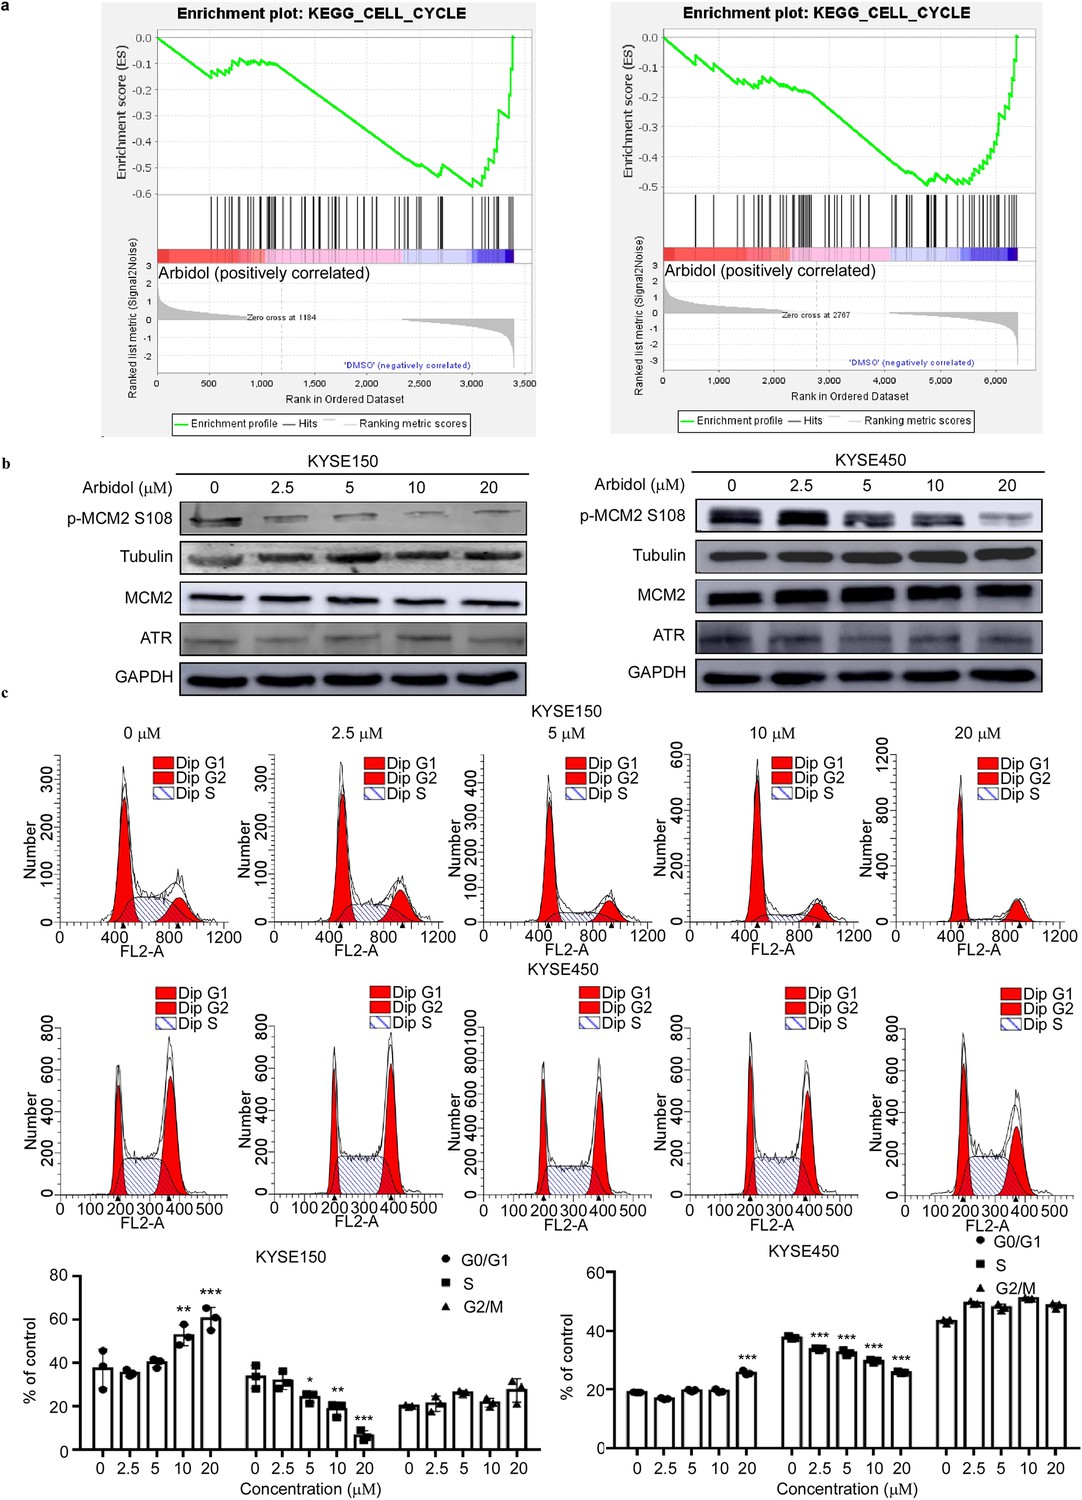
Arbidol inhibits the proliferation of ESCC cells and arrests the cell cycle in G1-phase.
(a) Gene Set Enrichment Analysis (GSEA) indicates the representation of the cell cycle pathway in both the phosphoproteomics and proteomics datasets. (b) The expression level of p-minichromosome maintenance 2 (MCM2) S108 decreases with increasing concentrations of Arbidol in KYSE150 and KYSE450 cells (0, 2.5, 5, 10, and 20 μM), as confirmed by western blot. (c) After 24 hr of Arbidol treatment, KYSE150 and KYSE450 cells were stained with propidium iodide (PI) and the cell cycle distribution was analyzed using flow cytometry. The quantitative cell cycle distribution data of KYSE150 cells were shown here. Data were analyzed by homogeneity of variance and one-way analysis of variance (ANOVA). *p<0.05, ** p<0.01, and ***p<0.001, n=3. ESCC: esophageal squamous cell carcinoma.
-
Figure 4—source data 1
The original data of western blot in Figure 4.
- https://cdn.elifesciences.org/articles/73953/elife-73953-fig4-data1-v2.tif
Figure 4—figure supplement 1
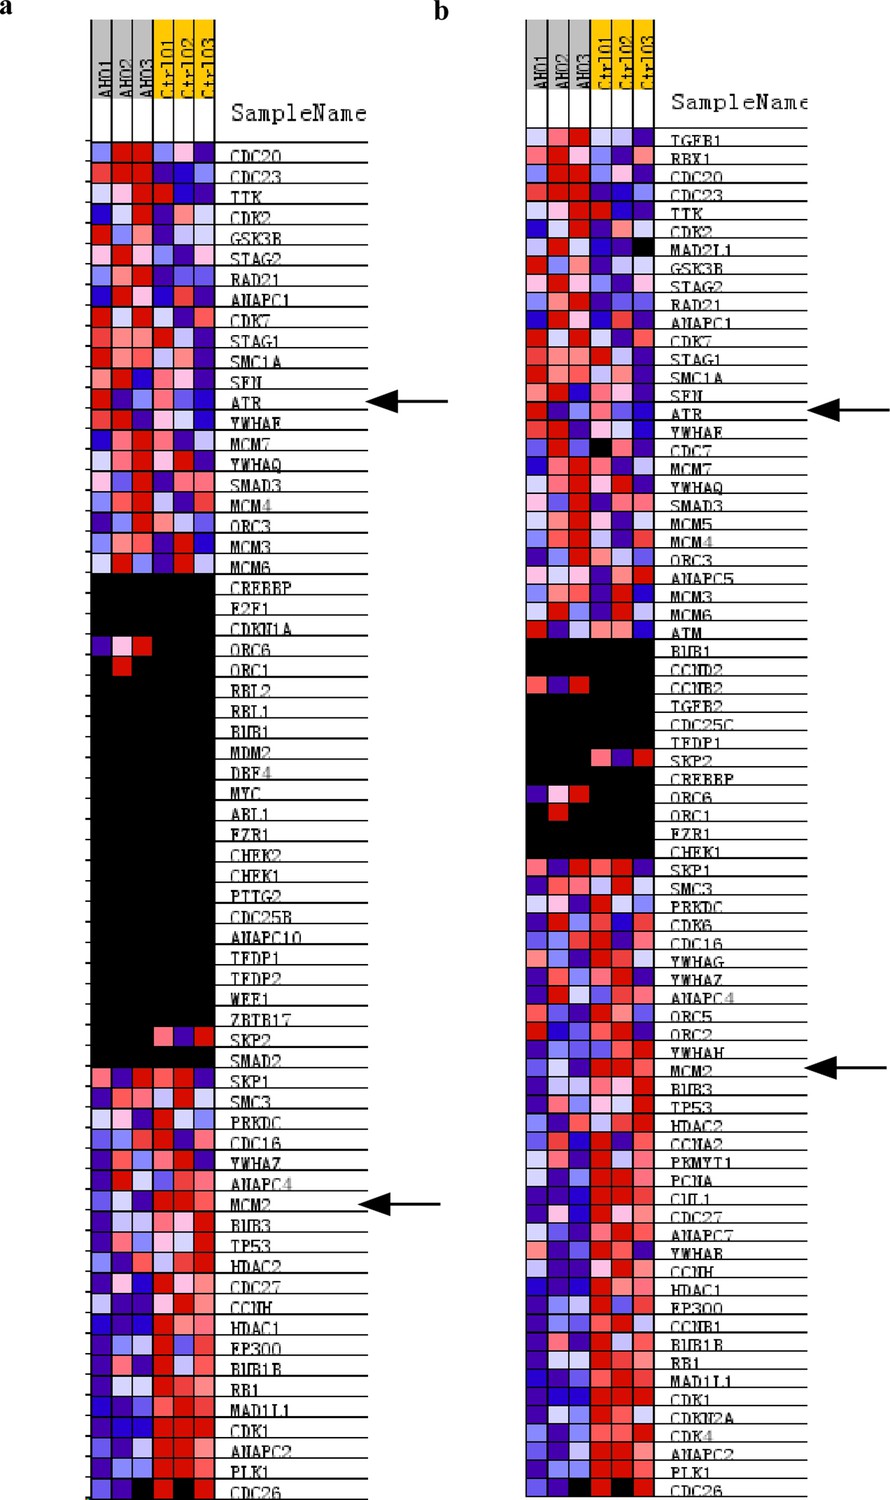
Gene set enrichment analysis (GSEA) data.
(a, b) Gene set enrichment analysis (GSEA) included the phosphoproteomics (a) and proteomics (b) datasets. The black arrow indicates minichromosome maintenance 2 (MCM2) and ataxia telangiectasia and Rad3-related (ATR).
Figure 4—figure supplement 2
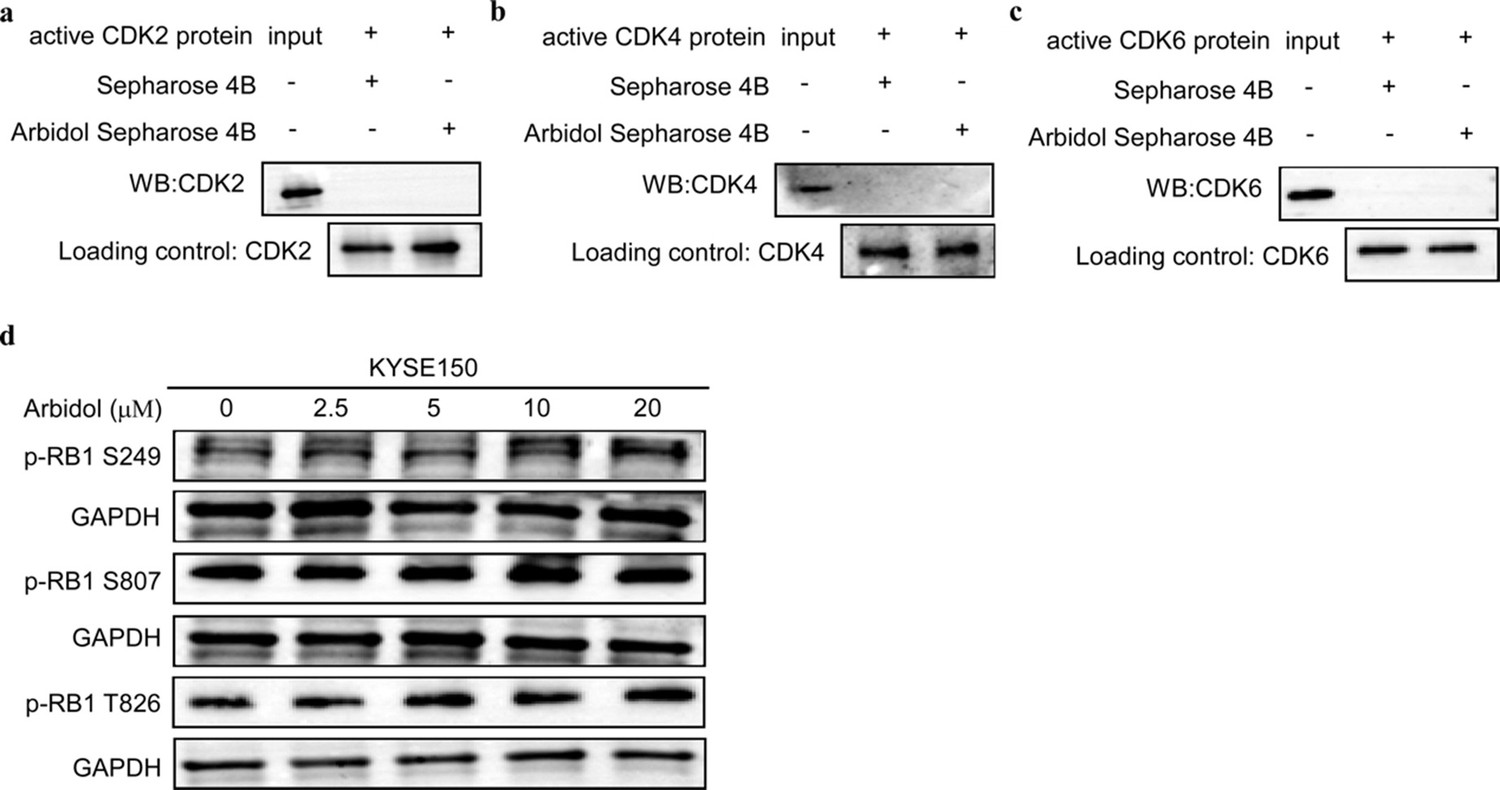
Arbidol can not bind directly to CDK2,CDK4, CDK6 and can not decrease the levels of p-RB1 S249, S807 and T826.
(a, b, c) Arbidol did not bind directly to CDK2, CDK4, CDK6. Recombinant CDK2 protein (a) recombinant CDK4 protein (b) recombinant CDK6 protein (c) (500 μg) were incubated with sepharose 4B beads conjugated with Arbidol or sepharose 4B beads alone. Western blot analysis was used to analyze the pull-down protein. (d) Western blot results confirmed that the expression level of p-RB1 S249, S807, T826 were not associated with increasing concentrations of Arbidol in KYSE150 and KYSE450 cells (0, 2.5, 5, 10, and 20 μM).
-
Figure 4—figure supplement 2—source data 1
The original data of western Blot in Figure 4—figure supplement 2.
- https://cdn.elifesciences.org/articles/73953/elife-73953-fig4-figsupp2-data1-v2.tif
Figure 5
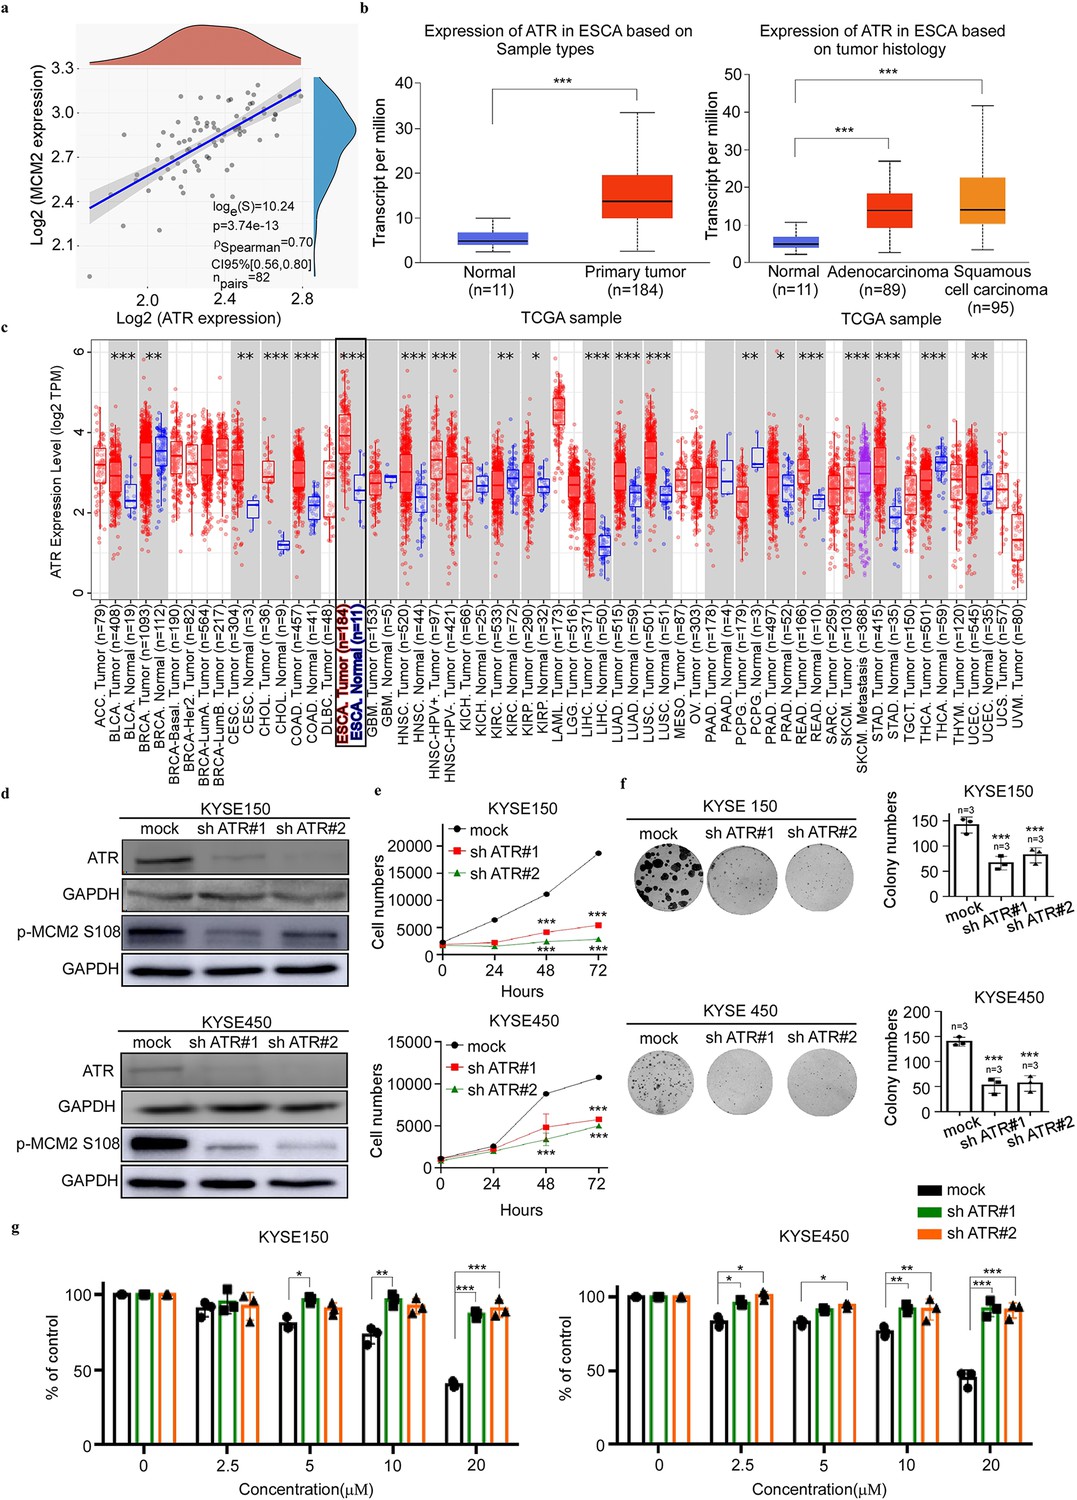
Knocking down of ATR reduces the growth of ESCC cells.
(a) The correlation between ataxia telangiectasia and Rad3-related (ATR) and minichromosome maintenance 2 (MCM2) was detected by gene correlation analysis. (b) The Cancer Genome Atlas data results showing the expression of ATR in different cancer types, including esophageal cancer and normal tissue, as well as the statistical chart illustrating esophageal cancer classification. Statistical analyses were performed using R software v4.0.3 (R Foundation for Statistical Computing, Vienna, Austria). p-value of <0.05 was considered statistically significant. (c) The picture is from the results of bioassay on the association between ATR and pan-cancer on Timer 2.0, which includes esophageal cancer. Statistical analyses were performed using R software v4.0.3 (R Foundation for Statistical Computing, Vienna, Austria). The rank sum test detected two sets of data and a p-value of <0.05 is considered statistically significant. (d) KYSE150 and KYSE450 cell lines stably expressing knockdown (KD) shATR or mock were established. The expression of ATR and MCM2 S108 is confirmed by western blot. (e) The effect of ATR gene KD on the growth of esophageal cancer cells. The stable KD sh ATR cells were seeded into 96-well plates, fixed at 0, 24, 48, 72 hr, and stained with 4′,6-diamidino-2-phenylindole, and analyzed by IN cell analyzer. Data were analyzed by homogeneity of variance and one-way analysis of variance (ANOVA). ***p<0.001, n=3. (f) The effect of ATR gene KD on the clonogenic potential of esophageal cancer cells. KYSE150 (200/well) and KYSE450 (400/well) cells were seeded on a 6-well plate. The number of cell colonies were counted after 15 days. Data were analyzed by homogeneity of variance and one-way analysis of variance (ANOVA). Asterisks indicate a significant difference, ***p<0.001, n=3, compared with the control group. (g) The effect of Arbidol on the growth of esophageal squamous cell carcinoma (ESCC) cells was evaluated in cells stably expressing sh ATR or cells stably expressing mock. After inoculating the cells for 12 hr, they were in the presence or absence of different concentrations of Arbidol, and analyzed with IN Cell Analyzer 96 hr later. Data were analyzed by homogeneity of variance and one-way analysis of variance (ANOVA). *p<0.05, ***p<0.001, ***p<0.001, n=3.
-
Figure 5—source data 1
The original data of western blot in Figure 5.
- https://cdn.elifesciences.org/articles/73953/elife-73953-fig5-data1-v2.tif
Figure 6
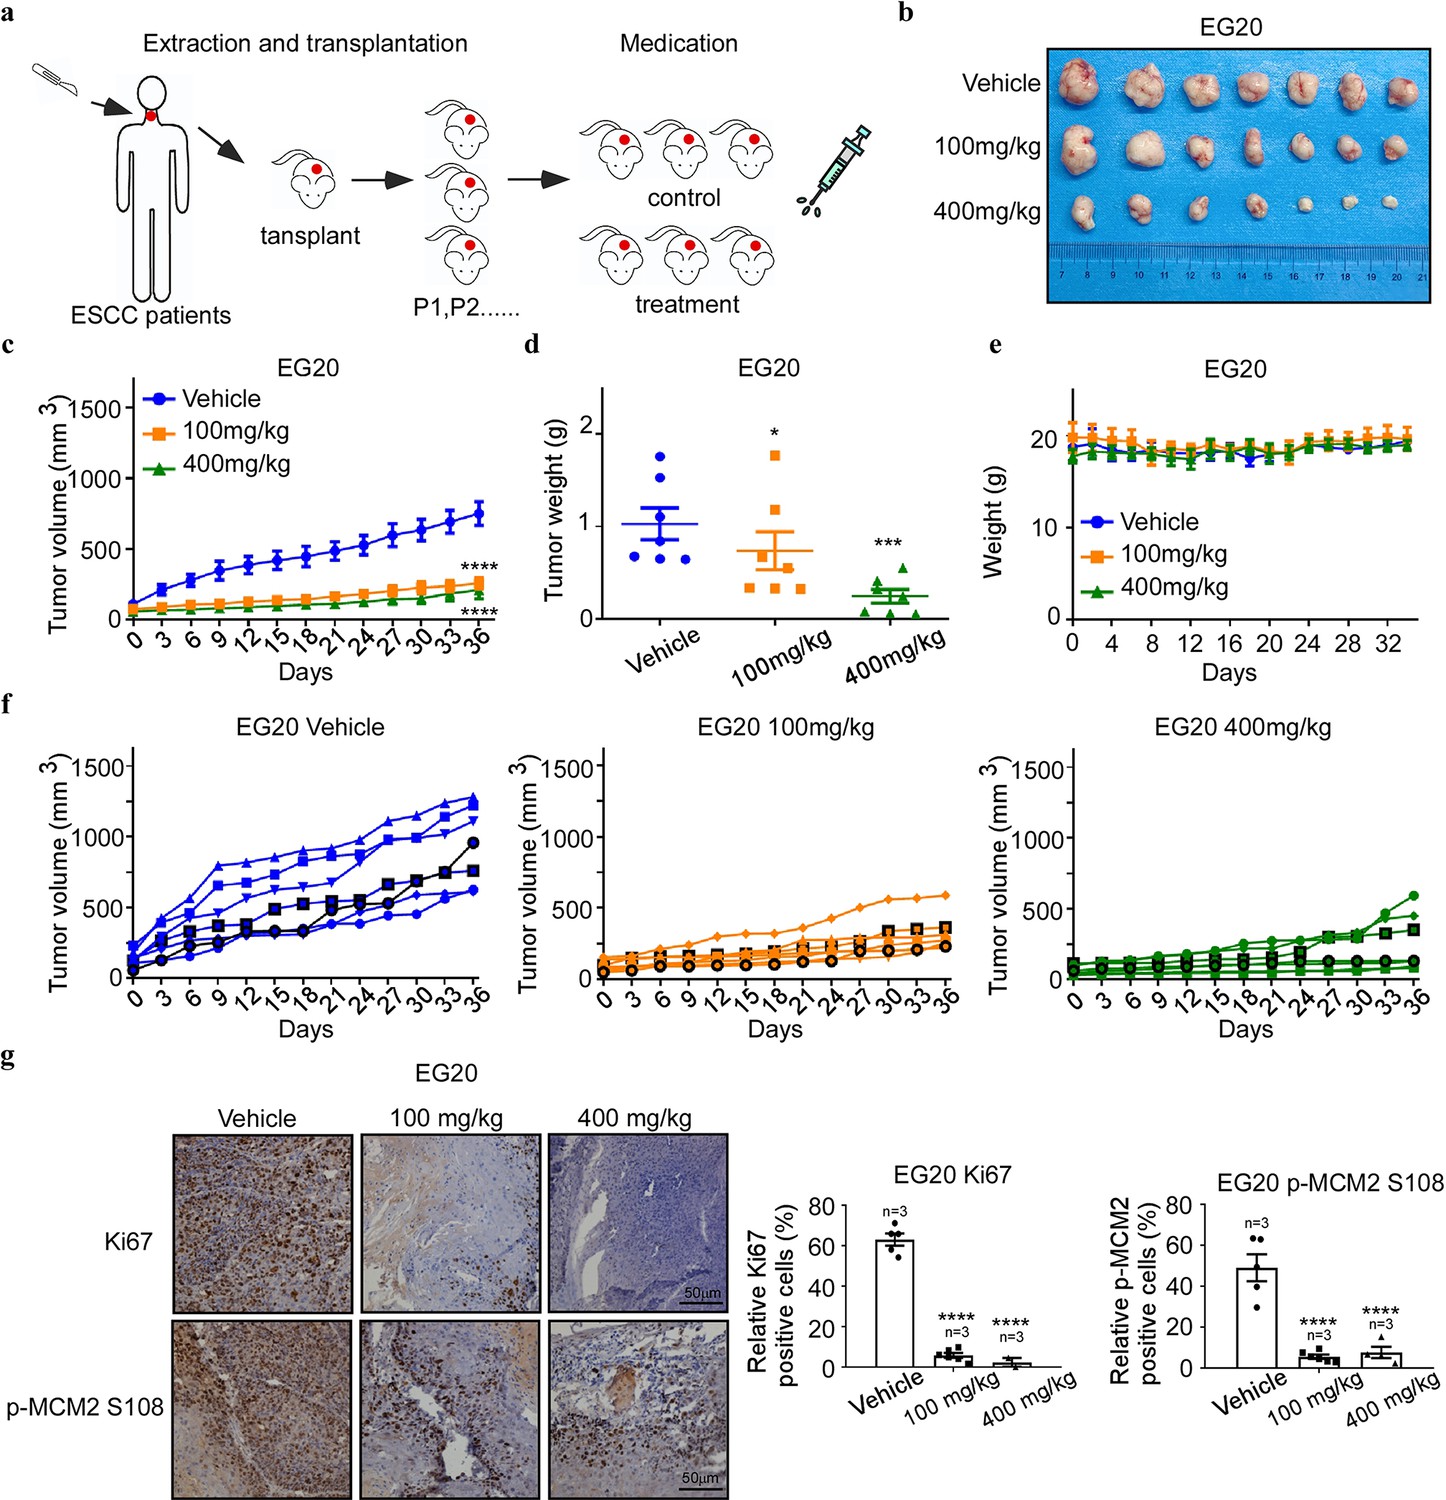
Antitumor efficacy of Arbidol in an ESCC patient-derived xenograft model.
(a) Arbidol treatment protocol for esophageal squamous cell carcinoma (ESCC) patient-derived xenograft (PDX) models. (b) Tumor sizes of the EG20 xenografts were shown. Tumors were excised and weighed at the end of the experiment (36 days after treatment). (c) The effect of Arbidol inhibition on in vivo tumor growth was determined using ESCC PDX models: EG20. Mice (n=7 per group) were treated with vehicle (saline, oral administration, daily) or Arbidol (low = 100 mg/kg, high = 400 mg/kg, daily) for 36 days. Tumor volumes were measured every 3 days. Data were analyzed by homogeneity of variance and one-way analysis of variance (ANOVA). Data are presented as the mean, ****p<0.0001. (d) Tumor growth curve of single mouse grafted with EG20 is shown. n=7 per group. (e) Weight of mice treated with Arbidol. Data were analyzed by homogeneity of variance and one-way analysis of variance (ANOVA). *p<0.05, ***p<0.001. (f) Tumor volume of each group was shown, respectively, n=7 per group. (g) The expression of tumor proliferation markers Ki67 and target engagement was verified by immunohistochemical analysis of minichromosome maintenance 2 (MCM2) S108 expression in Arbidol-treated EG20 PDX mice, n=7 per group. Data were analyzed by homogeneity of variance and one-way ANOVA. *p<0.05, ***p<0.001, ****p<0.0001. Scale Bars: 50 μm.
Additional files
Download links
A two-part list of links to download the article, or parts of the article, in various formats.
Downloads (link to download the article as PDF)
Open citations (links to open the citations from this article in various online reference manager services)
Cite this article (links to download the citations from this article in formats compatible with various reference manager tools)
Arbidol inhibits human esophageal squamous cell carcinoma growth in vitro and in vivo through suppressing ataxia telangiectasia and Rad3-related protein kinase
eLife 11:e73953.
https://doi.org/10.7554/eLife.73953


