Hydrop enables droplet-based single-cell ATAC-seq and single-cell RNA-seq using dissolvable hydrogel beads
- VIB-KU Leuven/VIB Center for Brain & Disease Research, Belgium
- Laboratory of Computational Biology, Department of Human Genetics, KU Leuven, Belgium
- Aligning Science Across Parkinson’s (ASAP) Collaborative Research Network, United States
- Laboratory of Synapse Biology, Department of Neurosciences, KU Leuven, Belgium
Figures
Figure 1 with 6 supplements
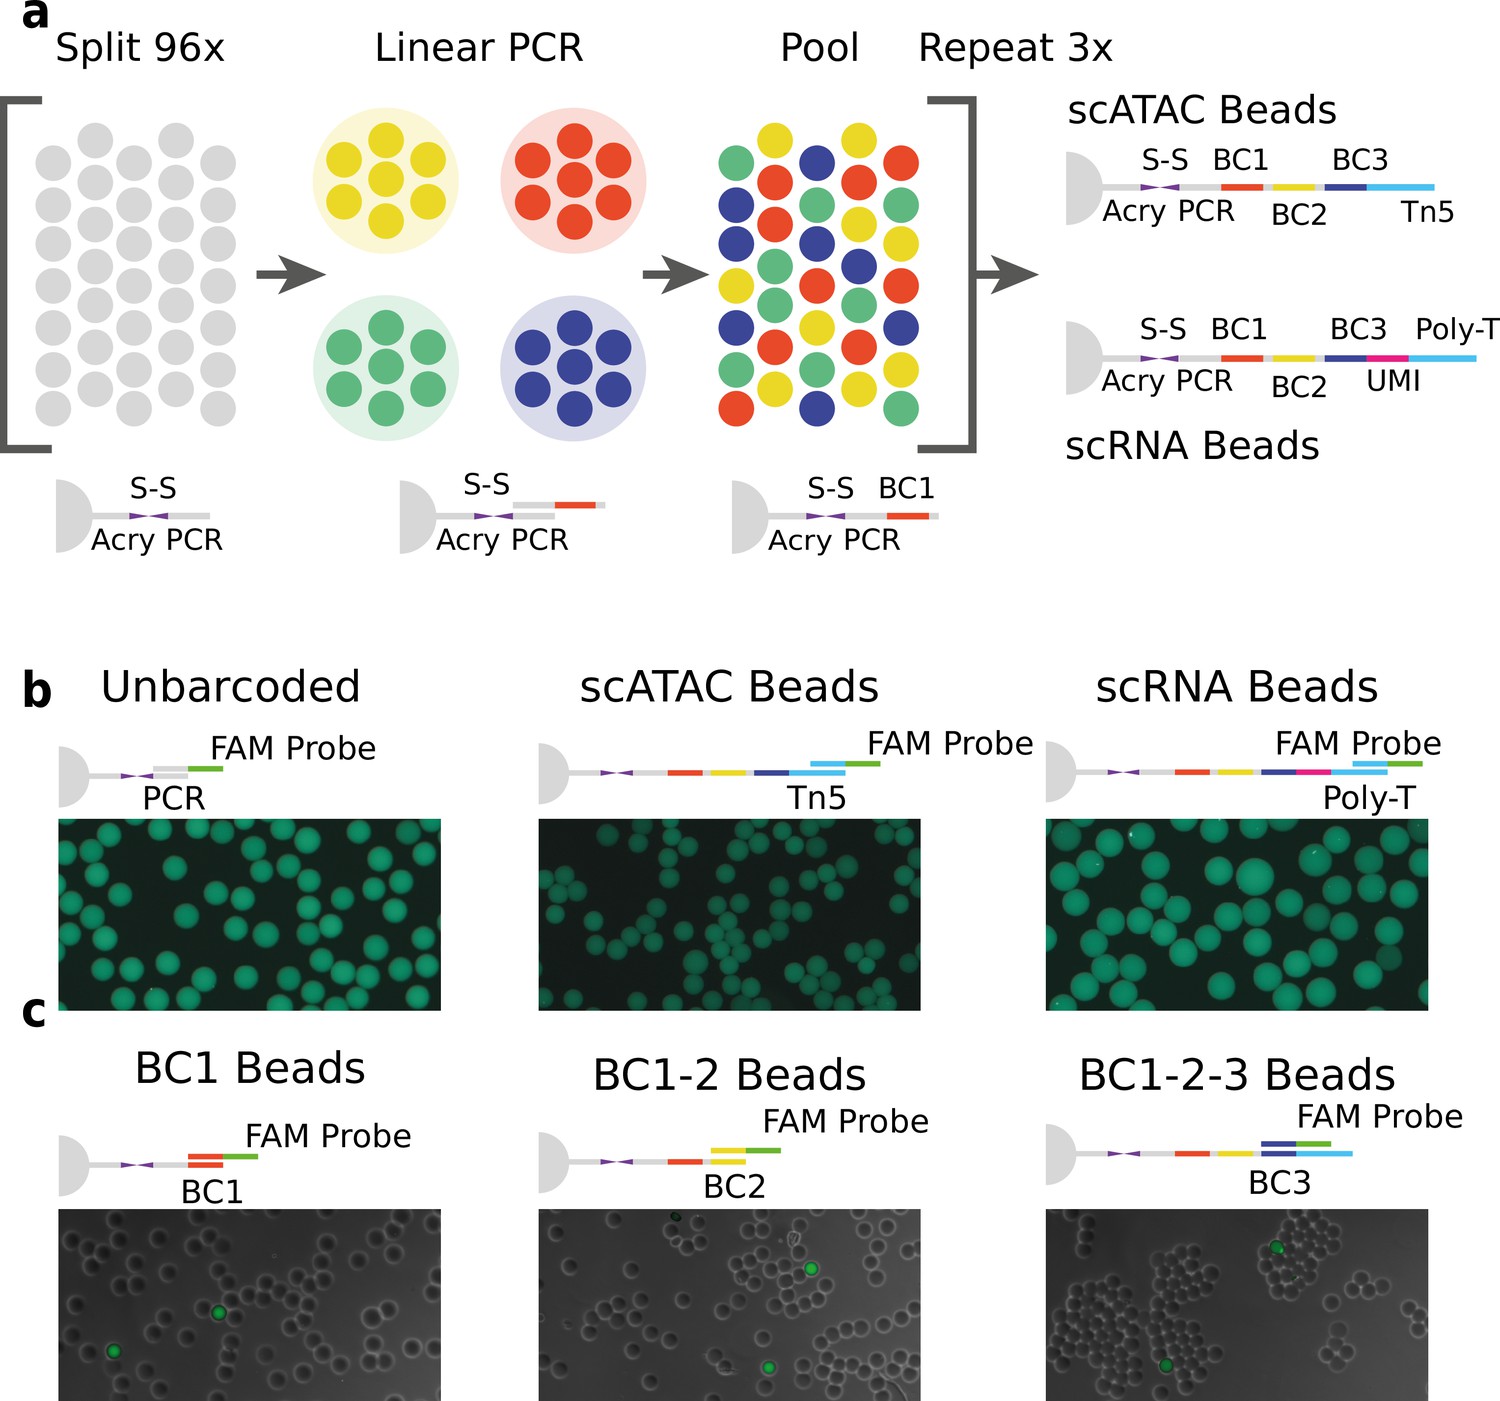
Technical overview of HyDrop barcoded bead production and quality control.
(a) Split-pool process for barcoding of dissolvable hydrogel beads for single-cell RNA-sequencing (scRNA-seq) and single-cell assay for transposase-accessible chromatin (scATAC-seq). Unbarcoded hydrogel beads are sequentially distributed over 96 wells, sub-barcoded using linear amplification polymerase chain reaction (PCR), repooled, and re-distributed two more times to generate 96 × 96 × 96 (884,736) possible barcode combinations. Different 3-prime terminal capture sequences are possible depending on the oligonucleotide sequence appended in the last step. (b) Semiquantitative assessment of bead primer incorporation by fluorescence in-situ hybridisation (FISH) using a fluorescein amidite (FAM) probe after every sub-barcoding step shows that bead fluorescence uniformity is retained throughout the barcoding process. (c) FISH with FAM probes complementary to only one of 96 sub-barcode possibilities shows that approximately 1/96 beads exhibit fluorescence for a selected sub-barcode probe. Fluorescence signal is overlaid with a brightfield image at 50% transparency to indicate positions of nonfluorescent beads (see Figure 1—figure supplements 2–6 for additional quality control experiments and full images).
Figure 1—figure supplement 1
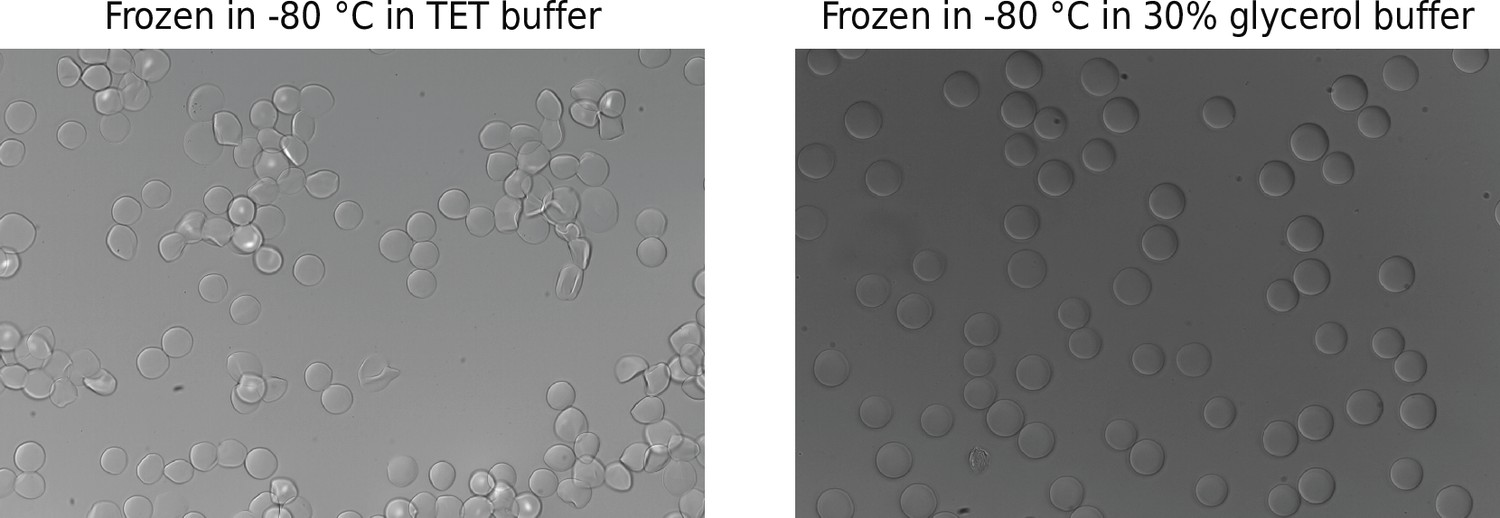
Hydrogel bead integrity after being frozen and thawed.
Beads were frozen overnight in Tris–EDTA–Tween (TET) buffer or 30% glycerol buffer and thawed at room temperature. Rough edges in the TET buffer sample indicate freezing/thawing damage.
Figure 1—figure supplement 2
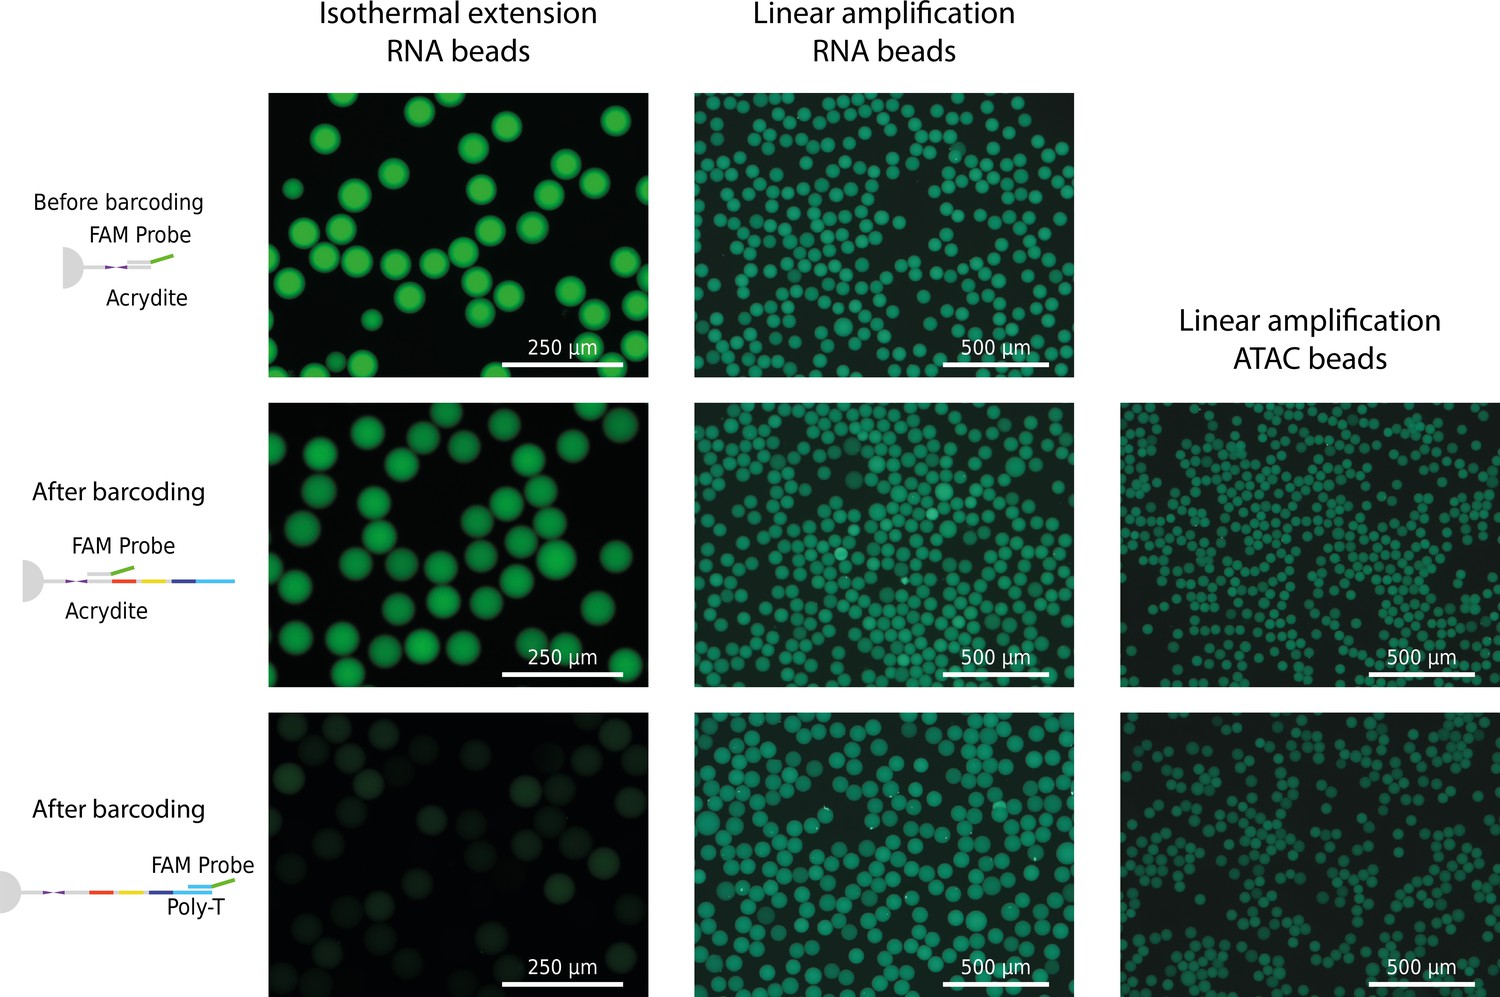
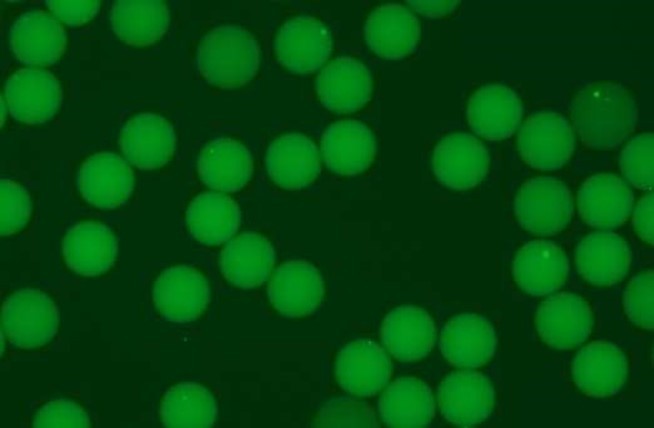
Fluorescence signal of freshly barcoded beads.
Beads were incubated with probes complementary to acrydite primer or capture site (poly-T or Tn5 adapter site) before and after barcoding.
-
Figure 1—figure supplement 2—source data 1
Count, mean diameter, and mean intensity of linear amplification and isothermal extension beads.
Beads were incubated in fluorescent probes complementary to basal acrydite primer or poly-A or ATAC capture site. Absolute size of 1 SD is added in mean diameter and mean intensity columns.
- https://cdn.elifesciences.org/articles/73971/elife-73971-fig1-figsupp2-data1-v5.docx
Figure 1—figure supplement 3
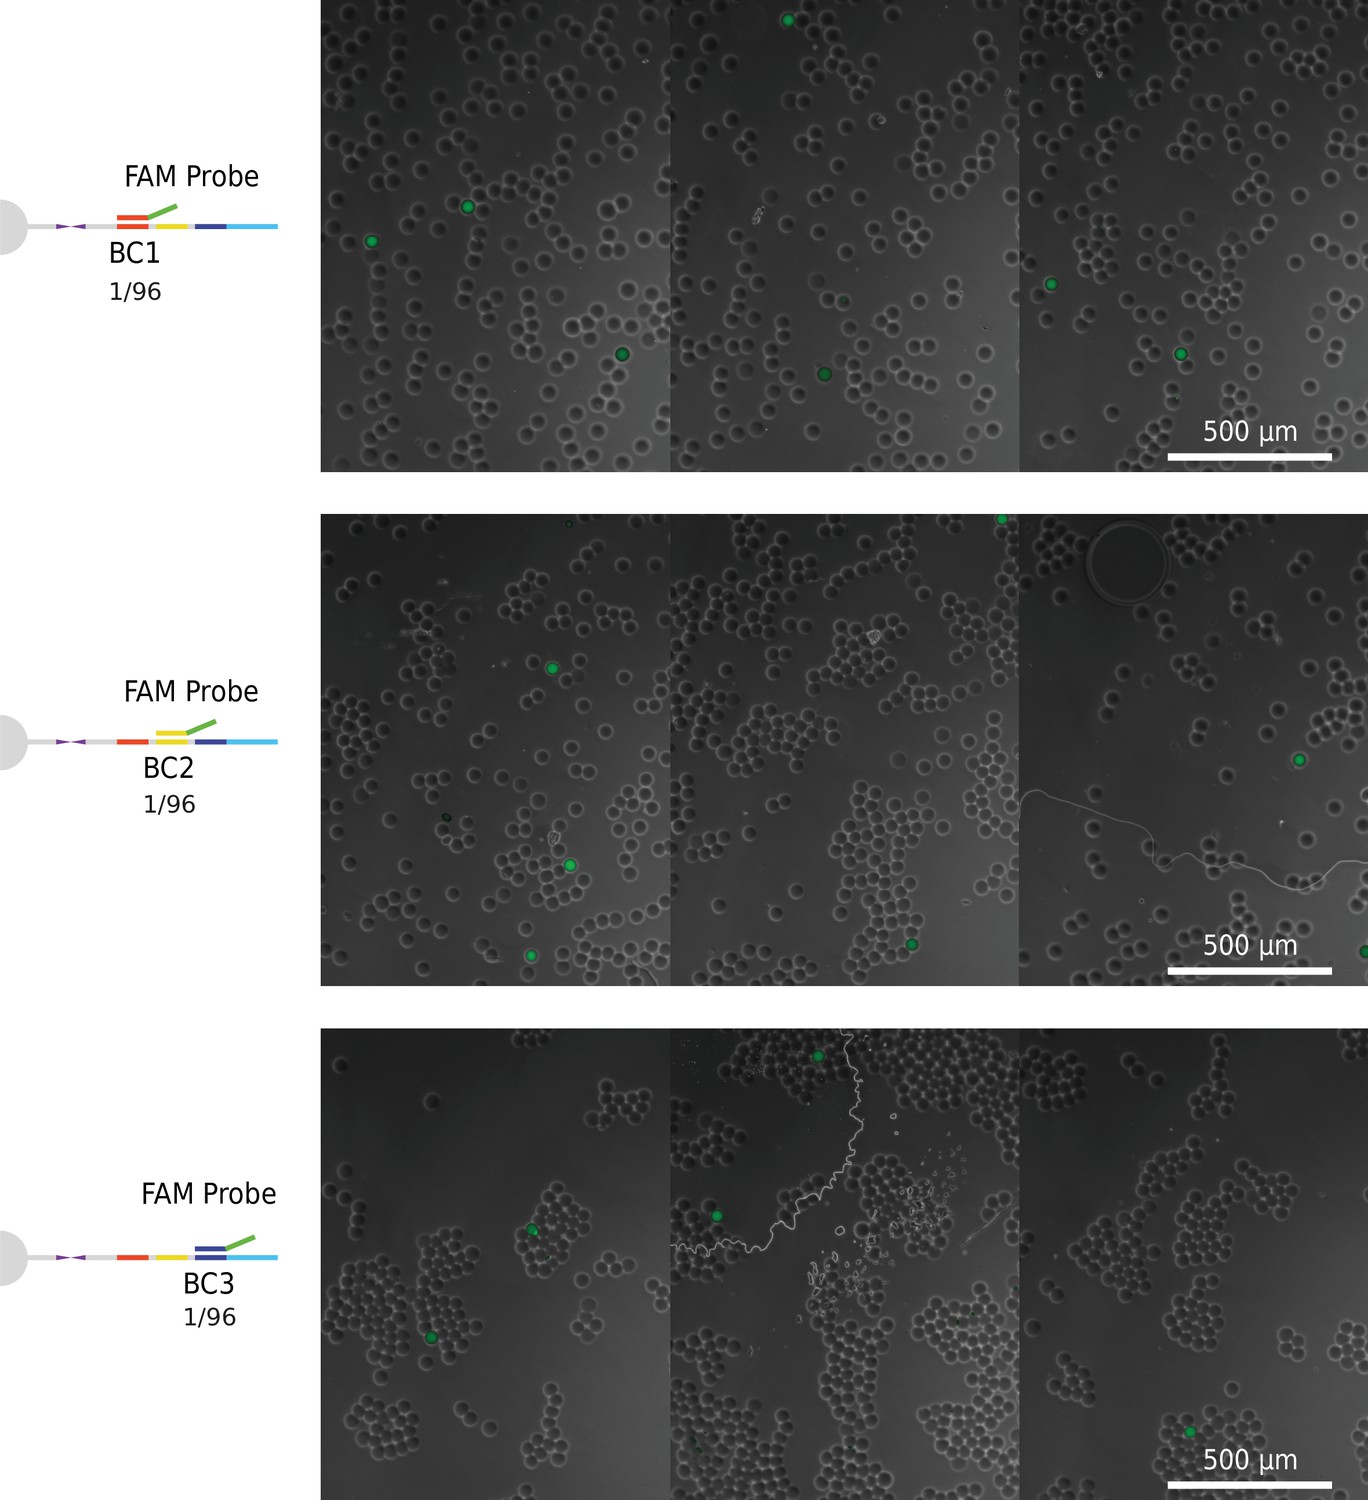
Brightfield images of barcoded beads incubated with FAM oligonucleotide probe complementary to one out of 96 possible sub-barcodes.
Segmented fluorescence masks of positive beads overlaid over brightfield image of same beads to visualize positives.
-
Figure 1—figure supplement 3—source data 1
Total counts and fluorescence-positive counts of beads incubated with fluoresceine amidite (FAM) oligonucleotide probe complementary to 1 out of 96 barcode possibilities.
- https://cdn.elifesciences.org/articles/73971/elife-73971-fig1-figsupp3-data1-v5.docx
Figure 1—figure supplement 4
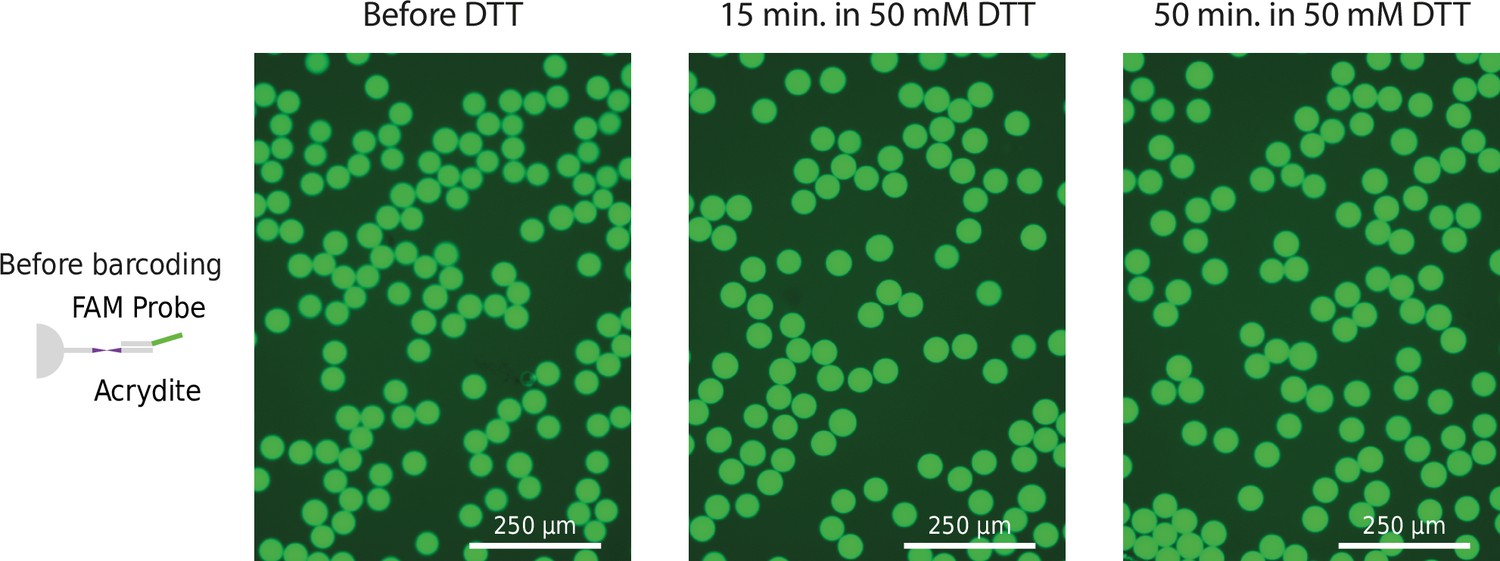
Fluorescence signal of nondissolvable 50 uM HyDrop-RNA beads.
Unbarcoded beads were incubated with probes complementary to the acrydite primer. Images taken immediately after 15- and 50-min incubation in 50 mM of dithiothreitol (DTT), and a short wash using quality control (QC) buffer.
-
Figure 1—figure supplement 4—source data 1
Count, mean diameter, and mean background-adjusted intensity of beads incubated in 50 mM of DTT for 15 and 50 min as well as negative control.
Absolute size of 1 SD is added in mean diameter and mean intensity columns.
- https://cdn.elifesciences.org/articles/73971/elife-73971-fig1-figsupp4-data1-v5.docx
Figure 1—figure supplement 5
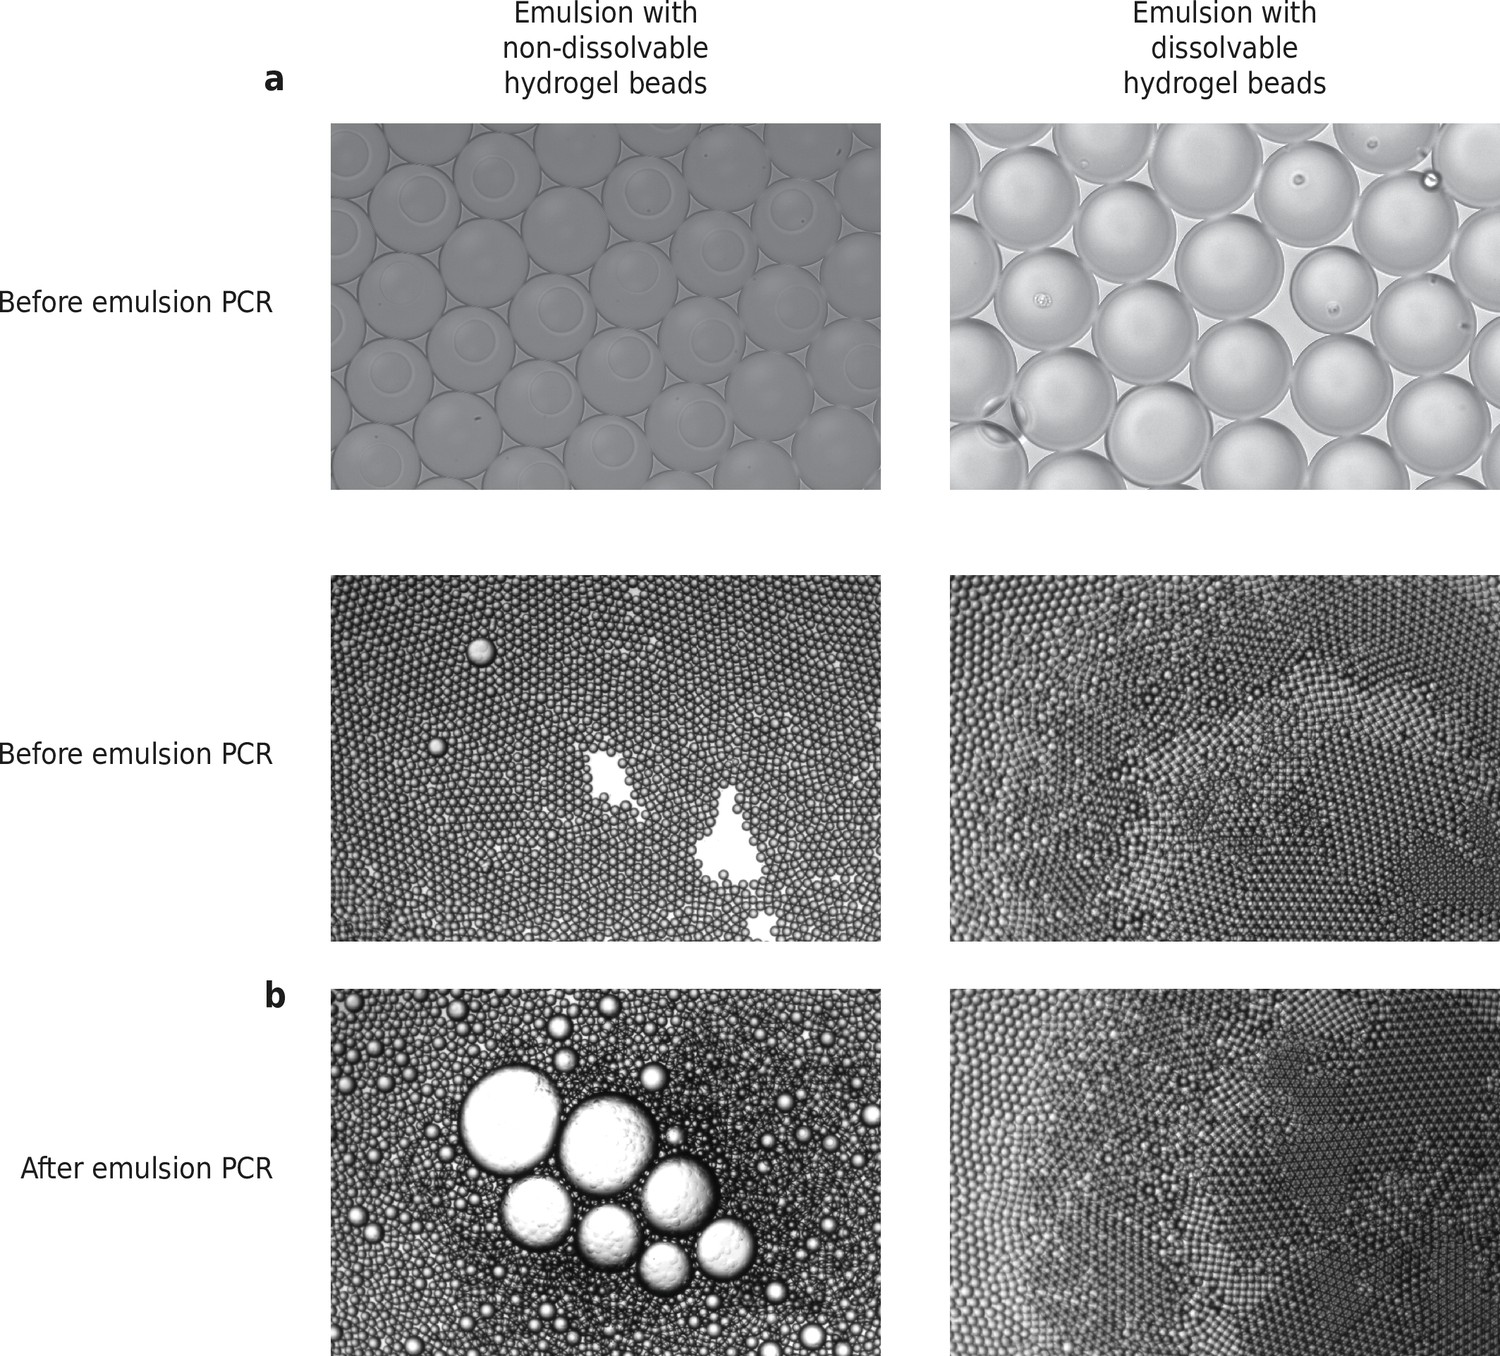
HyDrop-ATAC emulsion before and after PCR, with dissolvable and non-dissolvable barcoded hydrogel beads.
(a) HyDrop emulsions made with nondissolvable and dissolvable beads. Picture taken within 5 min after the emulsion was made. (b) HyDrop-ATAC emulsions made with nondissolvable and dissolvable beads before and after thermocycling. Picture taken within 5 min after the thermocycling was completed.
Figure 1—figure supplement 6
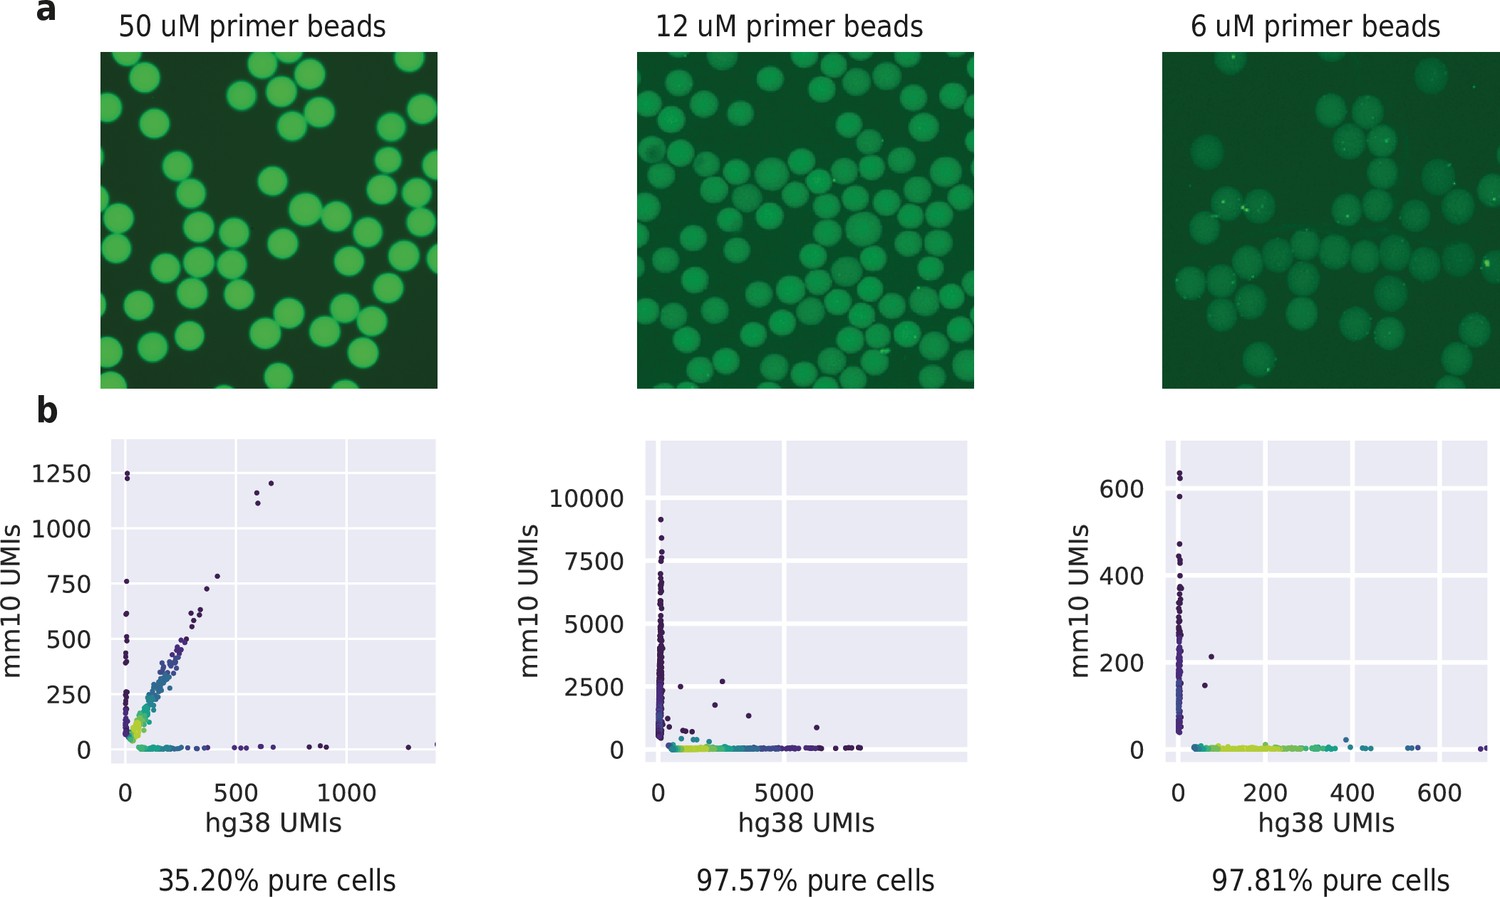
HyDrop-RNA bead fluorescence intensity and barnyard plots for acrydite primer concentrations of 50, 12 and 6 uM.
(a) Fluorescence signal of 50, 12, and 6 μM primer concentration beads. Unbarcoded beads were incubated with probes complementary to acrydite primer. (b) Purity plots for HyDrop-RNA species-mixing experiments performed using 50, 12, and 6 uM beads. Cells were assigned to a species if >95% of their unique molecular identifier (UMIs) belonged to transcripts mapping to that species’ genome.
Figure 2
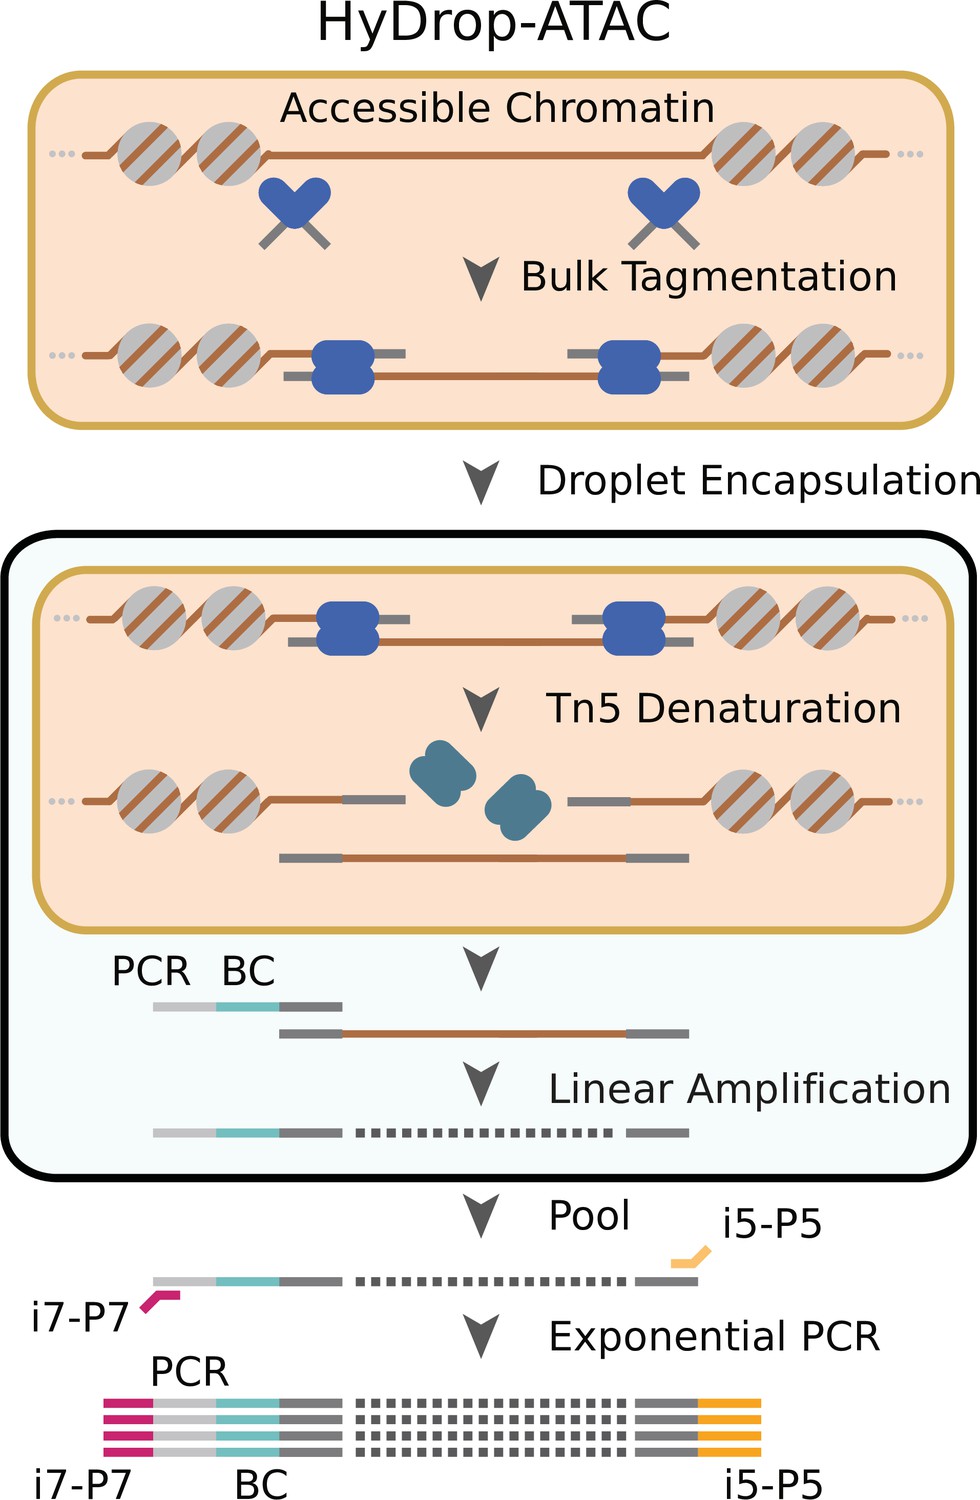
Schematic overview of HyDrop-ATAC.
Nuclear membrane is visualized in salmon, water droplet is visualized in blue. Nuclei were Tn5 tagmented in bulk and co-encapsulated with HyDrop-ATAC beads, where the hydrogel beads dissolve and release their uniquely barcoded primers. Thermocycling of the emulsion releases accessible chromatin fragments which are then linearly amplified and cell indexed by the bead’s barcoded primers within the droplet. The emulsion is then broken and the indexed ATAC fragments are pooled, PCR amplified, and sequenced.
Figure 3 with 1 supplement
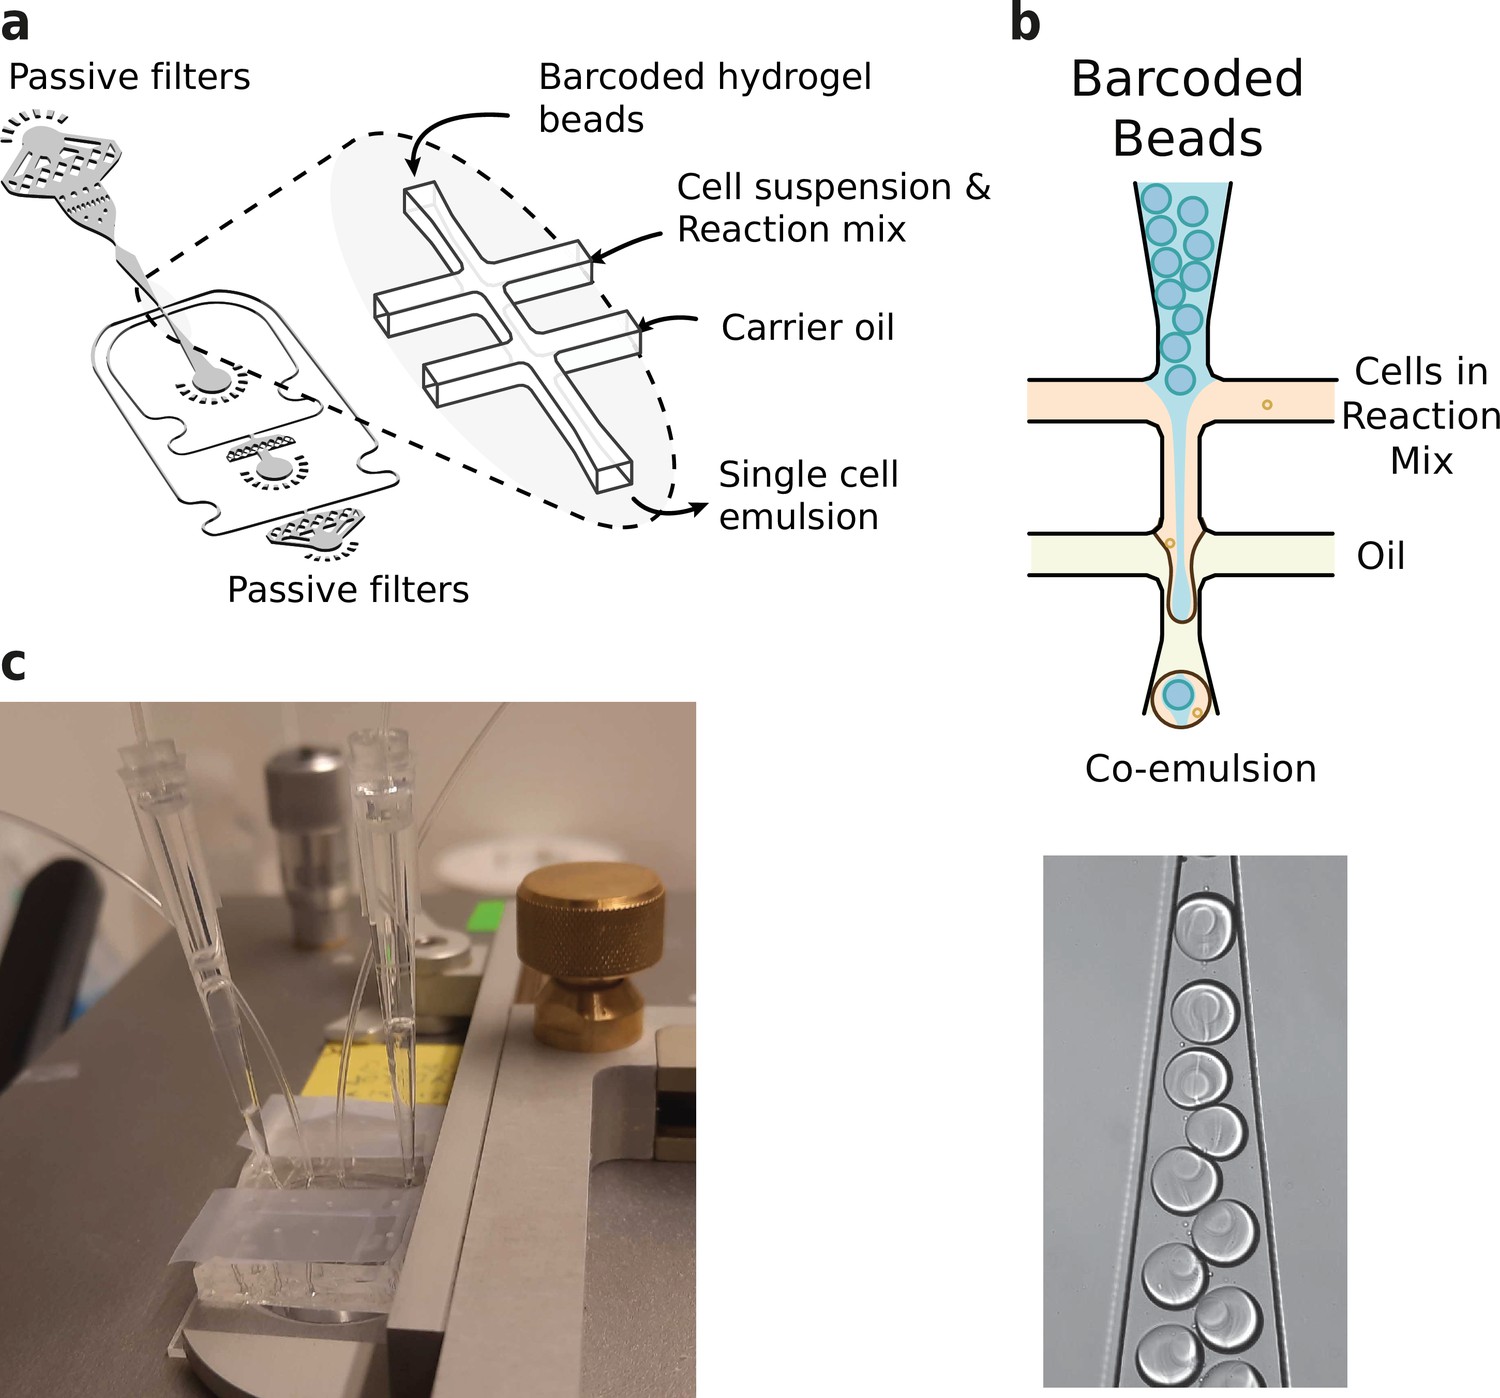
Microfluidics setup employed in HyDrop emulsion generation.
(a) 3d rendering of HyDrop chip design. The design has three inlets: one each for carrier oil, barcoded hydrogel beads and cell/reaction mix (see Figure 3—figure supplement 1 for full design). Passive filters at each inlet prevent dust and debris from entering the droplet generating junction. (b) Diagram and snapshot of cell/bead encapsulation into microdroplets. (c) Microfluidic chip setup on the Onyx integrated microfluidic instrument. Cells and beads are loaded into pipette tips and plugged into a HyDrop chip. Flow of oil and aqueous phases is achieved by Onyx displacement syringe pumps.
Figure 3—figure supplement 1
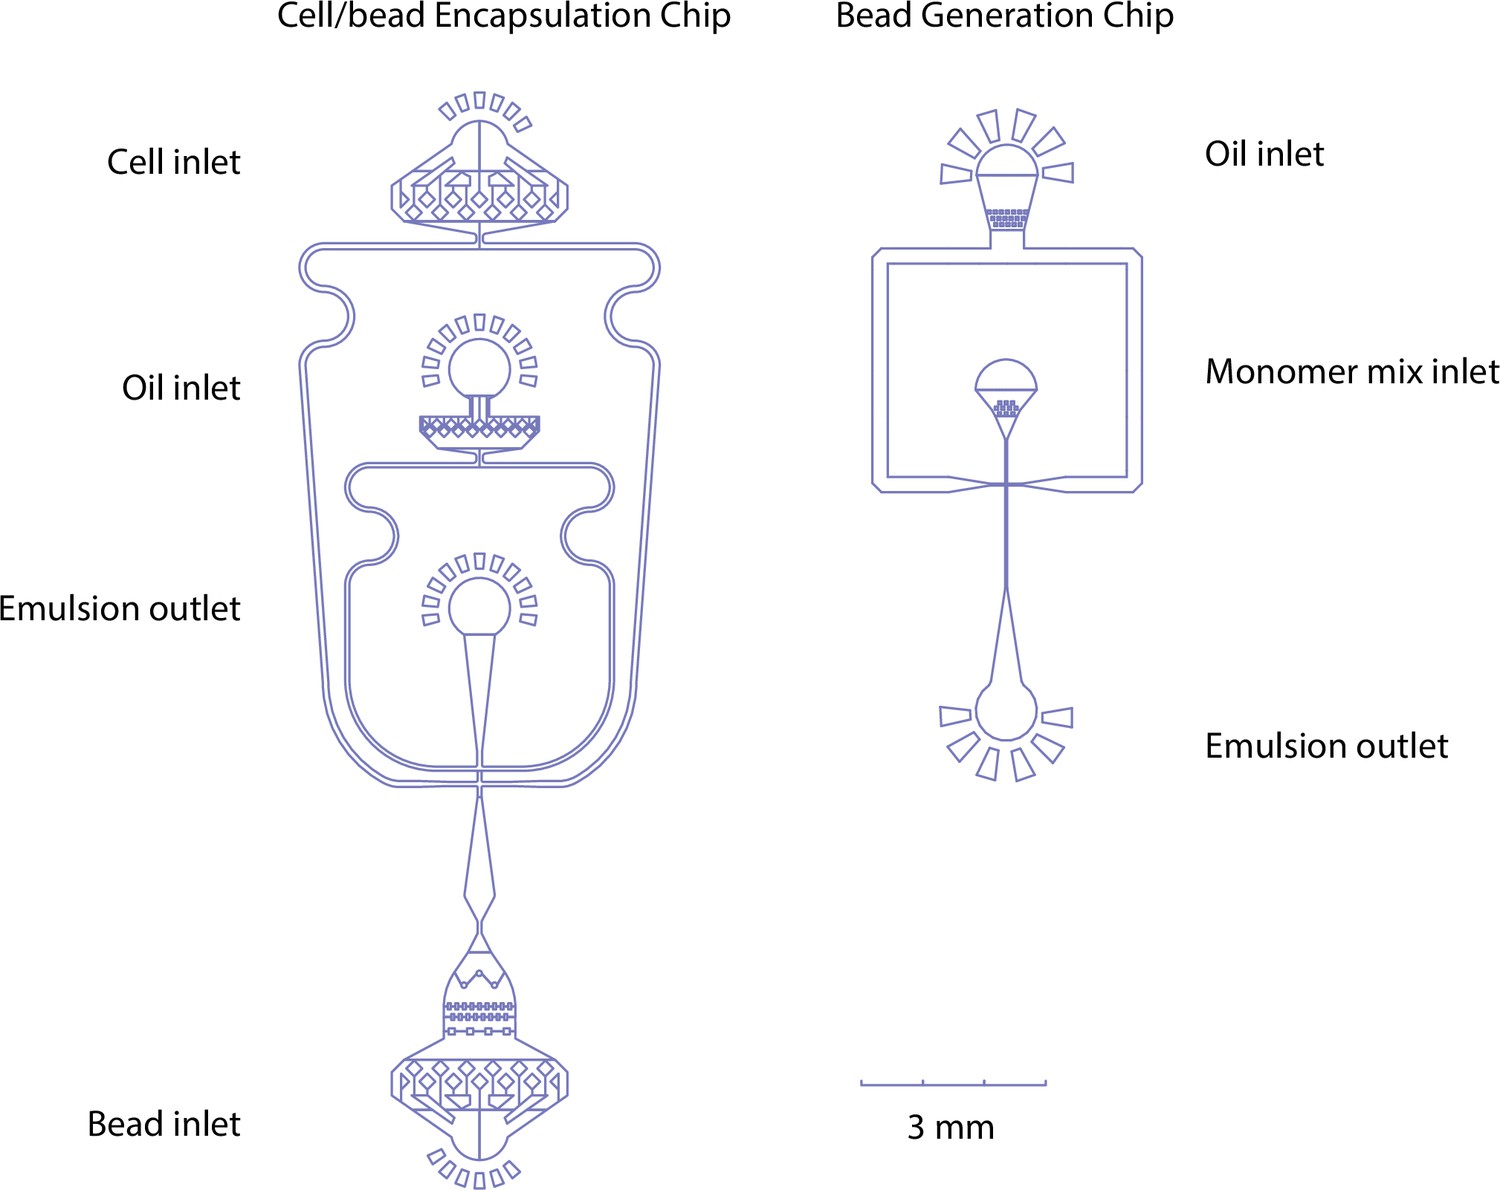
Microfluidic chip designs for cell/bead encapsulation and hydrogel bead generation - oil, monomer mix, cell suspensions, and beads can be pumped in through their respective inlets.
At the flow focusing point, aqueous phases (cells/beads/monomer mix) are emulsified by collision with the oil phase at the flow-focusing point. Emulsion is collected at the outlet channel.
Figure 4 with 1 supplement
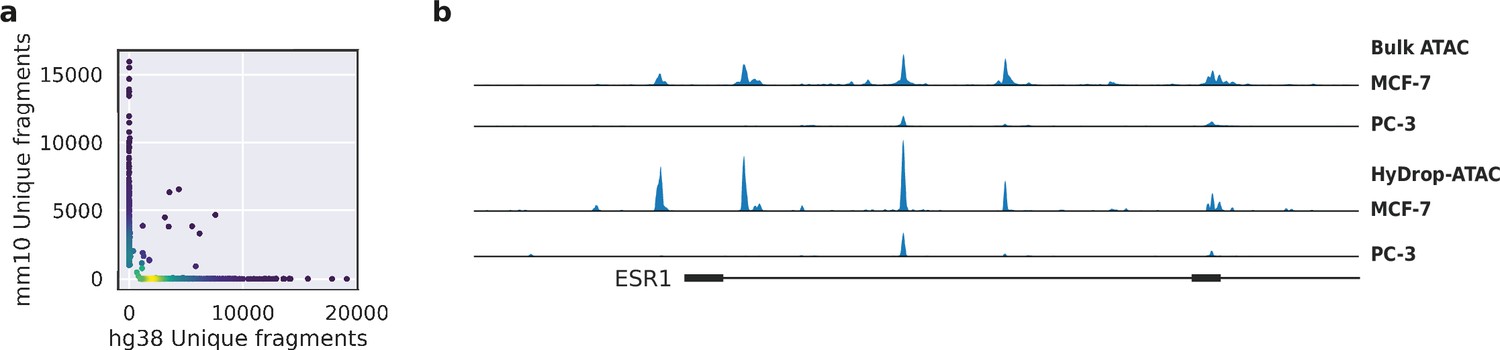
Validation of HyDrop-ATAC on mixed species cell lines.
(a) Scatterplot of the number of unique fragments detected in a 50:50 mixture of human Michigan Cancer Foundation-7 (MCF-7) and mouse melanoma cells colored by local density estimation. (b) reads per genome coverage (RPGC)-normalized aggregate genome tracks comparing HyDrop-ATAC and bulk ATAC-seq profiles of human MCF-7 and prostate cancer-3 (PC-3) cell lines around the estrogen receptor 1 (ESR1) locus, scaled to maximum of all four samples. Aggregate enrichment profile of reads around transcription start site, see Figure 4—figure supplement 1 for clustering of these cells and count correlation with public data. Supplementary source data files available for figure (a).
Figure 4—figure supplement 1
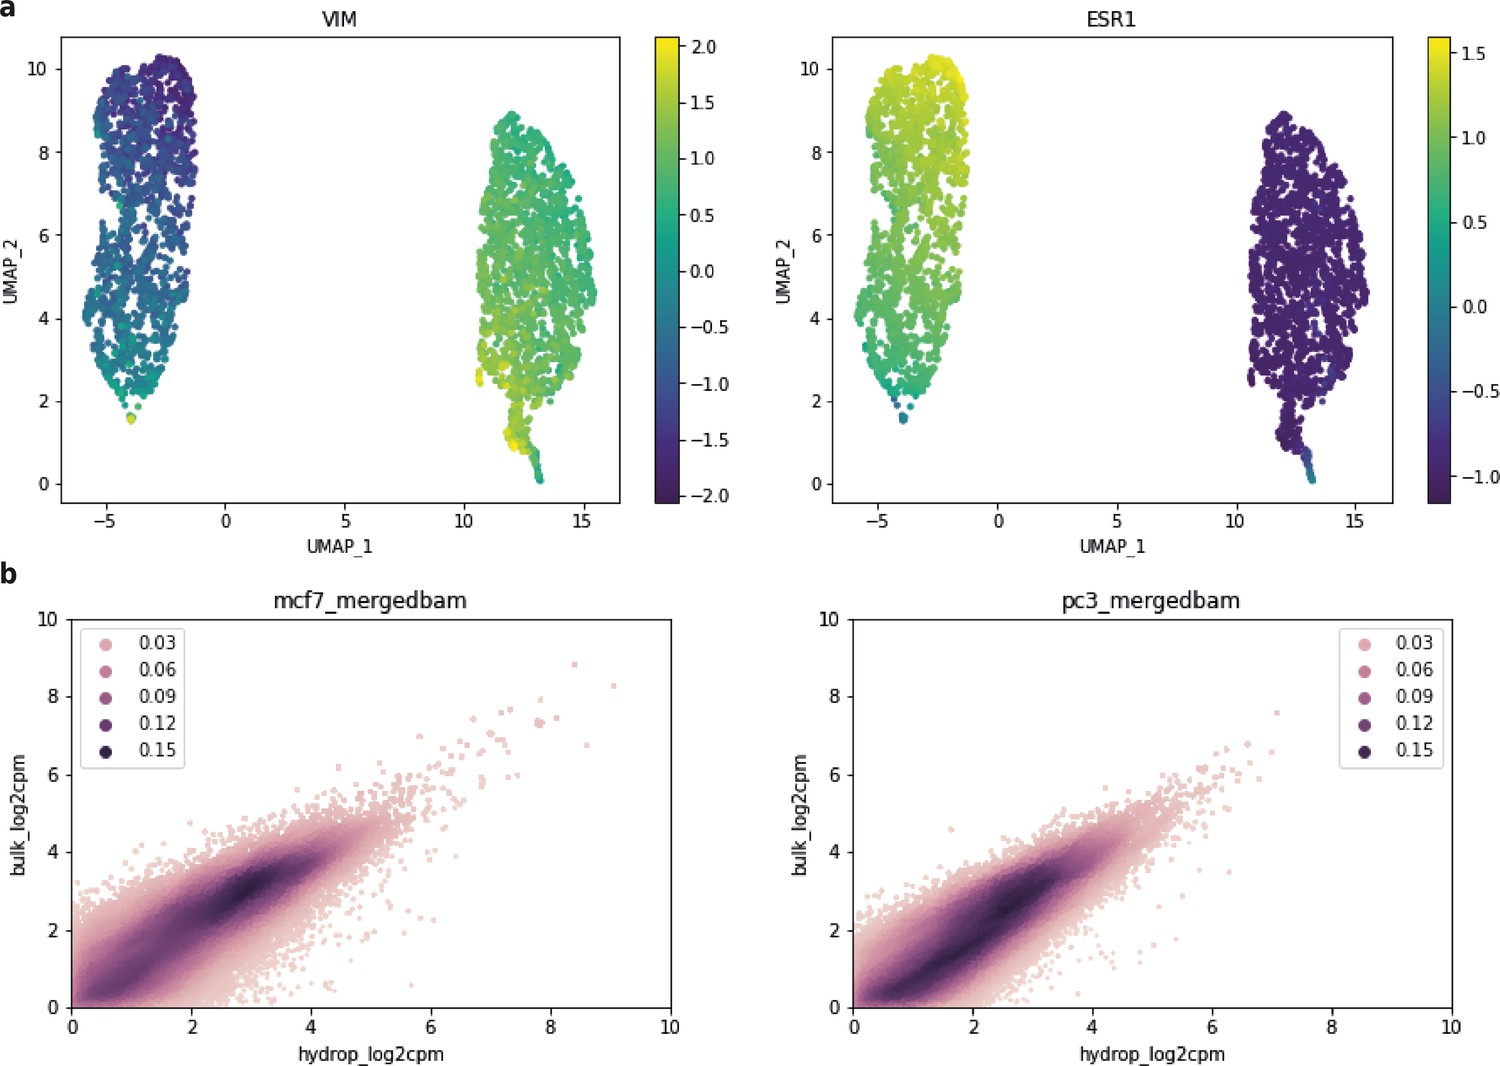
UMAP and count correlations within bulk ATAC-seq data for MCF-7 and PC-3 HyDrop-ATAC.
(a) MCF-7 and PC-3 HyDrop-ATAC uniform manifold approximation and embedding (UMAP) colored by imputed gene activity for vimentin (VIM) and estrogen receptor 1 (ESR1) – VIM is a marker gene for PC-3 cells, ESR1 is a marker gene for MCF-7 cells. (b) Correlation of counts in peak regions of public bulk ATAC-seq and HyDrop-ATAC data – regions were derived from public data, and counts within these regions were correlated for both the HyDrop and bulk data. Color scale encodes each count’s local Gaussian kernel density estimation score.
Figure 5 with 1 supplement
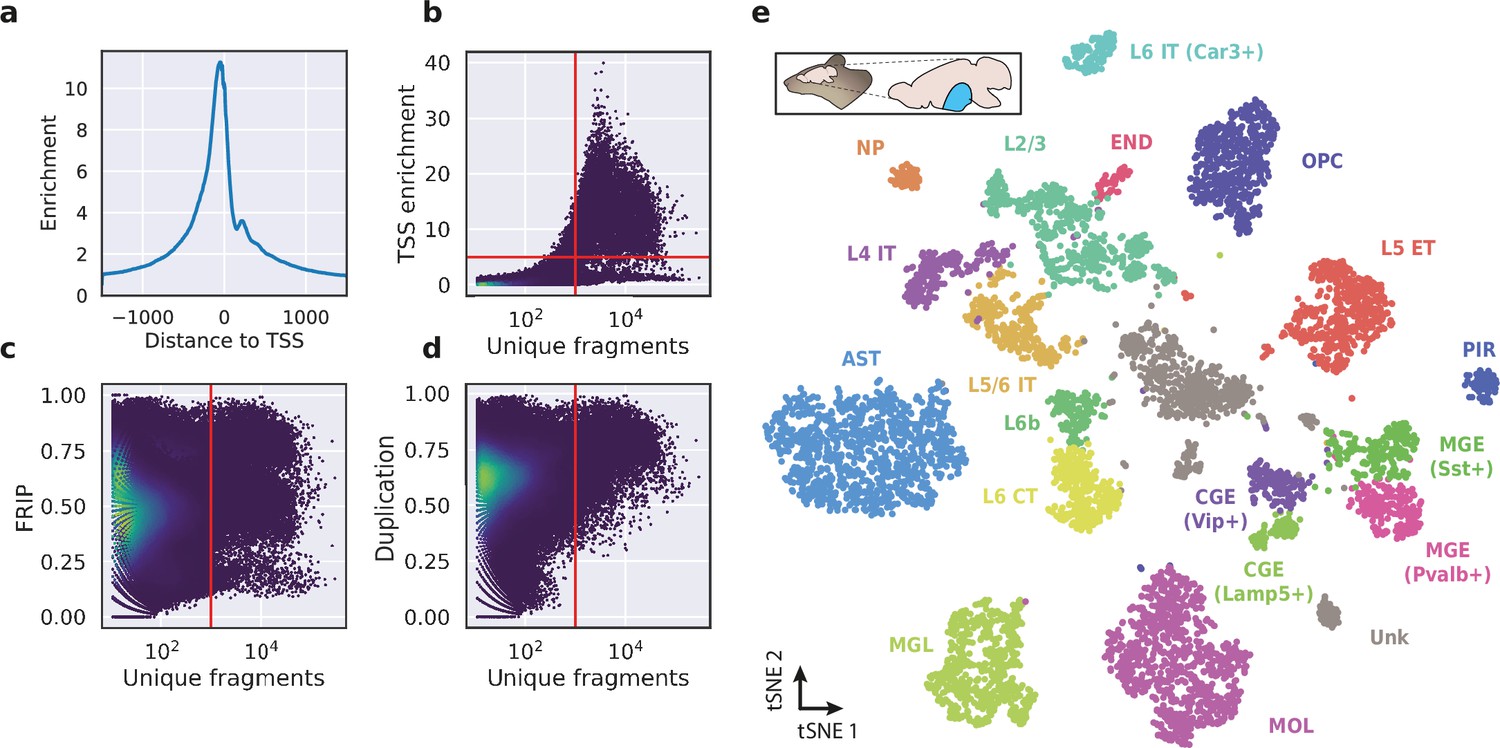
Application of HyDrop-ATAC on flash-frozen mouse cortex recapitulates cellular heterogeneity.
Aggregate enrichment of ATAC fragments near transcription start sites (TSS) (a), TSS enrichment per barcode (b), fraction of reads in peaks (FRIP) per barcode, (c) and duplication rate per barcode (d) in mouse cortex HyDrop-ATAC data. A minimum TSS enrichment of 5 and a unique number of fragments of 1000 are used as cut-off values to separate cells from background (red lines). Cells are colored by local density estimation. (e) UMAP projection of 7996 mouse cortex nuclei annotated with cell type inferred by accessibility near marker genes. Abbreviations: microglia (MGL), mature oligodendrocytes (MOL), oligodendrocyte precursors (OPC), astrocytes (AST), endothelial cells (END), piriform cortex neurons (PIR), caudal and medial ganglionic eminence derived neurons (CGE, MGE), layers 2–6 intratelencephalic (IT), L5 extratelencephalic (ET), L5/6 near projecting excitatory neurons (NP), L6 corticoencephalic (CT), and deep L6 excitatory neurons (L6b). See Figure 5—figure supplement 1 for cluster marker gene activities. Supplementary source data files available for figures b, c, and d.
Figure 5—figure supplement 1
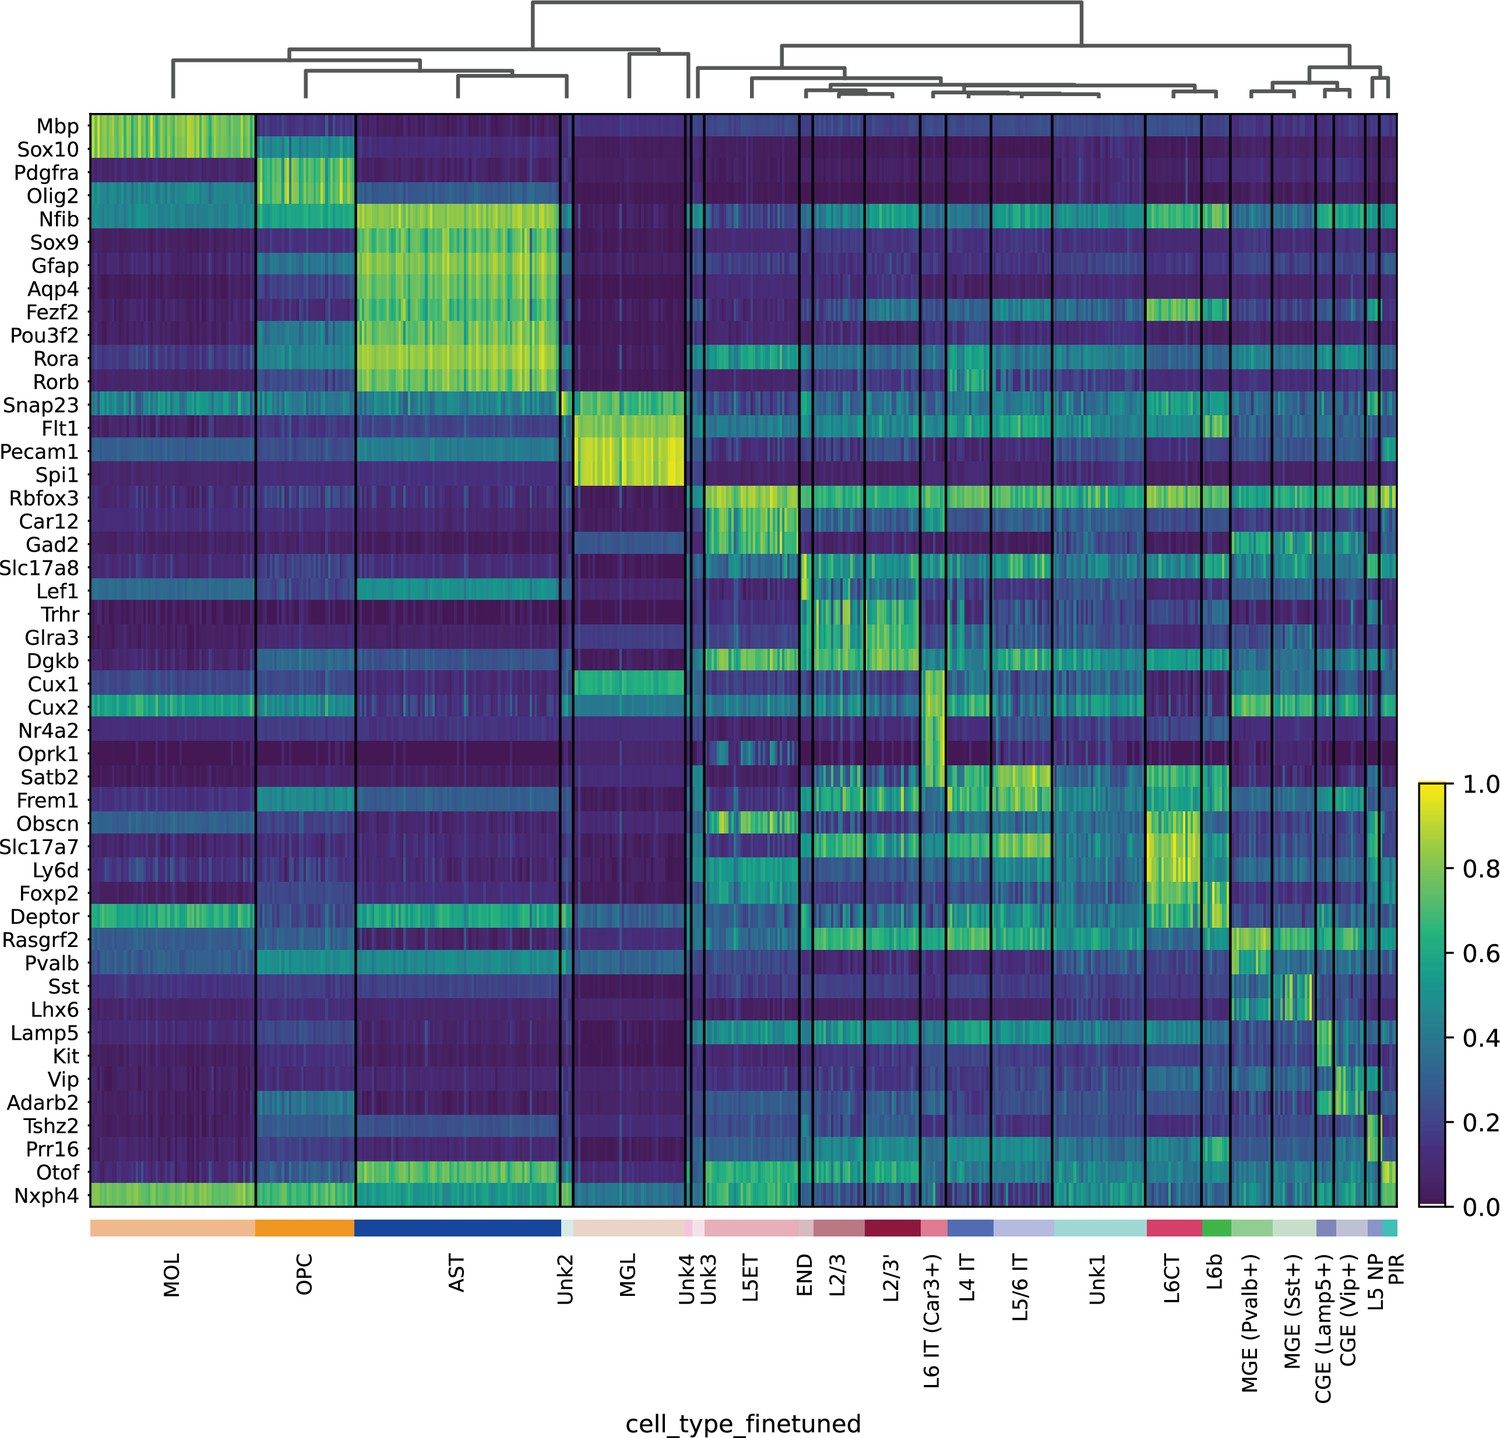
Heatmap of mouse cortex HyDrop-ATAC gene activity – gene activity was imputed by normalized accessibility within a 10 kb window around the gene.
Figure 6
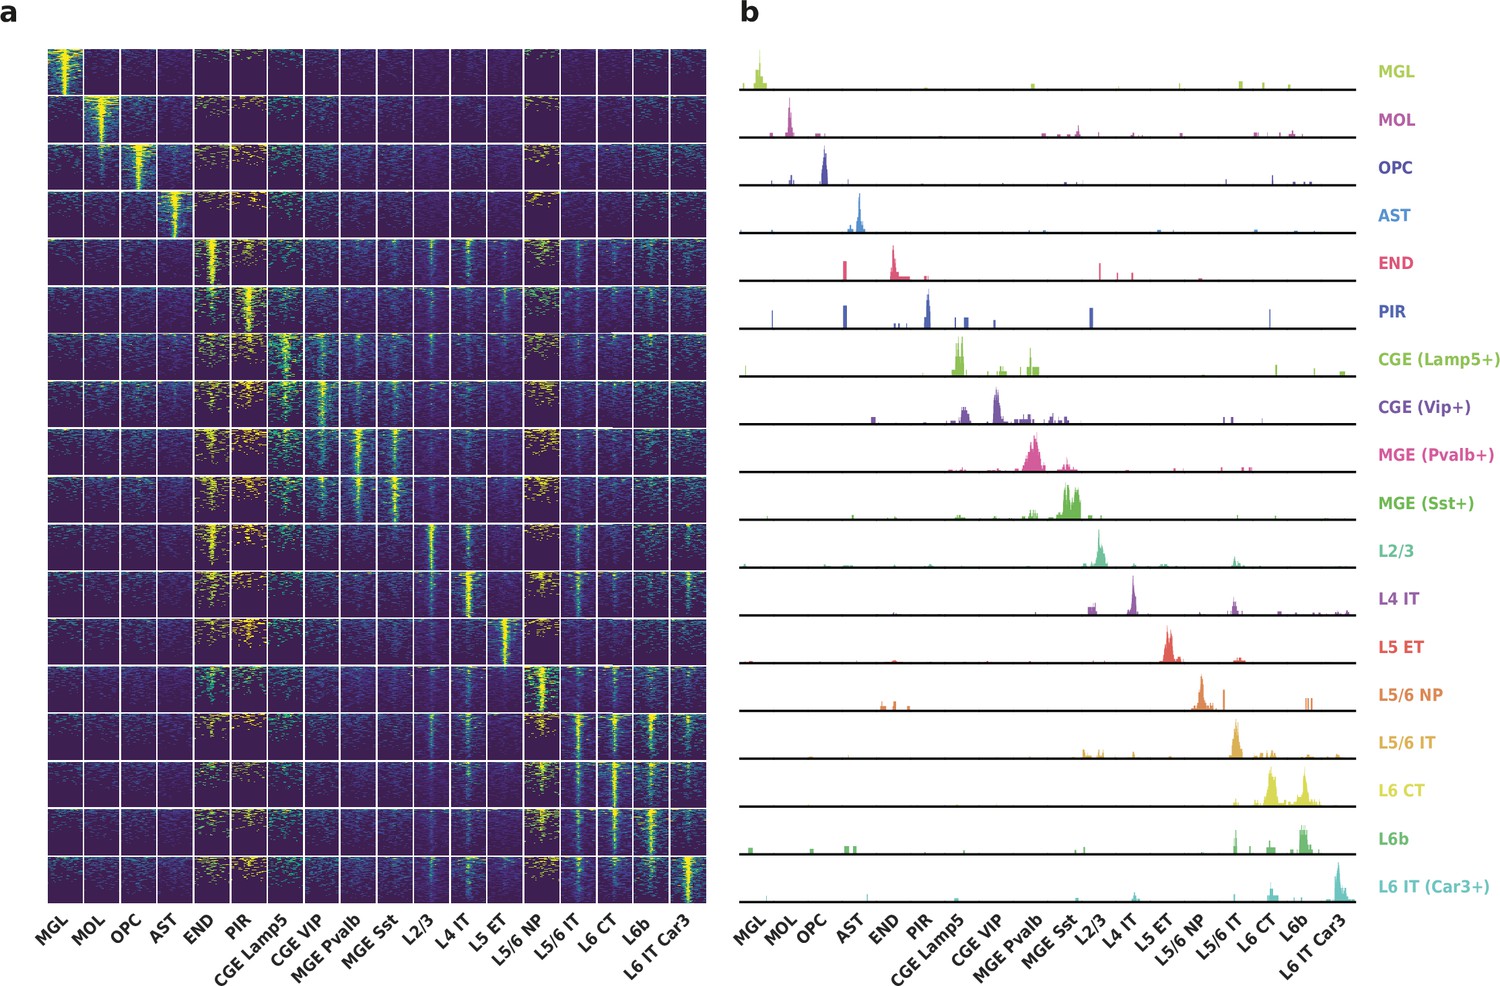
Differentially accessible regions (DAR) between cell types recovered by HyDrop-ATAC on mouse cerebral cortex.
(a) Aggregate accessibility of top 1000 DAR per cluster. (b) Row-scaled, counts-per-million (CPM)-normalized aggregate genome track covering the top one DAR for each cluster.
Figure 7
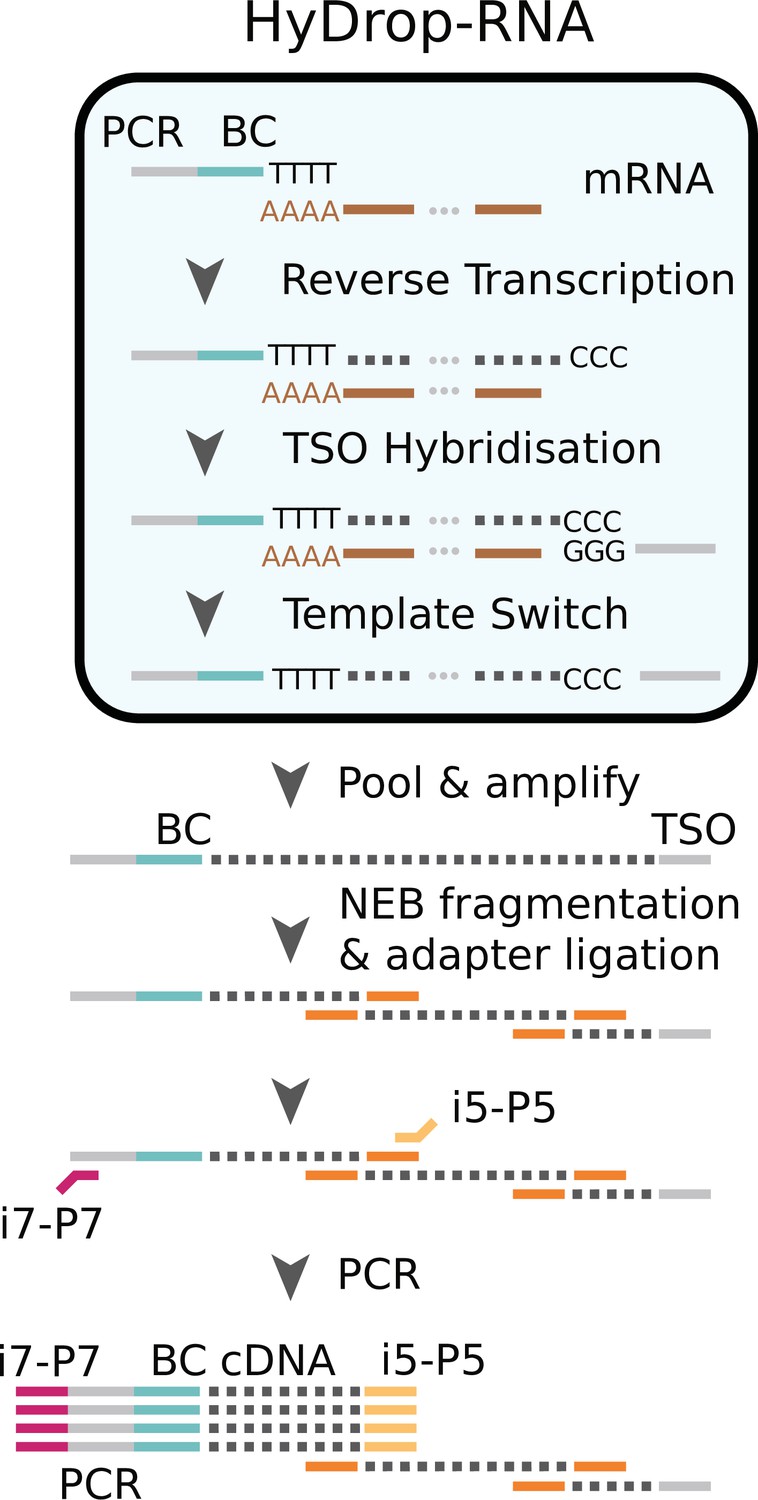
Schematic overview of HyDrop-ATAC.
Single cells or nuclei are resuspended in a reverse transcriptase mix and coencapsulated into microdroplets with 3-prime poly (dT) HyDrop beads. Cells are lysed inside the droplets and barcoded primers (BC) are released from the hydrogel bead. Reverse transcription inside the emulsion using a template-switching oligo (TSO) generates thousands of barcoded single-cell cDNA libraries in parallel which are processed further in a pooled manner after breaking the emulsion.
Figure 8 with 2 supplements
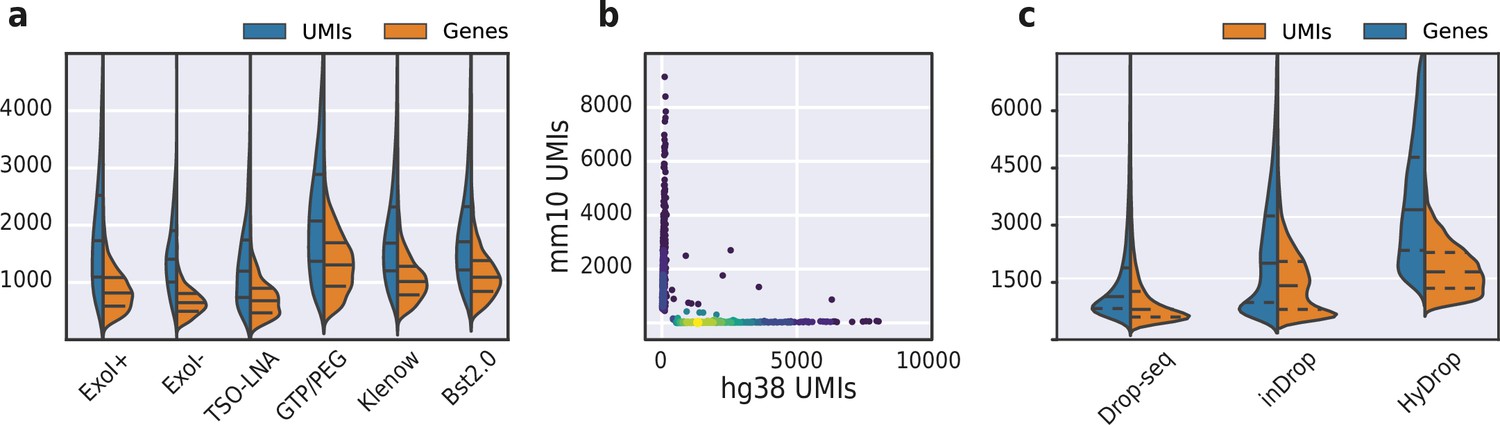
Validation and benchmarking of HyDrop-RNA on species mixed cell line samples and mouse cerebral cortex.
(a) Comparison of unique molecular identifier (UMI) and gene count of HyDrop-RNA with and without Exo I treatment postdroplet merging, with the use of a locked nucleic acid (LNA) template switching oligo (TSO) and with GTP/PEG, BST2.0, and Klenow fragment library preparation. Inner lines represent Q1, median, and Q3. See Figure 8—figure supplement 1 for species purity plots of these experiments. (b) Scatterplot of human and mouse UMIs detected in a 50:50 mixture of human MCF-7 and mouse melanoma cells colored by local density estimation. (c) Comparison of UMI and gene count of public inDrop mouse cortex data, public Drop-seq mouse retina data, and HyDrop-RNA mouse cortex data. Inner lines represent Q1, median, and Q3. See Figure 8—figure supplement 2 for additional quality comparison including commercial methods. Supplementary source data files available for figures a, b, and c.
Figure 8—figure supplement 1
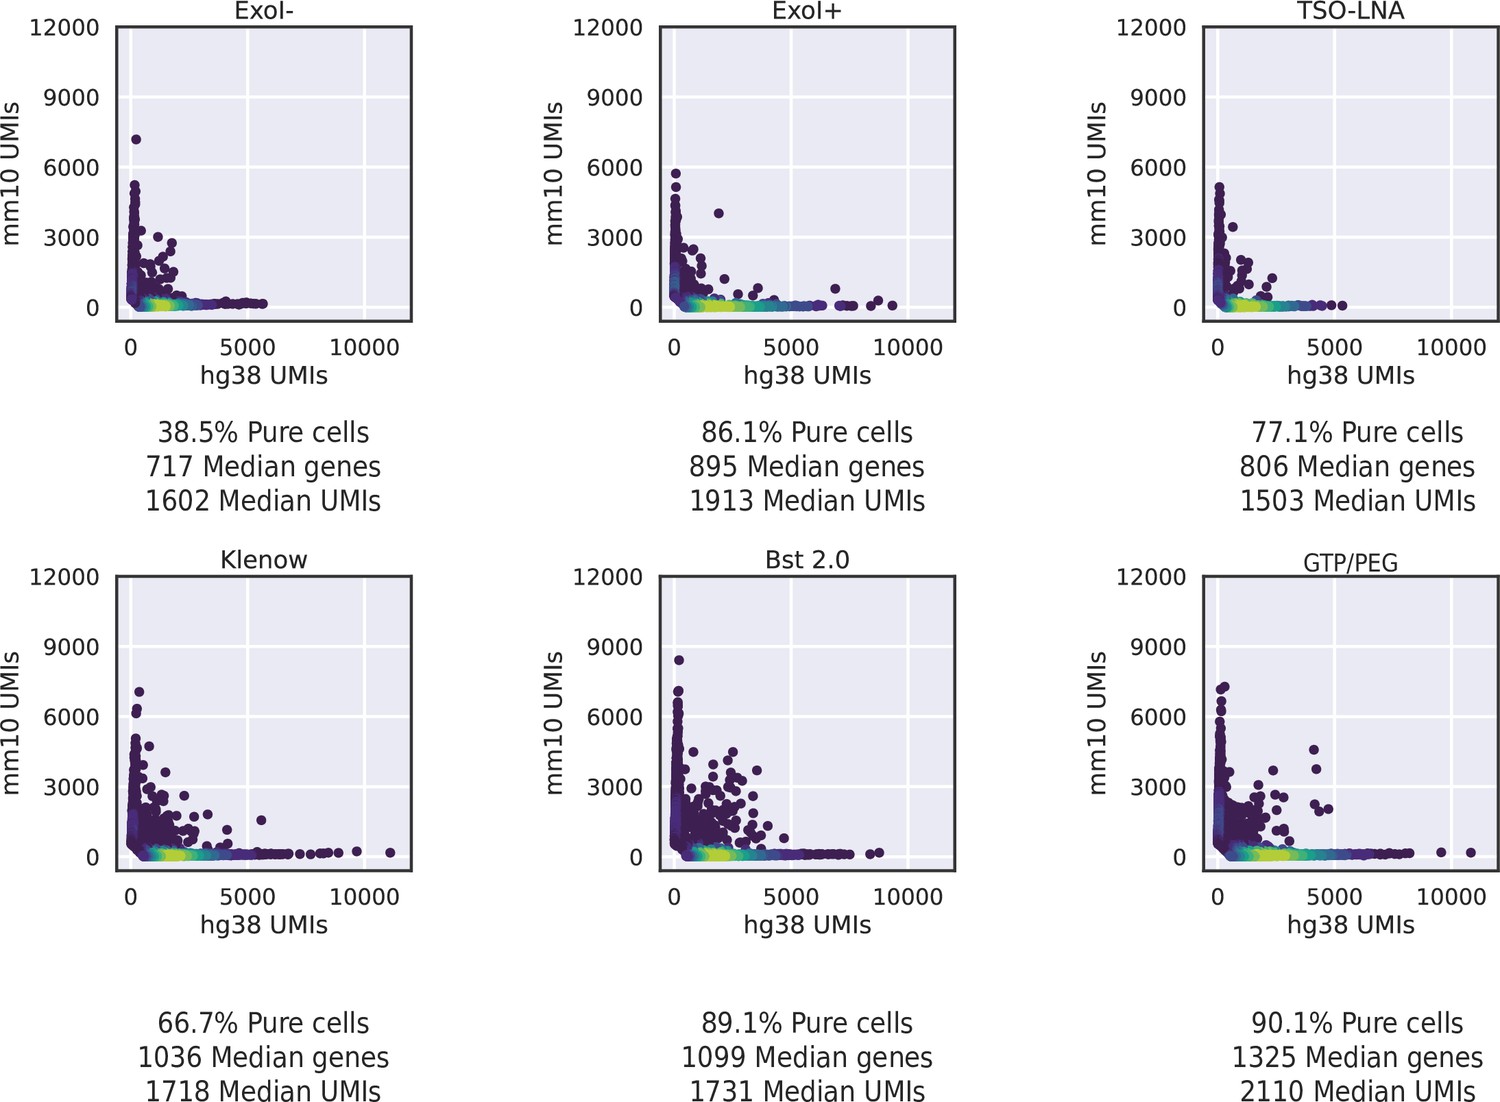
HyDrop-RNA species-mixing purity plots for several different protocol versions.
Protocol versions include non-Exo I treated, Exo I treated, template switching oligo- locked nucleic acid (TSO-LNA), Klenow fragment, Bst2.0, and GTP/PEG HyDrop-RNA libraries. UMI, unique molecular identifier.
Figure 8—figure supplement 2
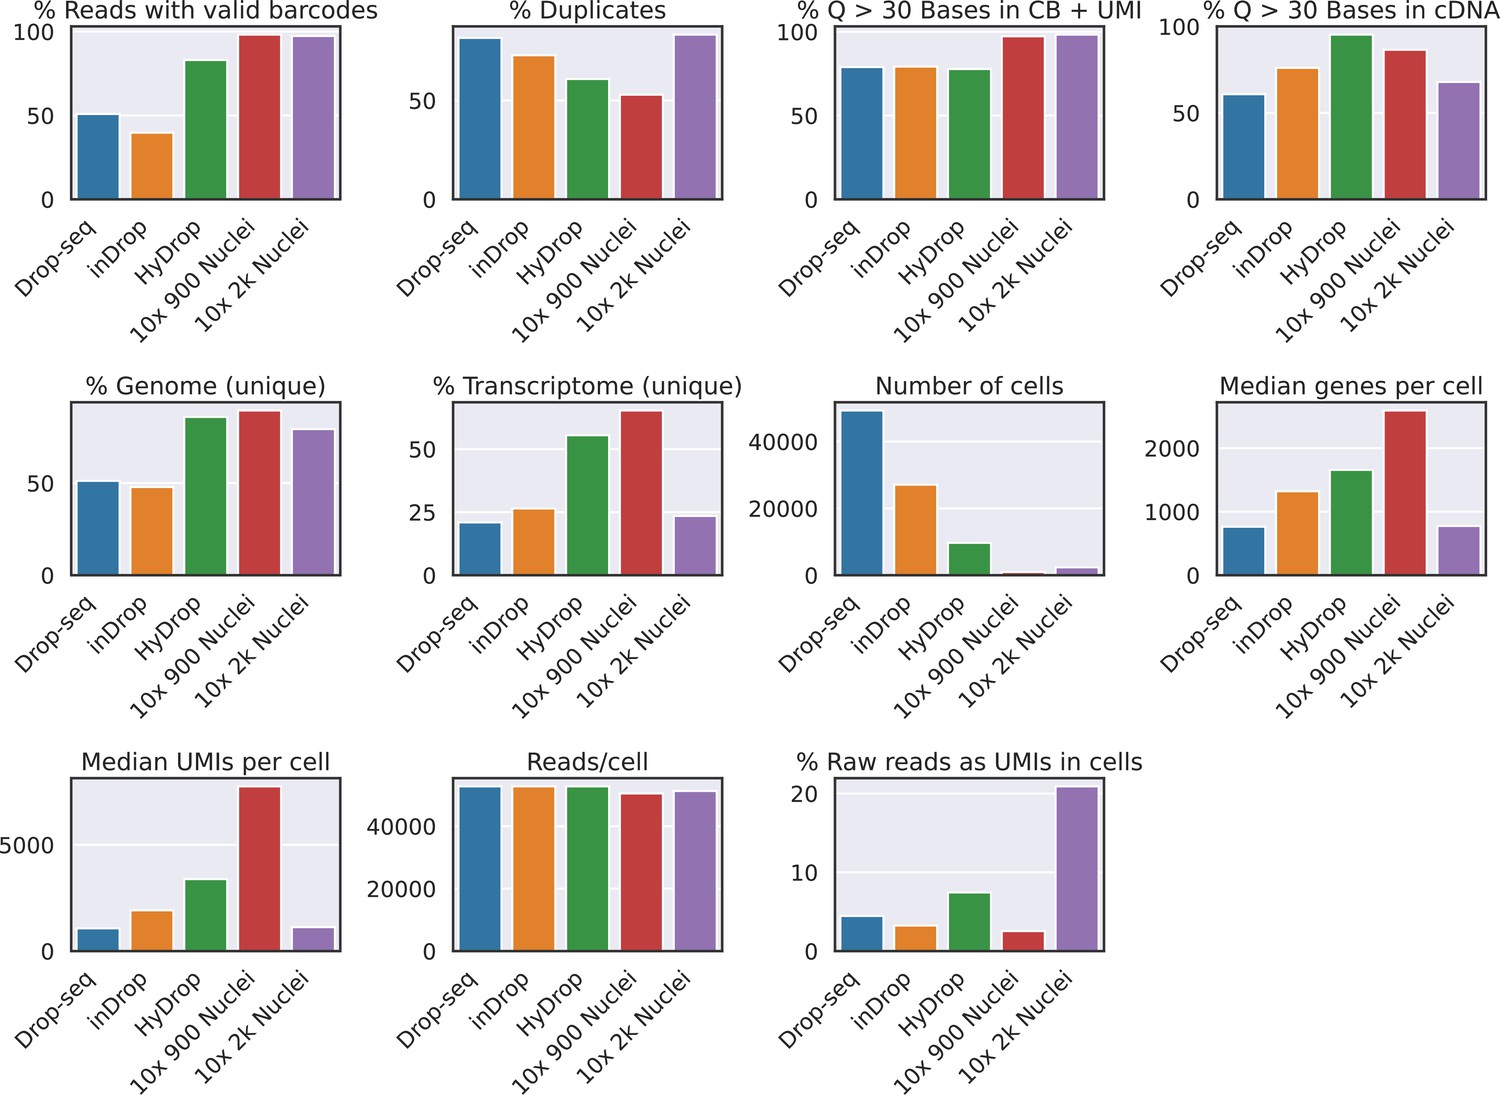
Collection of quality control metrics for inDrop, Drop-seq, HyDrop-RNA, and 10× datasets on mouse brain cells.
‘% Reads with valid barcodes’ is calculated after allowing one mismatch to the whitelist. ‘% Duplicates’ is calculated on mapped transcripts using unique molecular identifiers (UMIs). ‘% Genome’ and ‘% Transcriptome‘ are the percentages of all raw reads mapping to the reference genome and transcriptome, respectively. ‘% Raw reads as UMIs in cells’ is the sum of UMIs in filtered cells divided by the total number of sequenced reads. Supplementary source data files available.
Figure 9 with 1 supplement
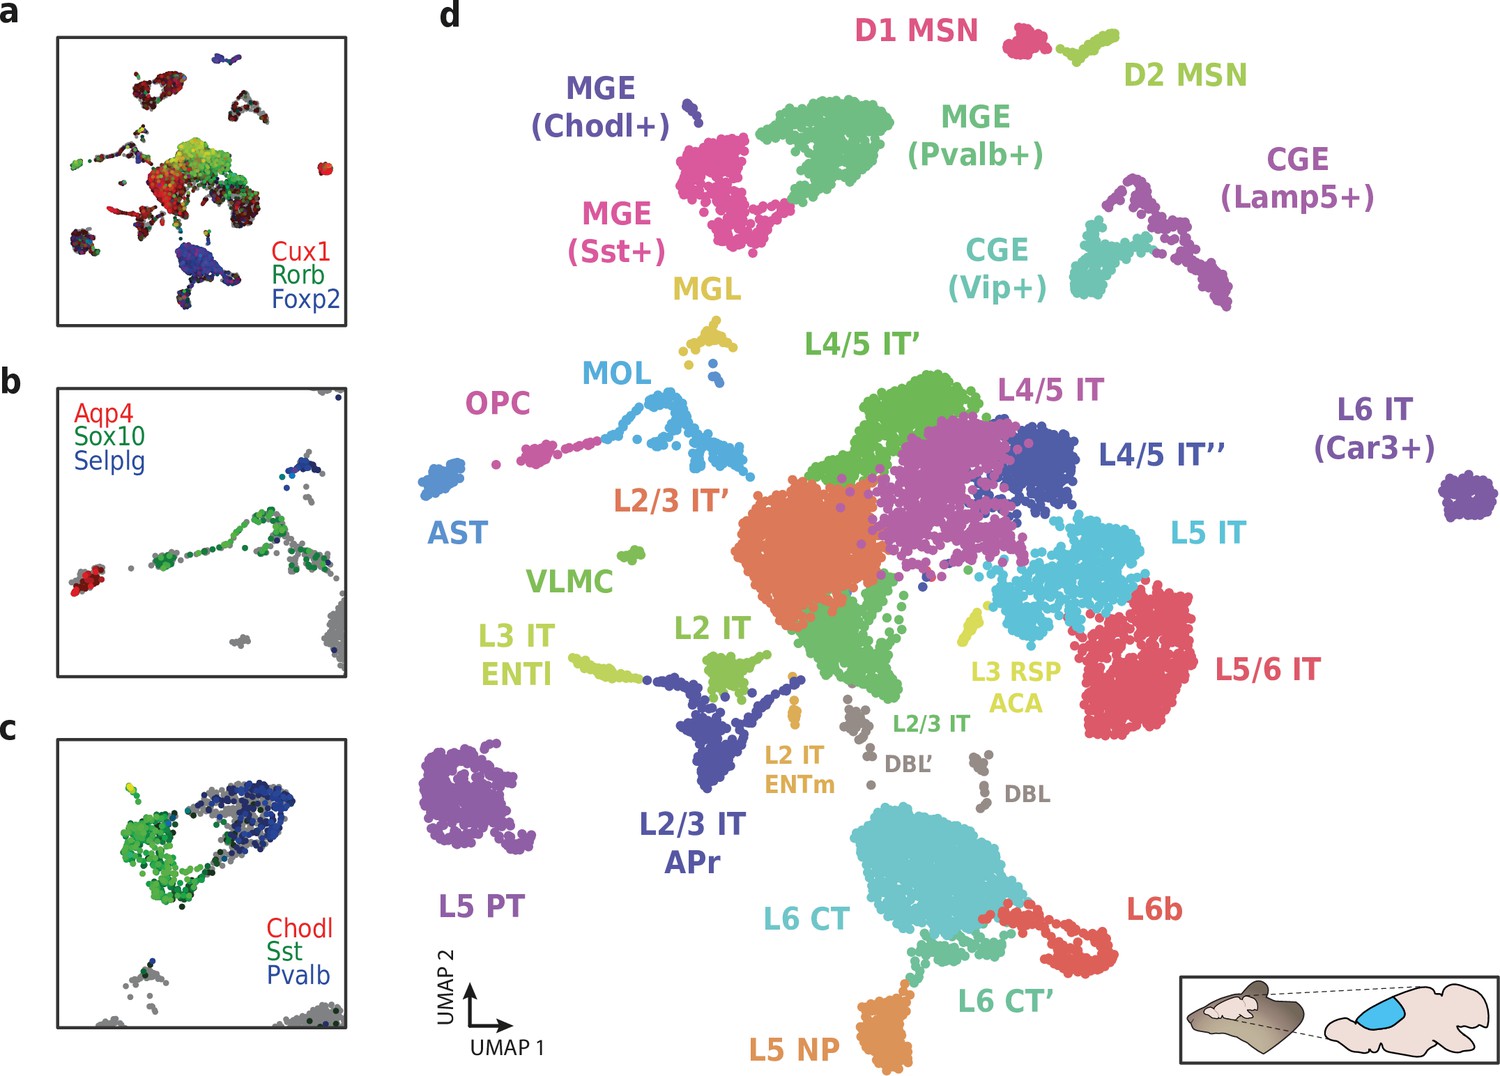
Application of HyDrop-RNA on flash-frozen mouse cerebral cortex.
Mouse cortex UMAP colored by log-scaled unique molecular identifier counts of Cux1, Rorb, Foxp2 (a), Aqp4, Sox10, Selplg (b), Chodl, Sst, and Pvalb (c). Colors are scaled to minimum and maximum values. (d) UMAP projection of 9507 mouse cortex nuclei annotated with cell type inferred by marker gene expression. Abbreviations: microglia (MGL), mature oligodendrocytes (MOL), oligodendrocyte precursors (OPC), astrocytes (AST), endothelial cells (END), piriform cortex neurons (PIR), caudal and medial ganglionic eminence derived neurons (CGE, MGE), layers 2–6 intratelencephalic (IT), pyramidal tract (PT), near projecting excitatory neurons (NP) and corticoencephalic (CT) neurons, layer two intratelencephalic medial entorhinal area neurons (L2 IT ENTm), L2/3 intratelencephalic area prostriata neurons (L2/3 IT APr), layer three intratelencephalic entorhinal neurons (L3 IT ENTl), layer retrosplenial and anterior cingulate area neurons (L3 RSP ACA), deep L6 excitatory neurons (L6b), D1 and D2 medium spiny neurons (MSN), and vascular leptomeningeal cells (VLMC). See Figure 9—figure supplement 1 for expression of top differentially accessible genes within these clusters.
Figure 9—figure supplement 1
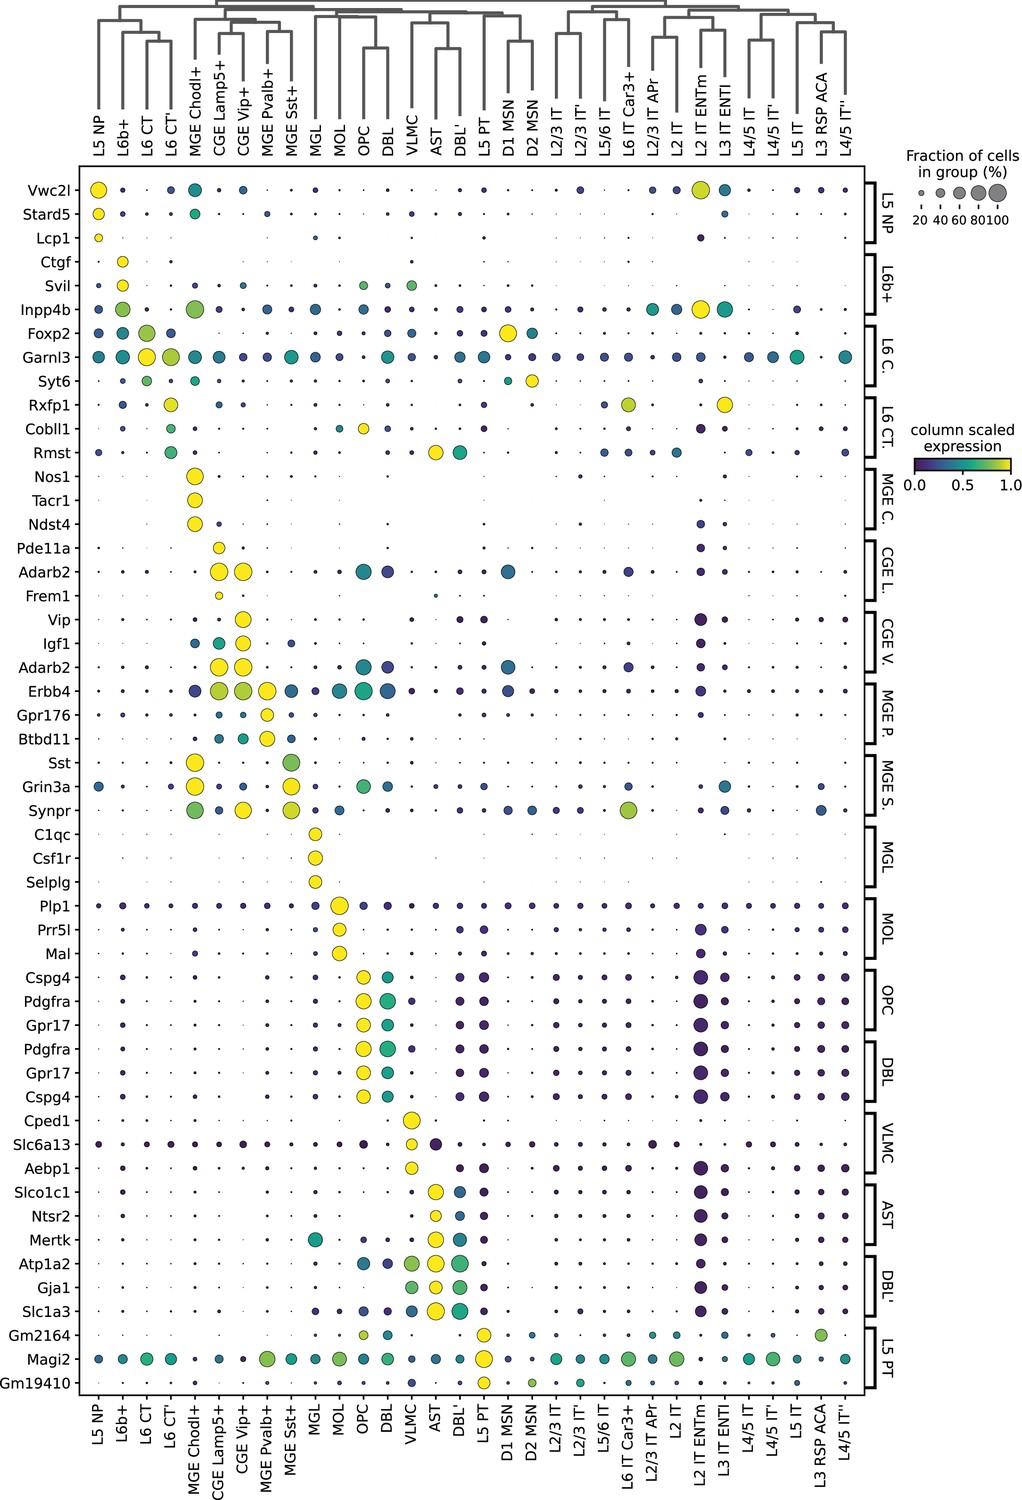
Expression of HyDrop-RNA mouse cortex top three differentially expressed genes from each cluster.
Dot sizes denote fraction of cluster in which the gene (row) was expressed. Dot color encodes the column min/max-scaled expression of the gene (row).
Figure 10 with 1 supplement
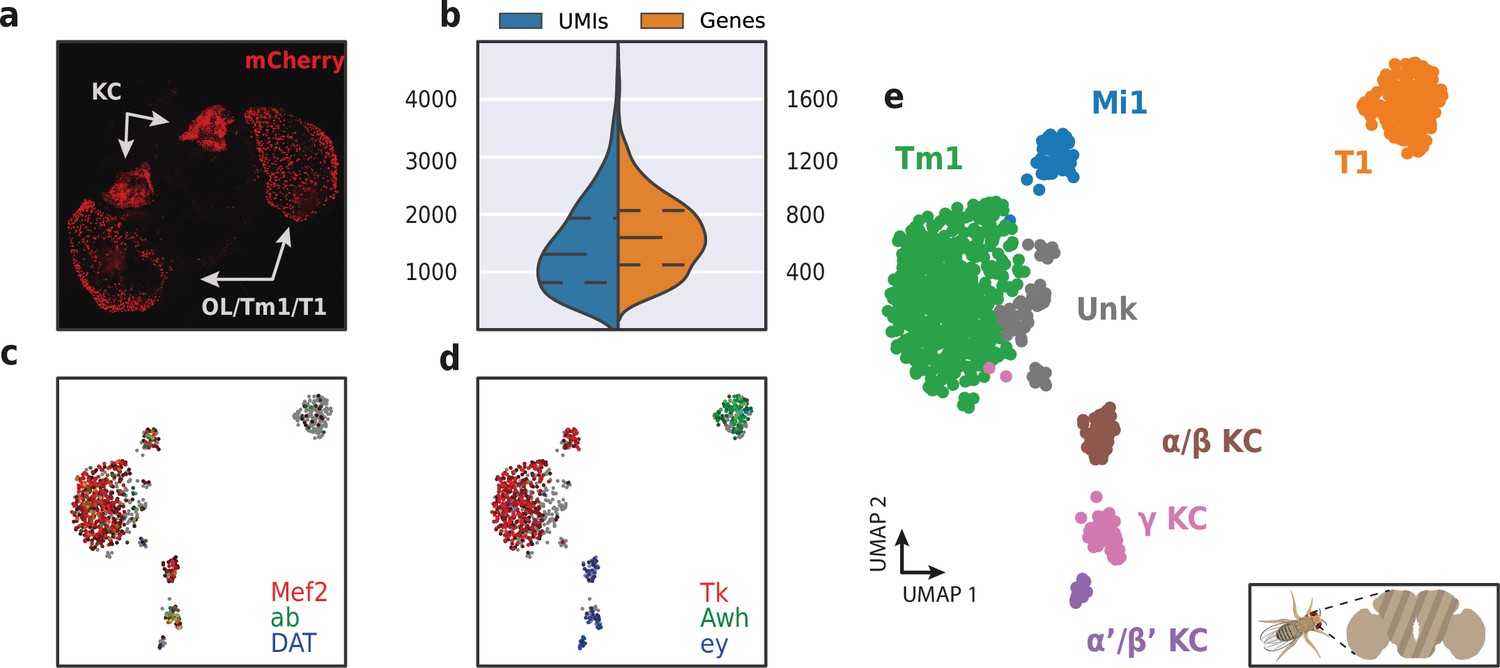
Application of HyDrop-RNA on FAC-sorted Drosophila neurons.
(a) Confocal maximum intensity projection of R74G01-Gal4> UAS-mCherry brain. (b) Violin plot of unique molecular identifiers (UMIs) and genes detected in nuclei derived from FAC-sorted fly neurons. Inner lines represent Q1, median, and Q3. Fly neuron UMAP colored by log-scaled UMI counts of Mef2, ab, DAT (c) and Tk, Awh, ey (d). Colors are scaled to minimum and maximum values. (e) UMAP of 973 FAC-sorted Drosophila neurons annotated with cell types inferred by marker gene expression (KC, Kenyon cells; Tm1, transmedullary neuron; Mi1, medullary intrinsic neuron). See Figure 10—figure supplement 1 for expression of marker genes within these clusters. Supplementary source data file available for figure b.
Figure 10—figure supplement 1
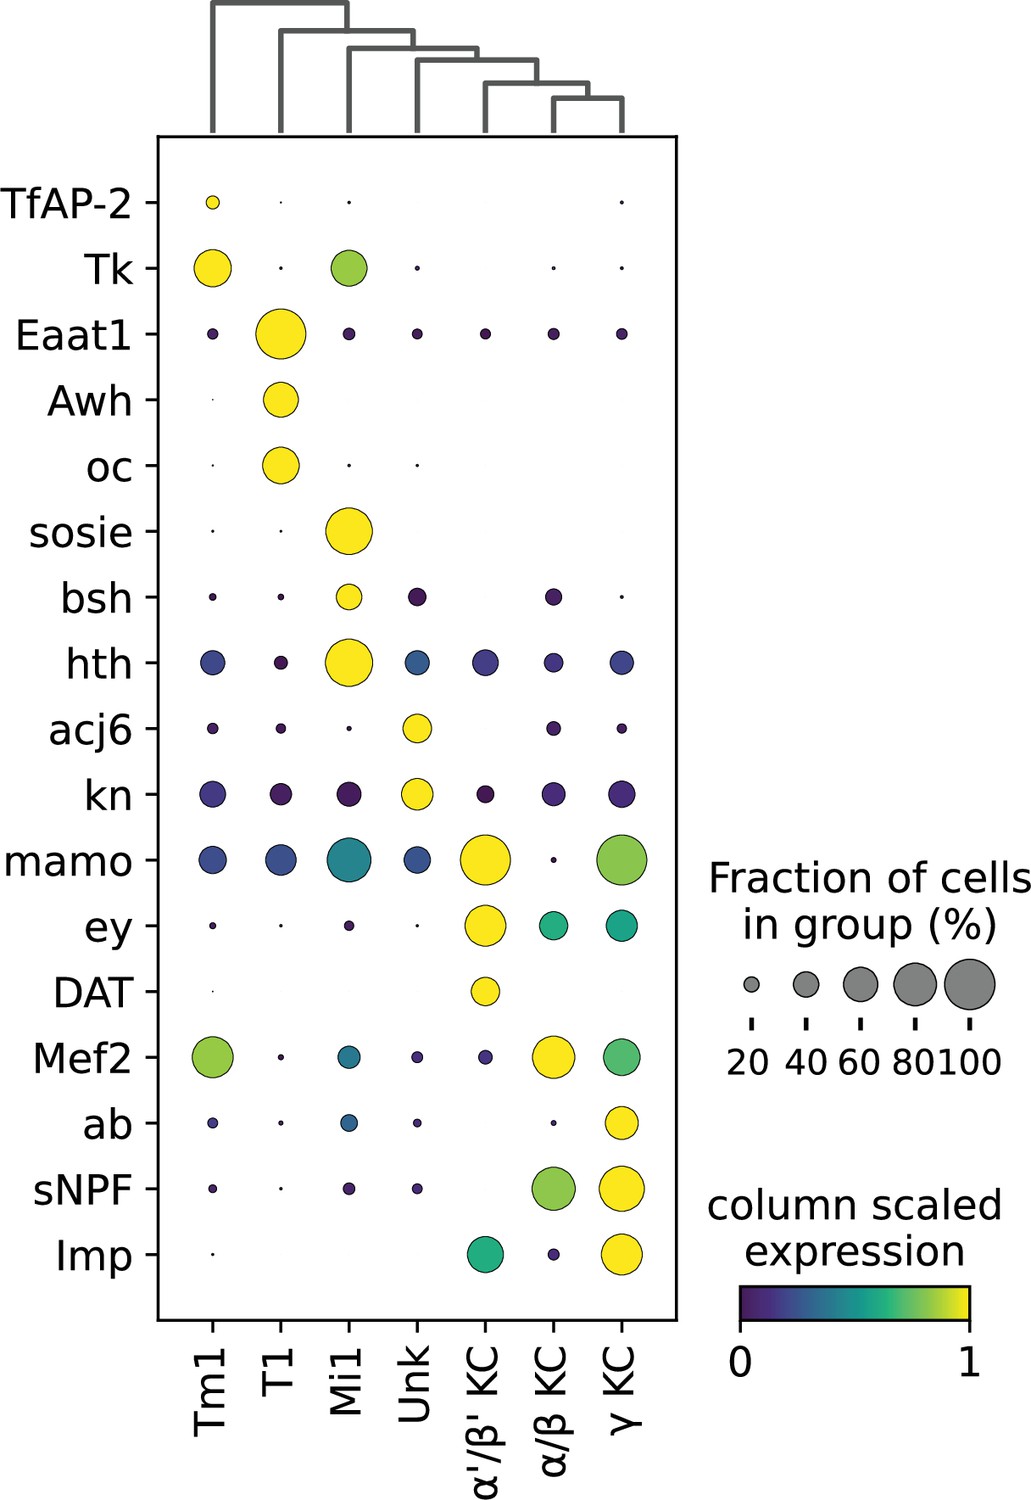
Expression of marker genes of HyDrop-RNA on FAC-sorted fly brain cells.
Dot sizes denote fraction of cluster in which the gene (row) was expressed. Dot color encodes the column min/max-scaled expression of the gene (row).
Author response image 1
Additional files
-
Supplementary file 1
"Molecular sequence description of HyDrop bead barcoding": visual description of progression of nucleotide sequences involved in every step of the barcoding process.
- https://cdn.elifesciences.org/articles/73971/elife-73971-supp1-v5.docx
-
Supplementary file 2
"Molecular sequence description of HyDrop-ATAC": visual description of progression of nucleotide sequences involved in every step of HyDrop-ATAC.
- https://cdn.elifesciences.org/articles/73971/elife-73971-supp2-v5.docx
-
Supplementary file 3
"Molecular sequence description of HyDrop-RNA": visual description of progression of nucleotide sequences involved in every step of HyDrop-RNA.
- https://cdn.elifesciences.org/articles/73971/elife-73971-supp3-v5.docx
-
Supplementary file 4
"Reagents and oligonucleotide list": list of all reagents and oligonucleotides used in HyDrop.
- https://cdn.elifesciences.org/articles/73971/elife-73971-supp4-v5.xlsx
-
Supplementary file 5
"Price calculation for HyDrop bead barcoding and HyDrop-ATAC": detailed price calculation for HyDrop bead barcoding and HyDrop-ATAC.
- https://cdn.elifesciences.org/articles/73971/elife-73971-supp5-v5.xlsx
-
Transparent reporting form
- https://cdn.elifesciences.org/articles/73971/elife-73971-transrepform1-v5.docx
-
Source data 1
Source data files for Figure 4a, Figure 5b–d, Figure 8a–c, Figure 8—figure supplement 2, and Figure 10b.
- https://cdn.elifesciences.org/articles/73971/elife-73971-data1-v5.zip
Download links
A two-part list of links to download the article, or parts of the article, in various formats.
Downloads (link to download the article as PDF)
Open citations (links to open the citations from this article in various online reference manager services)
Cite this article (links to download the citations from this article in formats compatible with various reference manager tools)
Hydrop enables droplet-based single-cell ATAC-seq and single-cell RNA-seq using dissolvable hydrogel beads
eLife 11:e73971.
https://doi.org/10.7554/eLife.73971


