Structural basis for the absence of low-energy chlorophylls in a photosystem I trimer from Gloeobacter violaceus
- Research Institute for Interdisciplinary Science and Graduate School of Natural Science and Technology, Okayama University, Japan
- Biostructural Mechanism Laboratory, RIKEN SPring-8 Center, Japan
- Graduate School of Science, Kobe University, Japan
- Biomolecular Characterization Unit, RIKEN Center for Sustainable Resource Science, Japan
- Research Center for Inland Seas, Kobe University, Japan
- Institute of Low Temperature Science, Hokkaido University, Japan
- Institute of Multidisciplinary Research for Advanced Materials, Tohoku University, Japan
- Advanced Electron Microscope Development Unit, RIKEN-JEOL Collaboration Center, RIKEN Baton Zone Program, Japan
Figures
Figure 1
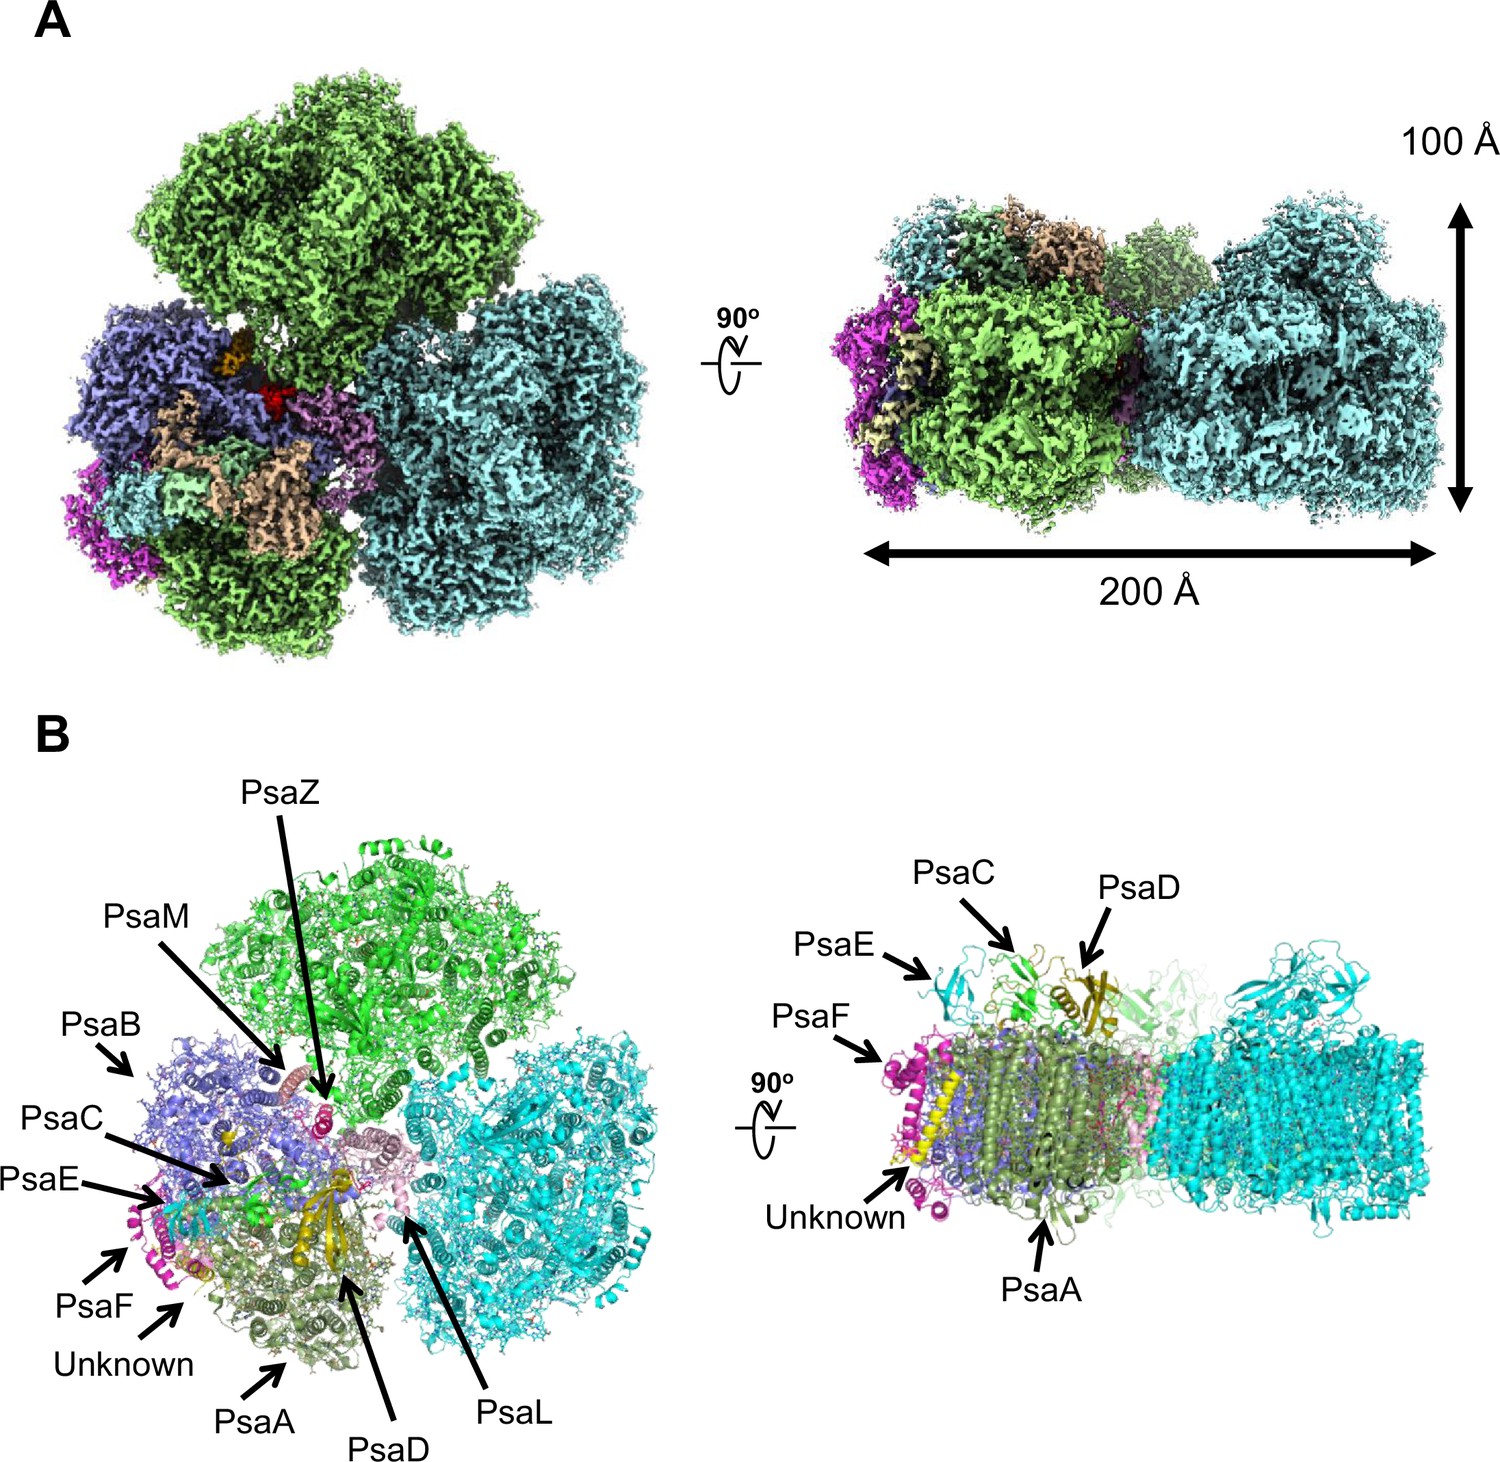
Overall structure of the Gloeobacter photosystem I (PSI) trimer.
(A) Cryo-electron microscopy (cryo-EM) density of the PSI trimer at 2.04 Å resolution. (B) Structural model of the PSI trimer. Views are from the top of the cytosolic side (left) and side of the membrane (right) for both panels (A and B).
Figure 2
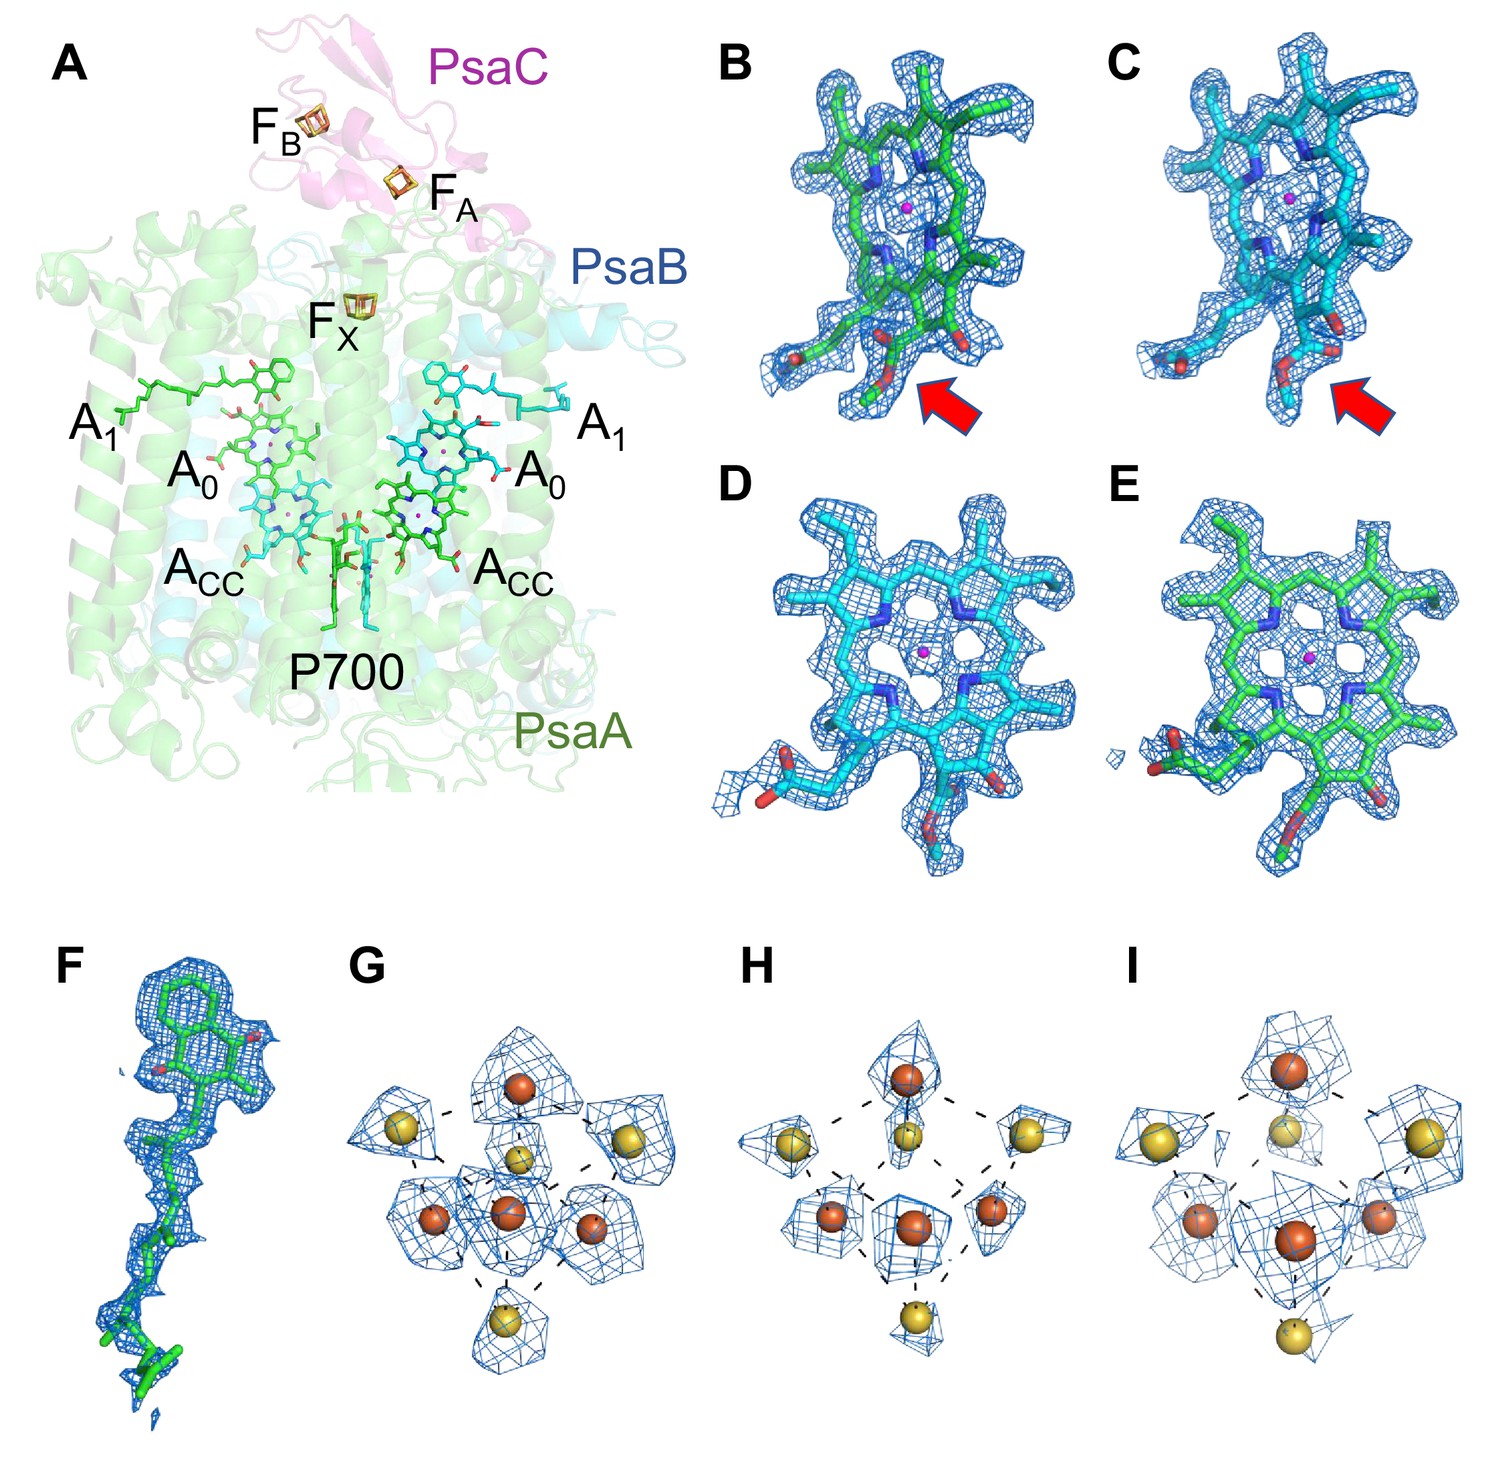
Cofactors involved in the electron-transfer reaction of the Gloeobacter photosystem I (PSI).
(A) Arrangement of cofactors involved in the electron-transfer reaction. P700, special pair Chls; Acc, accessory Chl; A0, primary electron acceptor; A1, secondary electron acceptor menaquinone-4; FX, FA, and FB, iron–sulfur clusters. P700 serves as a primary electron donor, and the electron produced is transferred to A1 via A0 (and ACC) in each branch, followed by sequential transfer to FX → FA → FB. However, whether the electrons are transferred through both branches or proceed preferentially through one branch is still under debate. (B–I) The cryo-electron microscopy (cryo-EM) density maps of cofactors and their refined models. (B) Chl a′ in P700; (C) Chl a in P700; (D) Acc; (E) A0; (F) A1; (G–I), FX, FA, and FB. Red arrows indicate structural differences between Chl a and Chl a′ (B, C). The densities for Chls, quinone, and iron–sulfur clusters were depicted at 5 σ, 3 σ, and 15 σ, respectively.
Figure 3
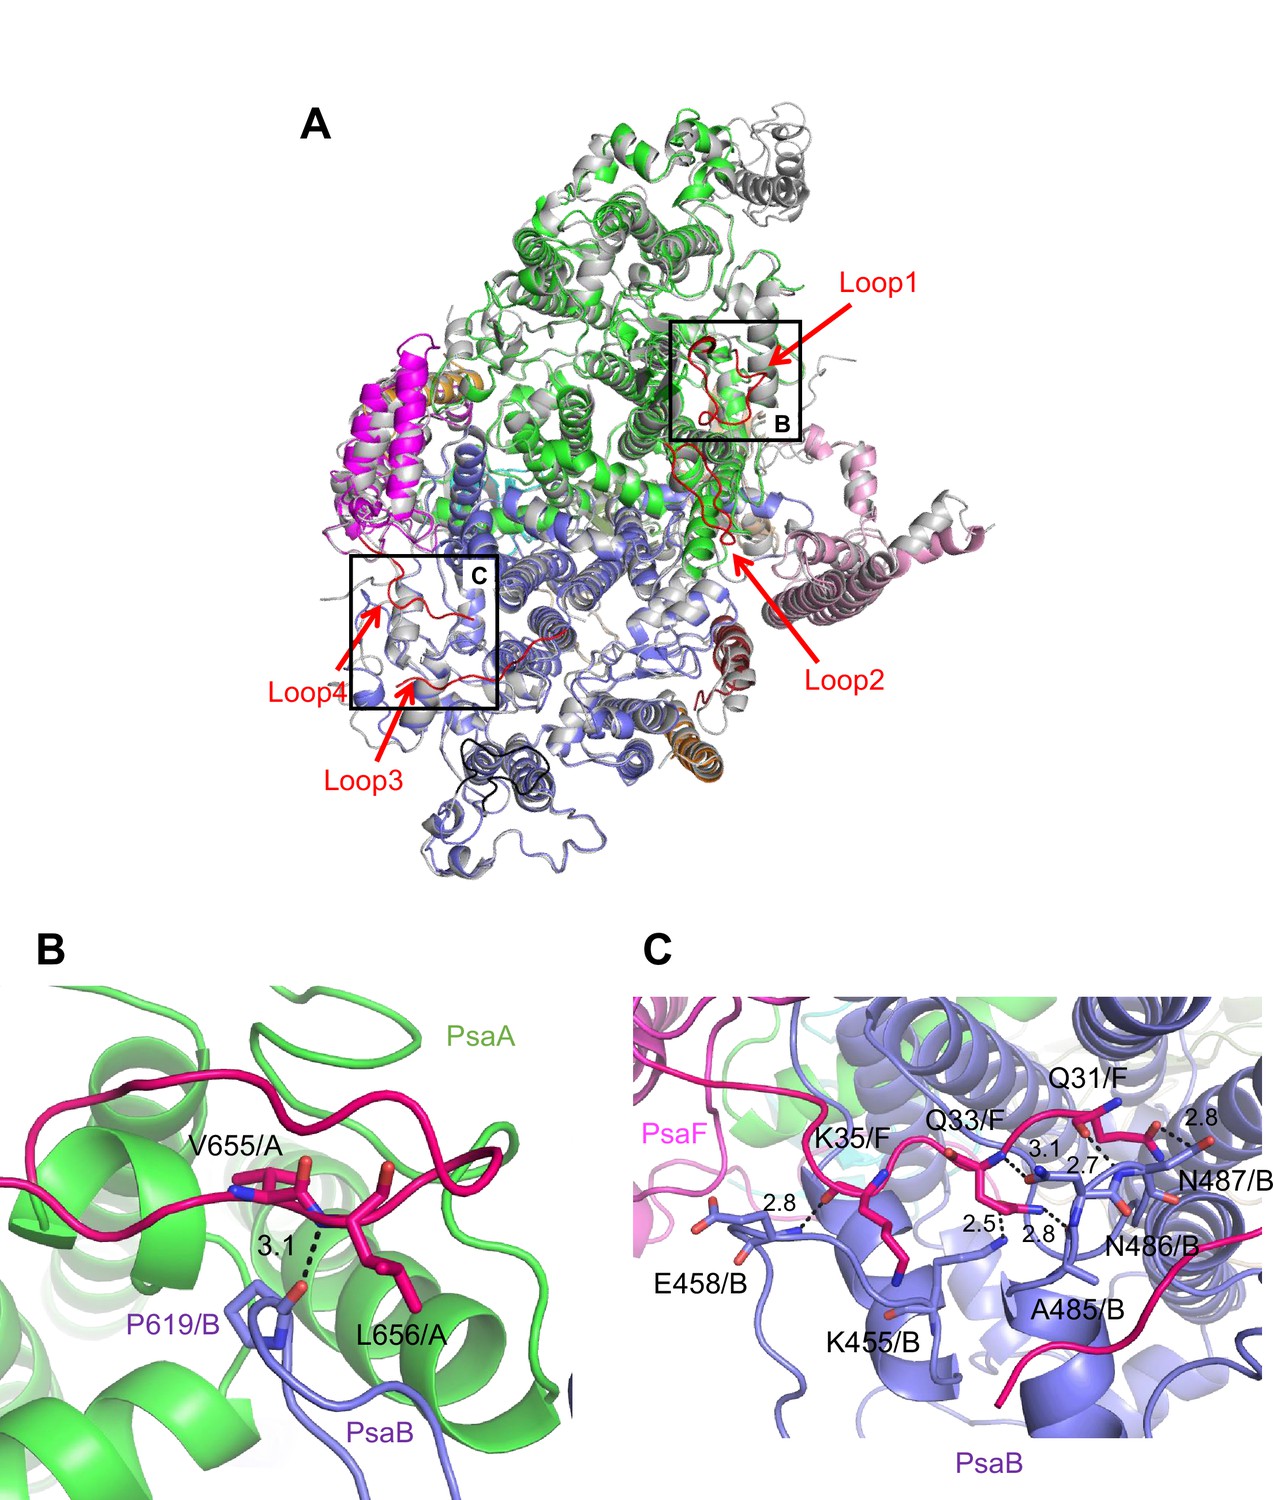
Characteristic structure of the Gloeobacter photosystem I (PSI).
(A) Superposition of the structure of Gloeobacter PSI (colored) with that of the Synechocystis PSI (gray) (PDB: 5OY0) viewed along the membrane normal from the periplasmic side. Structural differences of loop insertions are colored in red. The RMSD is 0.82 Å for 2,019 Cα atoms from subunits observed commonly between Gloeobacter and Synechocystis PSIs. (B, C) Closeup views of the loop insertions in the regions of Asn652–Ser665 of PsaA (Loop2) in the Gloeobacter PSI (B) and of Gln31–Asp36 of PsaF (Loop4) in the Gloeobacter PSI (C).
Figure 4
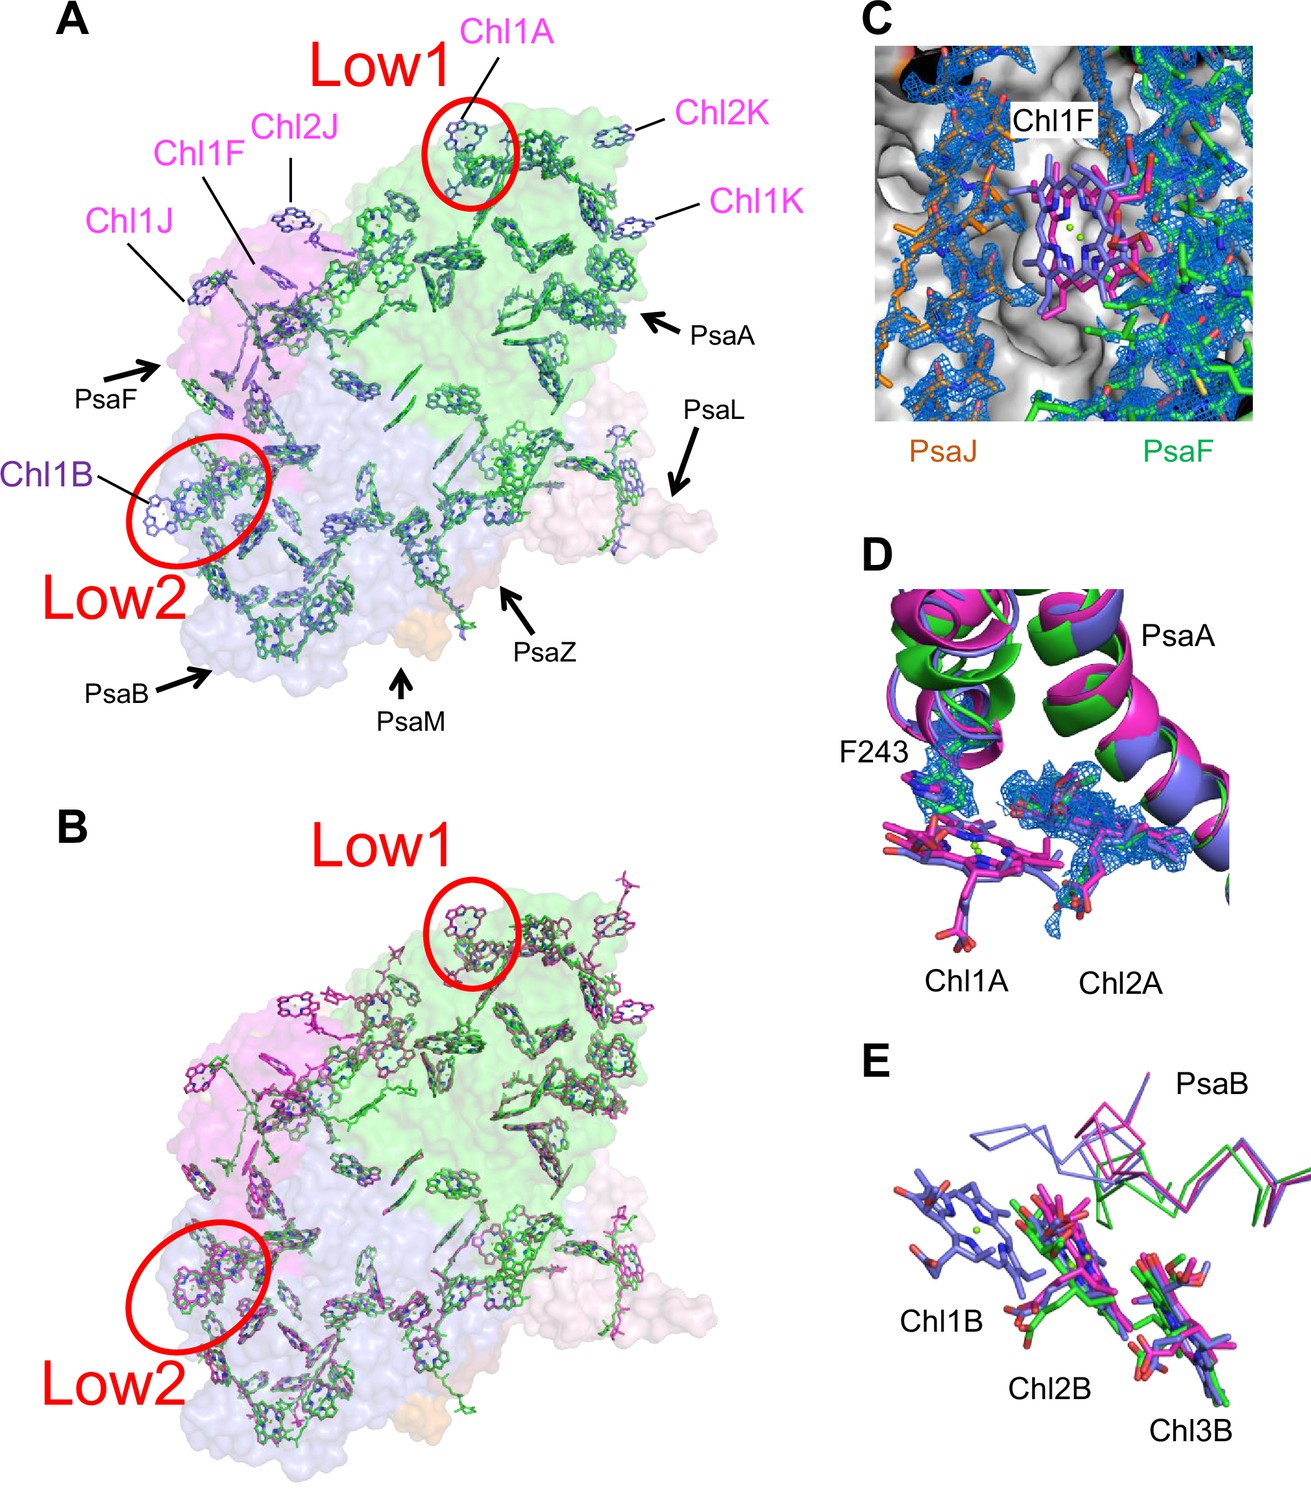
Comparison of pigments among the three types of photosystem I (PSIs).
(A, B) Superposition of the PSI-monomer structures viewed along the membrane normal from the periplasmic side, with protein subunits depicted in a surface model. (A) Gloeobacter (green) vs. T. vulcanus (purple) (PDB: 6K33); (B) Gloeobacter (green) vs. Synechocystis (magenta) (PDB: 5OY0). Red circles stand for the sites of Low1 and Low2. Closeup views of the environments near pigments of Chl1F (C) and Chl1A (D) with their densities depicted at 1.5 σ, and Chl1B (E), in the three species.
Figure 5
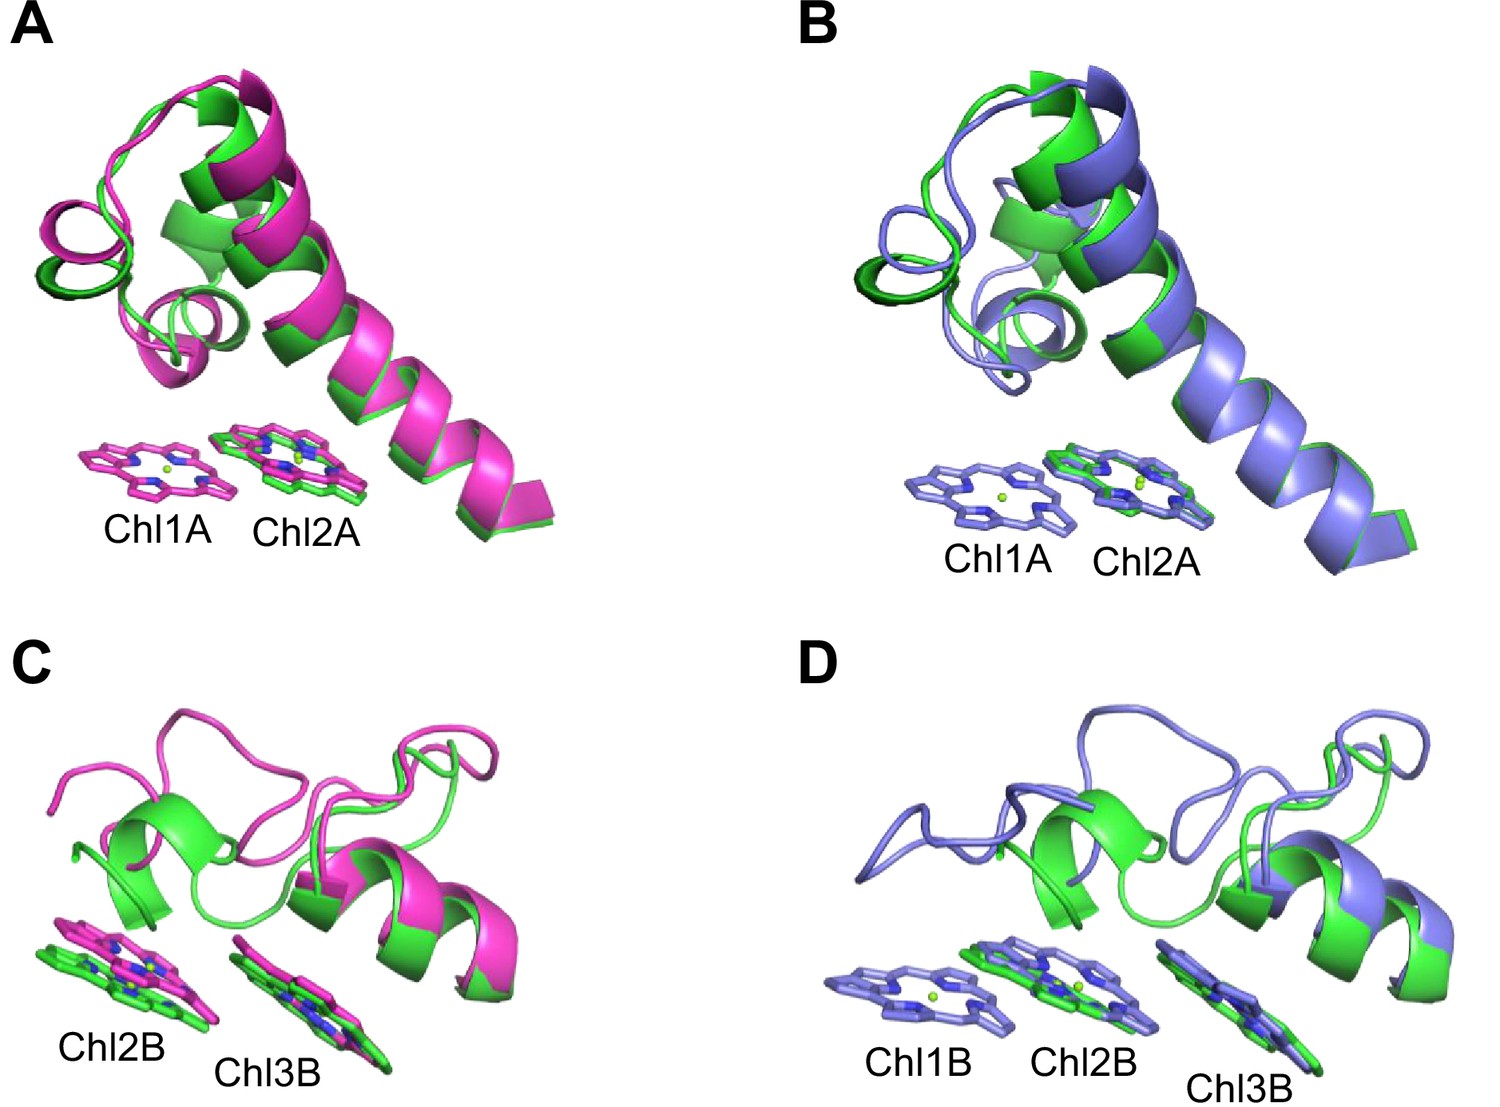
Closeup views of Low1 and Low2.
(A) Superposition of the Low1 site in the Gloeobacter photosystem I (PSI; green) and Synechocystis PSI (magenta) (PDB: 5OY0). (B) Superposition of the Low1 site in the Gloeobacter PSI (green) and T. vulcanus PSI (purple) (PDB: 6K33). (C) Superposition of the Low2 site in the Gloeobacter PSI (green) and Synechocystis PSI (magenta). (D) Superposition of the Low2 site in the Gloeobacter PSI (green) and T. vulcanus PSI (purple).
Figure 6
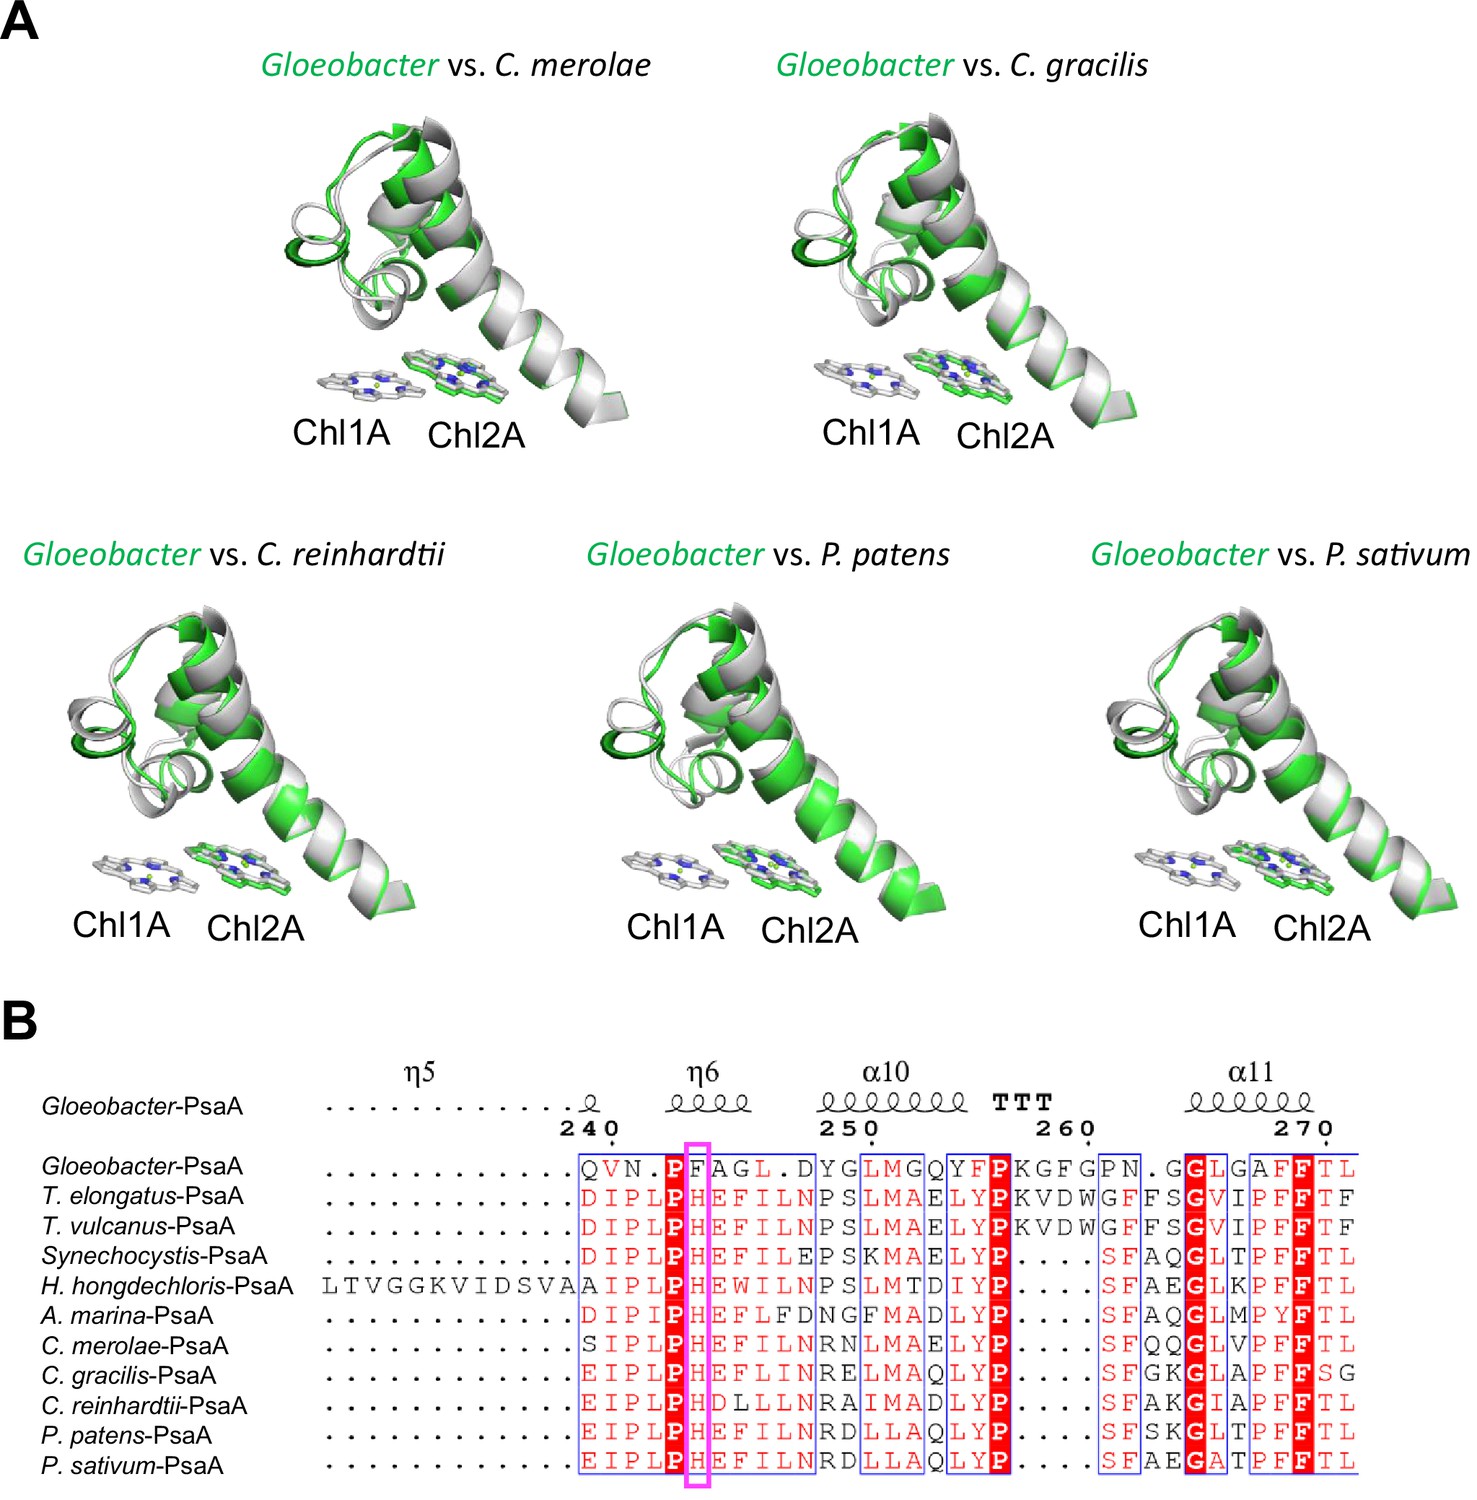
Structural comparisons of the Low1 site among oxyphototrophs.
(A) Superposition of the Low1 site of the Gloeobacter photosystem I (PSI; green) with PSI complexes of photosynthetic eukaryotes (gray): Cyanidioschyzon merolae (PDB: 5ZGB), Chaetoceros gracilis (PDB: 6L4U), Chlamydomonas reinhardtii (PDB: 6JO5), Physcomitrella patens (PDB: 6L35), and Pisum sativum (PDB: 4XK8). (B) Multiple sequence alignment of PsaA among oxyphototrophs using ClustalW and ESPript. The species shown are Gloeobacter violaceus PCC 7421, Thermosynechococcus elongatus BP-1, Thermosynechococcus vulcanus NIES-2134, Synechocystis sp. PCC 6803, Halomicronema hongdechloris C2206, Acaryochloris marina MBIC11017, C. merolae, C. gracilis, C. reinhardtii, P. patens, and P. sativum. The pink box displays the histidine residue involved in the binding of Chl1A.
Figure 7
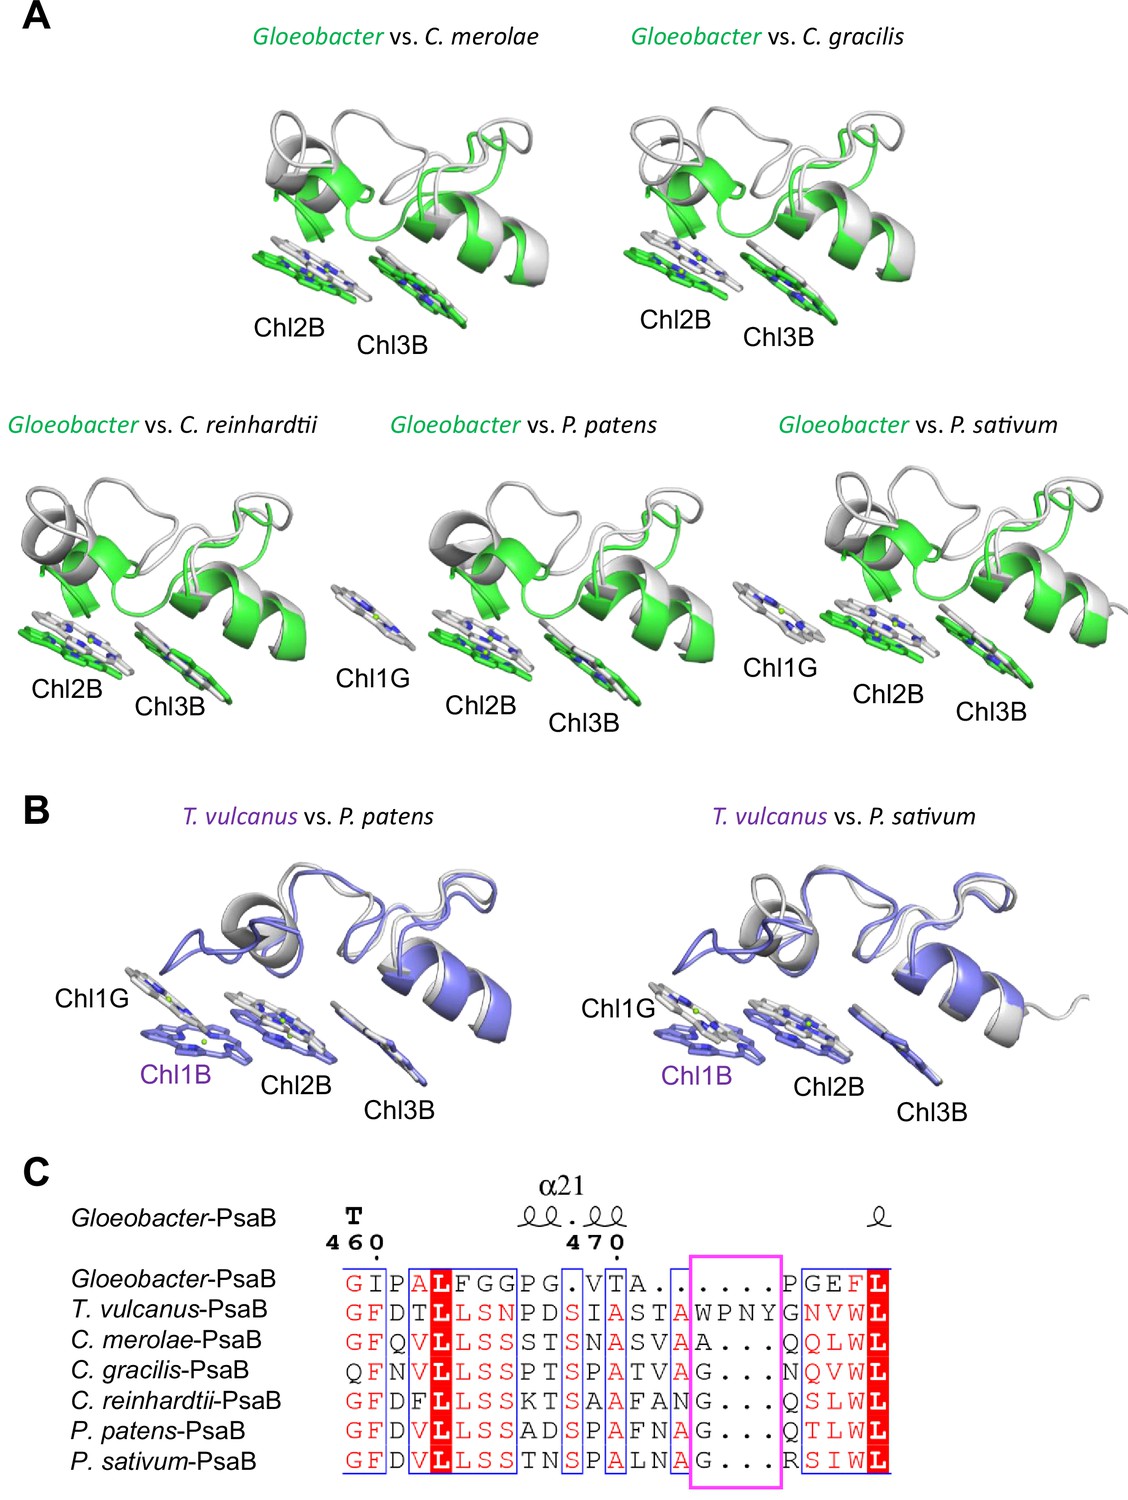
Structural comparisons of the Low2 site among oxyphototrophs.
(A) Superposition of the Low2 site of the Gloeobacter photosystem I (PSI; green) with PSI complexes of photosynthetic eukaryotes (gray): Cyanidioschyzon merolae (PDB: 5ZGB), Chaetoceros gracilis (PDB: 6L4U), Chlamydomonas reinhardtii (PDB: 6JO5), Physcomitrella patens (PDB: 6L35), and Pisum sativum (PDB: 4XK8). (B) Superposition of the Low2 site of T. vulcanus PSI (purple) (PDB: 6K33) with PSI complexes (gray) of P. patens and P. sativum. (C) Multiple sequence alignment of PsaB using ClustalW and ESPript. The pink box indicates the loop involved in the binding of Chl1B in T. vulcanus.
Appendix 1—figure 1
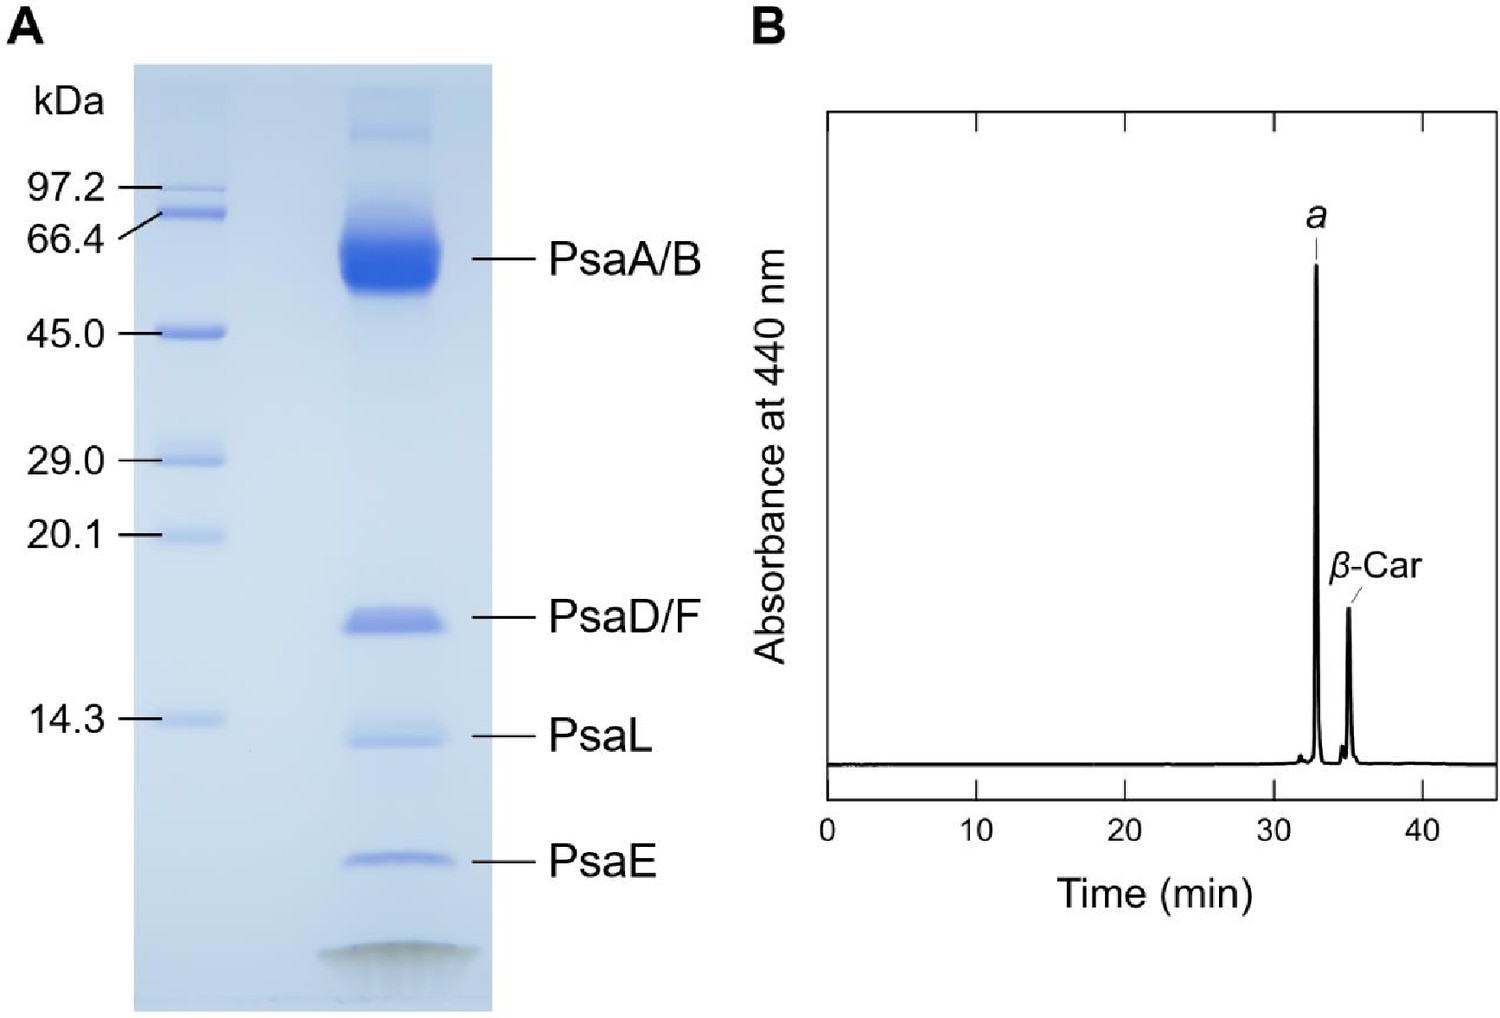
Biochemical characterization of the Gloeobacter PSI trimer.
(A) SDS-PAGE analysis of the PSI trimer. Protein bands were identified by mass spectrometry. It should be noted that some of the subunits in the PSI trimer were not detected by SDS-PAGE, probably due to their poor staining by CBB, but were visualized by the present cryo-EM map. (B) HPLC analysis of pigments extracted from the PSI trimer monitored at 440 nm. Letters of a and β-Car indicate Chl a and β-carotene, respectively. Data are representative of three independent experiments.
Appendix 1—figure 2
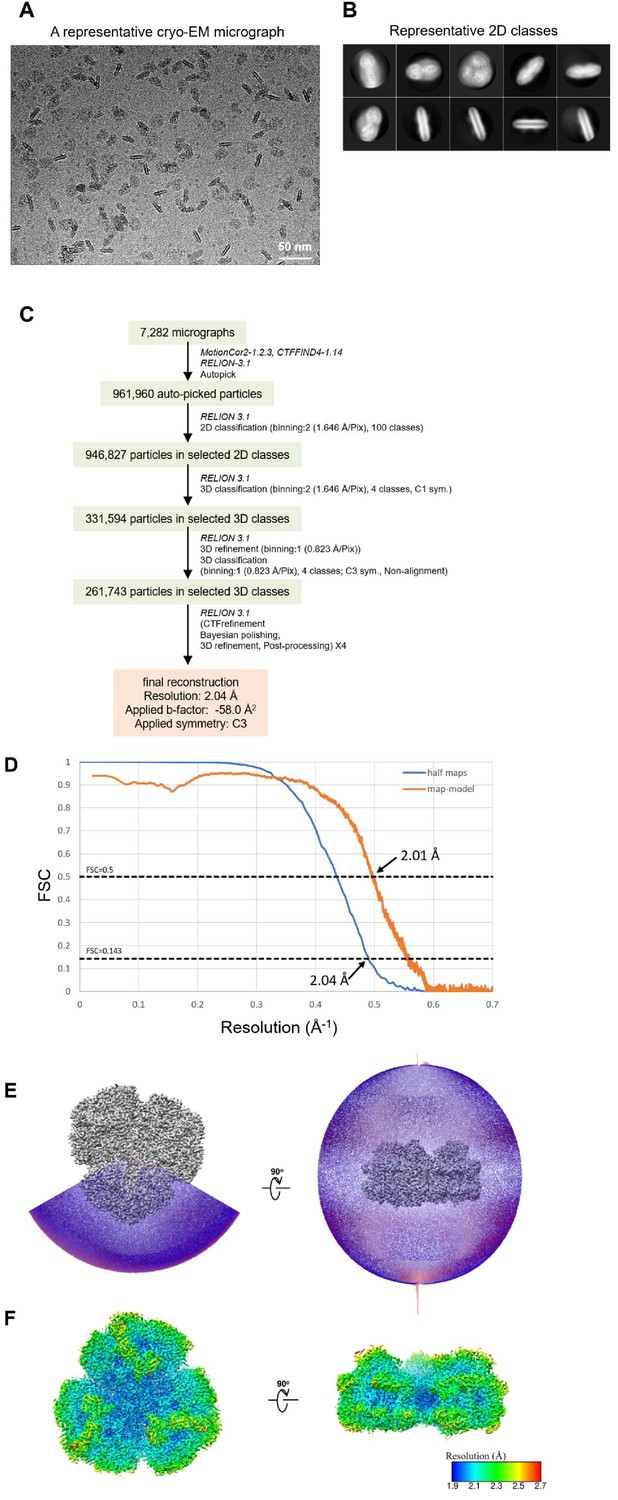
Cryo-EM data collection and processing of the Gloeobacter PSI trimer.
(A) Representative cryo-EM micrograph of the PSI trimer. (B) Representative 2D classes of the PSI trimer. The box size is 330 Å. (C) A flowchart showing the classification scheme of the PSI trimer. The overall structure of PSI was reconstructed at a 2.04-Å resolution from 261,743 particles. (D) FSC curves of the PSI trimer for independently refined half maps (half maps) and full map vs. model (map-model). (E) Angular distribution of the particles used for reconstruction of the PSI trimer. Each cylinder represents one view, and its height is proportional to the number of particles. (F) Local resolution map of the PSI trimer.
Appendix 1—figure 3
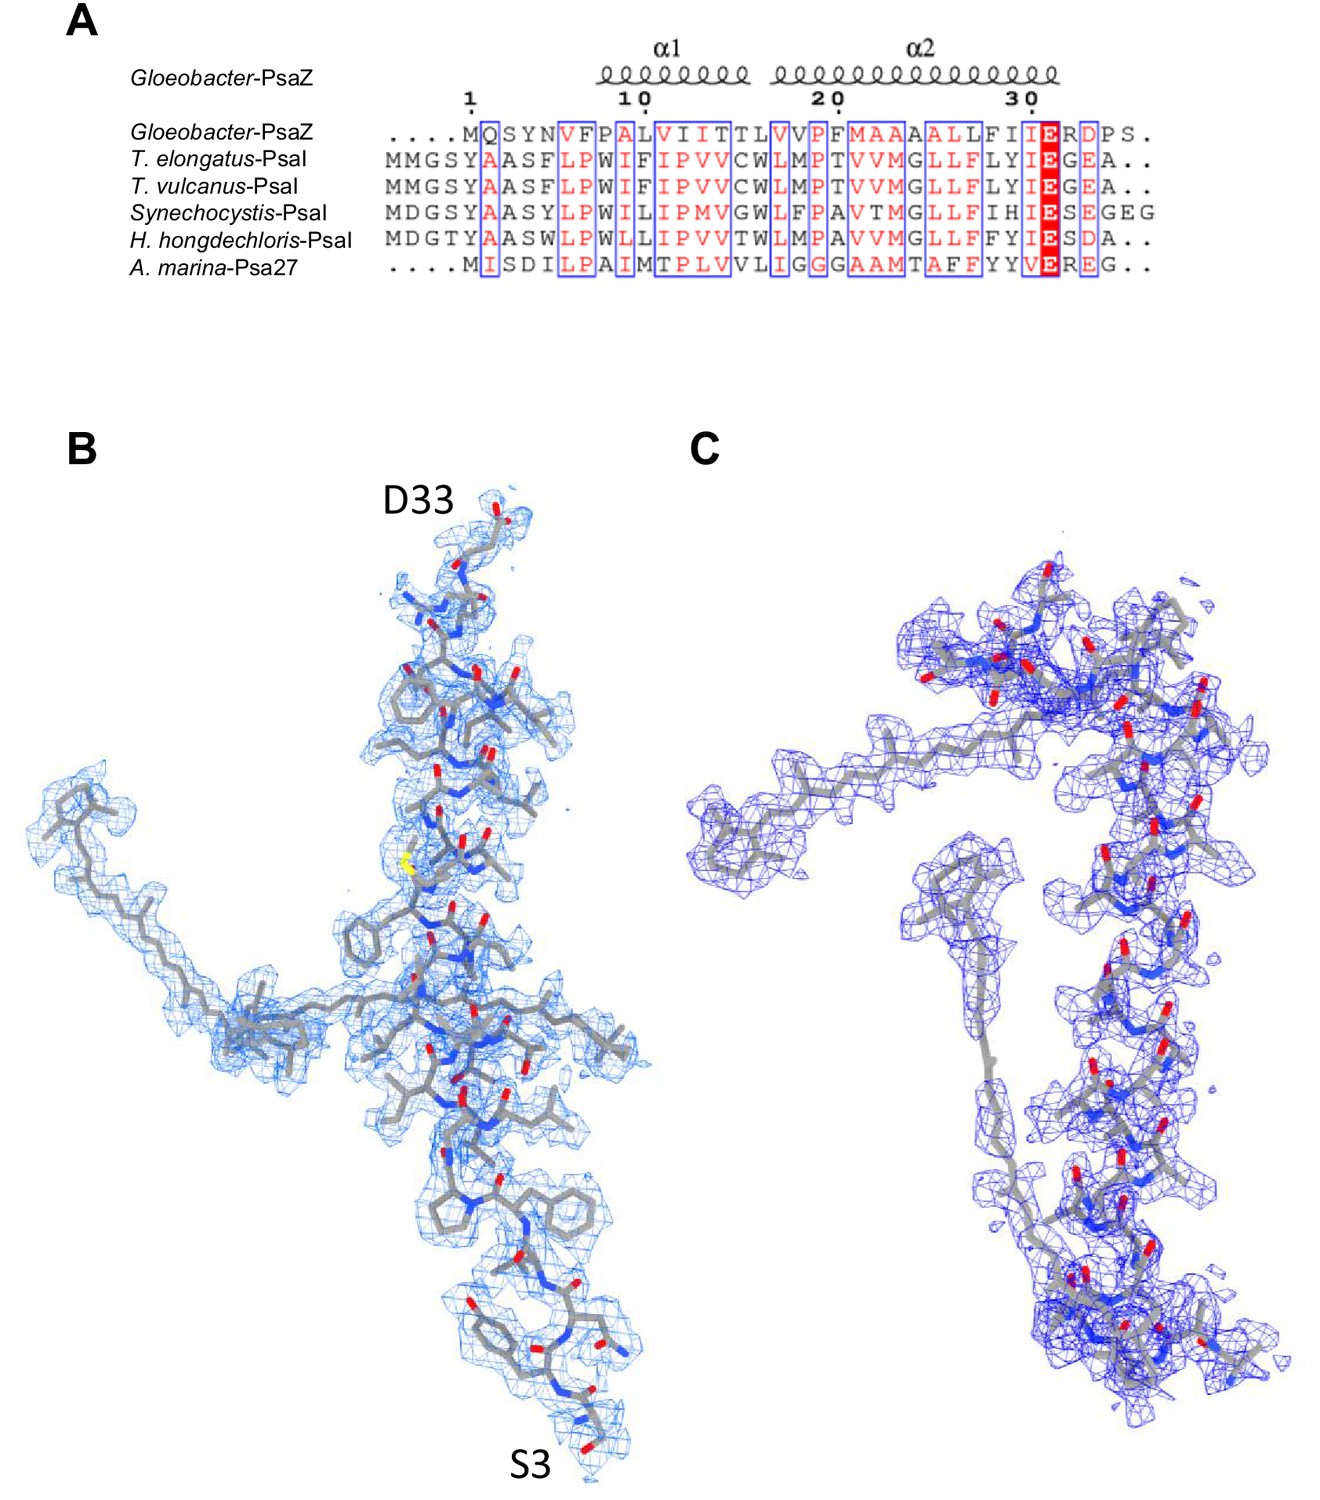
Identification of the Gloeobacter PSI subunits.
(A) Multiple sequence alignment (ClustalW and ESPript) of the Gloeobacter PsaZ and other cyanobacterial PsaI subunits. The species shown are Gloeobacter violaceus PCC 7421, Thermosynechococcus elongatus BP-1, Thermosynechococcus vulcanus NIES-2134, Synechocystis sp. PCC 6803, Halomicronema hongdechloris C2206, and Acaryochloris marina MBIC11017. (B) The cryo-EM density (blue meshes) of PsaZ and its corresponding model (gray sticks). (C) The cryo-EM density of the Unknown subunit (blue meshes) and its corresponding model (gray sticks).
Appendix 1—figure 4
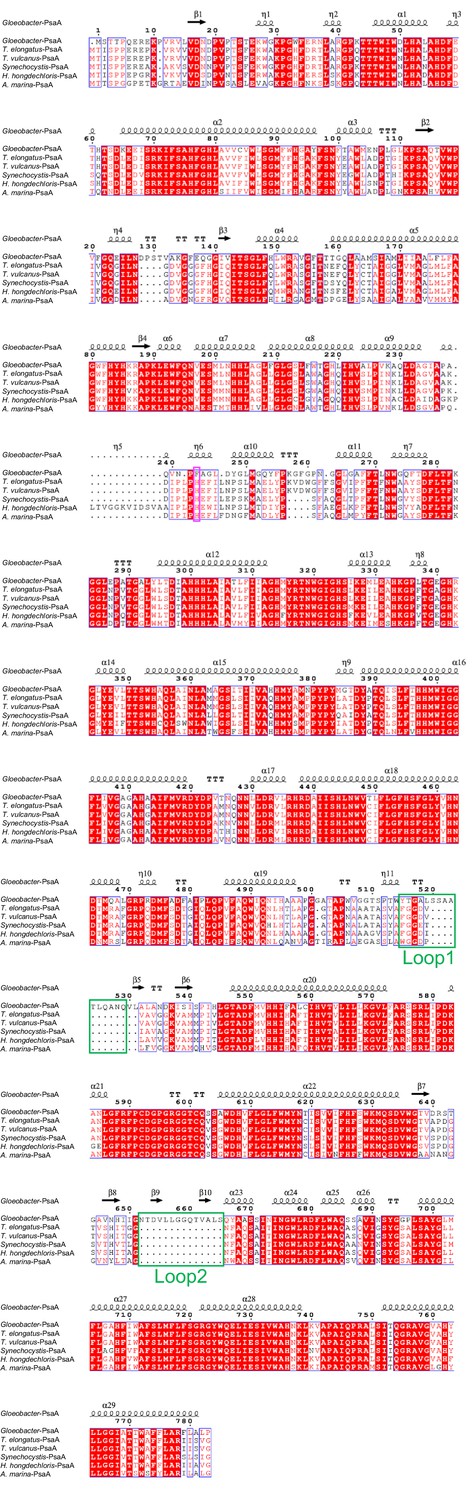
Comparison of the structurally known PsaA subunit among six species of cyanobacteria.
Multiple sequence alignment was carried out using ClustalW and ESPript. Secondary-structural elements are shown above the sequence. Completely conserved residues are highlighted in red. Loop1 (Tyr515-Gln529) and Loop2 (Asn652-Ser665) are labeled and indicated by green boxes. The pink box stands for the histidine residue involved in the binding of Chl1A. The species shown are Gloeobacter violaceus PCC 7421, Thermosynechococcus elongatus BP-1, Thermosynechococcus vulcanus NIES-2134, Synechocystis sp. PCC 6803, Halomicronema hongdechloris C2206, and Acaryochloris marina MBIC11017.
Appendix 1—figure 5
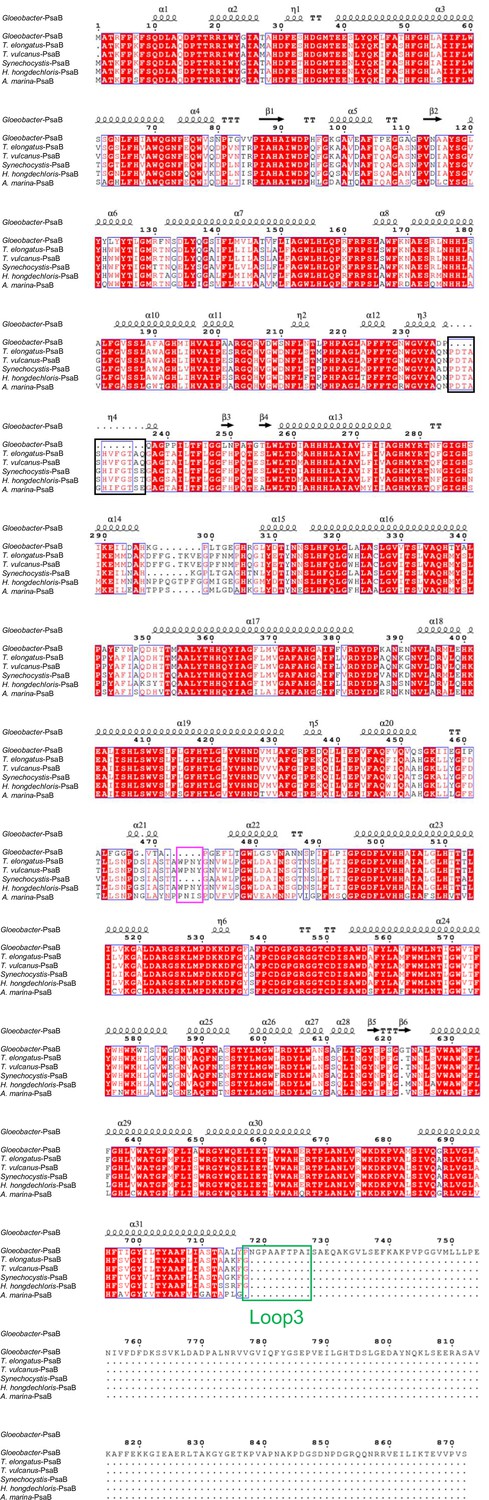
Comparison of the structurally known PsaB subunit among six species of cyanobacteria.
Multiple sequence alignment was carried out using ClustalW and ESPript. Secondary-structural elements are shown above the sequence. Completely conserved residues are highlighted in red. Loop3 (Pro717-Ile727) is labeled and indicated by a green box. The pink box indicates the loop involved in the binding of Chl1B. The black box stands for the deletion in the Gloeobacter PsaB. The species shown are Gloeobacter violaceus PCC 7421, Thermosynechococcus elongatus BP-1, Thermosynechococcus vulcanus NIES-2134, Synechocystis sp. PCC 6803, Halomicronema hongdechloris C2206, and Acaryochloris marina MBIC11017.
Appendix 1—figure 6
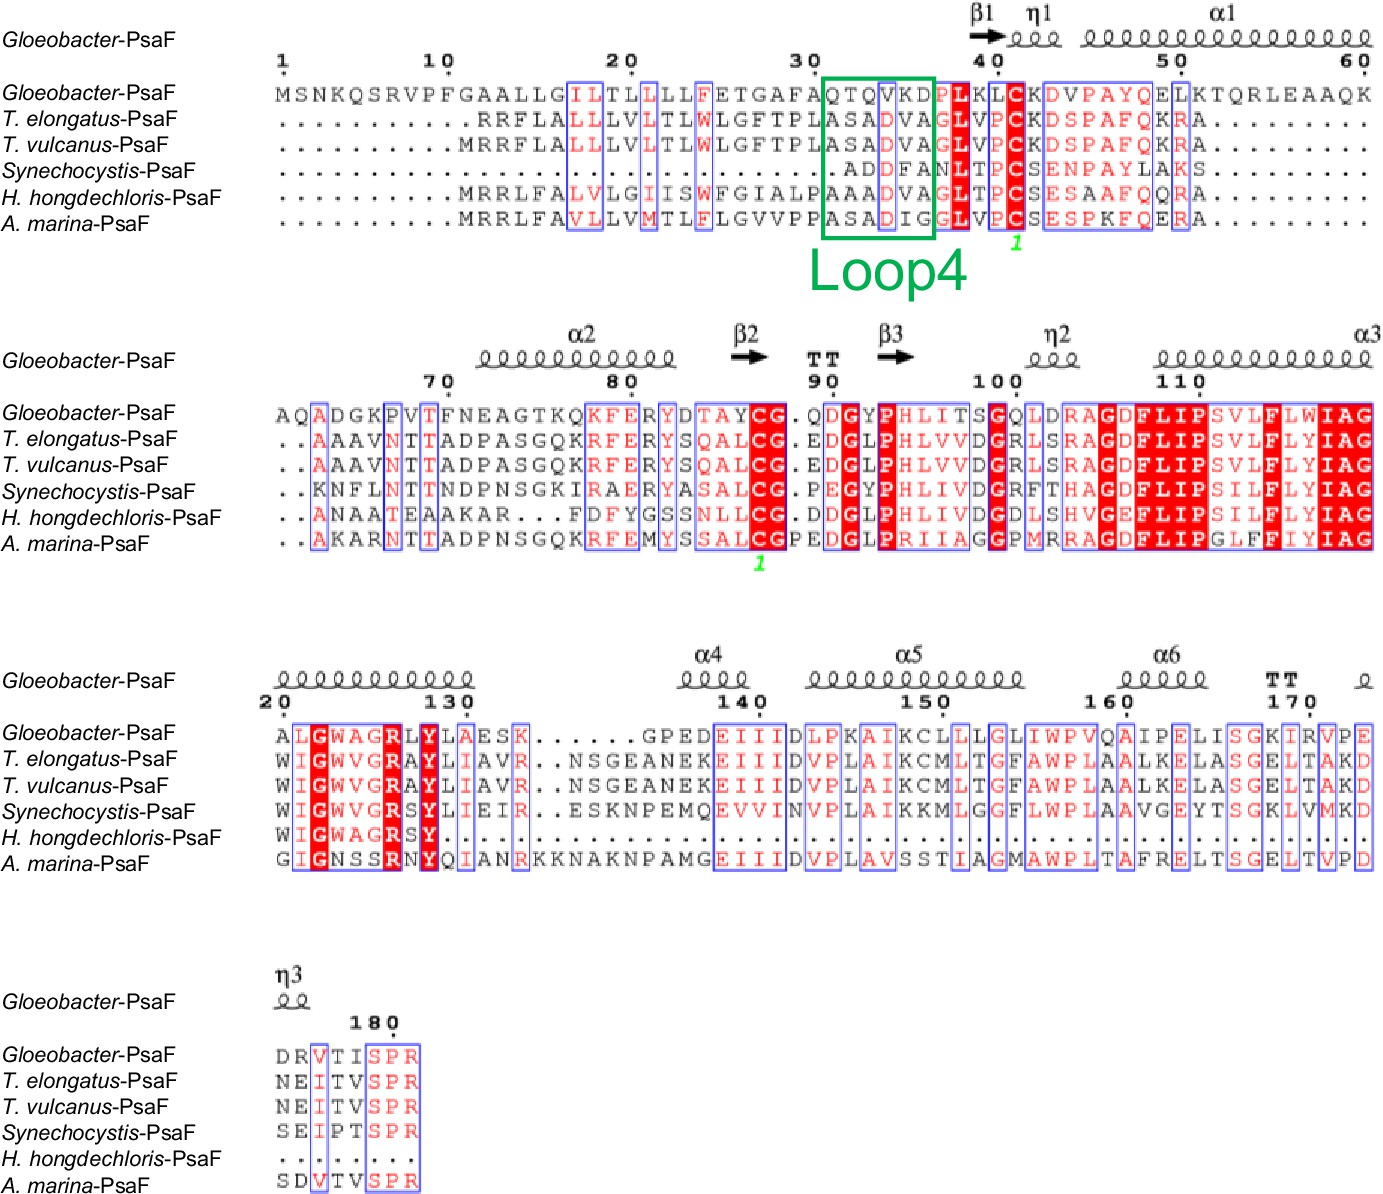
Comparison of the structurally known PsaF subunit among six species of cyanobacteria.
Multiple sequence alignment was carried out using ClustalW and ESPript. Secondary-structural elements are shown above the sequence. Completely conserved residues are highlighted in red. Loop4 (Gln31-Asp36) is labeled and indicated by a green box. The species shown are Gloeobacter violaceus PCC 7421, Thermosynechococcus elongatus BP-1, Thermosynechococcus vulcanus NIES-2134, Synechocystis sp. PCC 6803, Halomicronema hongdechloris C2206, and Acaryochloris marina MBIC11017.
Appendix 1—figure 7
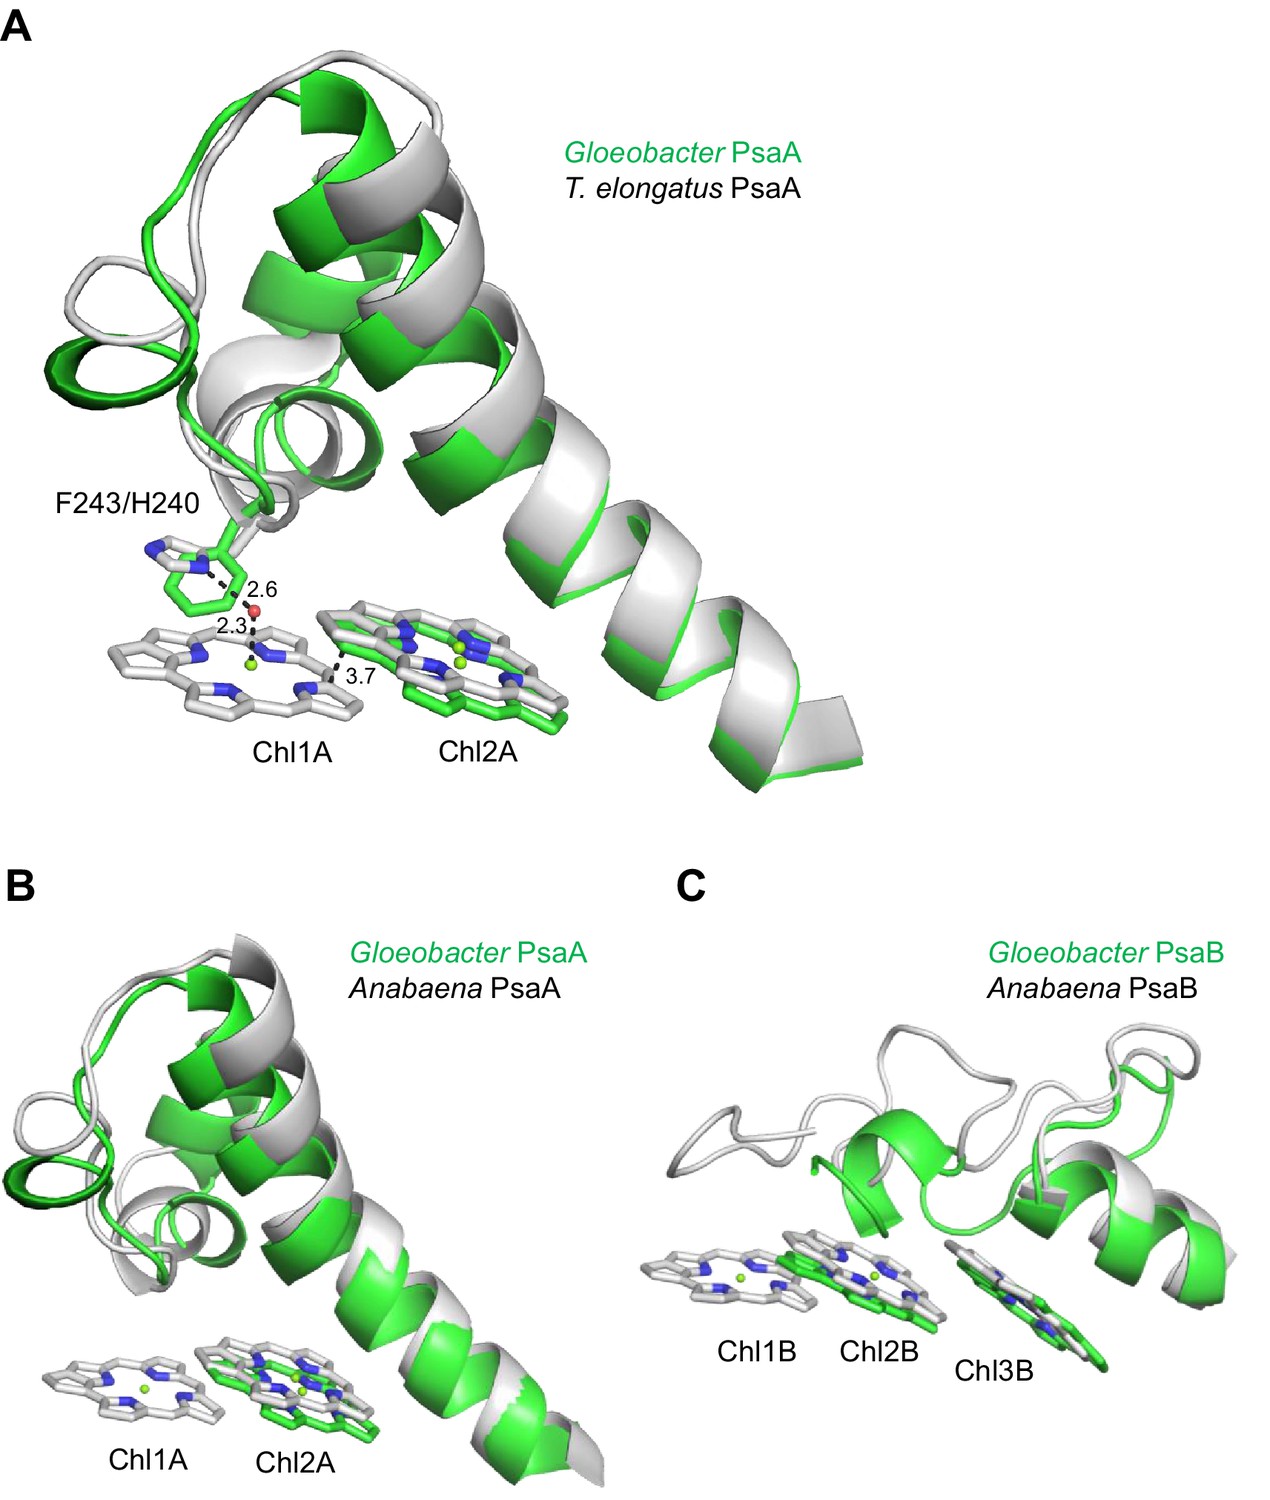
Structural comparisons of the Low1 and Low2 sites in PsaA between Gloeobacter and other organisms.
(A) Superposition of the Low1 site in the Gloeobacter PSI (green) with that of the T. elongatus PSI (gray) (PDB: 1JB0). Phe243 of the Gloeobacter PsaA and His240 of the T. elongatus PsaA are shown in stick models. Dashed lines indicate interactions with distances labeled in Å. (B, C) Superposition of the Low1 (B) and Low2 (C) sites in the Gloeobacter PSI (green) with those in the Anabaena PSI (gray) (PDB: 6JEO).
Appendix 1—figure 8

Fluorescence-emission and absorption spectra of the Gloeobacter PSI (black), Synechocystis PSI (red), and T. vulcanus PSI (blue).
(A) Fluorescence spectra were measured at 77 K and normalized by their maximum-peak intensities. (B) Absorption spectra were measured at 77 K and normalized by the Qy-peak intensities.
Appendix 1—figure 9
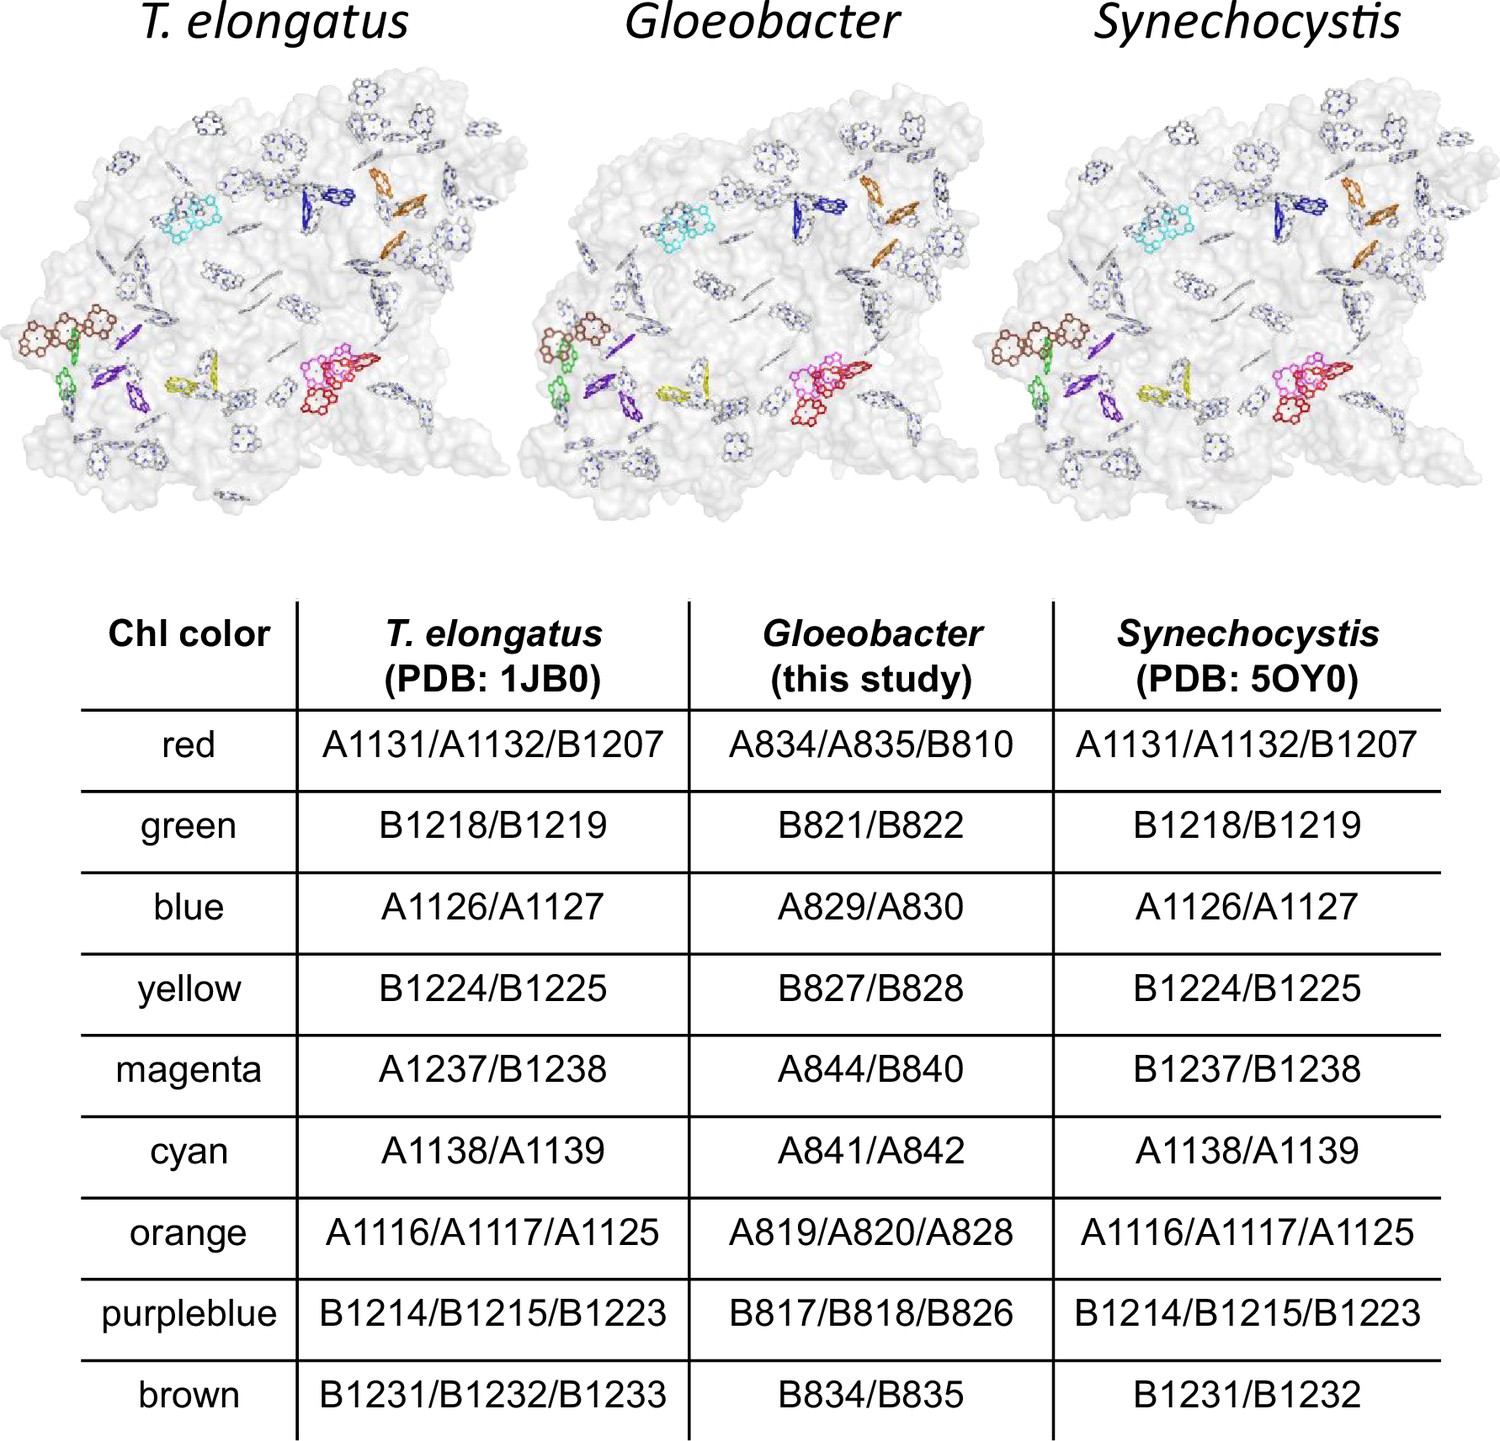
Possible low-energy Chls proposed by Schlodder et al., 2007.
Nine groups of Chls proposed as low-energy Chls were colored differently in the PSI structures of three cyanobacteria, whereas the other Chls and protein structures were colored gray. The nine groups were listed in the table, with the numbering of these Chls taken from each PDB data.
Appendix 1—figure 10
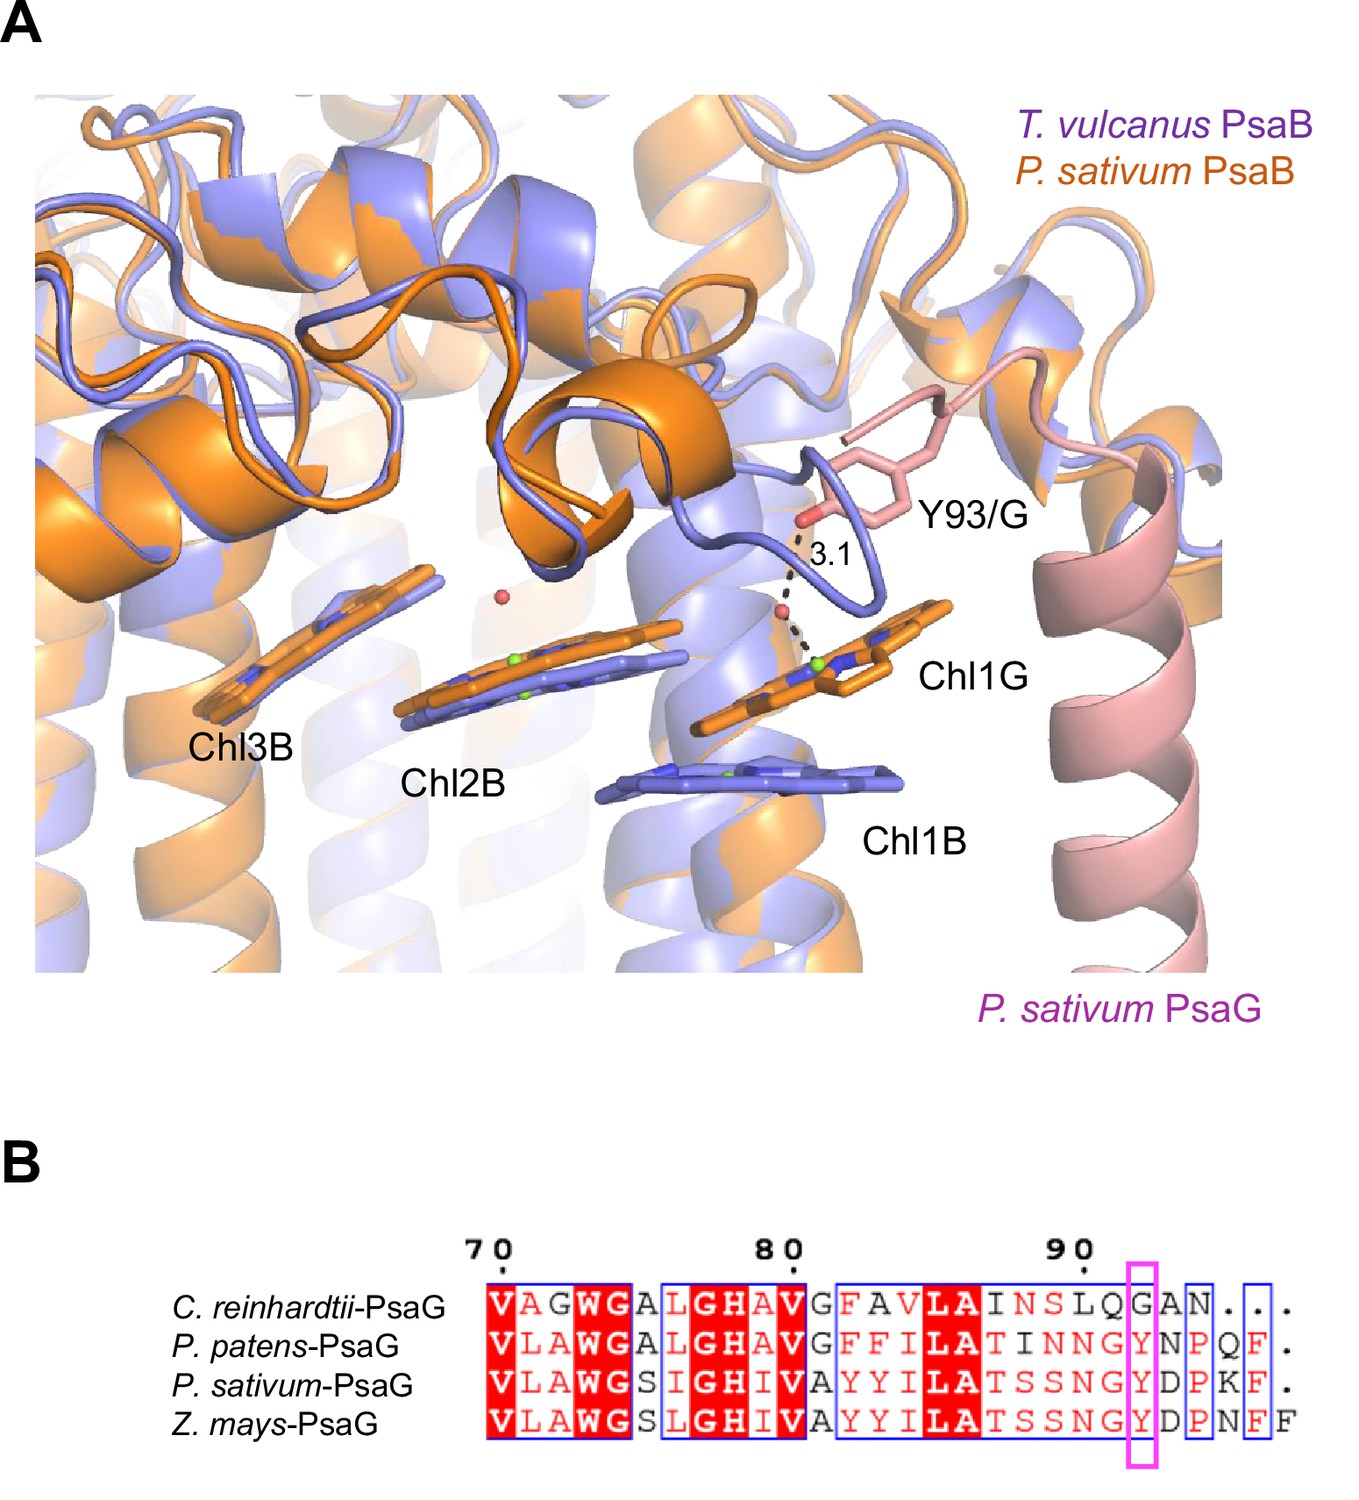
Structural comparisons of the Low2 site.
(A) Superposition of the Low2 site and its surrounding environment between the T. vulcanus PsaB (purple) (PDB: 6K33) and the P. sativum PsaB (orange) and PsaG (pink) (PDB: 4XK8). Tyr93 of the P. sativum PsaG involved in the binding of Chl1G is shown in a stick model. (B) Multiple sequence alignment of PsaG using ClustalW and ESPript. The species shown are Chlamydomonas reinhardtii, Physcomitrella patens, Pisum sativum, and Zea mays. The pink box displays the tyrosine residue involved in the binding of Chl1G.
Tables
Appendix 1—table 1
Cryo-EM data collection and structural analysis statistics.
| Complex | PSI trimer |
|---|---|
| PDB ID | 7F4V |
| EMDB ID | EMD-31455 |
| Data collection and processing | |
| Magnification | 60,000 |
| Voltage (kV) | 300 |
| Electron exposure (e−/Å) | 70.22 |
| Defocus range (μm) | −1.8 to −0.6 |
| Pixel size (Å) | 0.823 |
| Symmetry imposed | C3 |
| Initial particle number | 961,960 |
| Final particle number | 261,743 |
| Map resolution (Å) | 2.04 |
| FSC threshold | 0.143 |
| Refinement | |
| Initial Model used (PDB code) | Homology modeling |
| Model resolution (Å) | 2.01 |
| FSC threshold | 0.5 |
| Map sharpening B factor (Å2) | −58.0 |
| Model composition (trimer) | |
| Non-hydrogen atoms | 67,641 |
| Protein | 49,899 |
| Ligand | 17,340 |
| Water | 402 |
| B factors (Å2) | |
| Protein | 39.2 |
| Ligand | 40.5 |
| Water | 27.3 |
| R.m.s deviations | |
| Bond lengths (Å) | 0.025 |
| Bond angles (°) | 2.45 |
| Validation | |
| MolProbity score | 1.78 |
| Clashscore | 4.77 |
| Poor rotamers (%) | 2.78 |
| EMRinger score | 6.48 |
| Ramachandran plot | |
| Favored (%) | 96.8 |
| Allowed (%) | 3.11 |
| Disallowed (%) | 0.09 |
Appendix 1—table 2
Averaged Q-score in each subunit and cofactors in each monomer unit of the PSI core.
| Protein | Amino acid residues | Averaged Q-score | Chlorophylls | Carotenoids | Lipids | Others |
|---|---|---|---|---|---|---|
| PsaA | 11–782 | 0.85 | 43 Chl a 1 Chl a′ | 5 BCR | 2 LHG | 1 [4Fe-4S] cluster, 1 menaquinone-4 |
| PsaB | 3–727 | 0.87 | 41 Chl a | 7 BCR | 1 LMG 1 LHG | one menaquinone-4 |
| PsaC | 2–81 | 0.87 | - | - | - | 2 [4Fe-4S] cluster |
| PsaD | 11–143 | 0.81 | - | - | - | - |
| PsaE | 3–64 | 0.76 | - | - | - | - |
| PsaF | 31–181 | 0.76 | 1 Chl a | 1 BCR | - | - |
| PsaZ | 3–33 | 0.85 | - | 2 BCR | - | - |
| Unknown | 1–33 | 0.80 | - | 2 BCR | - | - |
| PsaL | 11–782 | 0.85 | 3 Chl a | 2 BCR | - | - |
| PsaM | 3–727 | 0.84 | - | 1 BCR | - | - |
| Total | 89 | 20 | 4 | 5 |
Additional files
-
Transparent reporting form
- https://cdn.elifesciences.org/articles/73990/elife-73990-transrepform1-v1.pdf
-
Source data 1
The raw data of SDS-PAGE.
- https://cdn.elifesciences.org/articles/73990/elife-73990-data1-v1.xlsx
Download links
A two-part list of links to download the article, or parts of the article, in various formats.
Downloads (link to download the article as PDF)
Open citations (links to open the citations from this article in various online reference manager services)
Cite this article (links to download the citations from this article in formats compatible with various reference manager tools)
Structural basis for the absence of low-energy chlorophylls in a photosystem I trimer from Gloeobacter violaceus
eLife 11:e73990.
https://doi.org/10.7554/eLife.73990


