In vivo generation of bone marrow from embryonic stem cells in interspecies chimeras
- Center for Lung Regenerative Medicine, Perinatal Institute, Cincinnati Children’s Hospital Medical Center, United States
- Division of Experimental Hematology and Cancer Biology, Cincinnati Children's Hospital Medical Center, United States
- Division of Immunobiology, Cincinnati Children's Hospital Medical Center, United States
- Department of Pediatrics, College of Medicine of the University of Cincinnati, United States
- Division of Pulmonary Biology, Cincinnati Children’s Hospital Medical Center, United States
- Division of Developmental Biology, Cincinnati Children’s Hospital Medical Center, United States
Figures
Figure 1 with 1 supplement
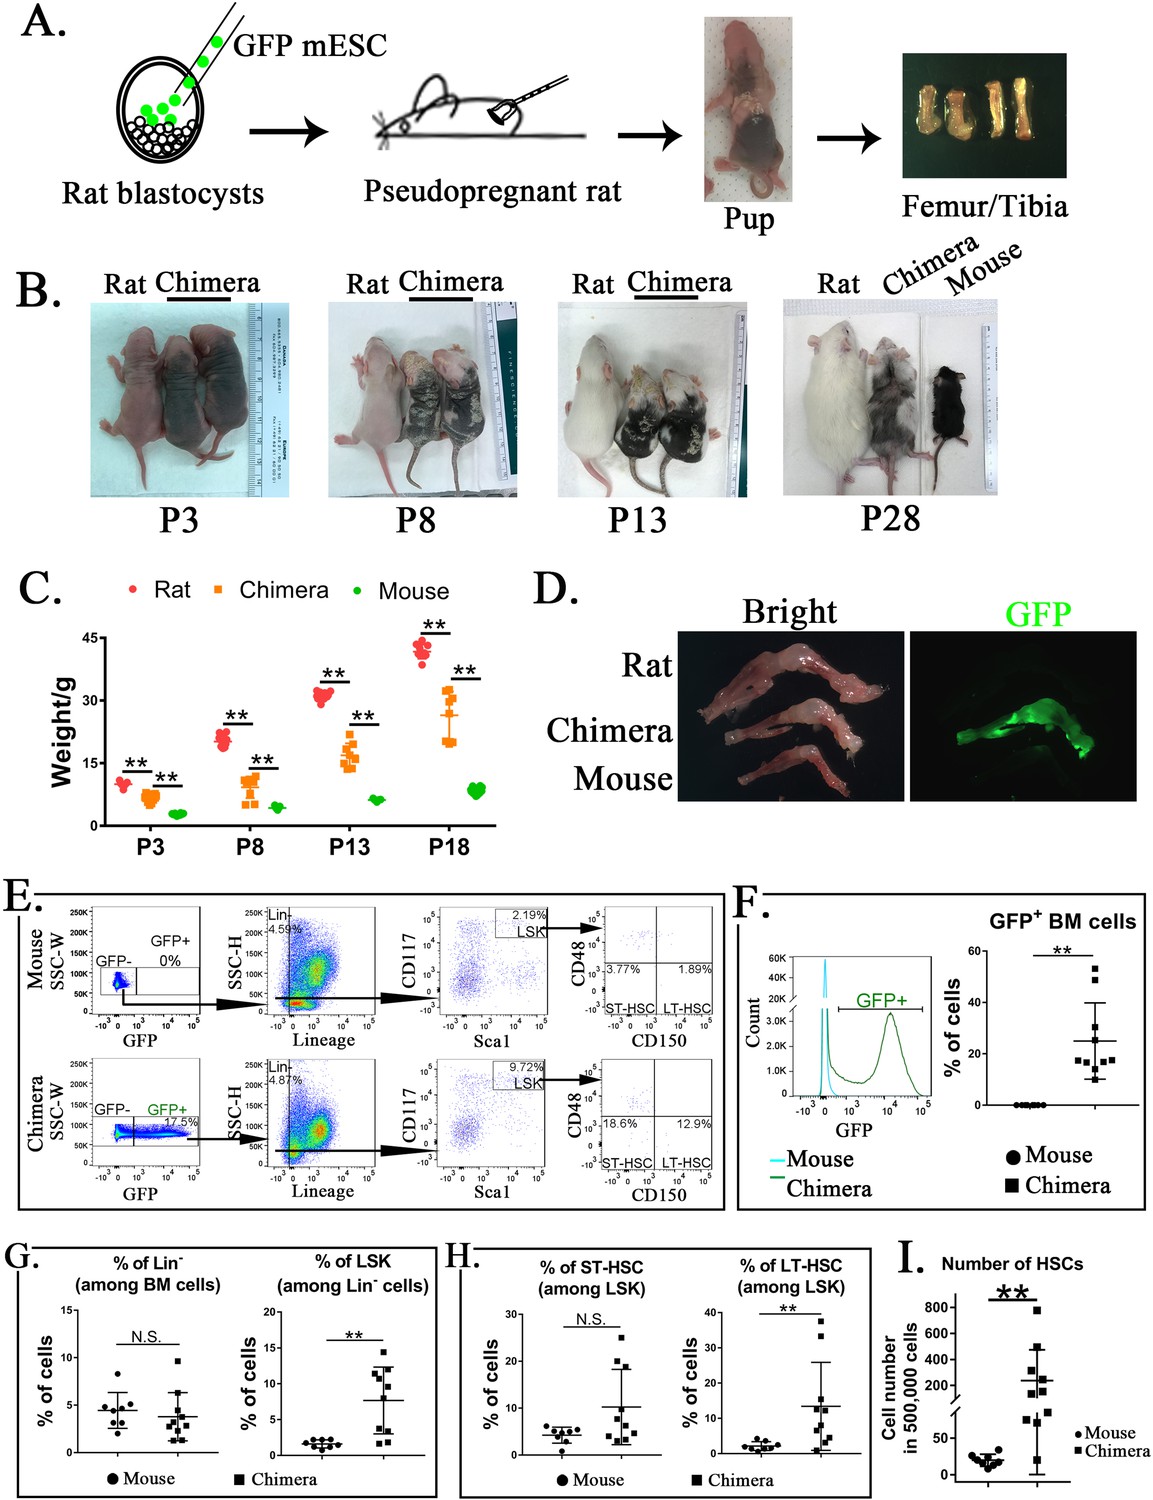
Mouse embryonic stem cells (ESCs) contribute to hematopoietic stem cells (HSCs) in the bone marrow (BM) of mouse–rat chimeras.
(A) Schematic shows blastocyst complementation of rat embryos with mouse ESCs to generate interspecies mouse–rat chimeras. GFP-labeled mouse ESCs (mESCs) were injected into rat blastocysts, which were implanted into surrogate rat females to undergo embryonic development in utero. Femur and tibia bones of the chimeras were used to obtain BM cells. (B) Photographs of mouse–rat chimeras are taken at postnatal (P) days P3, P8, P13, and P28. Mixed black and white pigmentation distinguishes the mouse–rat chimeras from juvenile rats and mice. (C) Weights of mouse–rat chimeras are shown at different time points and compared to rats and mice of similar ages. Chimeras are significantly smaller than rats, but larger than mice (n = 7–18 in each group), **p < 0.01, see also Source data 1. (D) Fluorescence microscopy shows GFP and bright-field images of femur and tibia bones from P4 rat, mouse, and mouse–rat chimera. (E) Fluorescence-activated cell sorting (FACS) analysis of mouse ESC-derived (GFP-positive) cells in the BM of P10 mouse–rat chimeras. Lineage-negative (Lin−), LSK, short-term HSC (ST-HSC), and long-term HSC (LT-HSC) cell subsets were identified in the BM of mouse–rat chimeras (n = 10) and control mice (n = 8), see also Figure 1—figure supplement 1A, B. (F) Histograms show GFP fluorescence of BM cells from chimeras and control mice. (G–H) FACS analysis shows increased percentages of mouse LSKs and LT-HSCs in BM of mouse–rat chimeras (n = 10) compared to control mice (n = 8), **p < 0.01, N.S. indicates no significance. (I) FACS analysis shows increased numbers of HSCs (ST-HSCs + LT-HSCs) in BM of mouse rat chimeras (n = 10) compared to control mice (n = 8), **p < 0.01.
Figure 1—figure supplement 1
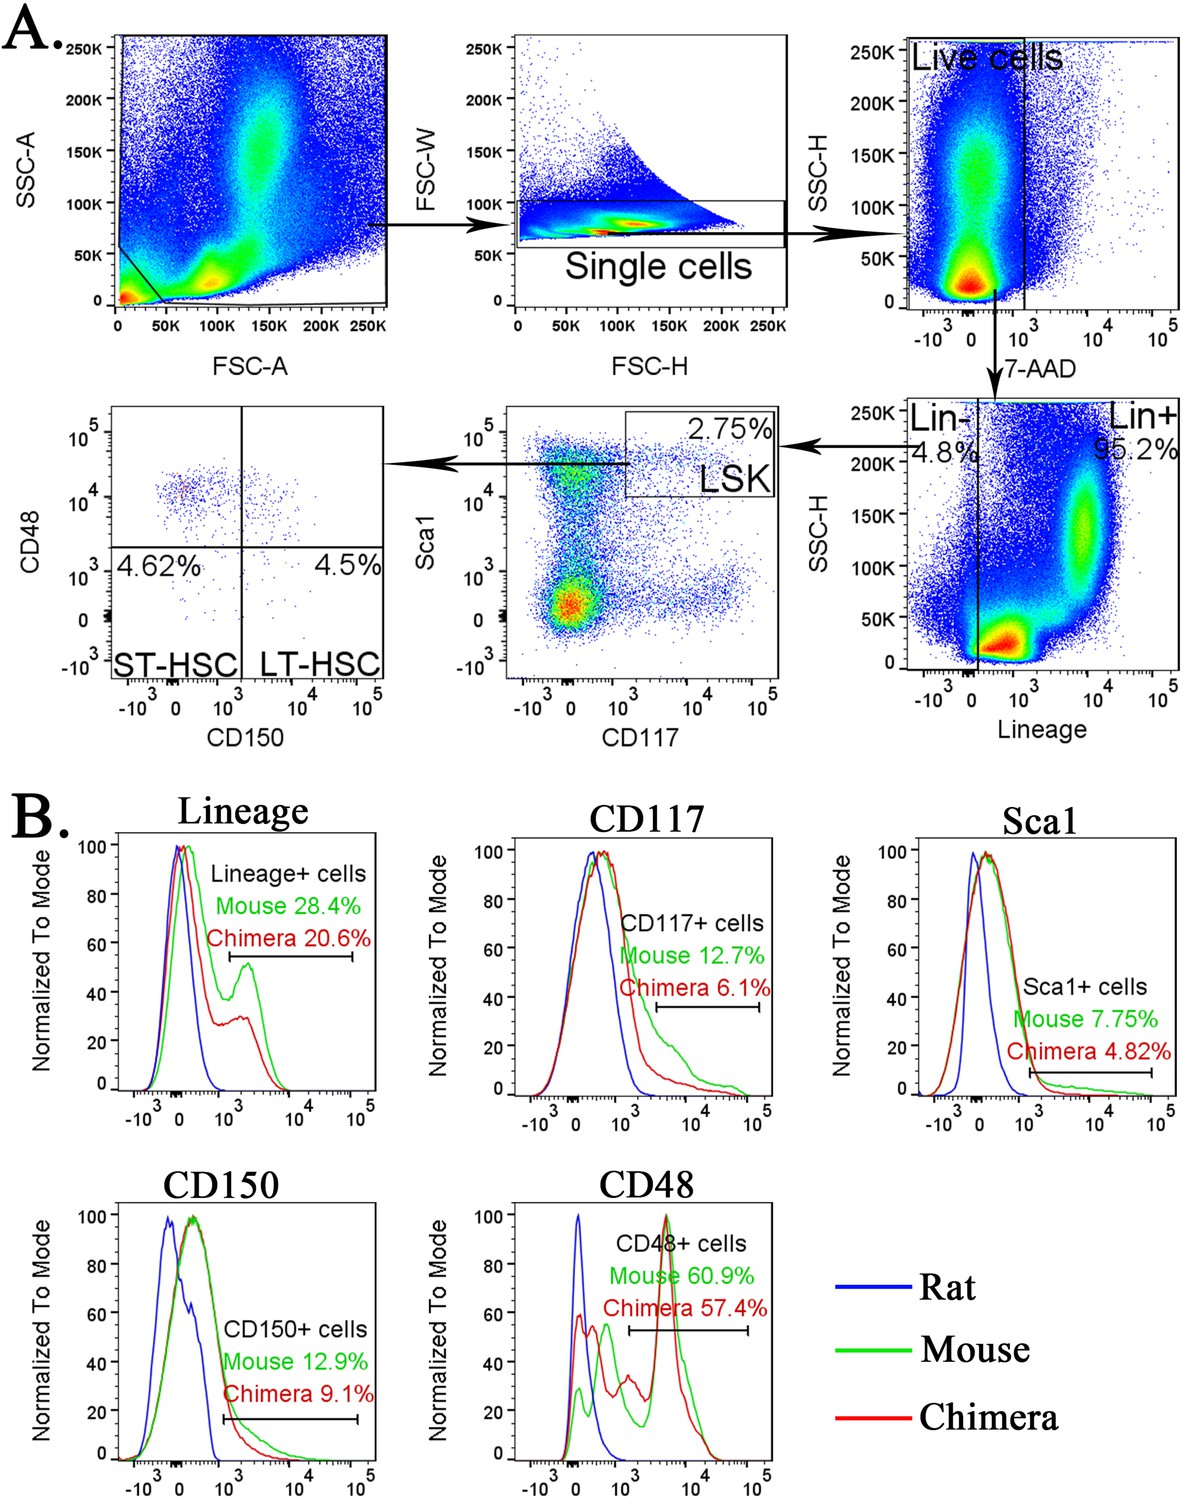
Identification of lineage− cells, LSKs, short-term HSCs (ST-HSCs), and long-term HSCs (LT-HSCs) in the bone marrow (BM).
(A) Fluorescence-activated cell sorting (FACS) gating strategy shows the identification of lineage− (Lin−) cells, LSKs, ST-HSCs, and LT-HSCs in the BM of wild-type (wt) mice. (B) Histograms show specificity of antibodies against Lineage antigens, CD117 (c-KIT), Sca1, CD150, and CD48. To identify mouse Lin− cells, LSKs, ST-HSCs, and LT-HSCs, cell suspensions from BM of wt mouse, mouse–rat chimera and wt rat were compared to determine the gating.
Figure 2 with 7 supplements

Single-cell RNAseq analysis identifies embryonic stem cell (ESC)-derived hematopoietic cell lineages in the bone marrow (BM) of mouse–rat chimeras.
(A) Parallel dimension UMAP plots show identical hematopoietic cell clusters in the BM of mouse–mouse chimera (5308 cells) and mouse–rat chimera (6018 cells). ESC-derived BM cells were obtained from the BM of P10 chimeras using fluorescence-activated cell sorting (FACS) for GFP+ cells, see Figure 2—figure supplement 1A, B. Cells from n = 3 animals per group were pooled together prior to FACS sorting. Cell clusters were identified from single-cell RNAseq datasets using Uniform Manifold Approximation and Projection (UMAP) method, see also Figure 2—figure supplements 2A, B and 3. Hematopoietic stem cells (HSCs) were identified by coexpression of Kit, Ly6a (Sca1), and Flt3 (Flk2), see Figure 2—figure supplement 4. Heatmaps and linear regression analysis identified significant similarities in gene expression signatures of lymphoid and myeloid progenitor cells obtained from mouse–rat (R) and mouse–mouse chimeras (M), see Figure 2—figure supplement 5A, B and Figure 2—figure supplement 6A, B. Gene expression profiles of ESC-derived HSCs and lymphoid-primed multipotent progenitor cells are shown in Figure 2—figure supplement 7A, B. (B) Table shows percentages of cells in individual clusters in mouse–mouse and mouse–rat chimeras. Blue color indicates decreased percentages of cells in mouse–rat chimeras compared to mouse–mouse chimeras. Red color indicates increased percentages of cells in mouse–rat chimeras.
Figure 2—figure supplement 1
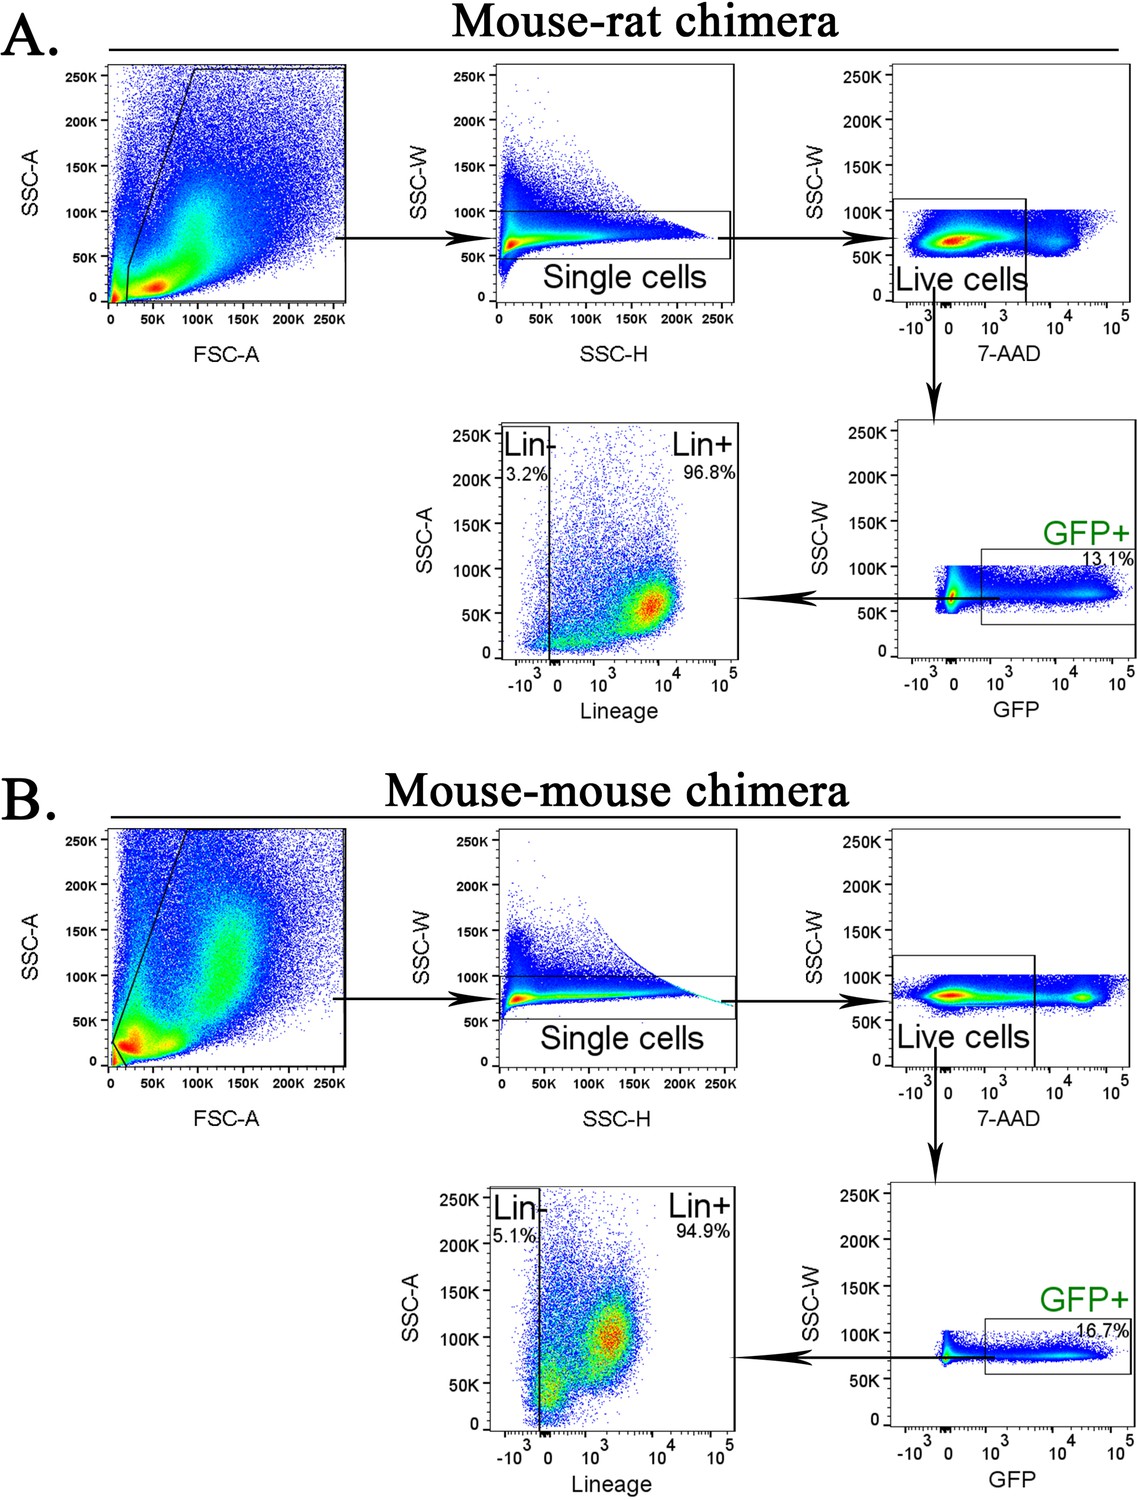
Purification of mouse embryonic stem cell (ESC)-derived cells from bone marrow (BM) of mouse–rat and mouse–mouse chimeras before scRNAseq.
Fluorescence-activated cell sorting (FACS) gating strategy shows identification of ESC-derived Lin− and Lin+ cell subsets in the BM of mouse–rat (A) and mouse–mouse chimeras (B). Chimeric BM cells were harvested at P10.
Figure 2—figure supplement 2
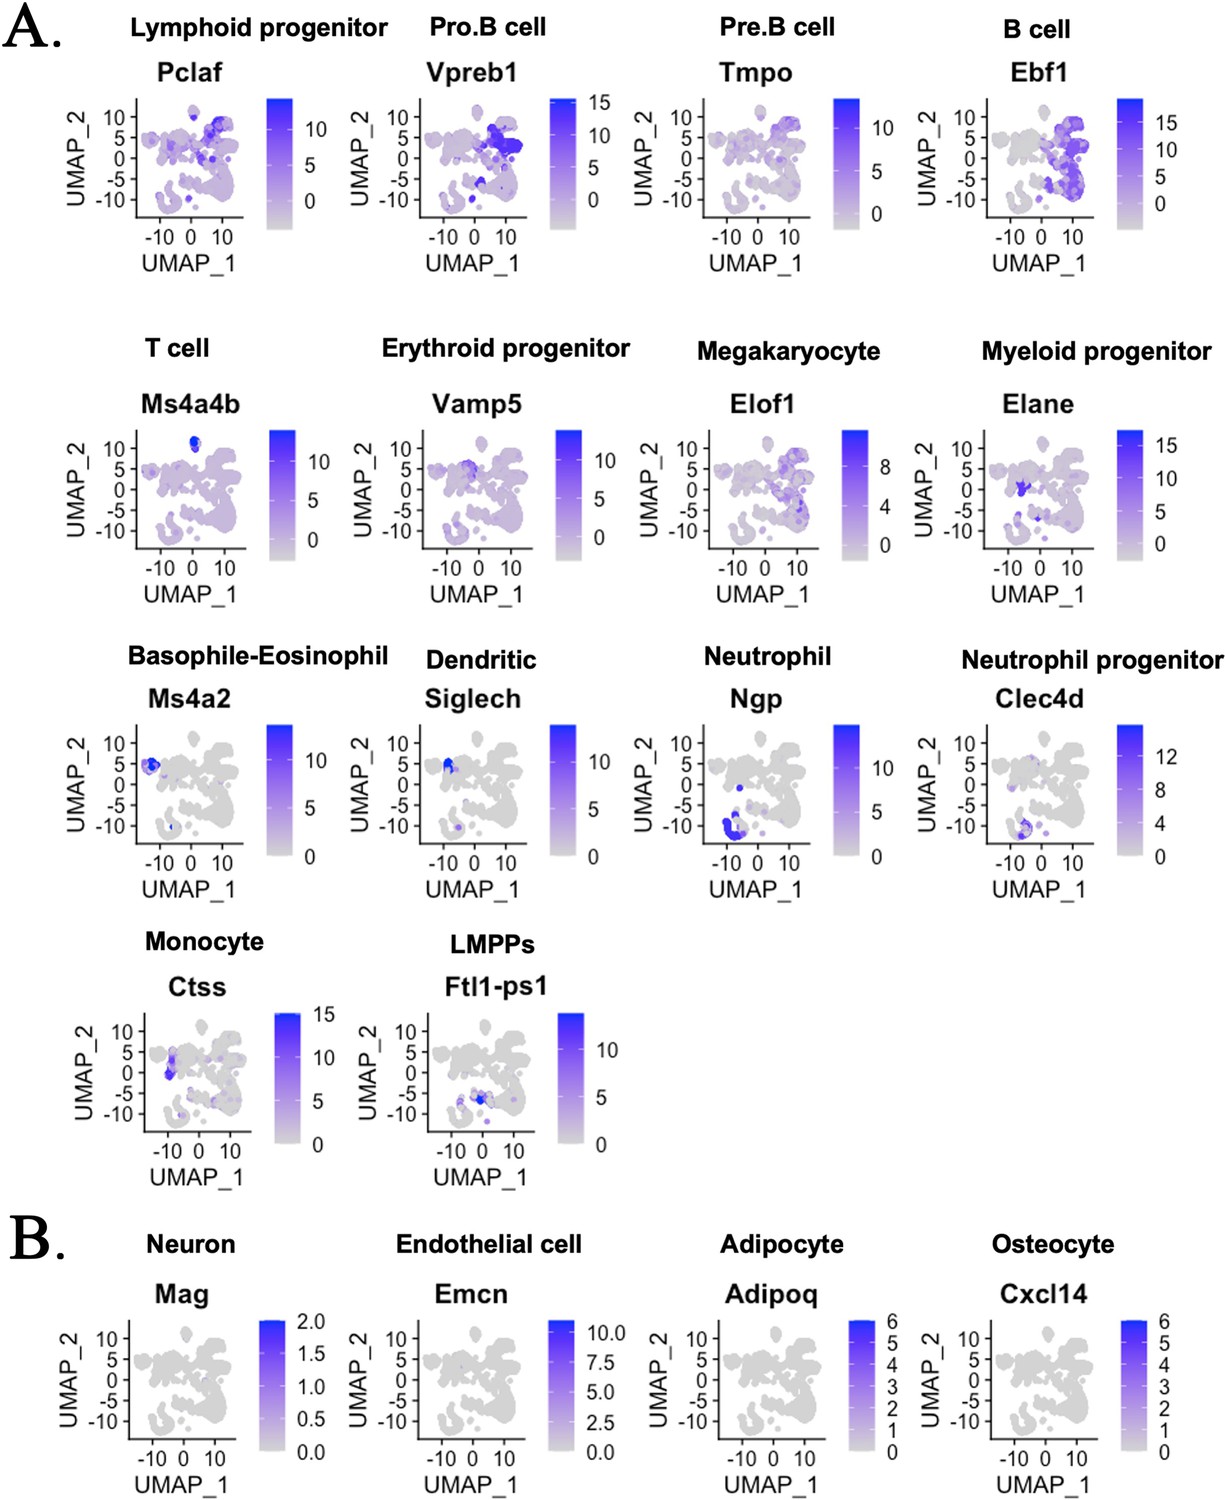
Single-cell RNAseq analysis identifies hematopoietic cell subsets in the bone marrow (BM) of mouse–rat chimeras.
(A) The integrated projection of embryonic stem cell (ESC)-derived BM hematopoietic cells from mouse–rat and mouse–mouse (control) chimeras. Cells were obtained from the BM of P10 chimeras. Cell clusters were identified using Uniform Manifold Approximation and Projection (UMAP) method. Expression of marker genes shows different hematopoietic cell clusters in the BM. (B) Genes enriched in neurons, endothelial cells, adipocytes, and osteocytes are not detected in cell clusters from chimeric BM.
Figure 2—figure supplement 3
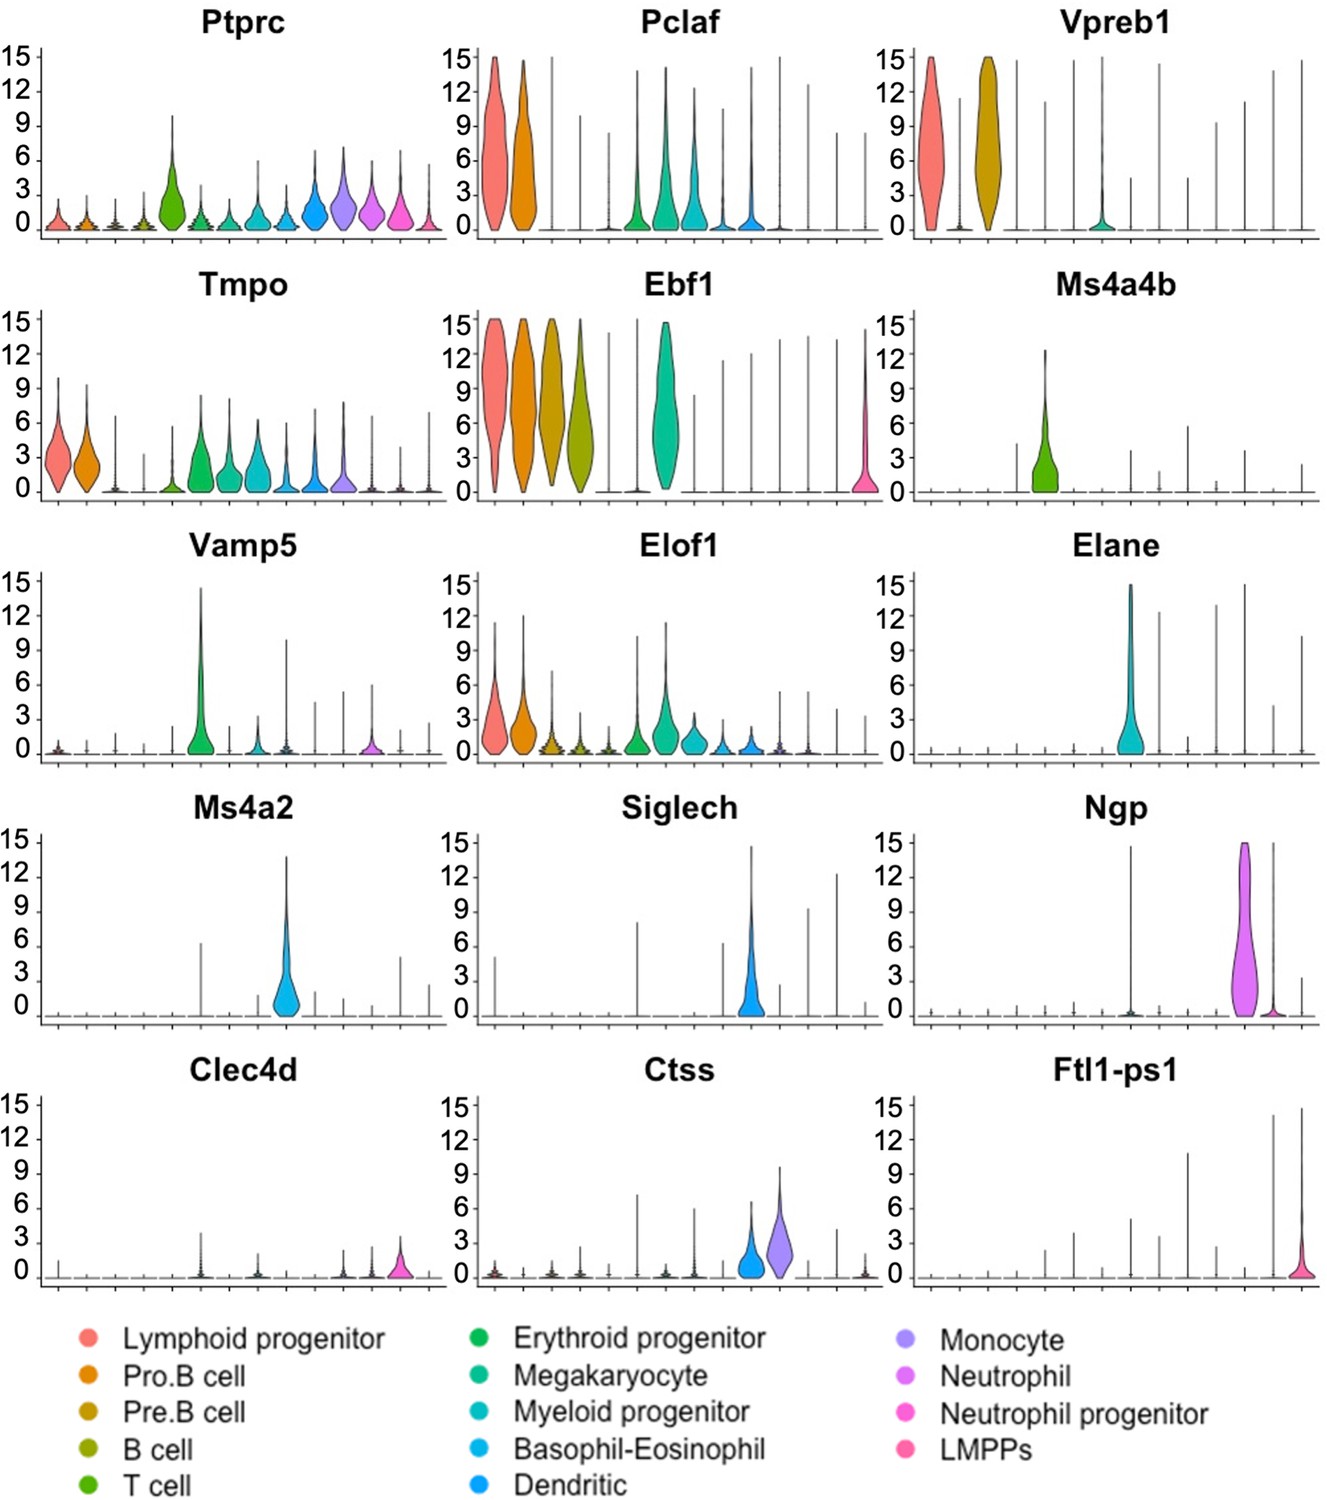
Violin plots confirm expression of hematopoietic marker genes in bone marrow (BM) cell clusters.
Single-cell RNAseq was performed using embryonic stem cell (ESC)-derived BM hematopoietic cells from mouse–rat and mouse–mouse P10 chimeras. Cell clusters were identified using UMAP. Violin plots show expression of selected hematopoietic genes in BM cell clusters. Ptprc (Cd45) mRNA is expressed in all hematopoietic cell types.
Figure 2—figure supplement 4
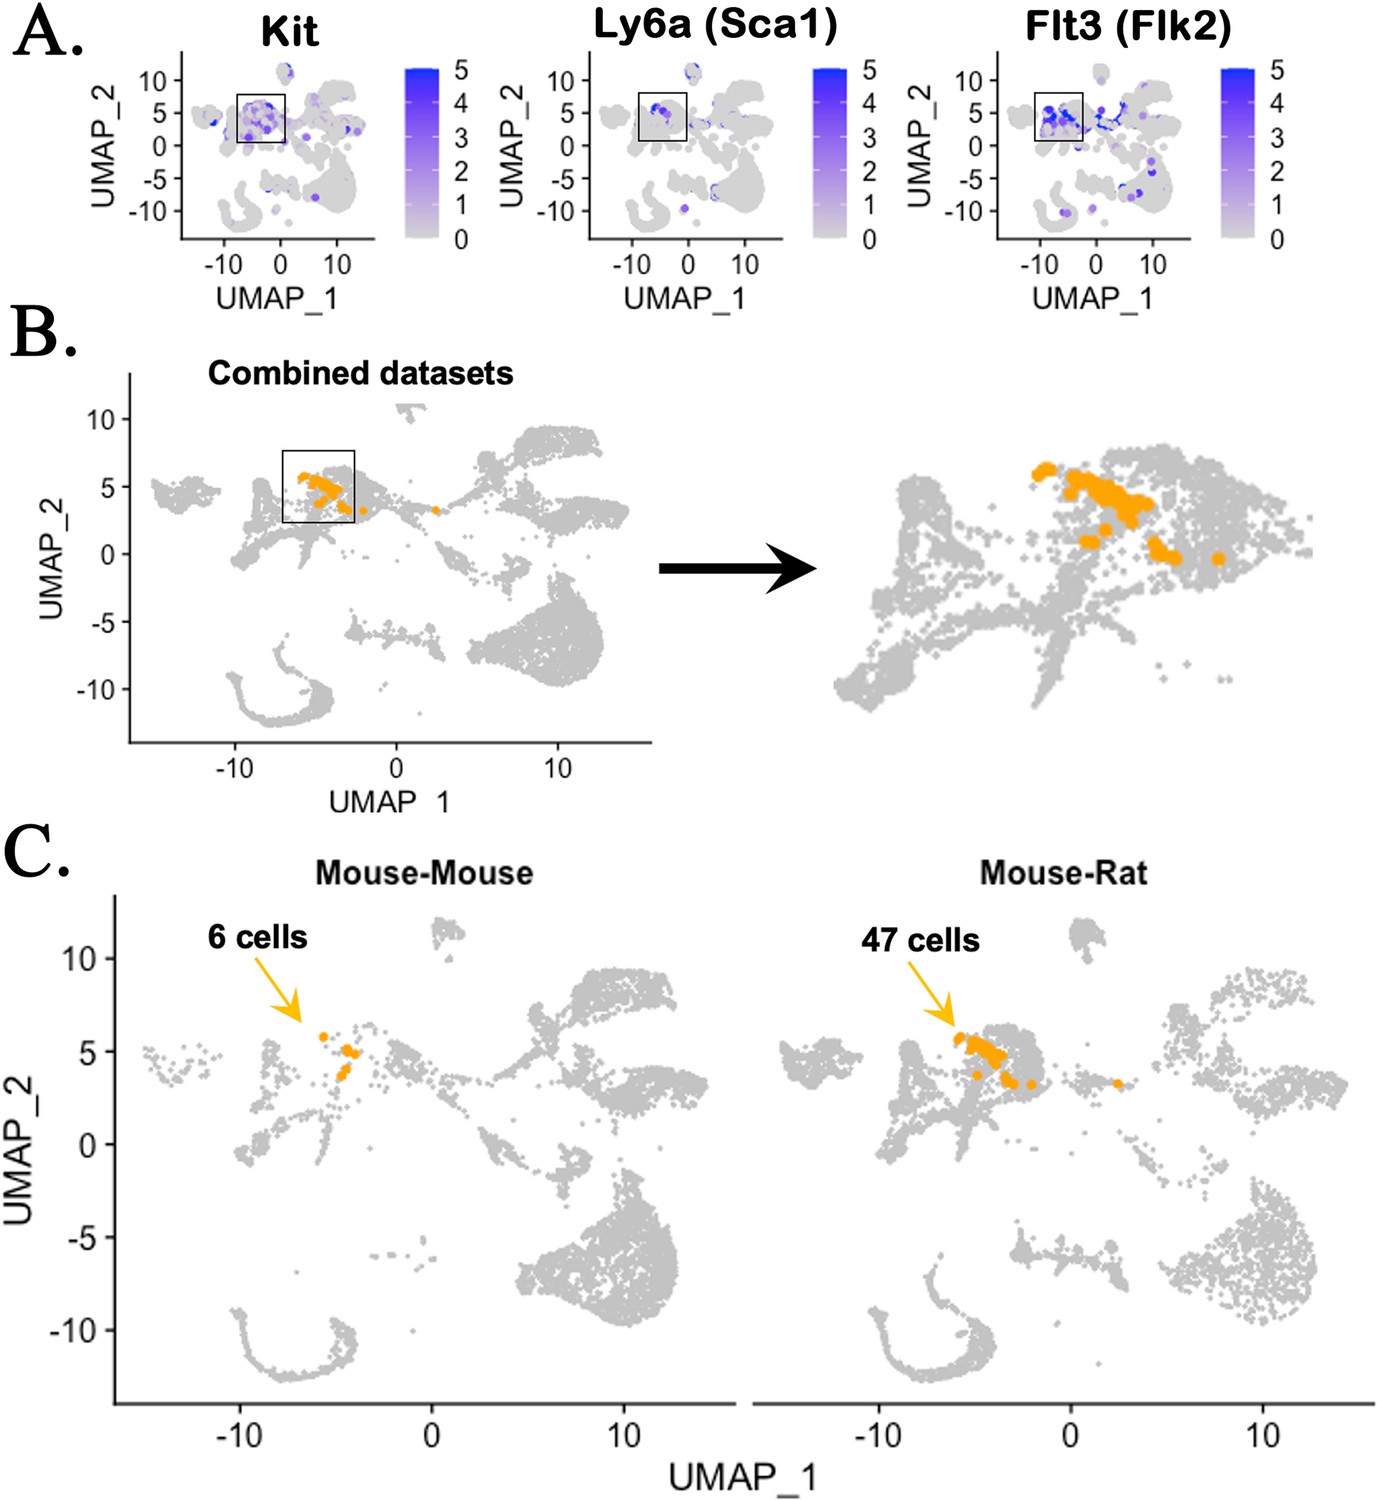
Single-cell RNAseq analysis identifies genes expressed in hematopoietic stem cells (HSCs) in chimeric bone marrow (BM).
(A) UMAP analysis shows expression of genes enriched in HSCs, including Kit, Ly6a (Sca-1), and Flt3 (Flk2), using the integrated projection of embryonic stem cell (ESC)-derived BM hematopoietic cells from mouse–rat and mouse–mouse (control) chimeras. Cells were obtained from the BM of P10 chimeras. (B) Kit+Ly6a+Flt3+ triple positive cells are identified in myeloid and erythroid progenitor cell clusters in the combined scRNAseq dataset. (C) Separate views of triple positive cells in individual scRNAseq datasets show increased number of HSCs in mouse–rat chimera compared to mouse–mouse chimera.
Figure 2—figure supplement 5
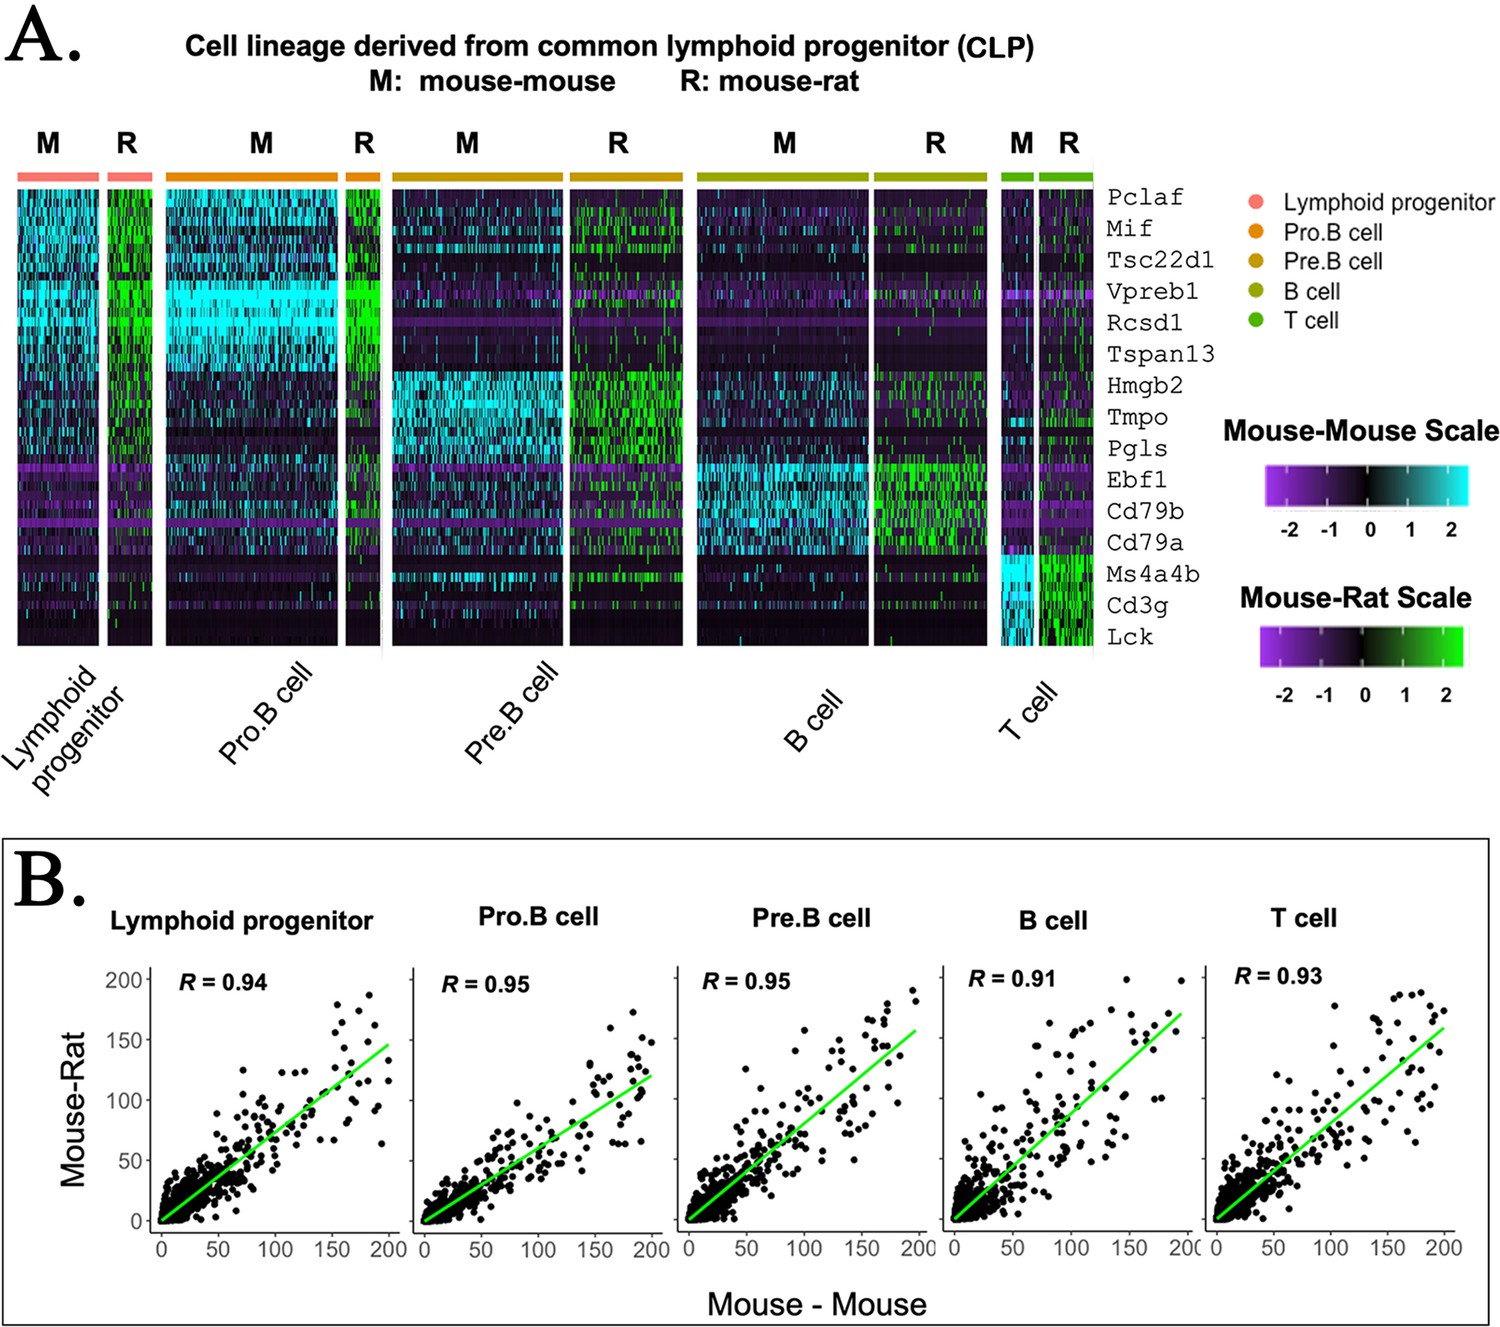
Embryonic stem cell (ESC)-derived lymphoid cell types in mouse–rat and mouse–mouse chimeras exhibit identical gene expression profiles.
(A) Heatmap shows significant similarities in gene expression signatures of lymphoid progenitor cells obtained from mouse–rat (R) and mouse–mouse chimeras (M). Single-cell RNAseq was performed using bone marrow (BM) cell suspensions that were FACS-sorted for GFP to identify ESC-derived cells. (B) Linear regression analysis shows the correlation index (R) between gene expression profiles in individual lymphoid cell clusters from mouse–rat and mouse–mouse chimeras.
Figure 2—figure supplement 6
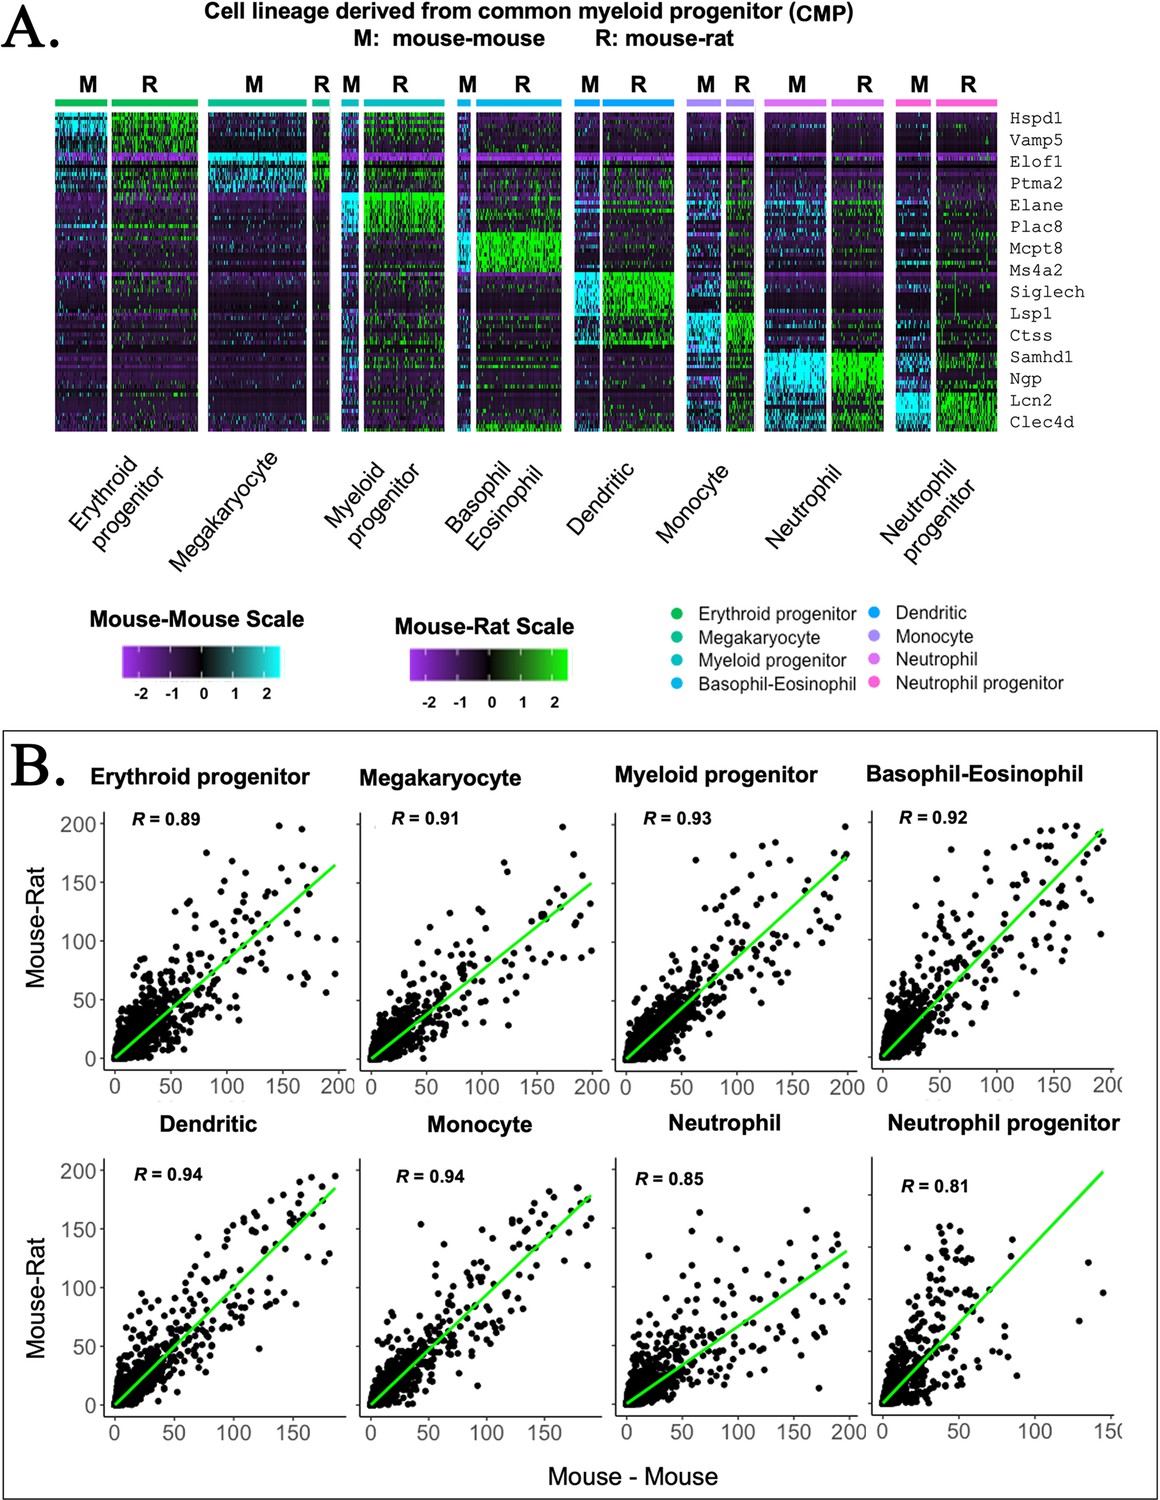
Embryonic stem cell (ESC)-derived myeloid cell types in mouse–rat and mouse–mouse chimeras exhibit similar gene expression profiles.
(A) Heatmap shows significant similarities in gene expression signatures of myeloid progenitor cells, megakaryocytes, erythroid progenitor cells, basophils, eosinophils, neutrophils, dendritic cells, monocytes, and neutrophil progenitor cells obtained from mouse–rat (R) and mouse–mouse chimeras (M). Single-cell RNAseq was performed using bone marrow (BM) cell suspensions that were FACS-sorted for GFP to identify ESC-derived cells. (B) Linear regression analysis shows the correlation index (R) between gene expression profiles in individual myeloid cell clusters from mouse–rat and mouse–mouse chimeras.
Figure 2—figure supplement 7
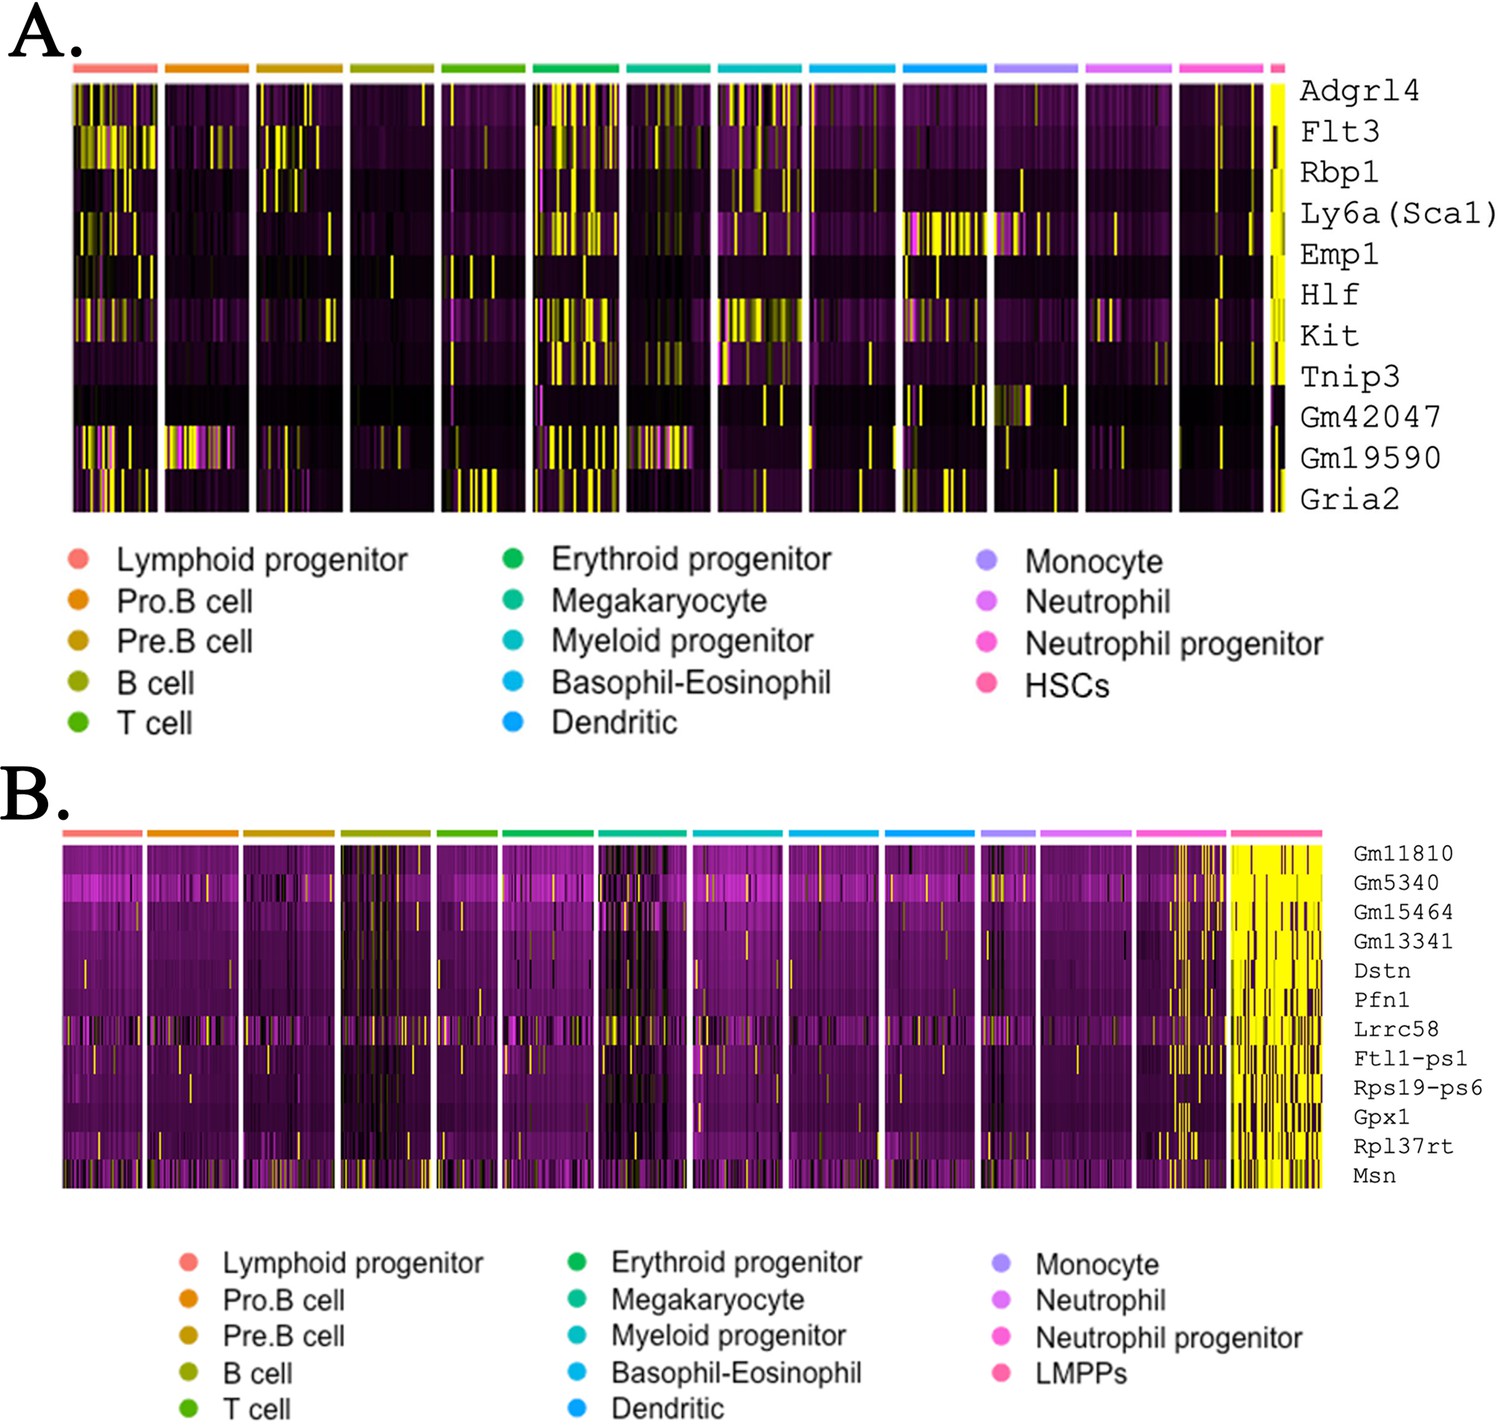
Heatmaps identify gene expression profile of embryonic stem cell (ESC)-derived hematopoietic stem cells (HSCs) and lymphoid-primed multipotent progenitor (LMPP) cells from mouse–rat and mouse–mouse chimeras.
Combined analysis of ESC-derived bone marrow (BM) hematopoietic cells from mouse–rat and mouse–mouse chimeras compares gene expression signature of HSCs (A) and LMPP cells (B) with gene expression signatures of other myeloid and lymphoid BM cells. Single-cell RNAseq was performed using BM cell suspensions from P10 chimeras. ESC-derived cells were purified using fluorescence-activated cell sorting (FACS).
Figure 3 with 1 supplement
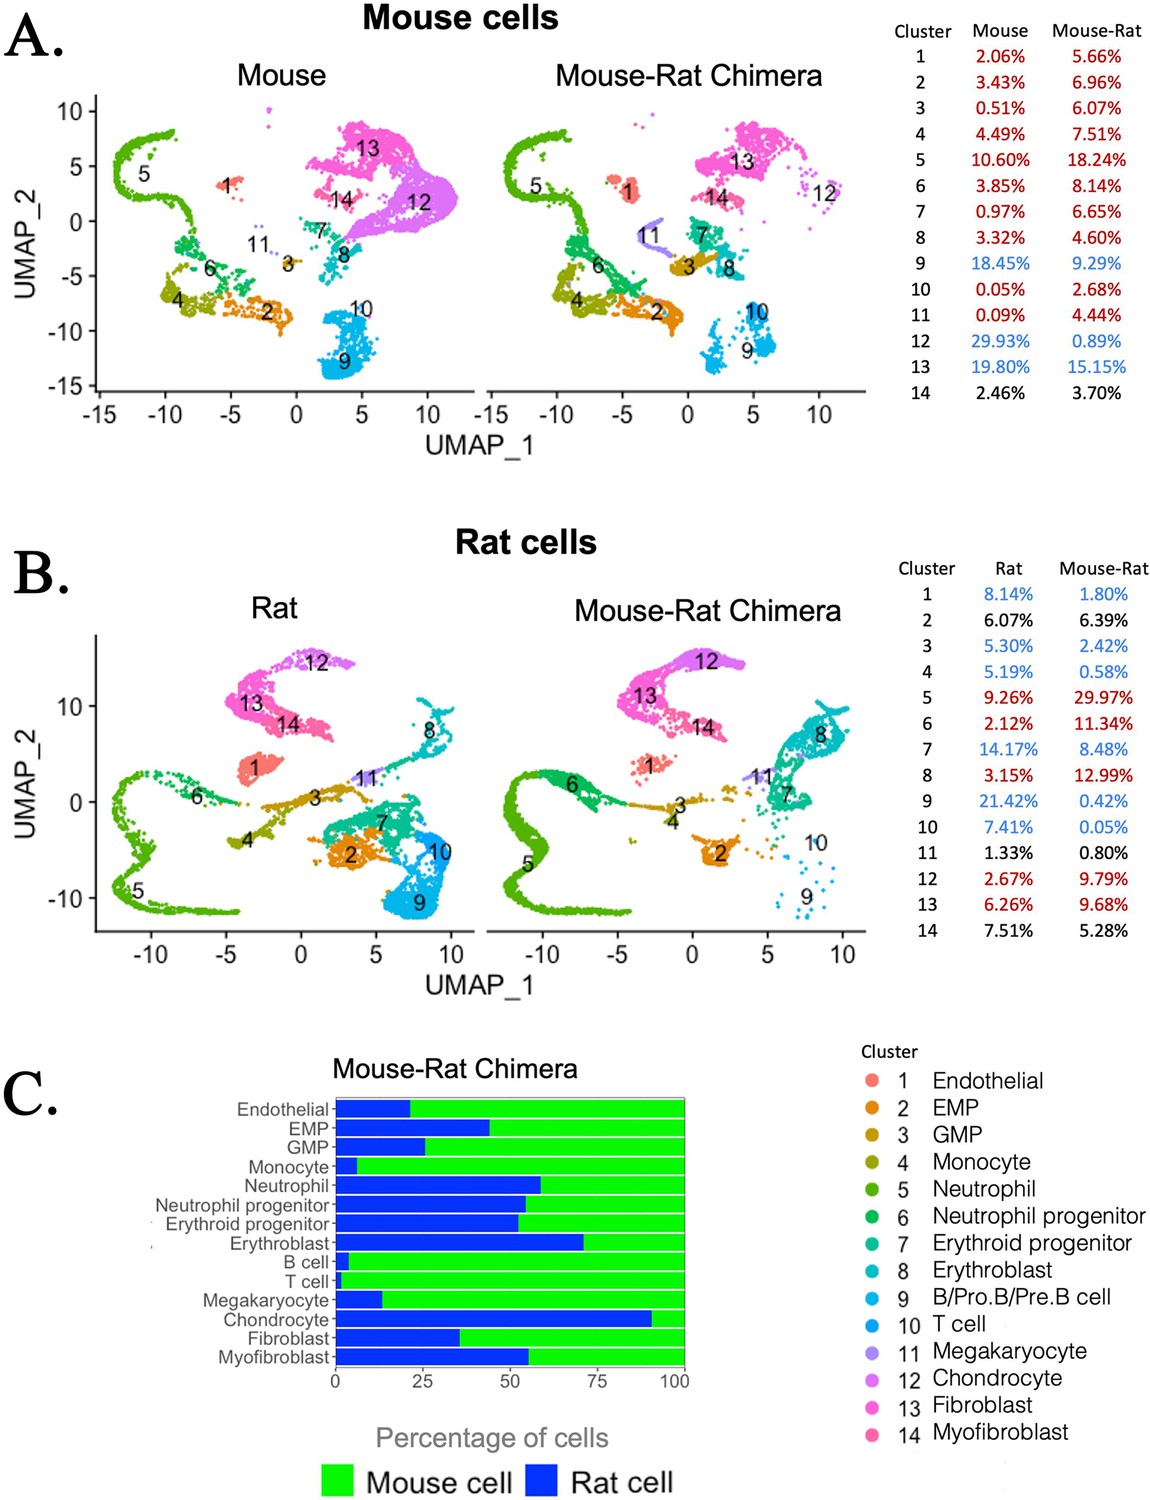
Single-cell RNAseq analysis shows increased percentages of embryonic stem cell (ESC)-derived hematopoietic progenitors and endothelial cells but decreased percentages of ESC-derived chondrocytes in the bone marrow (BM) of mouse–rat chimeras.
(A, B) Parallel dimension UMAP plots show identical hematopoietic and stromal cell clusters in the BM of P5 mice, rats, and mouse–rat chimeras. BM cells were obtained from P5 animals using an enzymatic digestion (n = 5 animals per group) and pooled prior to single-cell RNAseq. Cell clusters were identified from single-cell RNAseq datasets using Uniform Manifold Approximation and Projection (UMAP) method. Red color in the tables indicates increased percentages of cells in mouse–rat chimeras compared to either mice or rats of the same age. Blue color indicates decreased percentages of cells in mouse–rat chimeras. Gene expression signatures of mouse and rat hematopoietic and stromal cells are shown in Figure 3—figure supplement 1A–D. (C) A bar graph shows relative percentages of ESC-derived mouse cells (green) and endogenous rat cells (blue) in the BM of P5 mouse–rat chimeras.
Figure 3—figure supplement 1
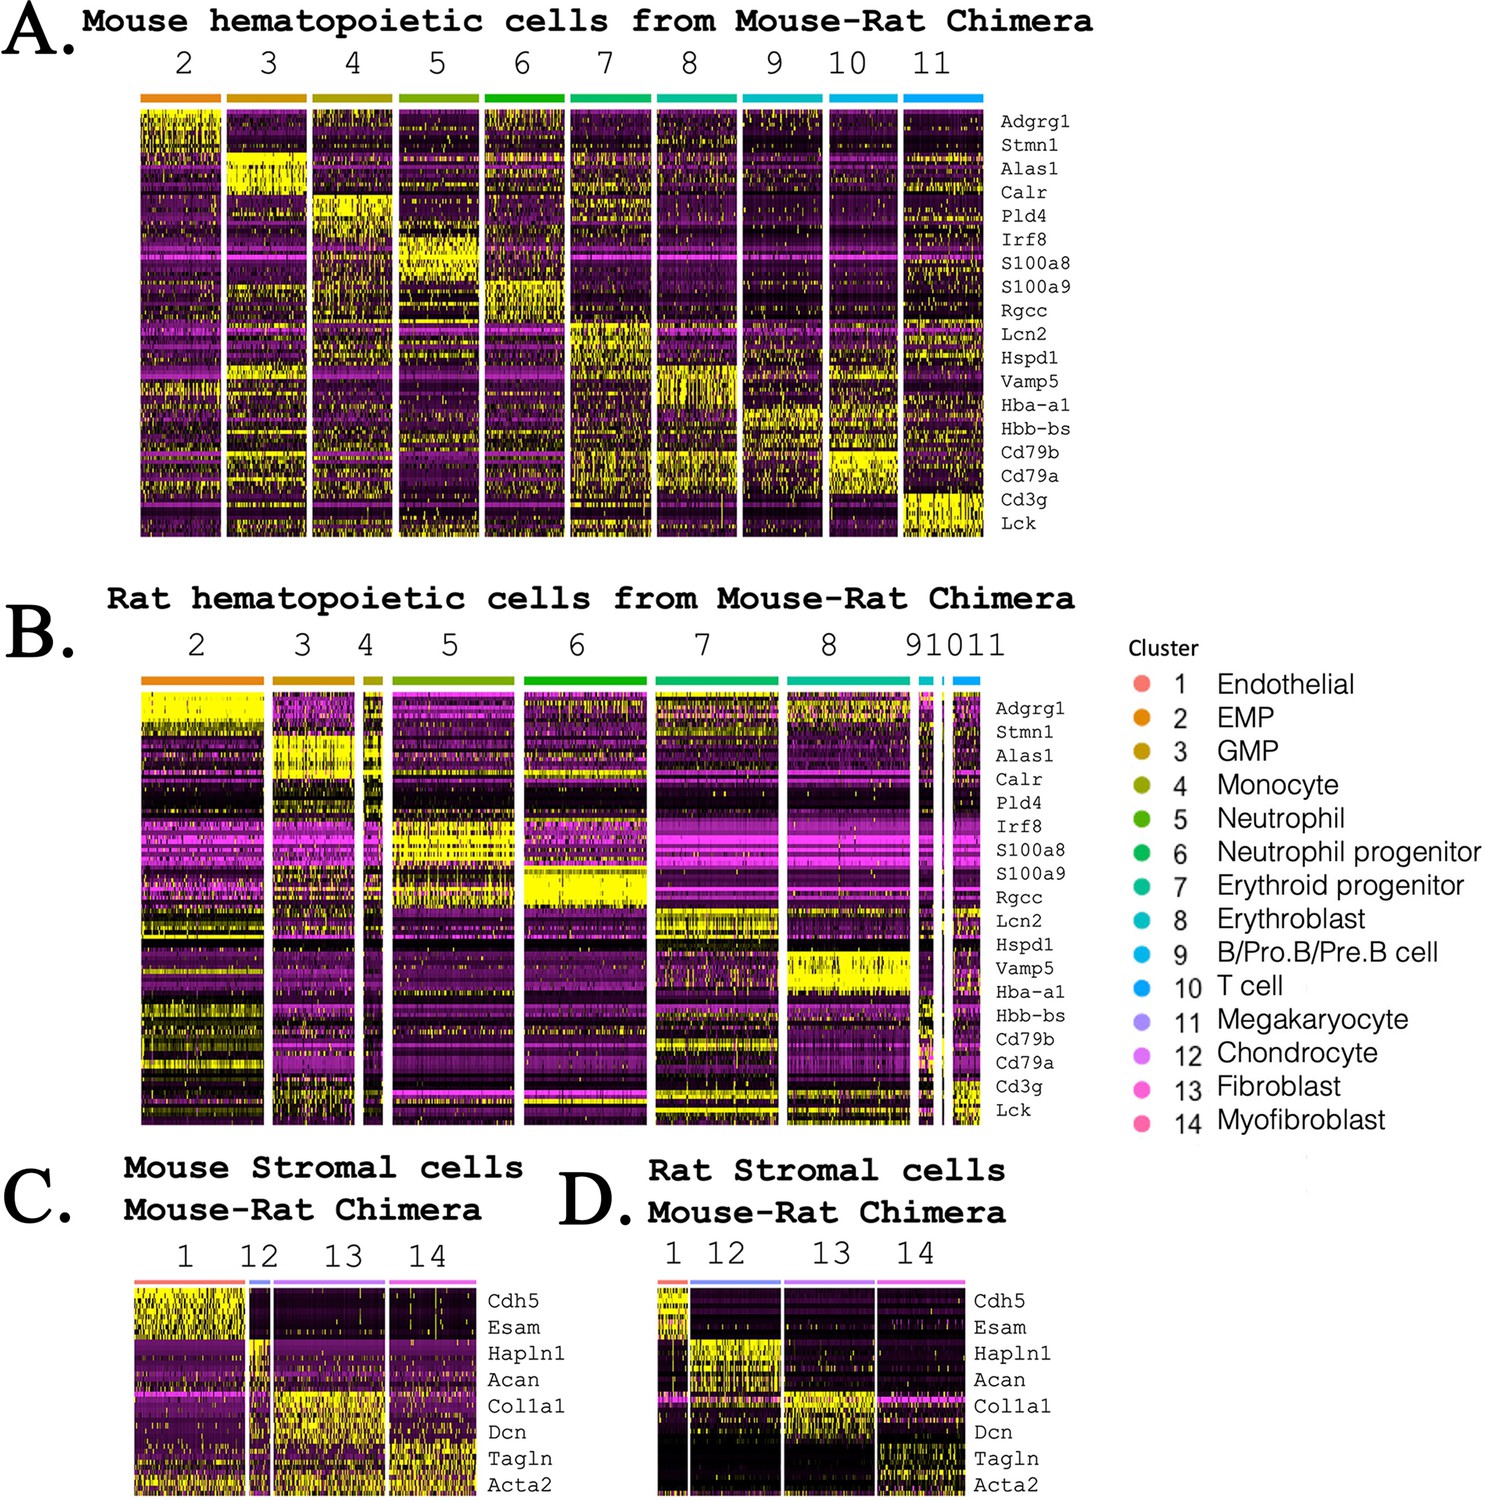
Heatmaps compare gene expression profile in mouse and rat hematopoietic and stromal cells that form bone marrow (BM) in mouse–rat chimeras.
(A, B) Heatmaps show gene expression signatures of embryonic stem cell (ESC)-derived (mouse) and endogenous (rat) hematopoietic cells that were obtained from BM of mouse–rat chimeras. Single-cell RNAseq was performed using BM cells from P5 chimeras. GFP+ and GFP− cells were purified using fluorescence-activated cell sorting (FACS). (C, D) Heatmaps show gene expression signatures of mouse and rat stromal BM cells that were obtained from P5 mouse–rat chimeras.
Figure 4 with 2 supplements

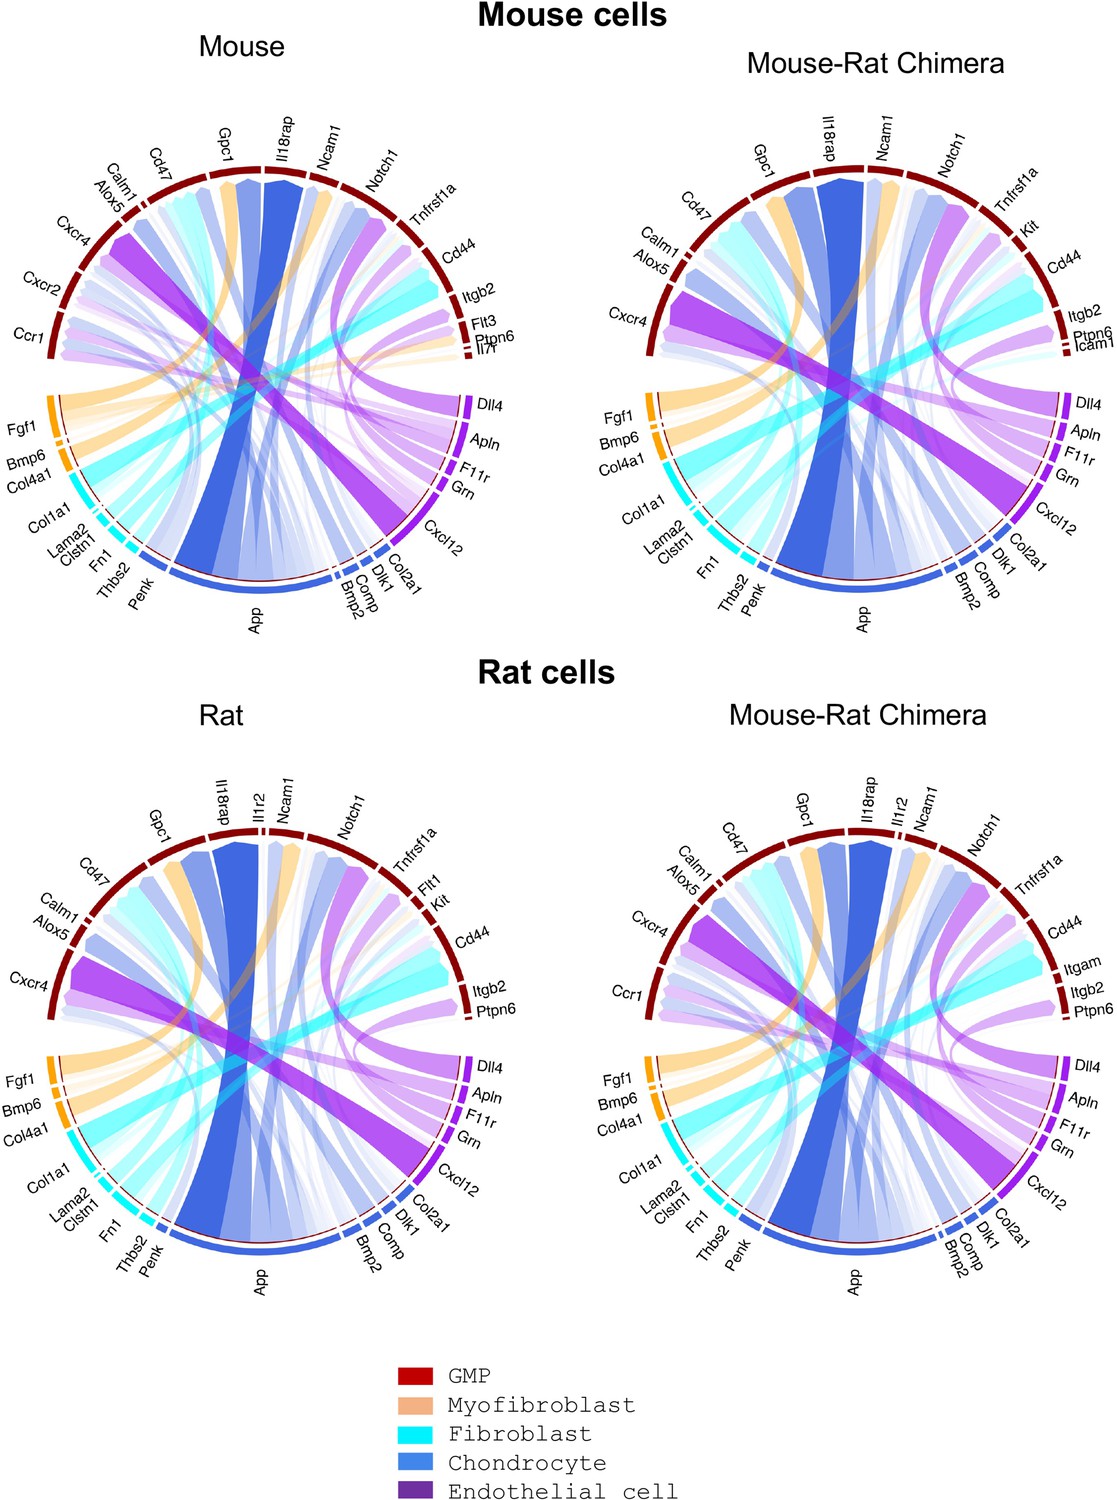
Single-cell RNAseq analysis shows remarkable similarities in major receptor–ligand interactions between erythro-myeloid progenitors and stromal cells of mouse and rat origins.
Bone marrow (BM) cells were obtained from P5 animals using an enzymatic digestion (n = 5 animals per group). Single-cell RNAseq was performed to identify BM stromal and erythro-myeloid progenitor cells (EMPs) based on gene expression signatures. The R package NicheNet was used to analyze the expression of ligands and receptors to identify intercellular communication patterns between EMPs and BM stromal cells. Receptor–ligand interactions between stromal and granulocyte–monocyte progenitor (GMP) cells are shown in Figure 4—figure supplement 1. Violin plots were used to identify expression of ligands and their receptors in hematopoietic and stromal BM cells, see Figure 4—figure supplement 2.
Figure 4—figure supplement 1
Single-cell RNAseq analysis shows similar receptor–ligand interactions between stromal and granulocyte–monocyte progenitor (GMP) cells.
Single-cell RNAseq was performed using bone marrow (BM) cells from P5 mice, rats, and mouse–rat chimeras. Stromal and GMP cells were identified using gene expression signatures. The R package NicheNet was used to analyze the expression of ligands and receptors to identify intercellular communication patterns between GMPs and BM stromal cells.
Figure 4—figure supplement 2
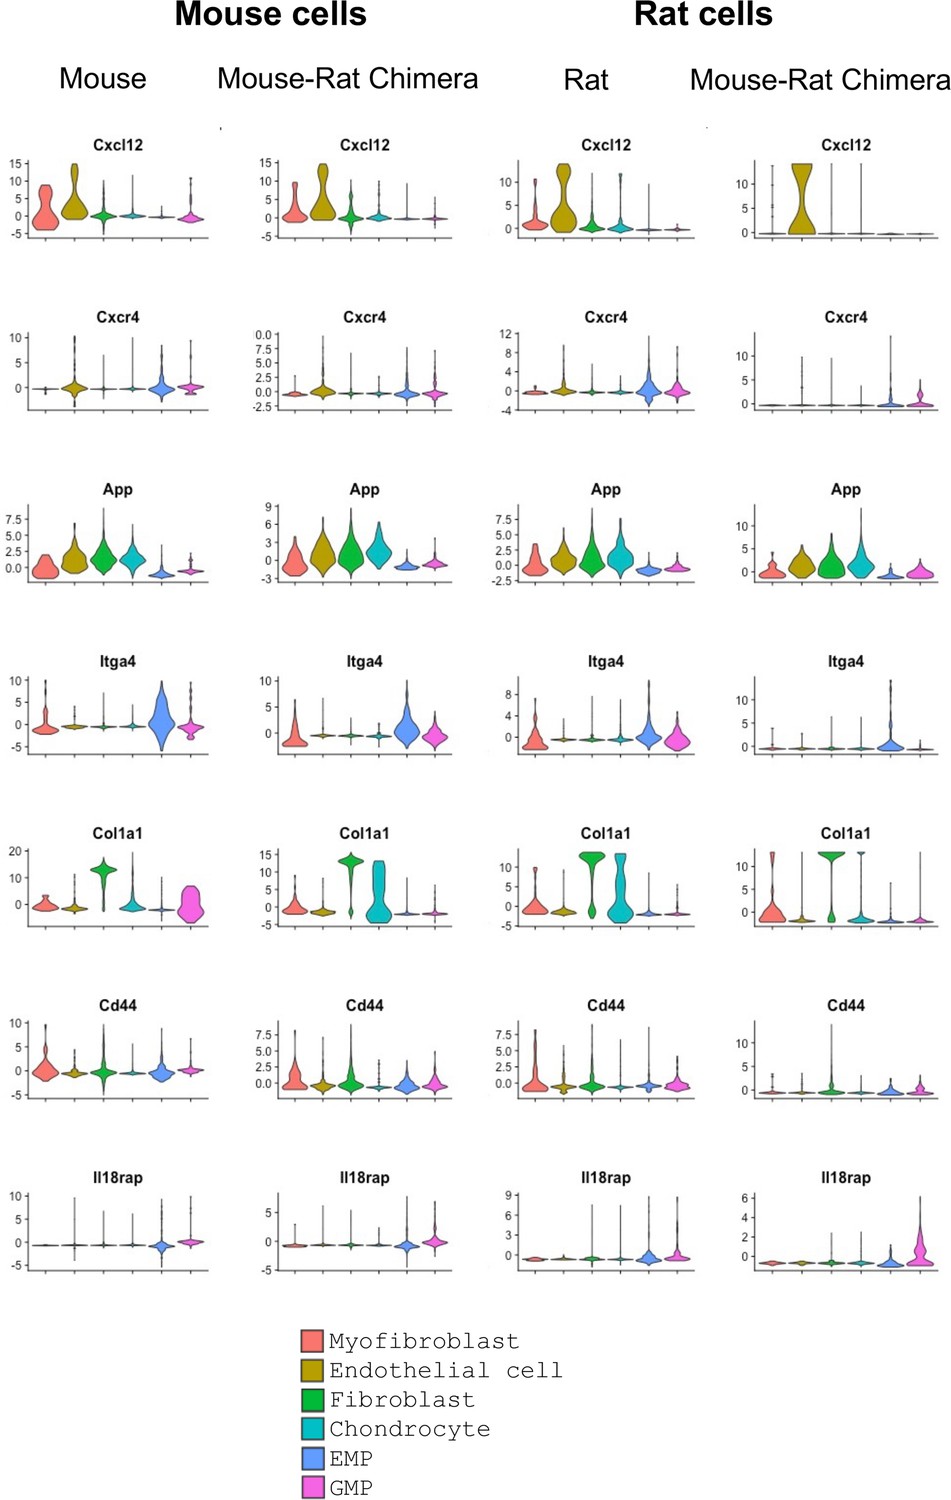
Violin plots show expression of ligands and their receptors in hematopoietic and stromal bone marrow (BM) cells.
Single-cell RNAseq was performed using BM cells from P5 mice, rats, and mouse–rat chimeras. GFP+ and GFP− cells were purified using fluorescence-activated cell sorting (FACS). Cell clusters were identified using UMAP. Violin plots show BM expression patterns of mouse and rat genes that were identified by the ligand–receptor interaction analysis.
Figure 5 with 2 supplements
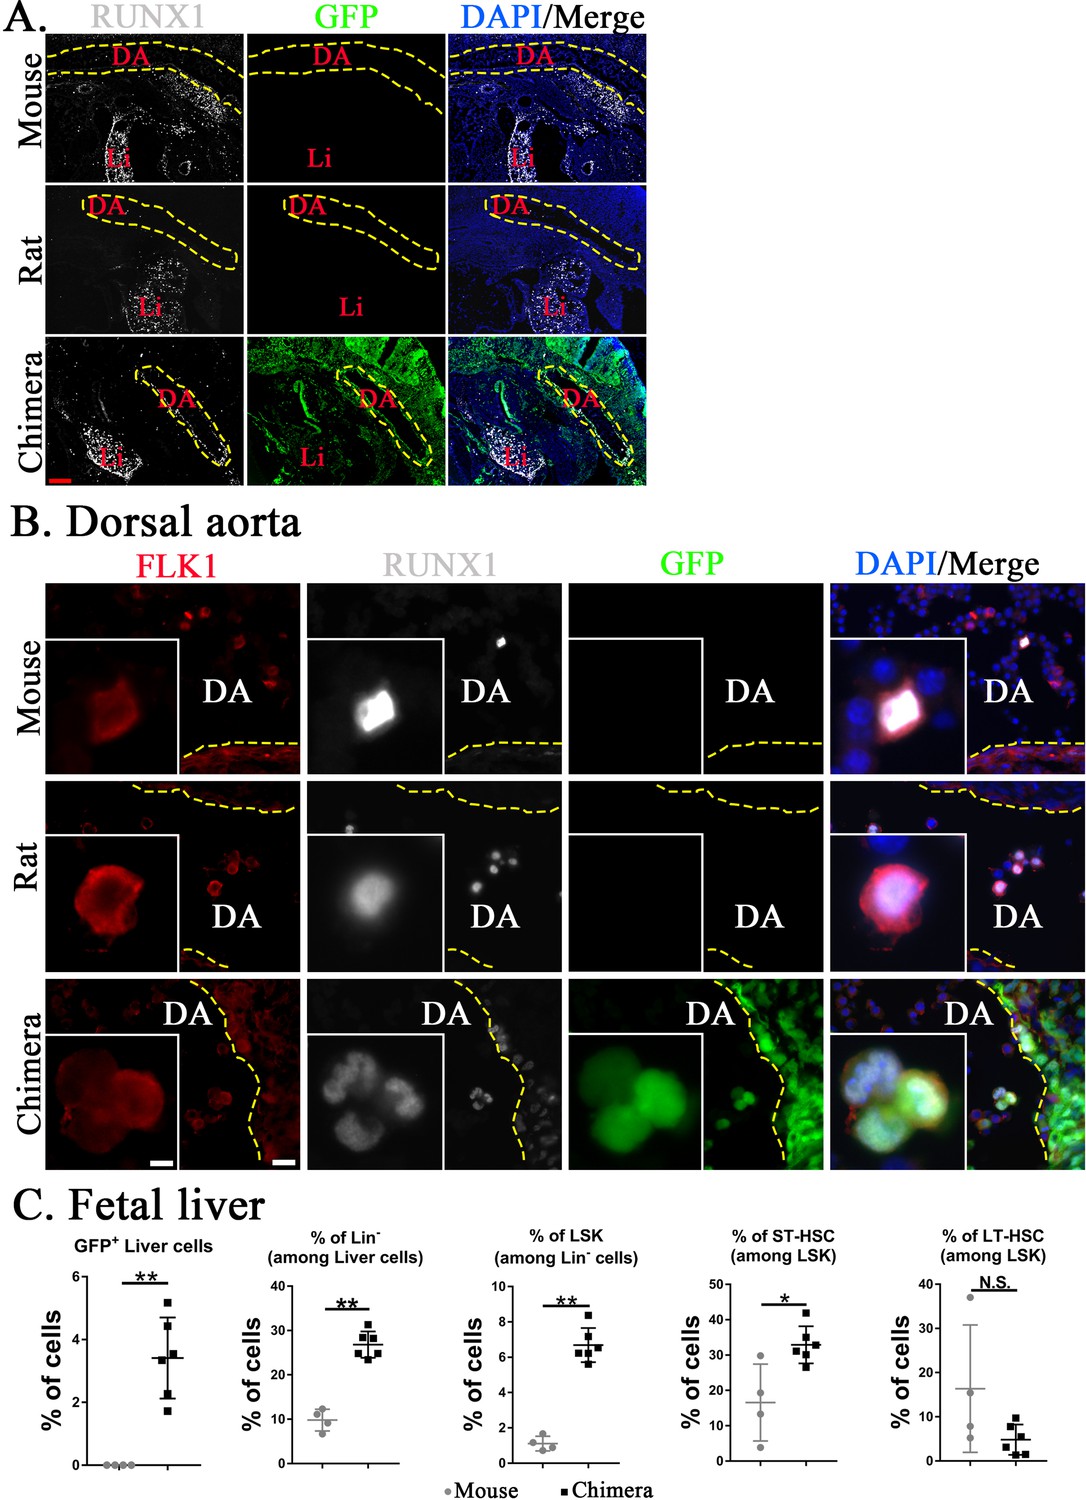
Mouse hematopoietic stem cells (HSCs) in mouse–rat chimeras develop earlier than rat HSCs.
(A, B) Immunostaining for RUNX1 (white) and FLK1 (red) shows that hemogenic endothelium in the dorsal aorta (DA) of mouse–rat chimeras develops mostly from embryonic stem cell (ESC)-derived mouse cells. GFP (green) was used to identify ESC-derived cells, whereas 4′,6-diamidino-2-phenylindole (DAPI, blue) was used to stain cell nuclei. Frozen sections were obtained from E11 mouse embryos and E12.5 embryos from rats and mouse–rat chimeras since these embryos are in similar developmental stages, see also Figure 5—figure supplement 1A–C. DA indicates the lumen of dorsal aorta. Yellow dashed line indicates the luminal surface of DA wall. Inserts show high magnification of hemogenic endothelial cells expressing both RUNX1 and FLK1. Scale bars are: A, 200 μm; B, 20 μm; inserts in B, 5 μm. Abbreviations: DA, dorsal aorta; Li, liver. (C) Fluorescence-activated cell sorting (FACS) analysis shows increased percentages of mouse ESC-derived Lin− cells, LSKs, and short-term HSCs (ST-HSCs) in fetal livers of mouse–rat chimeras (n = 6) compared to control mouse embryos (n = 4), see also Figure 5—figure supplement 2. Fetal livers were obtained from E15.5 mouse–rat chimeras and E14 mouse embryos since these embryos are in similar developmental stages. *p < 0.05, **p < 0.01, N.S. indicates no significance, see also Source data 1.
Figure 5—figure supplement 1
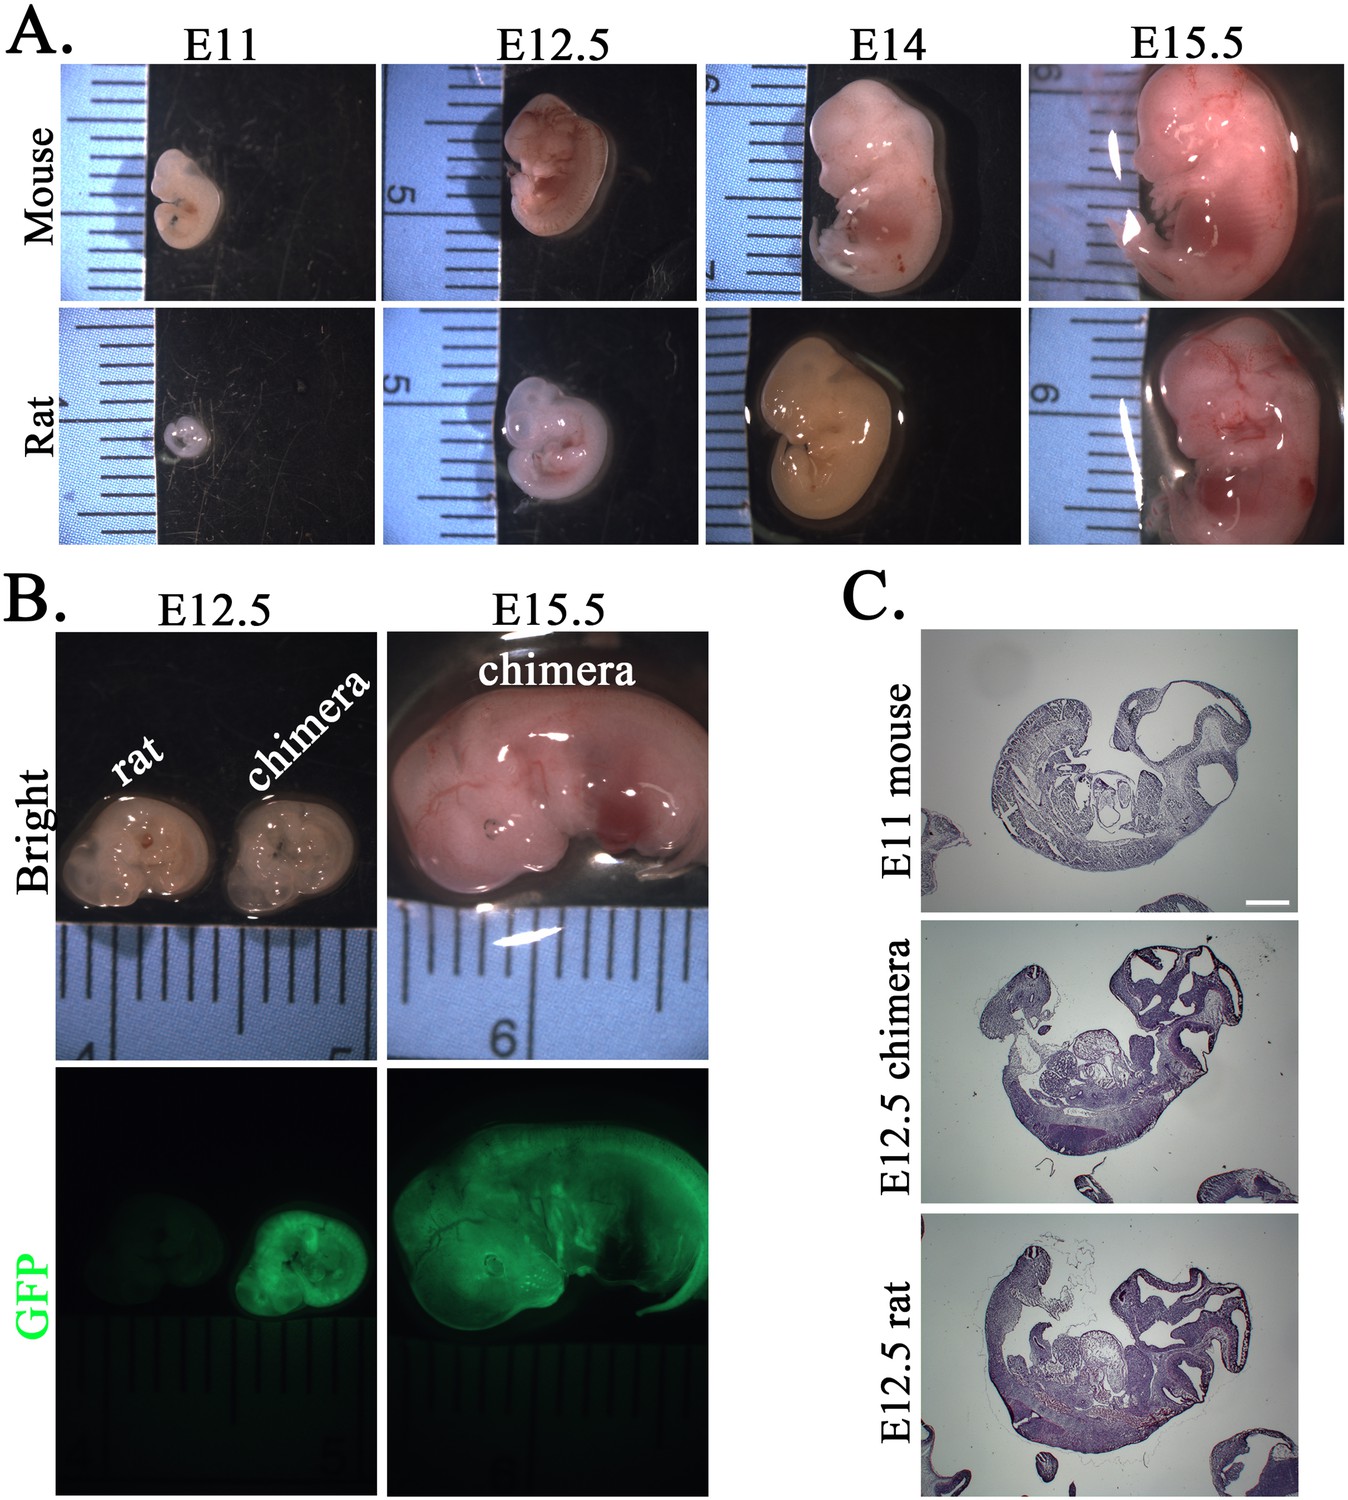
Mouse embryonic development occurs faster than embryonic development in the rat and mouse–rat chimera.
(A) Comparison of mouse and rat embryos at E11, E12.5, E14, and E15.5. Images show that rat embryos develop slower compared to mouse embryos of the same gestational time. (B) Images show similar sizes of rat and mouse–rat chimeric embryos at E12.5. GFP fluorescence indicates the contribution of mouse embryonic stem cells (ESCs) to many tissues in mouse–rat chimeras. (C) Hematoxylin and eosin (H&E) staining of sagittal sections shows similar sizes of E11 mouse embryos and E12.5 rat and chimeric embryos. Scale bar is 200 μm.
Figure 5—figure supplement 2
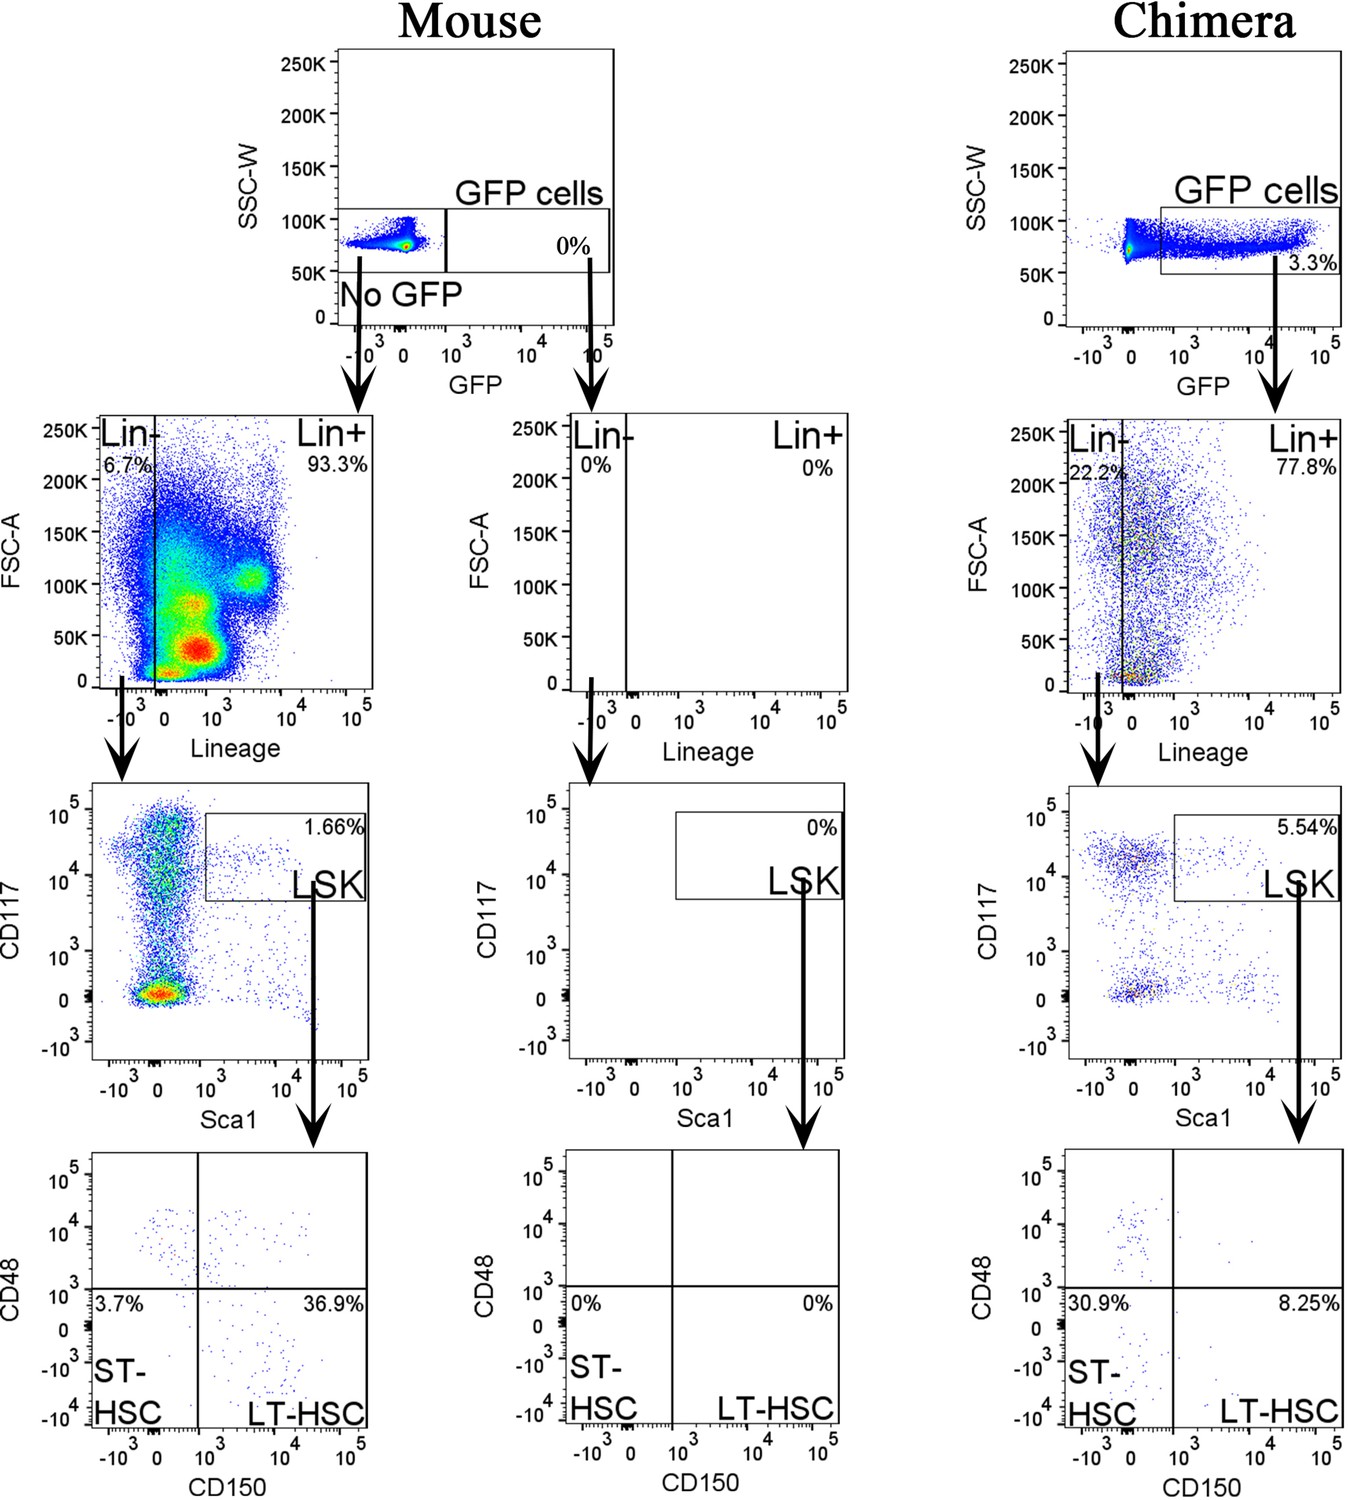
Fluorescence-activated cell sorting (FACS) analysis identifies mouse hematopoietic progenitor cells in fetal livers of mouse–rat chimeras.
Dot plots show the gating strategy to identify embryonic stem cell (ESC)-derived (GFP+) lineage-negative (Lin−), LSK, short-term HSC (ST-HSC), and long-term HSC (LT-HSC) cell subsets in fetal livers of E15.5 mouse–rat chimeras. Livers from E14 mouse embryos were used as controls for GFP.
Figure 6

Transplantation of mouse embryonic stem cell (ESC)-derived bone marrow (BM) cells from interspecies mouse–rat chimeras rescues lethally irradiated syngeneic mice.
(A) Schematic diagram shows transplantation of ESC-derived bone marrow cells (BMCs) into lethally irradiated (IR) mice. ESC-derived cells were obtained from the BM of juvenile mouse–rat chimeras using fluorescence-activated cell sorting (FACS) for GFP+ cells. BM and peripheral blood were harvested 8 days and 5 months after BM transplantation. (B) Kaplan–Meier survival analysis shows a 100% mortality in irradiated mice. Survival is dramatically improved after transplantation of irradiated mice with ESC-derived BM cells obtained from mouse–rat chimeras (IR + BMC). Survival in untreated wild-type (wt) mice is shown as a control (n = 12–20 mice in each group). (C) Photograph shows irradiated C57BL/6 mice 5 months after successful BM transplantation. Untreated C57BL/6 mouse is shown as a control. Gray color of irradiated mice (arrows) is consistent with large doses of whole-body radiation treatment. (D) Hematoxylin and eosin (H&E) staining shows increased amounts of hematopoietic cells in femur bones after BM transplantation into irradiated mice (top panels). GFP+ donor cells (green) are abundant in the BM compartment of transplanted mice (bottom panels). DAPI (blue) was used for counterstaining. Scale bars are: D, 200 μm; inserts in D, 5 μm.
Figure 7 with 6 supplements
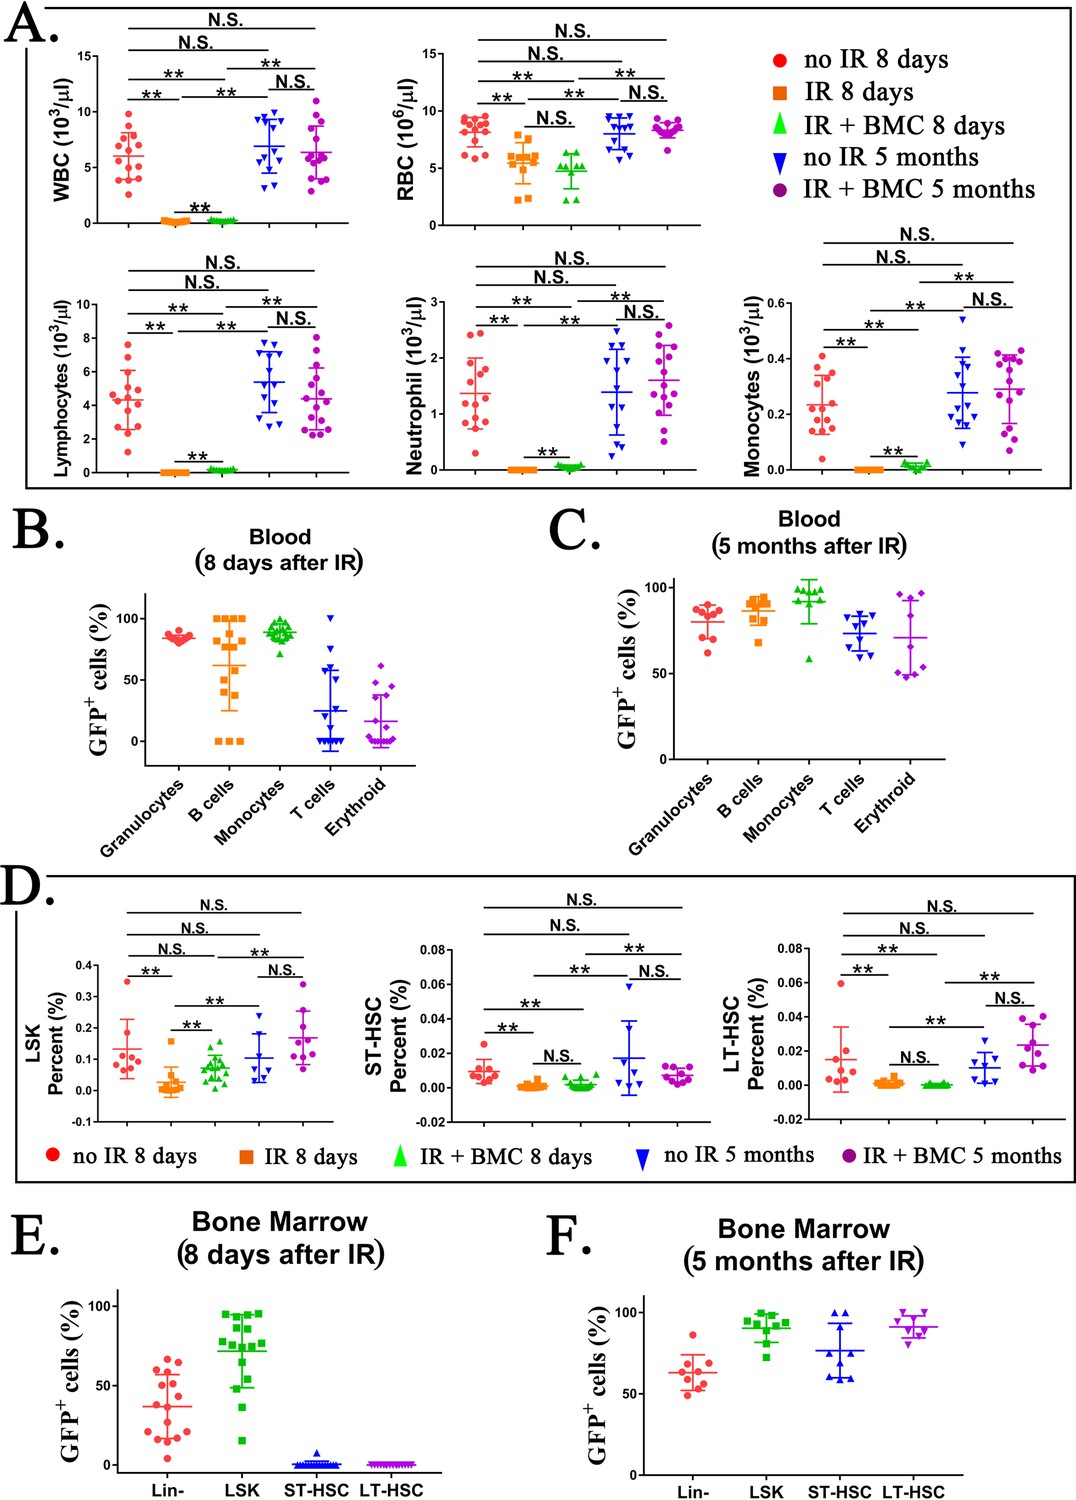
Transplantation of mouse embryonic stem cell (ESC)-derived bone marrow (BM) cells from interspecies mouse–rat chimeras restores hematopoietic cell lineages in the blood and BM of lethally irradiated syngeneic mice.
(A) Blood analysis shows that transplantation with ESC-derived BM cells from mouse–rat chimeras increases white blood cell (WBC) counts and red blood cell (RBC) counts in the peripheral blood of irradiated recipients. Blood samples were obtained from untreated mice (no IR), lethally irradiated mice without BM transplant (IR), and lethally irradiated mice with BM transplant (IR + BMC). BM transplantation was performed using ESC-derived BM cells obtained from juvenile mouse–rat chimeras. Fluorescence-activated cell sorting (FACS) analysis of the peripheral blood to identify granulocytes, B cells, monocytes, T cells, and erythroid cells in shown in Figure 7—figure supplement 1. Concentrations of lymphocytes, monocytes, and neutrophil in the blood were increased after BM transplantation (n = 9–15 mice in each group), **p < 0.01, N.S. indicates no significance, see also Source data 1. BM transplantation also increased concentrations of platelets, hemoglobin, basophils, and eosinophils in the peripheral blood, see Figure 7—figure supplement 2. (B, C) FACS analysis for GFP+ cells in each cell subset shows that ESC-derived BM cells from mouse–rat chimeras contribute to multiple hematopoietic cell lineages in the peripheral blood of lethally irradiated mice (n = 9–16 mice in each group), see also Figure 7—figure supplement 3. (D) FASC analysis shows that transplantation with ESC-derived BM cells from mouse–rat chimeras increases percentages of LSKs, short-term HSCs (ST-HSCs), and long-term HSCs (LT-HSCs) in the BM of irradiated mice 5 months after BM transplantation (n = 9–16 mice in each group), see also Figure 7—figure supplement 4A, B. **p < 0.01, N.S. indicates no significance, see also Source data 1. (E, F) FACS analysis for GFP+ shows that ESC-derived BM cells from mouse–rat chimeras contribute to multiple hematopoietic progenitor cells in the BM of irradiated mice (n = 9–16 mice in each group), see also Figure 7—figure supplement 5. For secondary transplantation of mouse ESC-derived BM cells into lethally irradiated syngeneic mice, see Figure 7—figure supplement 6A–E.
Figure 7—figure supplement 1
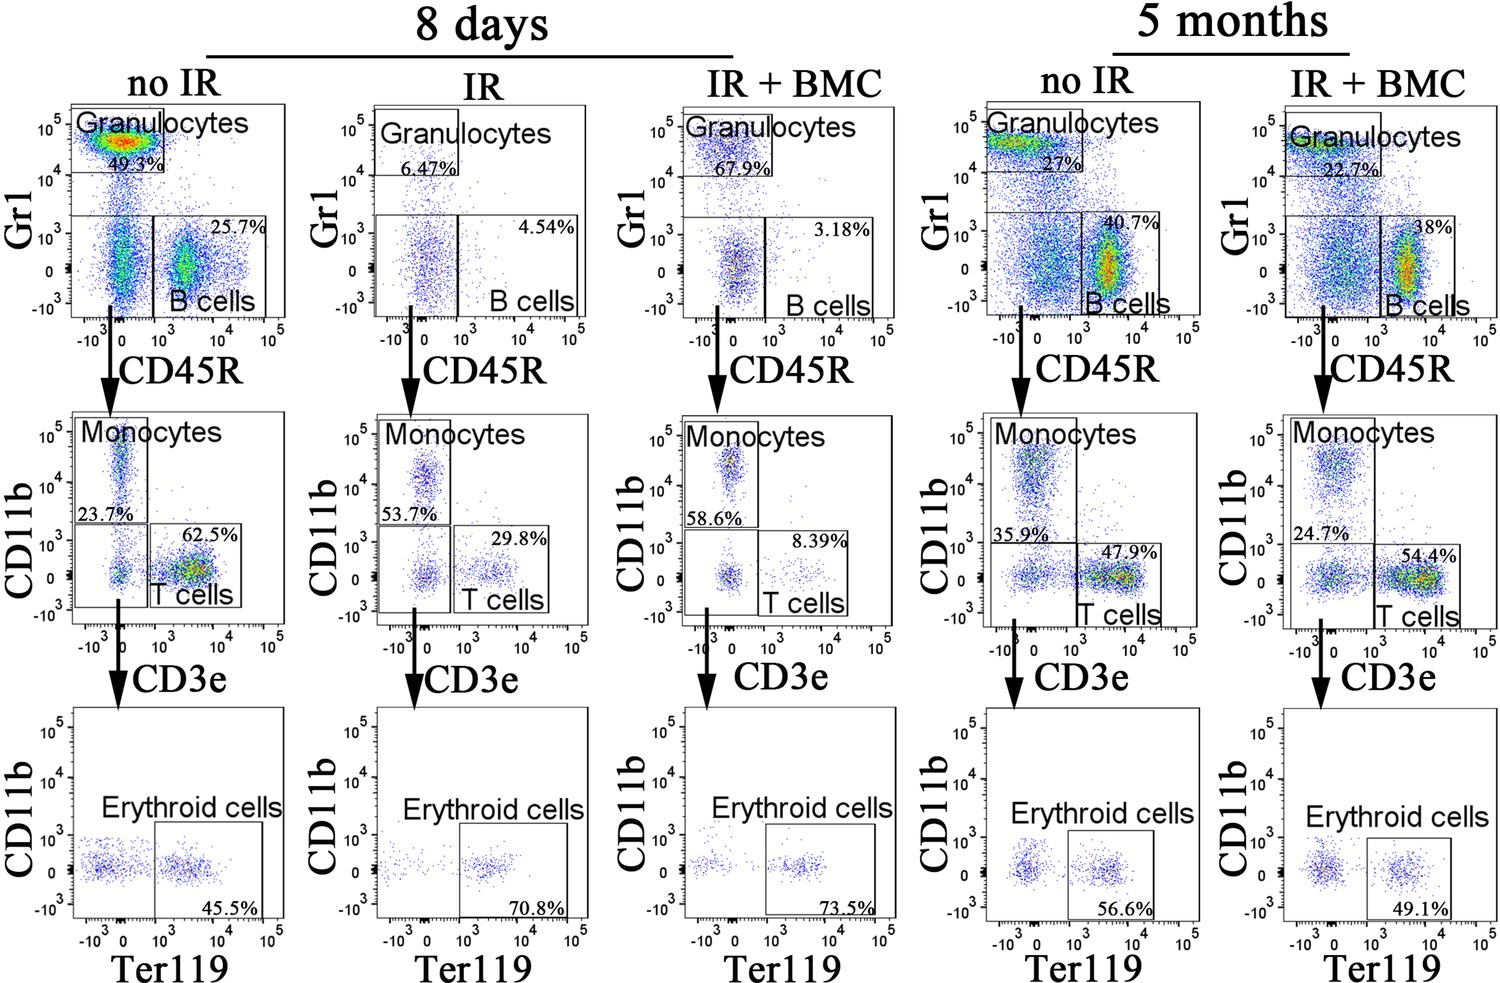
Fluorescence-activated cell sorting (FACS) analysis identifies granulocytes, B cells, monocytes, T cells, and erythroid cells in the peripheral blood after bone marrow (BM) transplantation.
Blood samples were obtained from untreated mice (no IR), lethally irradiated mice without BM transplant (IR), and lethally irradiated mice with BM transplant (IR + BMC). BM transplantation was performed using embryonic stem cell (ESC)-derived BM cells obtained from juvenile mouse–rat chimeras. FACS analysis was performed 8 days and 5 months after BM transplantation.
Figure 7—figure supplement 2
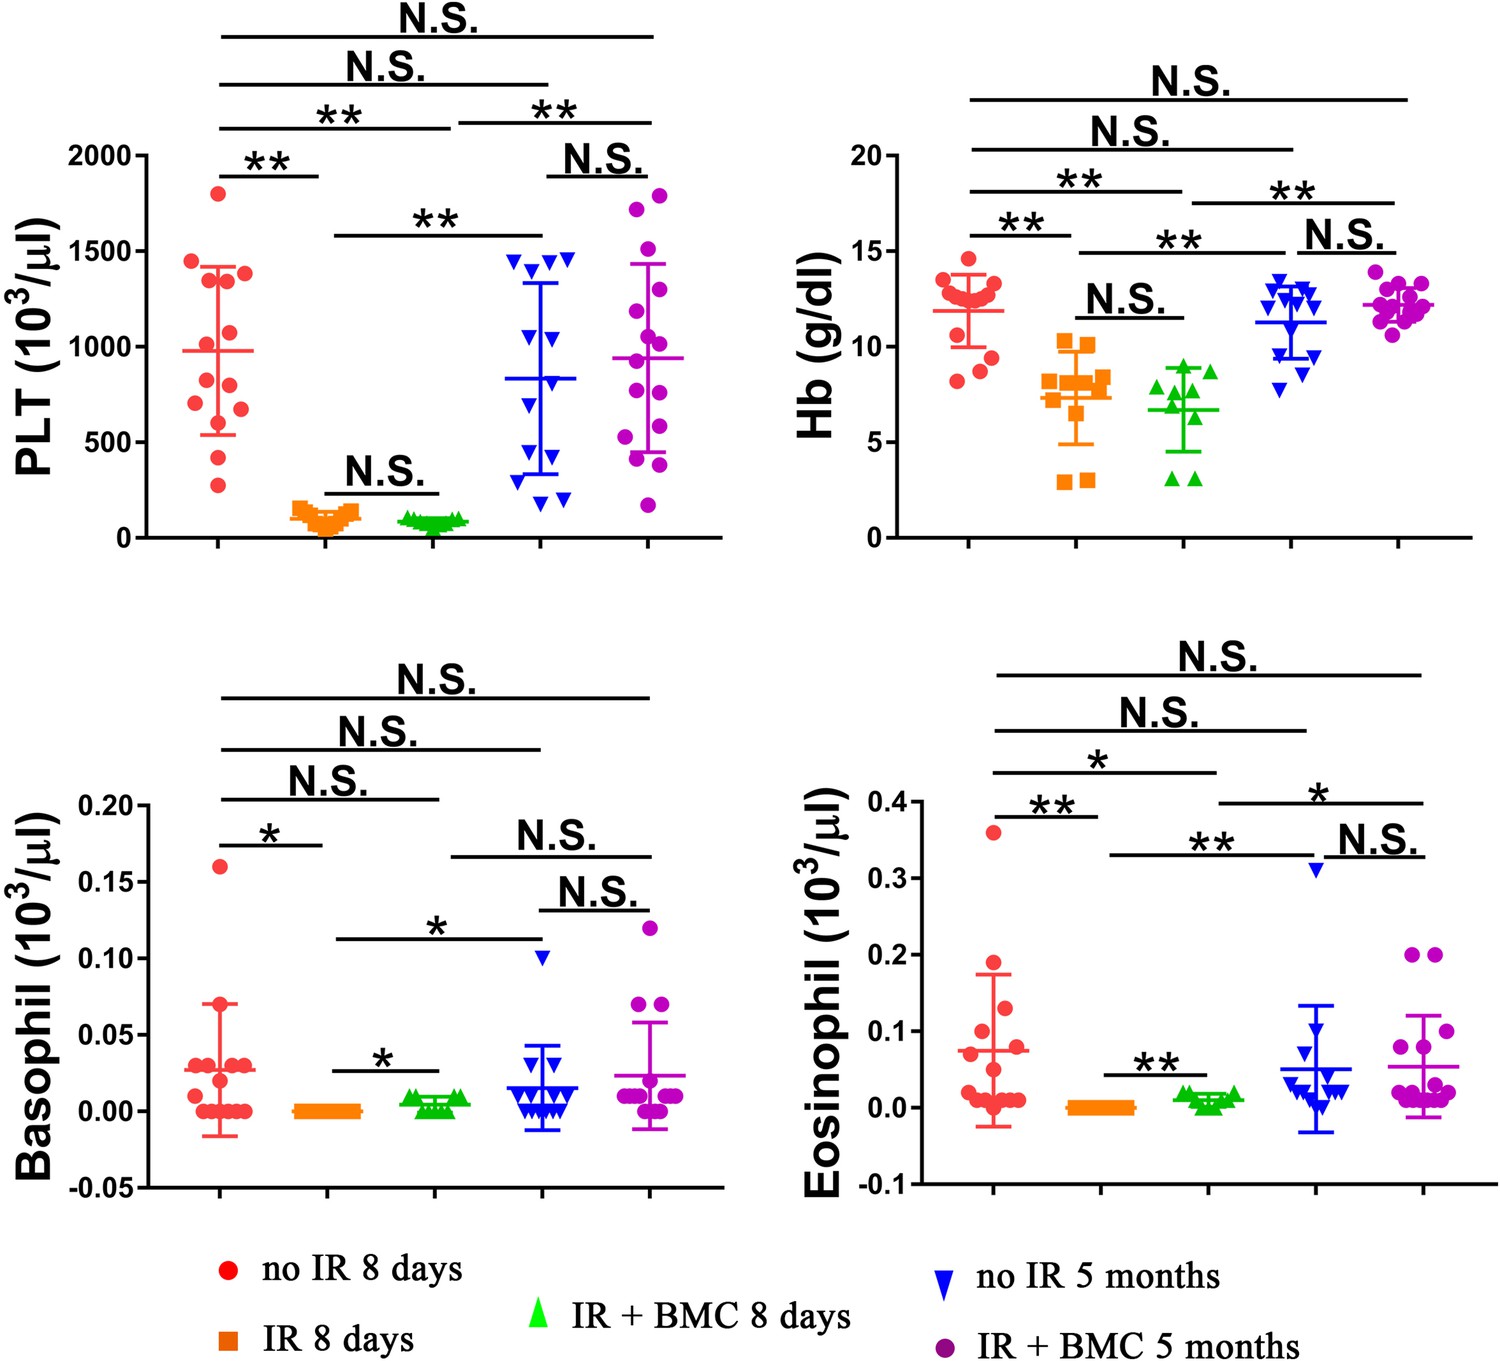
Transplantation of irradiated mice with embryonic stem cell (ESC)-derived bone marrow (BM) cells from mouse–rat chimeras increases hemoglobin (Hb) concentration and numbers of platelets (PLT), basophils, and eosinophils in the peripheral blood.
Blood samples were obtained from untreated mice (no IR), lethally irradiated mice without BM transplant (IR), and lethally irradiated mice with BM transplant (IR + BMC). BM transplantation was performed using ESC-derived BM cells obtained from juvenile mouse–rat chimeras. Mice were harvested 8 days or 5 months after BM transplantation. Concentrations of basophils and eosinophils in the peripheral blood were significantly increased 8 days after BM transplantation. Concentrations of PLT, Hb, basophils, and eosinophils were fully restored 5 months after BM transplantation (n = 9–15 mice in each group), *p < 0.05, **p < 0.01, N.S. indicates no significance.
Figure 7—figure supplement 3
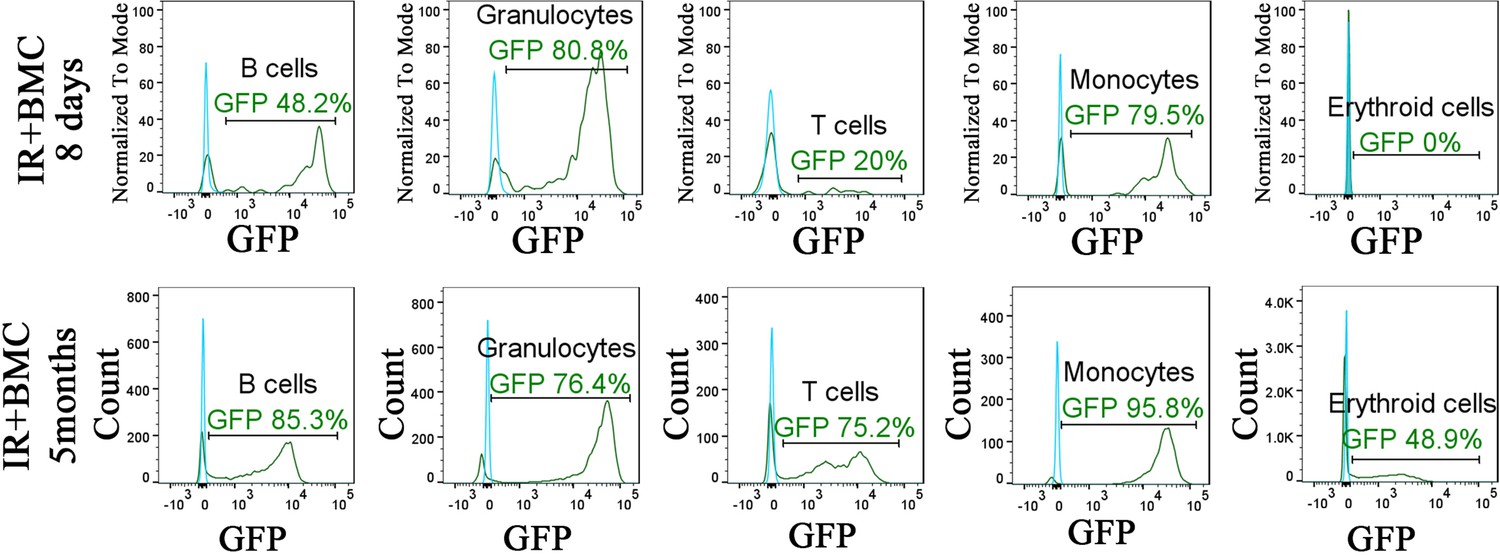
Identification of embryonic stem cell (ESC)-derived cells in the peripheral blood of irradiated mice after bone marrow (BM) transplantation.
Histograms show the presence of ESC-derived (GFP-positive) granulocytes, B cells, T cells, monocytes, and erythroid cells in the peripheral blood of irradiated mice after BM transplantation (green line). Blood of mice without BM transplantation is used to identify autofluorescence in GFP channel (blue line). Blood samples were harvested 8 days or 5 months after BM transplantation and used for fluorescence-activated cell sorting (FACS) analysis.
Figure 7—figure supplement 4
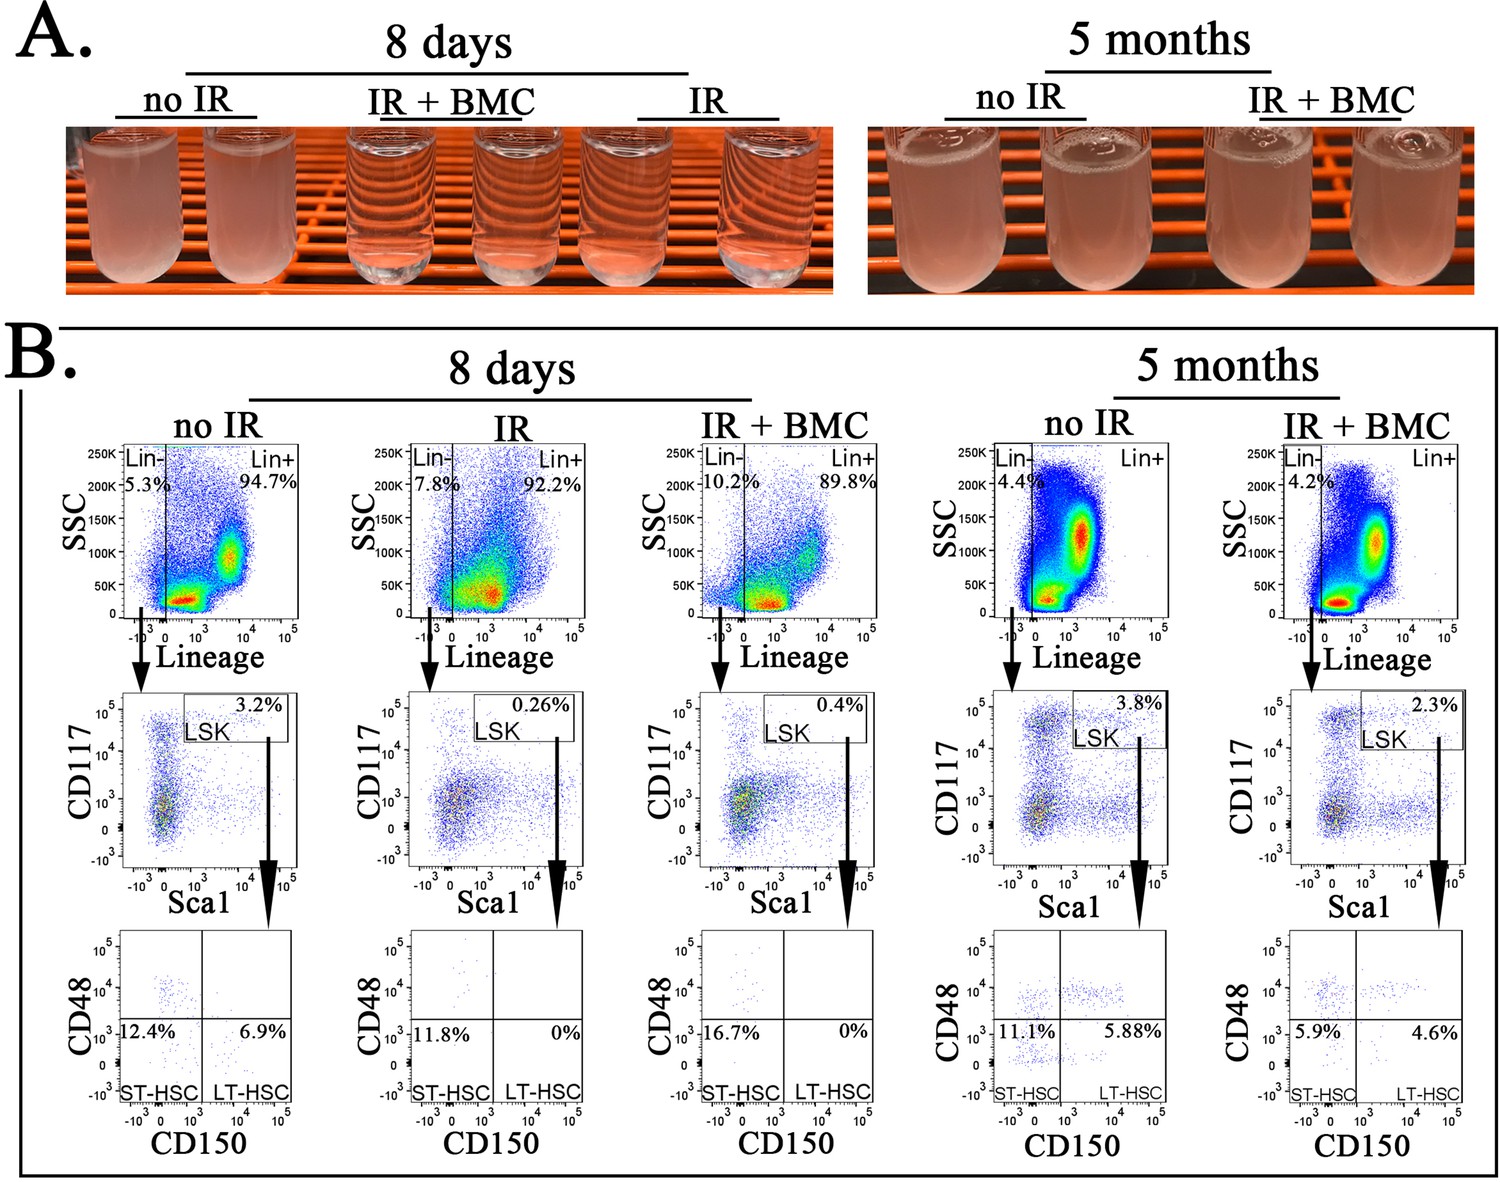
Transplantation of mouse embryonic stem cell (ESC)-derived bone marrow (BM) cells from interspecies mouse–rat chimeras results in reconstitution of BM hematopoietic and progenitor cells after irradiation.
(A) Photographs show cell suspensions obtained from the BM of untreated mice (no IR), lethally irradiated mice without BM transplant (IR), and lethally irradiated mice with BM transplant (IR + BMC). Mice were harvested 8 days (left image) or 5 months after BM transplantation (right image). ESC-derived BM cells from juvenile mouse–rat chimeras were used for BM transplantation. (B) Fluorescence-activated cell sorting (FACS) analysis shows identification of Lineage− (Lin−) cells, LSKs, short-term HSCs (ST-HSCs), and long-term HSCs (LT-HSCs) in the BM of irradiated mice 8 days and 5 months after BM transplantation.
Figure 7—figure supplement 5
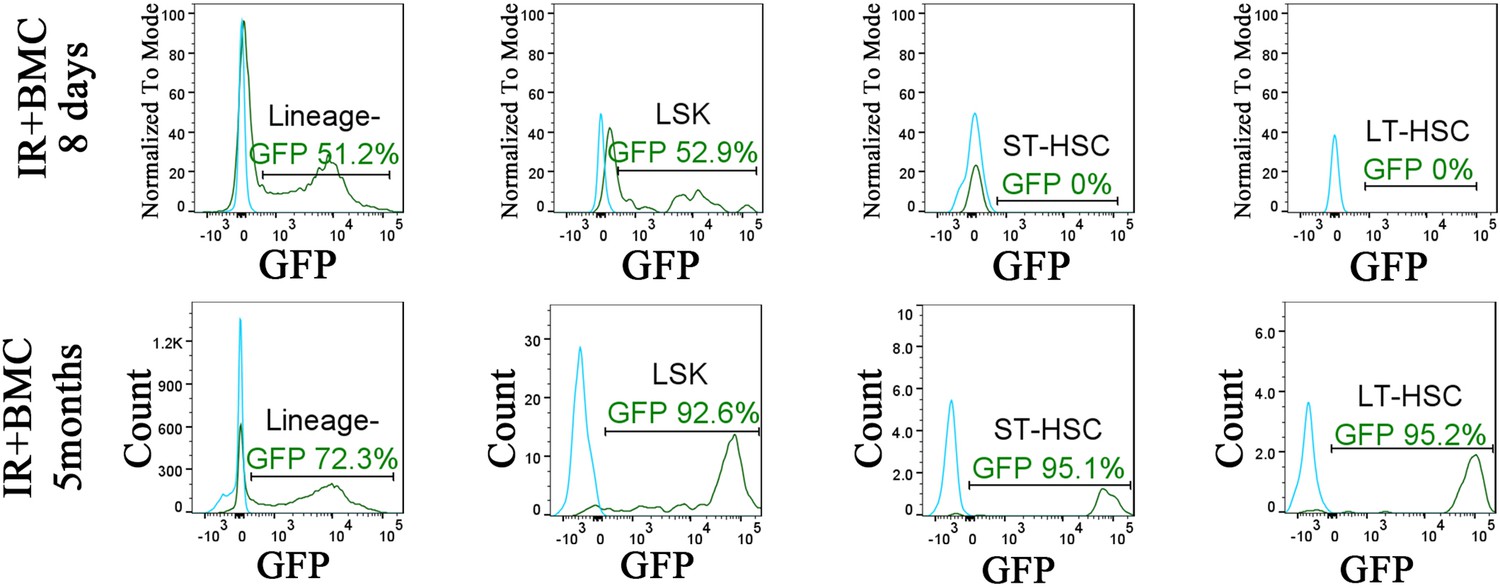
Identification of embryonic stem cell (ESC)-derived hematopoietic cells in the bone marrow (BM) of irradiated mice after BM transplantation.
Histograms show the presence of ESC-derived (GFP-positive) Lin− cells, LSKs, short-term HSCs (ST-HSCs), and long-term HSCs (LT-HSCs) in the BM of irradiated mice after BM transplantation (green line). For each cell subset, BM of mice without BM transplantation is used to identify autofluorescence in GFP channel (blue line). BM was obtained from one tibia and one fibula bones 8 days or 5 months after BM transplantation.
Figure 7—figure supplement 6
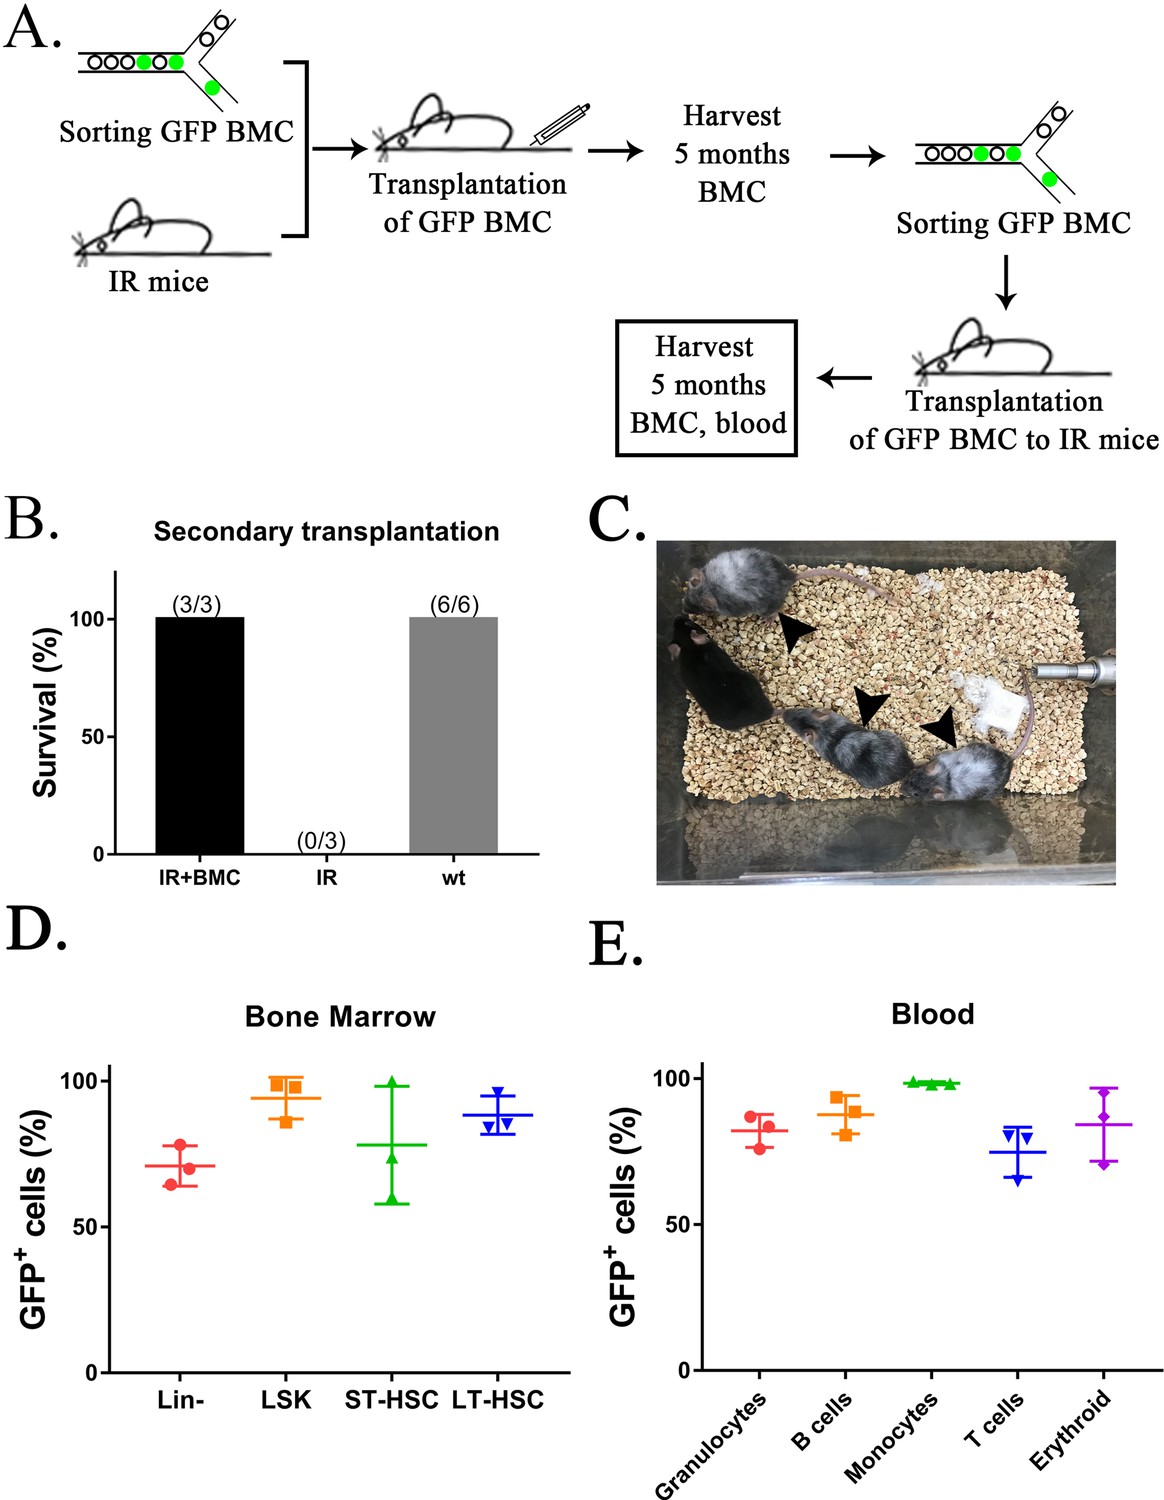
Secondary transplantation of mouse embryonic stem cell (ESC)-derived bone marrow (BM) cells from interspecies mouse–rat chimeras rescues lethally irradiated syngeneic mice.
(A) Schematic diagram shows two sequential transplantations of ESC-derived BM cells (GFP BMC) into lethally irradiated (IR) mice. ESC-derived cells were obtained from the BM of juvenile mouse–rat chimeras using fluorescence-activated cell sorting (FACS) of BM cells for GFP. BM and peripheral blood were analyzed by FACS 5 months after the second BM transplantation. (B) ESC-derived BM cells increase survival of irradiated mice after two sequential BM transplantations (IR + BMC) compared to irradiated mice without BM transplantation (IR). Survival in untreated wild-type (wt) mice is shown as a control. (C) Photograph shows irradiated C57BL/6 mice 5 months after the second BM transplantation. Untreated C57BL/6 mouse is shown as a control. Gray color of irradiated C57BL/6 mice (arrows) is consistent with large doses of whole-body radiation treatment. (D. E) FACS analysis for GFP in each cell subset shows that ESC-derived BM cells from mouse–rat chimeras contribute to multiple hematopoietic cell lineages in the peripheral blood and BM of lethally irradiated mice 5 months after the second BM transplantation (n = 3 mice).
Additional files
-
Supplementary file 1
The number and percentage of hematopoietic bone marrow (BM) cells containing both mouse and rat mRNAs (hybrid cells).
- https://cdn.elifesciences.org/articles/74018/elife-74018-supp1-v2.docx
-
Supplementary file 2
The number of counts and features (genes) in six hybrid cells identified in mouse–rat chimera.
- https://cdn.elifesciences.org/articles/74018/elife-74018-supp2-v2.docx
-
Supplementary file 3
Antibodies used for flow cytometry (FC) and immunofluorescence (IF) staining.
- https://cdn.elifesciences.org/articles/74018/elife-74018-supp3-v2.docx
-
Transparent reporting form
- https://cdn.elifesciences.org/articles/74018/elife-74018-transrepform1-v2.pdf
-
Source data 1
Excel spreadsheet containing quantitative data for Figures 1, 5 and 7.
- https://cdn.elifesciences.org/articles/74018/elife-74018-data1-v2.xlsx
Download links
A two-part list of links to download the article, or parts of the article, in various formats.
Downloads (link to download the article as PDF)
Open citations (links to open the citations from this article in various online reference manager services)
Cite this article (links to download the citations from this article in formats compatible with various reference manager tools)
In vivo generation of bone marrow from embryonic stem cells in interspecies chimeras
eLife 11:e74018.
https://doi.org/10.7554/eLife.74018


