N-myc downstream regulated gene 1 (ndrg1) functions as a molecular switch for cellular adaptation to hypoxia
- Department of Biological Sciences, University of Maryland Baltimore County, United States
- Department of Chemistry and Biochemistry, University of Maryland Baltimore County, United States
- Department of Biology, Johns Hopkins University, United States
Figures
Figure 1 with 3 supplements
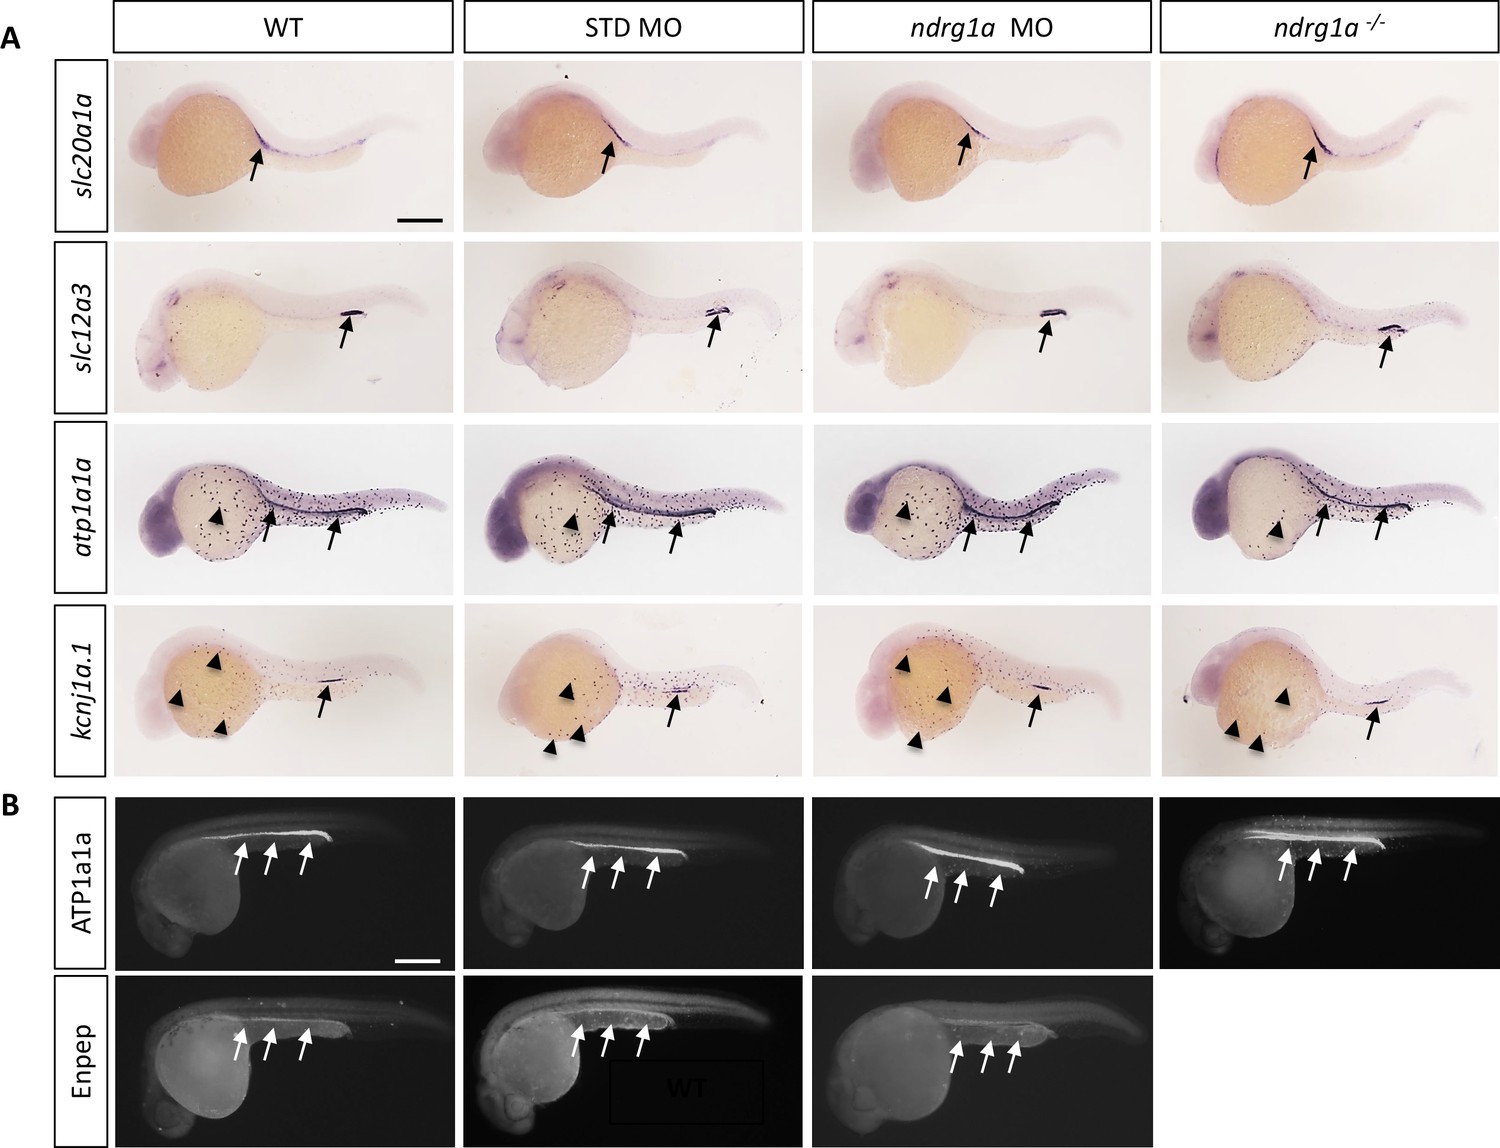
Ndrg1a is not required for the differentiation of the pronephric duct and ionocytes.
(A, B) Lateral views of 24 hpf WT, standard MO-injected, ndrg1a MO-injected and ndrg1a-/- mutant embryos labeled using (A) wholemount in situ hybridization to detect the mRNA distribution of slc20a1a, slc12a3, atp1a1a, and kcnj1a.1 (n=3–4 experiments with an average of 36 embryos per riboprobe) and (B) immunolabeling with anti-ATP1A1A or anti-GFP in Tg[enpep:GFP] transgenic line (n=3–4 experiments with an average of 40 embryos per antibody). Annotations: arrows point to signal in the pronephric duct; arrowheads: ionocytes. Scale bars 300 μm.
Figure 1—figure supplement 1
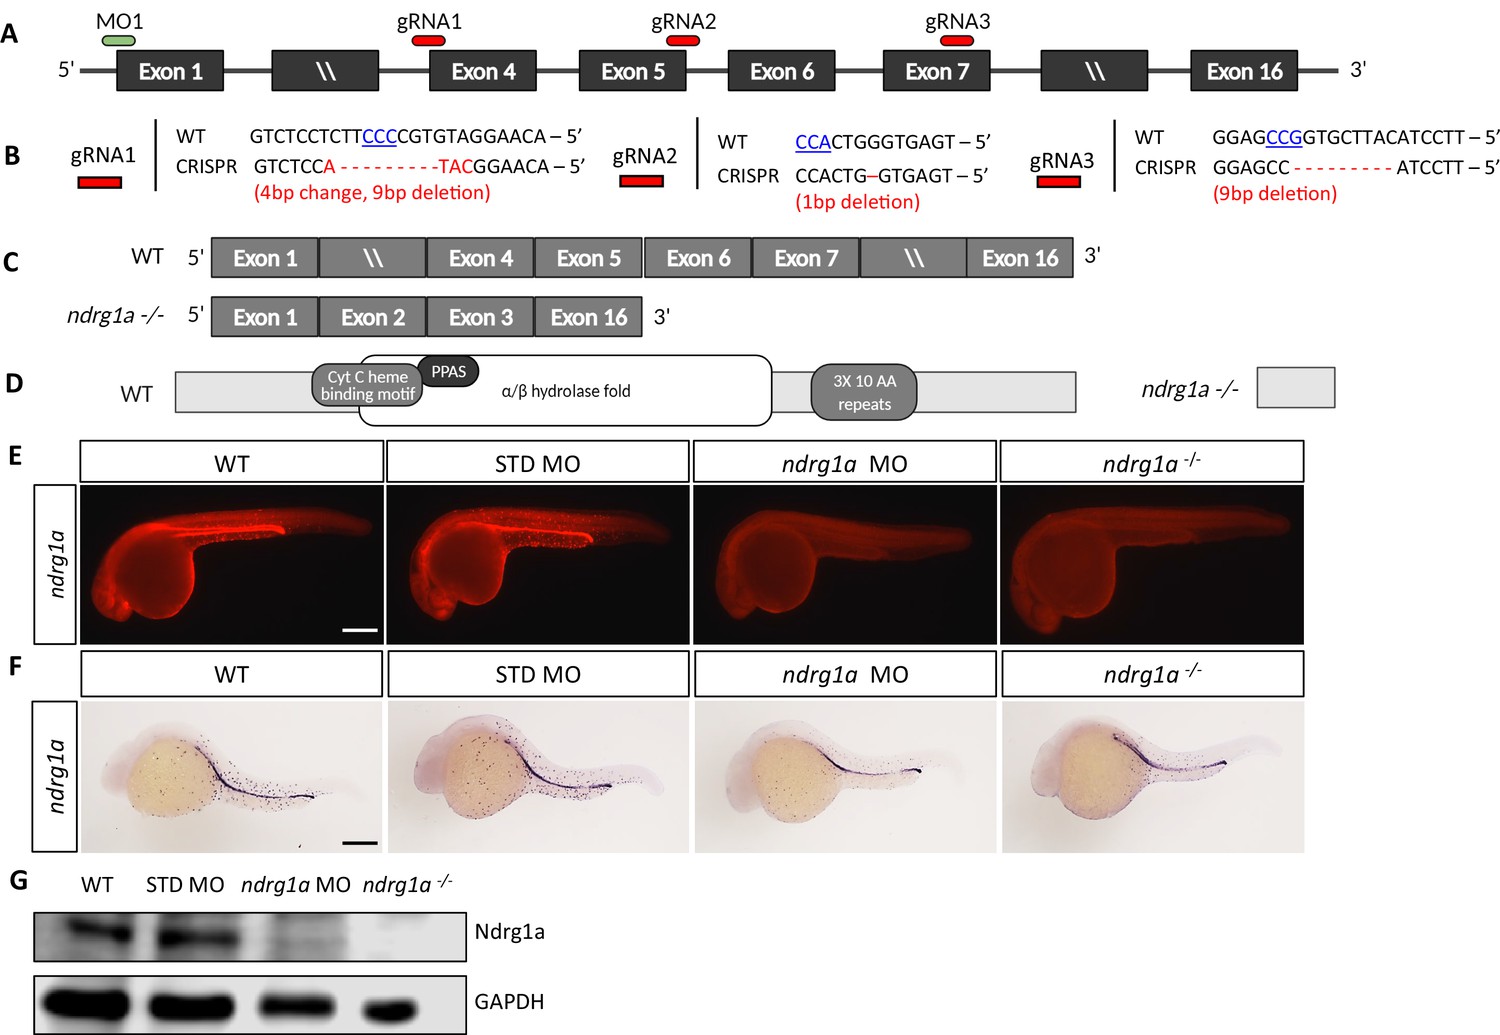
Generation of ndrg1a loss-of-function tools.
(A) Schematic of the ndrg1a locus showing 5’ and 3’ untranslated regions, exons (black boxes), and the target sites for the ndrg1a translation-blocking morpholino (MO1, green bar) and the three CRISPR-Cas9 guide RNAs (gRNA 1–3, red bars). (B) Genomic DNA sequences of WT embryos and ndrg1ambc1 homozygous mutants at the CRISPR-Cas9 gRNA target sites. PAM sequences are in blue, underlined font and insertion/deletion mutations are shown in red. (C) Illustration of exons included in the WT and ndrg1ambc1 mutant alleles. (D) Structure of the WT and Ndrg1a mutant proteins showing domains present and missing in the mutant. Domains present in WT include: α/β hydrolase fold, cytochrome c heme binding motif, NDR, phosphopantetheine attachment site (PPAS) and 3X10 AA repeats. (E) Lateral views of 24 hpf WT, standard (STD, control) morpholino (MO)-injected, ndrg1a MO-injected and ndrg1ambc1 homozygous mutants, immunolabeled with anti-NDRG1. (n=3 experiments with an average of 5–10 embryos). Scale bar 300 μm. (F) Lateral views of 24 hpf WT, STD MO-injected, ndrg1a MO-injected and ndrg1ambc1 homozygous mutants labeled by whole-mount in situ hybridization using an ndrg1a riboprobe. (n=2 experiments with an average of 8 embryos). Scale bar 300 μm. (G) Western blot analysis of Ndrg1a protein levels in 24 hpf WT, STD MO-injected, ndrg1a MO-injected and ndrg1ambc1 homozygous mutants. GAPDH was used as a loading control. (n=2 experiments; Figure 1—figure supplement 1—source data 1).
-
Figure 1—figure supplement 1—source data 1
Source data of uncropped, annotated WB figures of Ndrg1a and GAPDH; Raw, unedited WB file for Ndrg1a; Raw, unedited WB file for GAPDH.
- https://cdn.elifesciences.org/articles/74031/elife-74031-fig1-figsupp1-data1-v2.zip
Figure 1—figure supplement 2
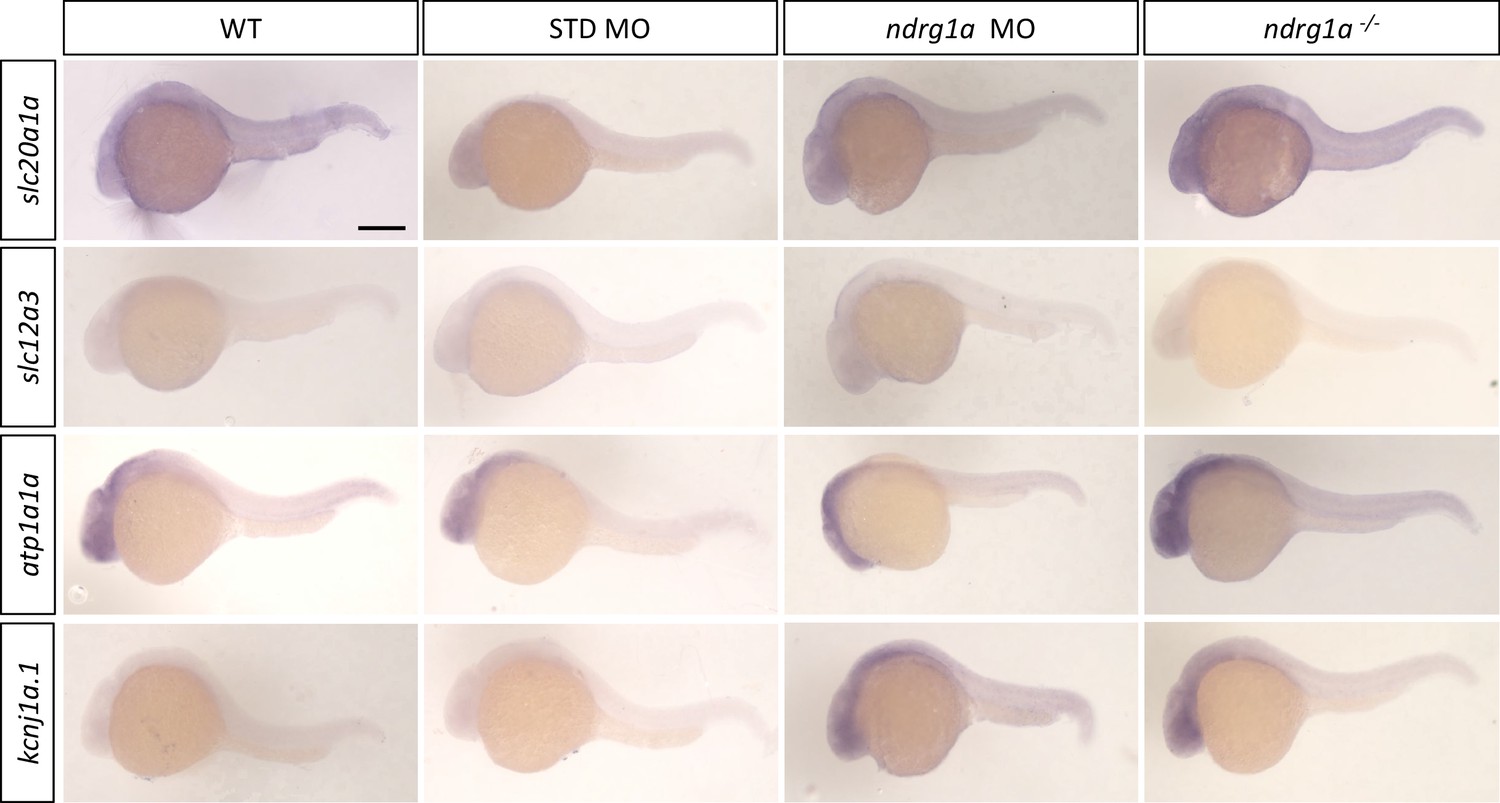
In situ sense probe controls.
Lateral views of 24 hpf WT, standard MO-injected, ndrg1a MO-injected and ndrg1a-/- mutant embryos labeled using sense probes with wholemount in situ hybridization for the following genes: slc20a1a, slc12a3, atp1a1a, and kcnj1a.1 (n=average of 10 embryos per riboprobe). Scale bars 300 μm.
Figure 1—figure supplement 3
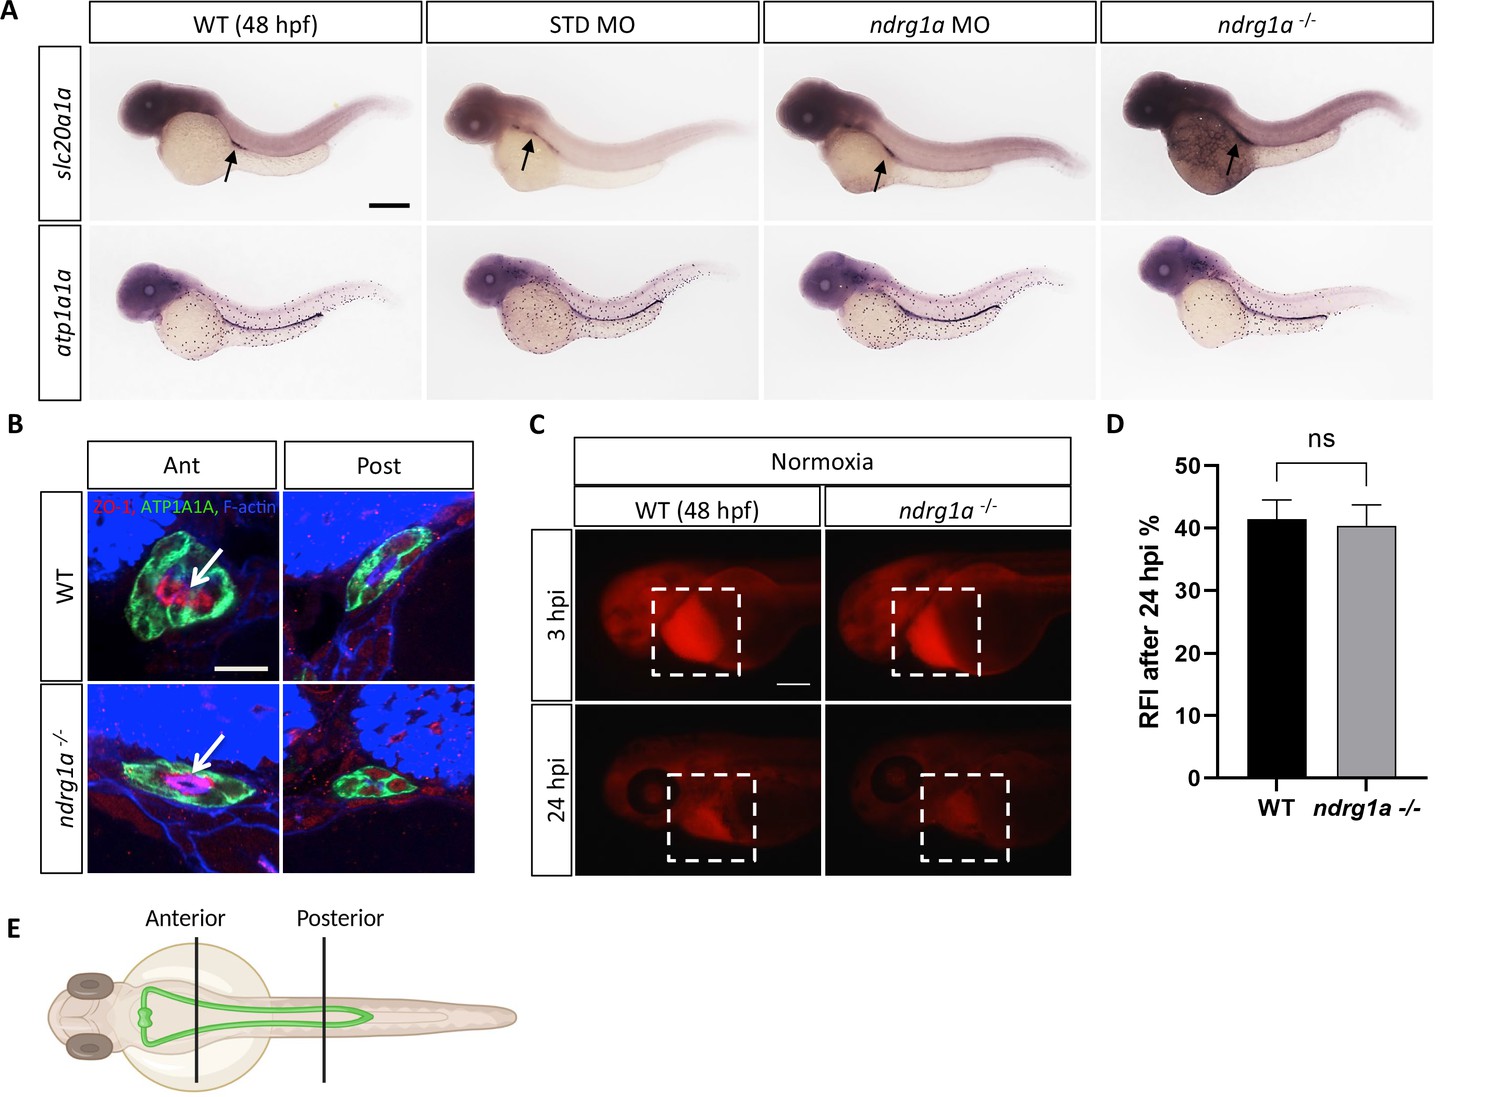
The morphology, differentiation and function of the pronephric duct are normal in Ndrg1a loss-of-function embryos.
(A) Lateral views of 48 hpf WT, STD MO-injected, ndrg1a MO-injected and ndrg1a-/- mutant embryos labeled by whole-mount in situ hybridization using slc20a1a and atp1a1a riboprobes. (n=an average of 15 embryos processed per riboprobe). Annotations: arrows point to signal in the pronephric duct. Scale bar 300 μm. (B) Transverse views of the anterior and posterior pronephric duct of WT embryos and ndrg1a-/- mutants, labeled with anti-ATP1A1A (green), anti-ZO-1 (apical pole, red), and phalloidin (F-actin, blue). Scale bar 10 μm. Annotations: arrows point to the apical surface. (n=an average of 28 pronephros sections processed per experimental group.) (C) Kidney clearance assay using 48 hpf WT embryos and ndrg1a-/- mutants raised under normoxic conditions. Embryos were injected at 48 hpf in the pericardial sac with rhodamine dextran. Lateral views of injected embryos were taken 3 and 24 hours post-injection (hpi). White boxes indicate where fluorescence measurements were taken. Scale bar 200 μm. (D) Quantification of kidney clearance assay. No significant difference between WT and mutants was observed 24 hpi (unpaired t test; p-value = 0.8192, ns) (n=2 experiments with an average of five embryos processed per experiment; Figure 1—figure supplement 3—source data 1). (E) Illustration of the locations of anterior and posterior sections along the pronephros.
-
Figure 1—figure supplement 3—source data 1
Source data for quantification of kidney clearance assay under normoxia (48 hpf) WT and ndrg1a-/- mutant.
- https://cdn.elifesciences.org/articles/74031/elife-74031-fig1-figsupp3-data1-v2.zip
Figure 2
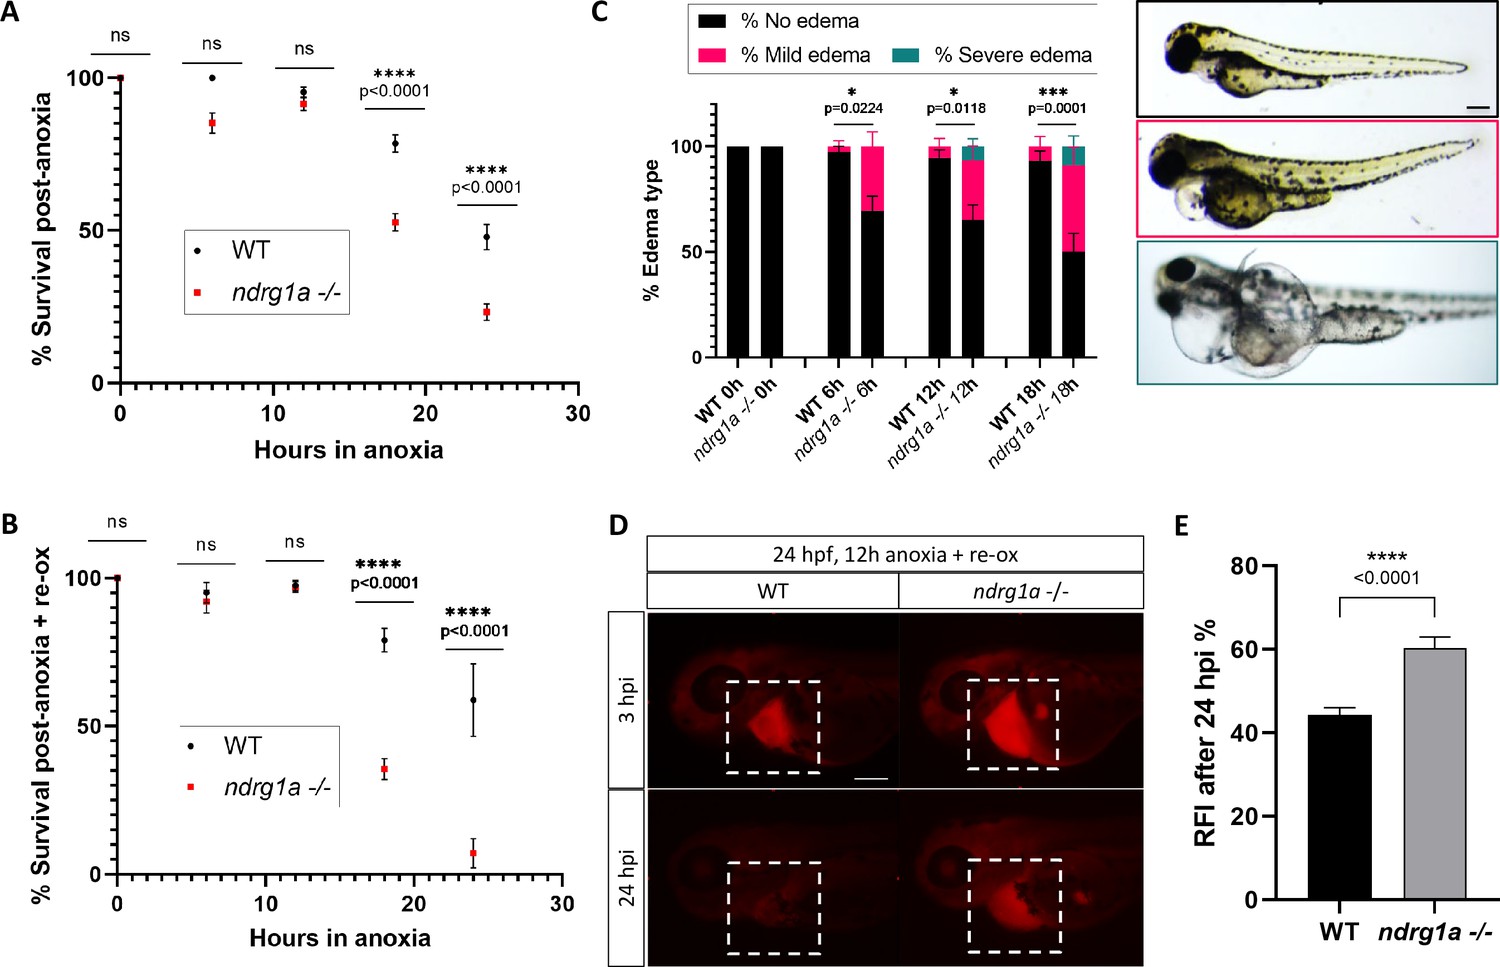
Ndrg1a confers protection from hypoxic injury.
(A) % Survival of WT embryos and ndrg1a-/- mutants immediately following 6, 12, 18, and 24 hr of anoxia exposure. Embryos were 24 hpf at the time of exposure. A significant difference between WT and mutants was observed for 12 and 18 hr of anoxia (Two-way ANOVA analysis was performed; 0 hr WT vs. ndrg1a-/-: p-value > 0.9999, ns; 6 hr WT vs. ndrg1a-/-: p-value = 0.0793, ns; 12 hr WT vs. ndrg1a-/-: p-value = 0.9941, ns; 18 hr WT vs. ndrg1a-/-: p-value < 0.0001, ****; 24 hr WT vs. ndrg1a-/-: p-value < 0.0001, ****; n=5–8 experiments with an average of 171 embryos per experimental group; Figure 2—source data 1). (B) % Survival of WT embryos and ndrg1a-/-mutants following 6, 12, 18, and 24 hr of anoxia exposure and 2 days of re-oxygenation (re-ox). Embryos were 24 hpf at the time of initial anoxia exposure. A significant difference between WT and mutants was observed for 18 and 24 hr of anoxia + 2 re-ox (Two-way ANOVA analysis was performed; 0h+re ox WT vs. ndrg1a-/-: p-value > 0.9999, ns; 6 hr+re ox WT vs. ndrg1a-/-: p-value > 0.9999, ns; 12hr+re ox WT vs. ndrg1a-/-: p-value > 0.9999, ns; 18 hr+re ox WT vs. ndrg1a-/-: p-value < 0.0001, ****; 24 hr+re ox WT vs. ndrg1a-/-: p-value < 0.0001, ****; n=2–5 experiments with an average of 66 embryos per experimental group; Figure 2—source data 2). (C, left) % Edema observed in WT embryos and ndrg1a-/-mutants following 0, 6, 12, 18, and 24 hr of anoxia exposure and 2 days re-ox. Edema phenotypes were divided into three categories: no edema, mild edema and severe edema. A significant difference between WT and mutants was observed for 6, 12, and 18 hr of anoxia + 2 days re-ox for the presence of either mild or severe edema (Two-way ANOVA analysis was performed; 0 hr+re ox WT vs. ndrg1a-/-: p-value > 0.9999, ns; 6 hr+re ox WT vs. ndrg1a-/-: p-value = 0.0224, *; 12 hr+re ox WT vs. ndrg1a-/-: p-value = 0.0118, *; 18 hr+re ox WT vs. ndrg1a-/-: p-value = 0.0001, ***). (C, right) Representative images of embryos in each phenotypic category (n=2–3 experiments with an average of 36 embryos per experimental group; Figure 2—source data 3). Scale bar 200 μm. (D) Lateral views of injected embryos were taken 3 and 24 hr post-injection (hpi). White boxes indicate where fluorescence measurements were taken. Scale bar 200 μm. (E) Quantification of kidney clearance assay using 24 hpf WT embryos and ndrg1a-/-mutants exposed to 12 hr of anoxia, followed by 2 days re-ox and injection with rhodamine dextran. A significant difference between WT and mutants was observed 24 hpi (unpaired t test; p-value < 0.0001, ****). (n=2 experiments with an average of 18 embryos per experiment; Figure 2—source data 4).
-
Figure 2—source data 1
Source data for % survival of WT embryos and ndrg1a-/- mutants immediately following 6, 12, 18, and 24 hr of anoxia exposure.
- https://cdn.elifesciences.org/articles/74031/elife-74031-fig2-data1-v2.zip
-
Figure 2—source data 2
Source data for % survival of WT embryos and ndrg1a-/- mutants following 6, 12, 18, and 24 hr of anoxia exposure and 2 days of re-oxygenation (re-ox).
- https://cdn.elifesciences.org/articles/74031/elife-74031-fig2-data2-v2.zip
-
Figure 2—source data 3
Source data for % edema observed in WT embryos and ndrg1a-/- mutants following 0, 6, 12, 18, and 24 hr of anoxia exposure and 2 days re-ox.
- https://cdn.elifesciences.org/articles/74031/elife-74031-fig2-data3-v2.zip
-
Figure 2—source data 4
Source data for kidney clearance assay using 48 hpf WT embryos and ndrg1a-/- mutants exposed to 12 hr of anoxia, followed by 2 days re-ox and injection with rhodamine dextran.
- https://cdn.elifesciences.org/articles/74031/elife-74031-fig2-data4-v2.zip
Figure 3 with 1 supplement
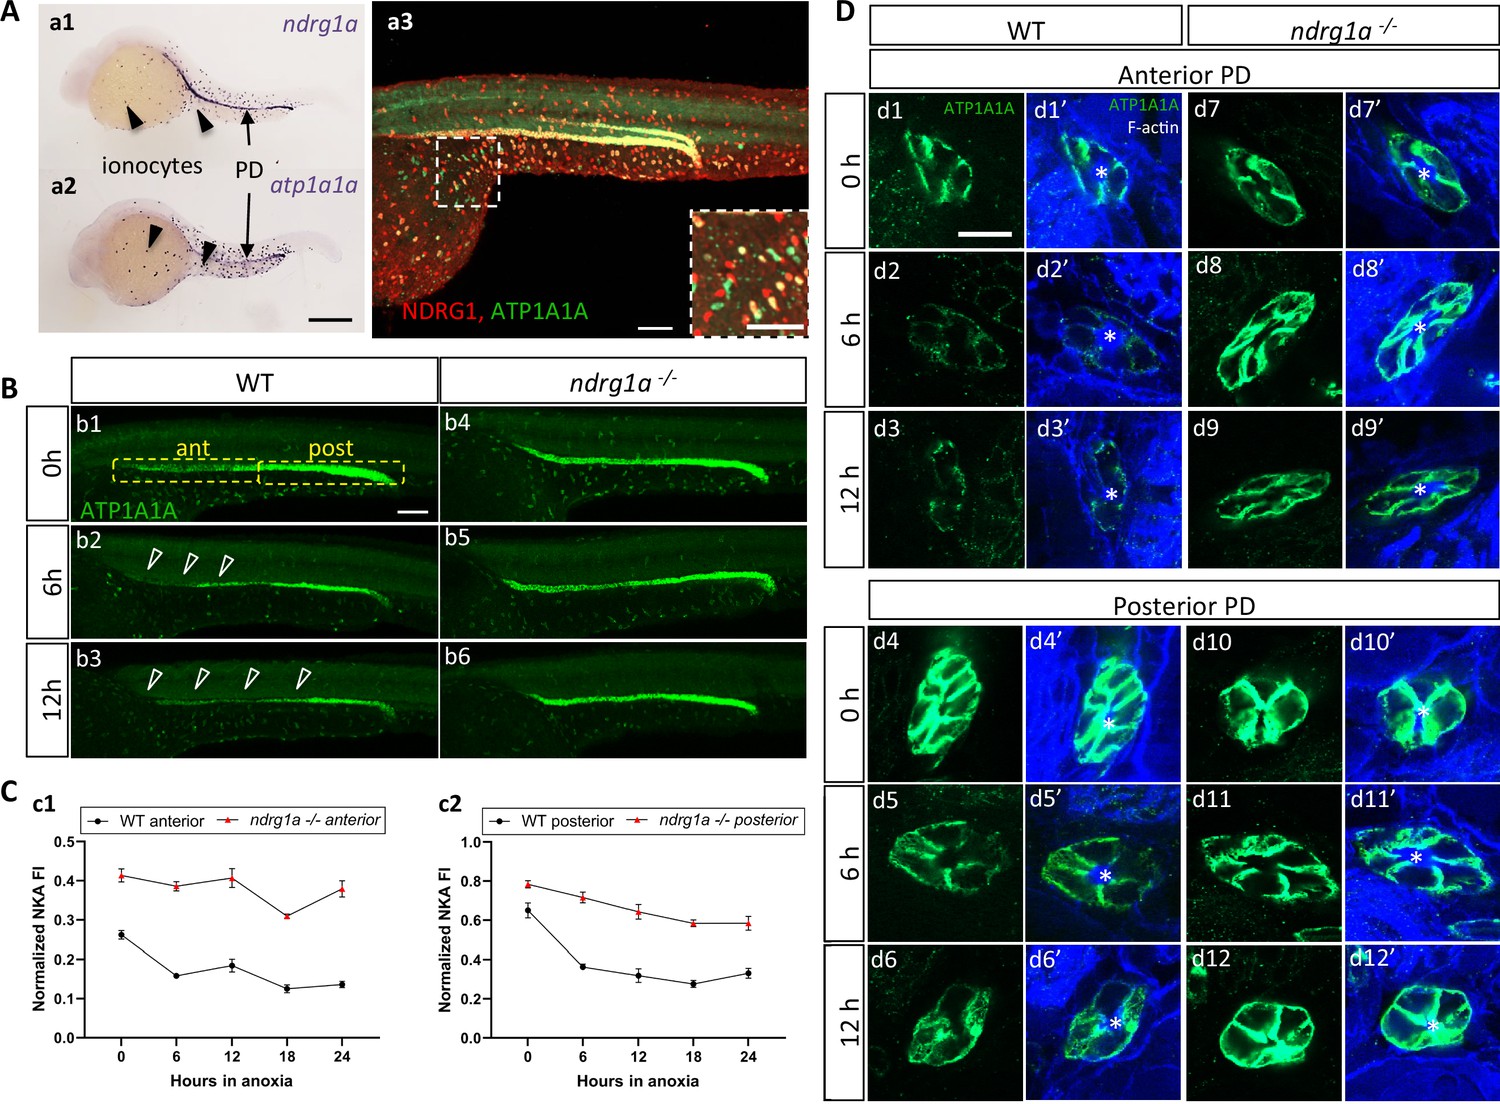
NKA downregulatation in the pronephric duct in response to anoxia is ndrg1a-dependent.
(A) Lateral views of 24 hpf WT embryos revealing (a.1,2) ndrg1a and atp1a1a transcript distribution using whole-mount in situ hybridization. (a.3) Ndrg1a and ATP1A1A protein distribution using double immunolabeling. Scale bars: a1, a2: 300 μm, a3: 100 μm for both wholemount and inset. (B) Lateral views of WT embryos and ndrg1a-/- mutants exposed at 24 hpf to increasing duration of anoxia: (b1, b4) 0 hr; (b2, b5) 6 hr; (b3, b6) 12 hr and immunolabeled to reveal ATP1A1A. (n=3 experiments with an average of 29 embryos processed per experiment). Scale bar 100 μm. Abbreviations: ant = anterior, post = posterior. Annotations: yellow boxes show where anterior and posterior pronephric duct measurements were taken. Arrowheads indicate decreased signal. (C) Normalized fluorescence intensity in the (c1) anterior and (c2) posterior pronephric duct of WT embryos and ndrg1a-/- mutants. Embryos were exposed at 24 hpf to increasing duration of anoxia (0, 6, 12, 18, and 24 hr) and immunolabeled to reveal ATP1A1A levels. (n=3 experiments with an average of 21 pronephros segments processed per experimental group; Figure 3—source data 1). (D) Cross-sections views of the anterior (d1-d3’, d7-d9’) and posterior (d4-d6’, d10-d12’) pronephric ducts in WT embryos (d1-d3’, d4-d6’) and ndrg1a-/- mutants (d7-d9’, d10-d12’), labeled with anti-ATP1A1A and phalloidin (F-actin). (n=3 experiments with an average of 61 pronephric duct cross-sections processed per experimental group). Scale bar 20 μm. Annotations: asterisks indicate the lumen (apical surface of PD cells).
-
Figure 3—source data 1
Source data for normalized fluorescence intensity in the (c1) anterior and (c2) posterior pronephric duct of WT embryos and ndrg1a-/- mutants.
- https://cdn.elifesciences.org/articles/74031/elife-74031-fig3-data1-v2.zip
Figure 3—figure supplement 1
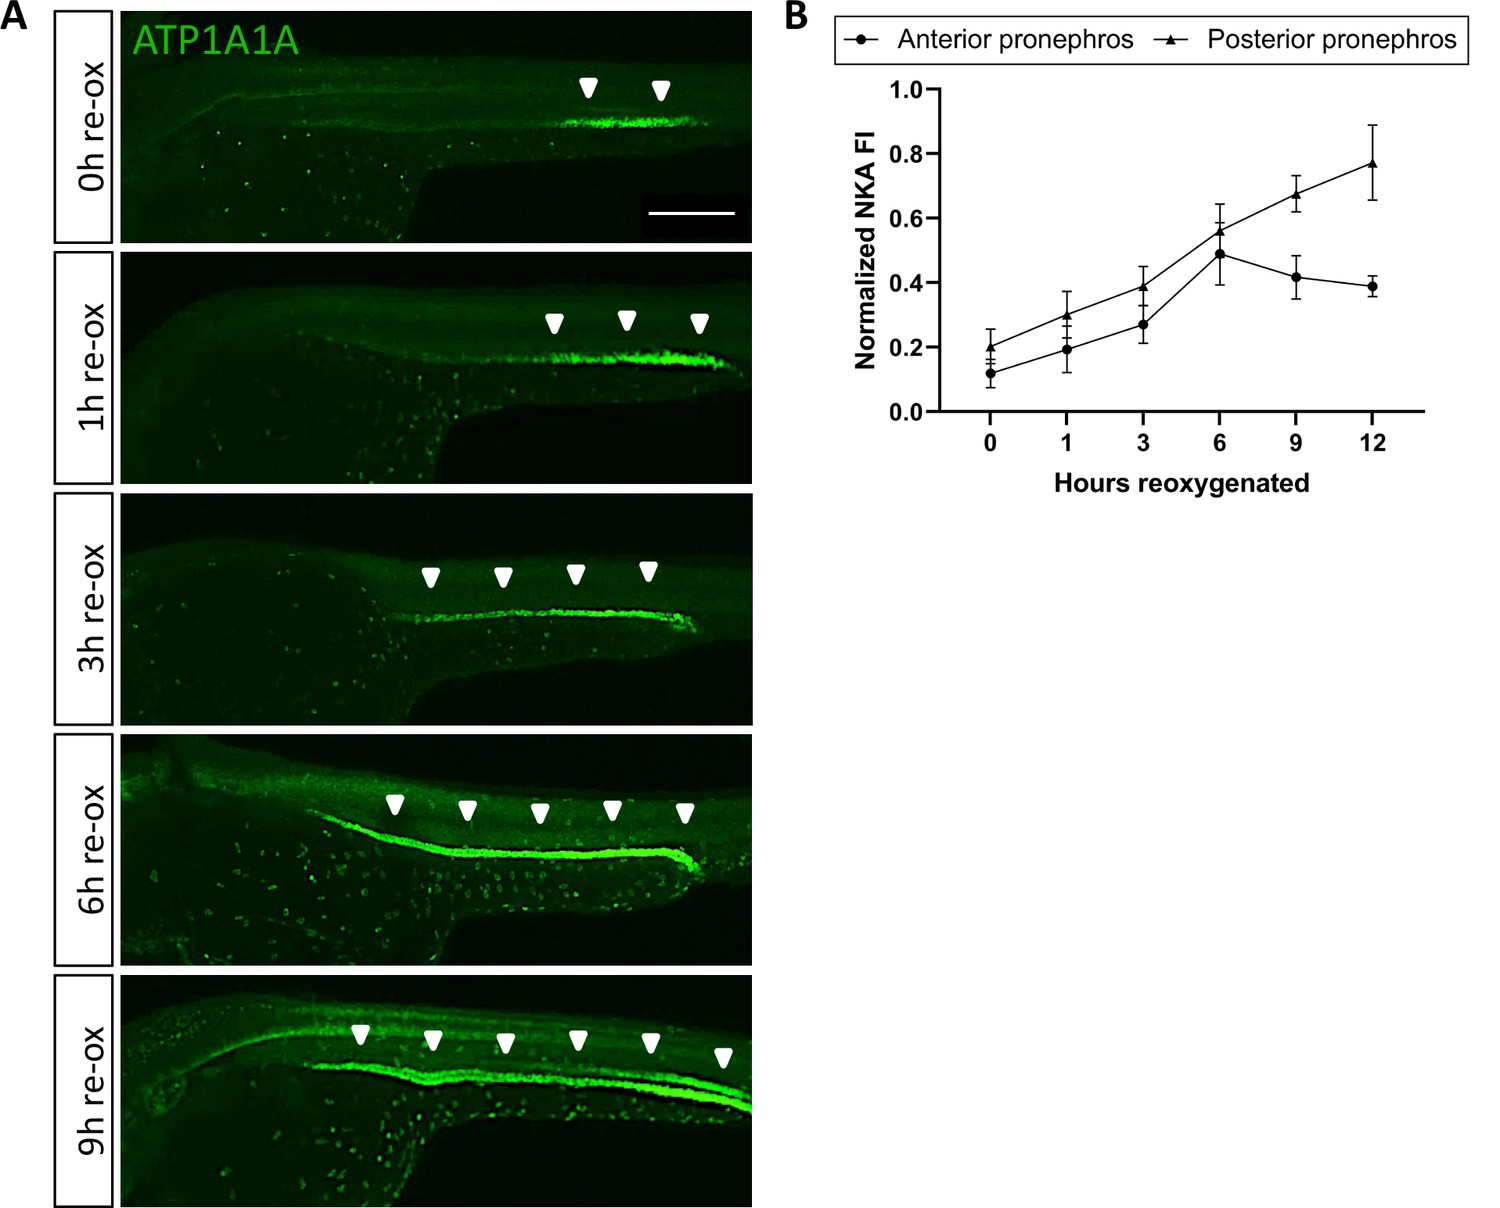
NKA downregulation is reversible upon reoxygenation.
(A) Lateral views of WT embryos exposed at 24 hpf to 18 hr of anoxia followed by 1, 3, 6, and 9 hr of re-oxygenation and immunolabeled with anti-ATP1A1A. (n=3 experiments with an average of 10 embryos processed per experimental group). Scale bar 200 μm. (B) Quantification of ATP1A1A levels during reoxygenation. (n=3 experiments with an average of 8 pronephros segments processed per experimental group; Figure 3—figure supplement 1—source data 1). Annotations: arrowheads point to NKA signal in the pronephric duct.
-
Figure 3—figure supplement 1—source data 1
Source data for quantification of ATP1A1A levels during reoxygenation.
- https://cdn.elifesciences.org/articles/74031/elife-74031-fig3-figsupp1-data1-v2.zip
Figure 4
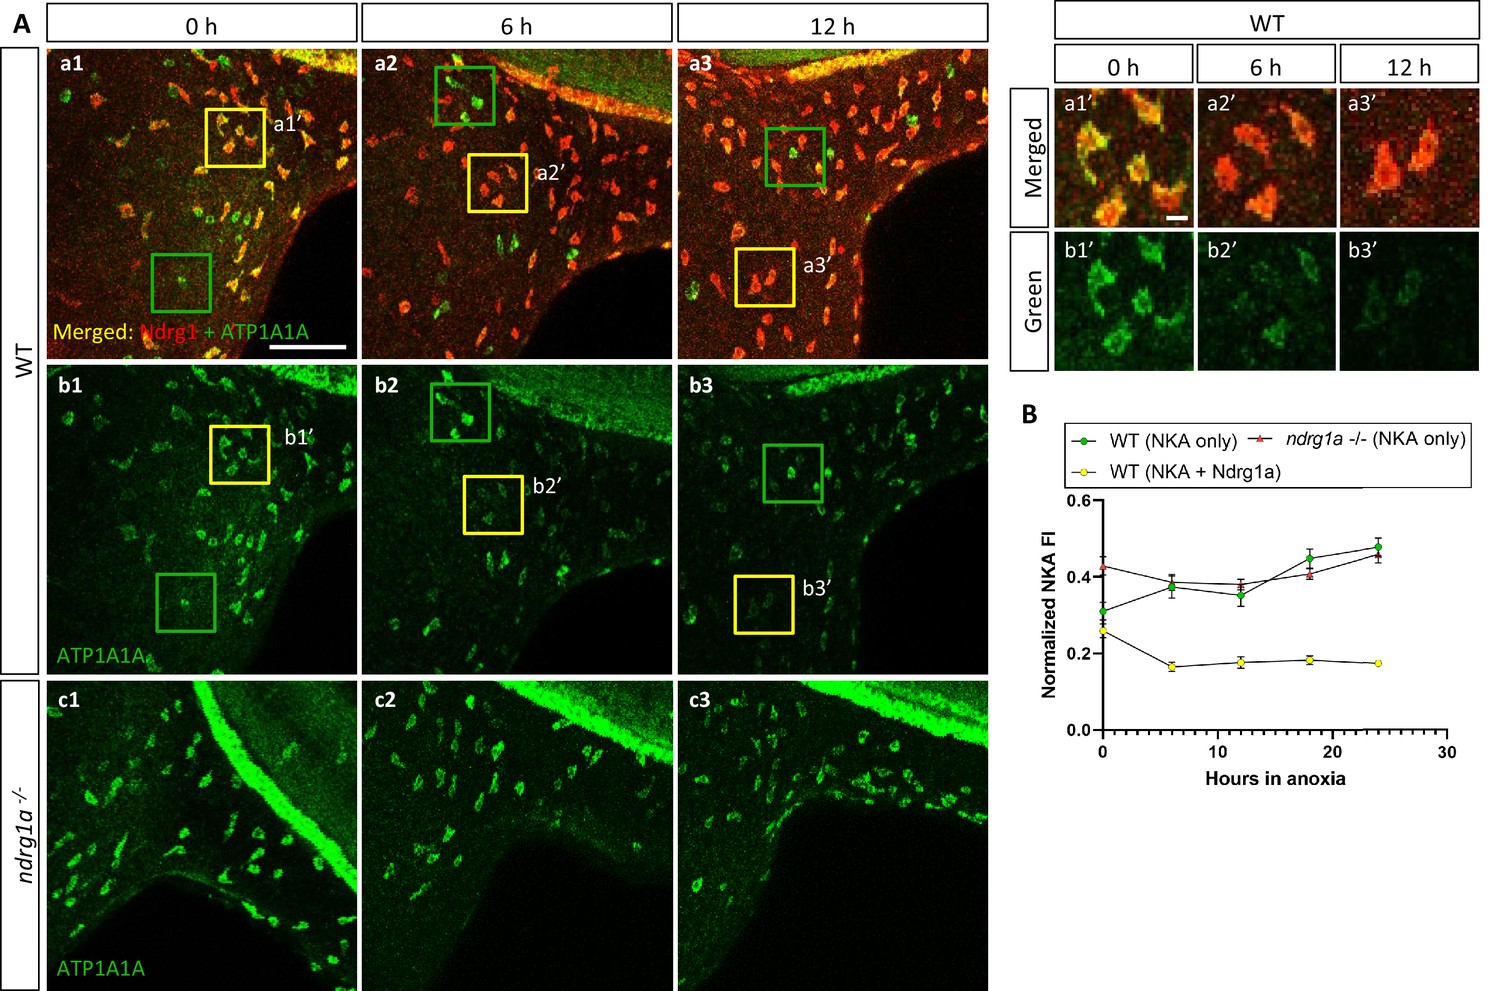
NKA is co-expressed with Ndrg1a in a subset of ionocytes and downregulated under anoxia in an ndrg1a-dependent manner.
(A, left) Lateral views of WT embryos (a1–b3) and ndrg1a-/- mutants (c1–c3) exposed to anoxia for 0 hr (a1–c1), 6 hr (a2–c2), 12 hr (a3–c3) and immunolabeled with anti-ATP1A1A (green) and anti-Ndrg1a (red); (a1–a3) show merged channels, while (b1–c3) show the green (ATP1A1A) channel only. Annotations: yellow and green boxes identify ionocytes that are positive for Ndrg1a and ATP1A1A (yellow) or ATP1A1A-only (green). Scale bar: a1: 100 μm; a1’: 2 μm. (A, right) Higher magnification images of yellow boxed in areas in (a1-b3), showing merged channels (a1’-a3’) and green channel only (b1’-b3’). (B) Normalized fluorescence intensity of ATP1A1A in ionocytes of WT embryos and ndrg1a-/- mutants exposed to anoxia for 0, 6, 12, 18, and 24 hr. (n=3 experiments with an average of 37 ionocytes processed per experimental group; Figure 4—source data 1).
-
Figure 4—source data 1
Source data for normalized fluorescence intensity of ATP1A1A in ionocytes of WT embryos and ndrg1a-/- mutants exposed to anoxia for 0, 6, 12, 18, and 24 hr.
- https://cdn.elifesciences.org/articles/74031/elife-74031-fig4-data1-v2.zip
Figure 5 with 1 supplement
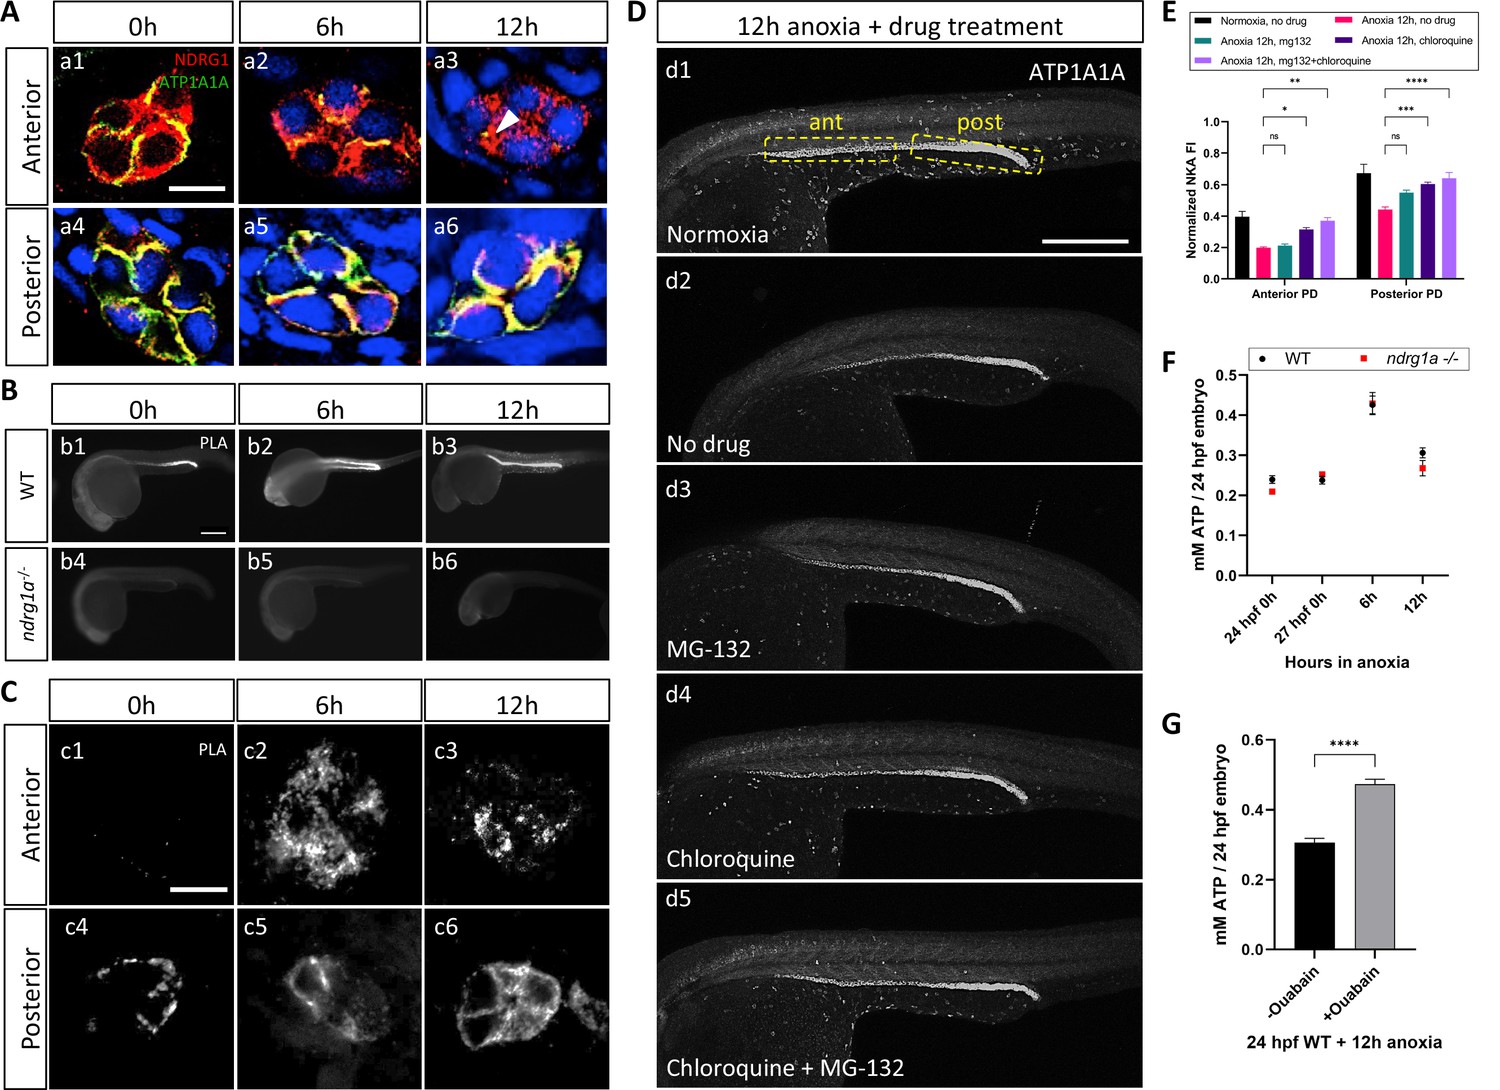
NKA interacts with Ndrg1a under anoxia and is degraded via lysosomal and proteasomal pathways to preserve ATP.
(A) Cross-sections of WT embryos exposed to anoxia for 0 hr (a1, a4), 6 hr (a2, a5), and 12 hr (a3, a6) and immunolabeled with anti-ATP1A1A (green) and anti-Ndrg1a (red). (a1–a3) Anterior pronephric duct. (a4–a6) Posterior pronephric duct. (n=3 experiments with an average of 33 pronephros sections processed per experimental group). Scale bar = 10 μm. (B) Lateral views of WT (b1–b3) and ndrg1a-/- (b4–b6) embryos labeled using whole-mount proximity ligation assay (PLA) to reveal Ndrg1a and ATP1A1A interaction. Embryos were exposed to 0 hr (b1, b4), 6 hr (b2, b5), and 12 hr (b3, b6) of anoxia (n=4 experiments with an average of 14 embryos processed per experimental group). Scale bar = 300 μm. (C) Cross-sections through the anterior (c1–c3) and posterior (c4–c6) pronephric duct of WT embryos treated as in (b1–b3) (n=2 experiments with an average of 23 pronephros sections processed per experimental group). Scale bar = 10 μm. (D) Lateral views of WT embryos exposed to 0 hr (d1) or 12 hr of anoxia (d2–d5) in presence or absence of MG-132 (100 μM, proteasome inhibitor), or Chloroquine (10 mM, autophagy inhibitor), or both and immunolabeled using anti-ATP1A1A. Annotation: yellow boxes show where anterior and posterior pronephric duct measurements were taken. Scale bar 200 μm. (E) Quantification of ATP1A1A fluorescence intensity in the pronephric duct of embryos subjected to the same anoxia and drug treatments as shown in (D). (Two-way ANOVA analysis was performed; Anterior PD: 7% increase in Anoxia 12 hr, mg132 vs Anoxia 12 hr, no drug p>0.9999 ns; 59% increase in Anoxia 12 hr, chloroquine vs Anoxia 12 hr, no drug p=0.0298 *; 87% increase in Anoxia 12 hr mg132 + chloroquine vs Anoxia 12 hr, no drug p=0.0013 **. Posterior PD: 24% increase in Anoxia 12 hr, mg132 vs Anoxia 12 hr, no drug p=0.0640 ns, 36% increase in Anoxia 12 hr, chloroquine vs Anoxia 12 hr, no drug p=0.0002 ***, 45% increase in Anoxia 12 hr mg132 + chloroquine vs Anoxia 12 hr, no drug p<0.0001 ****. (n=2 experiments, representative data shown for 1 experiment with an average of 14 pronephros segments processed per experimental group; Figure 5—source data 1). (F) Quantification of total ATP concentration per WT embryo or ndrg1a-/- mutant exposed to 0 (24 hpf or 27 hpf developmental stage control), 6, 12 hr of anoxia. No significant difference between WT and mutants were observed. Two-way ANOVA analysis was performed; 0 hr (24 hpf) WT vs. ndrg1a-/-: p-value = 0.9553, ns; 0 hr (27 hpf developmental stage control) WT vs. ndrg1a-/-: p value => 0.9999, ns; 6 h WT vs. ndrg1a-/-: p value => 0.9999, ns; 12 hr WT vs. ndrg1a-/-: p-value = 0.7652, ns). (n=5 experiments with an average of 15–20 embryos per experimental group; Figure 5—source data 2). (G) Quantification of total ATP concentration per WT embryo under anoxia either treated with or without 3 mM of ouabain. (Unpaired t test was performed; WT + Ouabain and Anoxia vs. WT + Anoxia only: p value =< 0.0001, ****; Figure 5—source data 3).
-
Figure 5—source data 1
Source data for quantification of ATP1A1A fluorescence intensity in the pronephric duct of embryos subjected to 0 hr (d1) or 12 hr of anoxia (d2–d5) in presence or absence of MG-132, or chloroquine, or both and immunolabeled using anti-ATP1A1A.
- https://cdn.elifesciences.org/articles/74031/elife-74031-fig5-data1-v2.zip
-
Figure 5—source data 2
Source data for quantification of total ATP concentration per WT embryo or ndrg1a-/- mutant exposed to 0, 6, 12 hr of anoxia.
- https://cdn.elifesciences.org/articles/74031/elife-74031-fig5-data2-v2.zip
-
Figure 5—source data 3
Source data for quantification of total ATP concentration per WT embryo exposed to 12 hr of anoxia with or without ouabain.
- https://cdn.elifesciences.org/articles/74031/elife-74031-fig5-data3-v2.zip
Figure 5—figure supplement 1
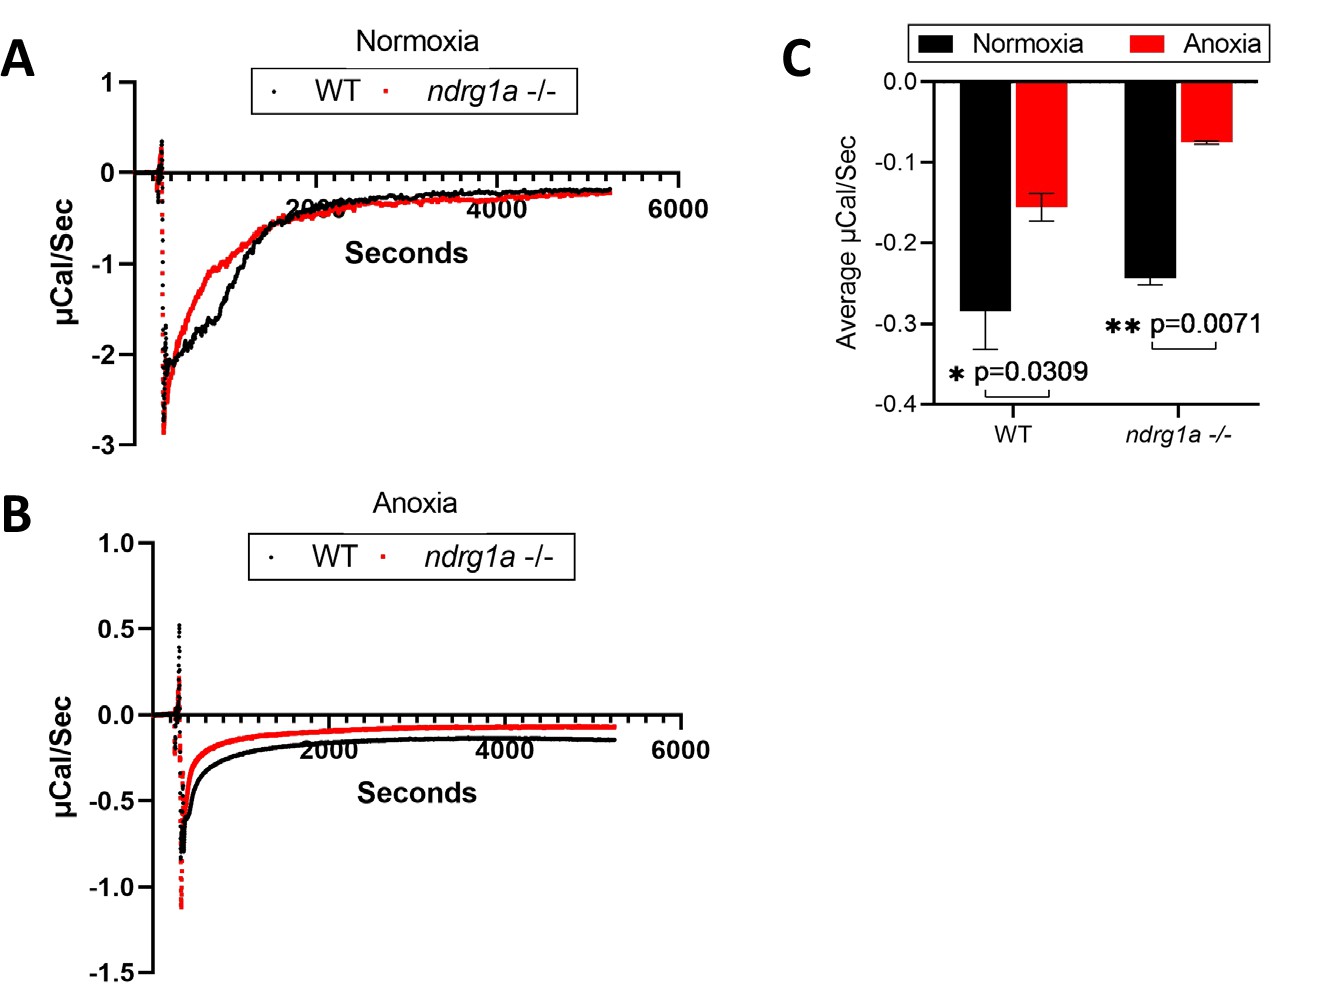
Isothermal calorimetry (ITC) of WT and ndrg1a-/- mutant embryos exposed to prolonged anoxia.
(A) A representative ITC run of WT and ndrg1a-/- mutant embryos under normoxia. (n=3 experiments with 15 embryos per experimental group). (B) A representative ITC run of WT and ndrg1a-/- mutant embryos under 24 hr of anoxia (n=3 experiments with 2 experiments with 15 embryos per experimental group and 1 experiment with 13 embryos per experimental group). (C) A quantitative comparison of the average microCal/sec (DP values) between normoxia vs. anoxia within either WT or ndrg1a-/- mutant genotypes (Two-way ANOVA analysis was performed; WT (normoxia) vs. WT (anoxia): p=0.0309, *; ndrg1a-/- mutant (normoxia) vs. ndrg1a-/- mutant (anoxia): p=0.0071, **). Figure 5—figure supplement 1—source data 1.
-
Figure 5—figure supplement 1—source data 1
Source data for ITC experiments.
- https://cdn.elifesciences.org/articles/74031/elife-74031-fig5-figsupp1-data1-v2.zip
Figure 6

Lactate concentration increases under anoxia.
(A graph) Metabolites enriched in anoxia-treated embryos relative to normoxic controls. X axis: metabolite levels (integrated ion counts) in extracts from 5 hpf embryos exposed to 1 hr of anoxia; Y axis: metabolite levels (integrated ion counts) in extracts from age-matched 5 hpf normoxic controls. The red lines show the predicted correlation line (99% confidence). Blue lines demarcate outliers (99% confidence). Three potential outliers (a, b and c) were identified (n=10 embryos per sample and 2 technical repeats). (A, insert, top left) Identity of the three outliers (a–c) that are significantly enriched in the anoxia-treated sample. (B) Extracted ion counts for different elution timepoints are shown for two extracts from 5 hpf embryos exposed to 1 hr of anoxia (orange and red lines) and two control samples from 5 hpf normoxic embryos (yellow and green lines). The peak corresponds to lactate. (C) Comparison of lactate levels (highest peak intensity) in extracts from 5 hpf embryo exposed to 1 hr of anoxia and 5 hpf normoxic controls reveals an 18 fold increase (unpaired t test; p<0.01);Figure 6—source data 1A-C . (D) Fluorometric lactate assay quantification of total lactate concentration (in nmol lactate) per WT embryo or ndrg1a-/- mutant exposed to 0 (24 hpf or 27 hpf developmental stage control), 1, 3, 6, 12 hr of anoxia. No significant difference between WT and mutants were observed. Two-way ANOVA analysis was performed; 0 hr (24 hpf) WT vs. ndrg1a-/-: p value => 0.9999, ns; 0 hr (27 hpf developmental stage control) WT vs. ndrg1a-/-: p value => 0.9999, ns; 1 hr WT vs. ndrg1a-/-: p value => 0.9999, ns; 3 hr WT vs. ndrg1a-/-: p value => 0.9999, ns; 6 hr WT vs. ndrg1a-/-: p value = 0.9870, ns; 12 hr WT vs. ndrg1a-/-: p value => 0.9999, ns. (n=4 experiments with an average of 15 embryos per experimental group; Figure 6—source data 2). (E) Alignment of members of the NDRG family revealing lactate-docking residues, identified in NDRG3 by Lee et al., 2015. Green and red residues represent amino acids in NDRG3 that are 5 ångström from lactate. Red residues represent amino acids that may be critical for the interaction between NDRG3 and lactate.
-
Figure 6—source data 1
Source data for Figure 6.
Figure 6A: Metabolites enriched in anoxia-treated embryos relative to normoxic controls; Figure 6B: Extracted ion counts for different elution timepoints are shown for two extracts from 5 hpf embryos exposed to 1 hr of anoxia (orange and red lines) and two control samples from 5 hpf normoxic embryos (yellow and green lines); Figure 6C: Comparison of lactate levels (highest peak intensity) in extracts from 5 hpf embryo exposed to 1 hr of anoxia and 5 hpf normoxic controls reveals an 18 fold increase.
- https://cdn.elifesciences.org/articles/74031/elife-74031-fig6-data1-v2.zip
-
Figure 6—source data 2
Source data for fluorometric lactate assay showing lactate concentration (nmol lactate/embryo) in whole embryo extracts from 24 hpf WT or ndrg1a-/- mutant exposed to 0, 1, 3, 6, 12 hr of anoxia.
- https://cdn.elifesciences.org/articles/74031/elife-74031-fig6-data2-v2.zip
Figure 7
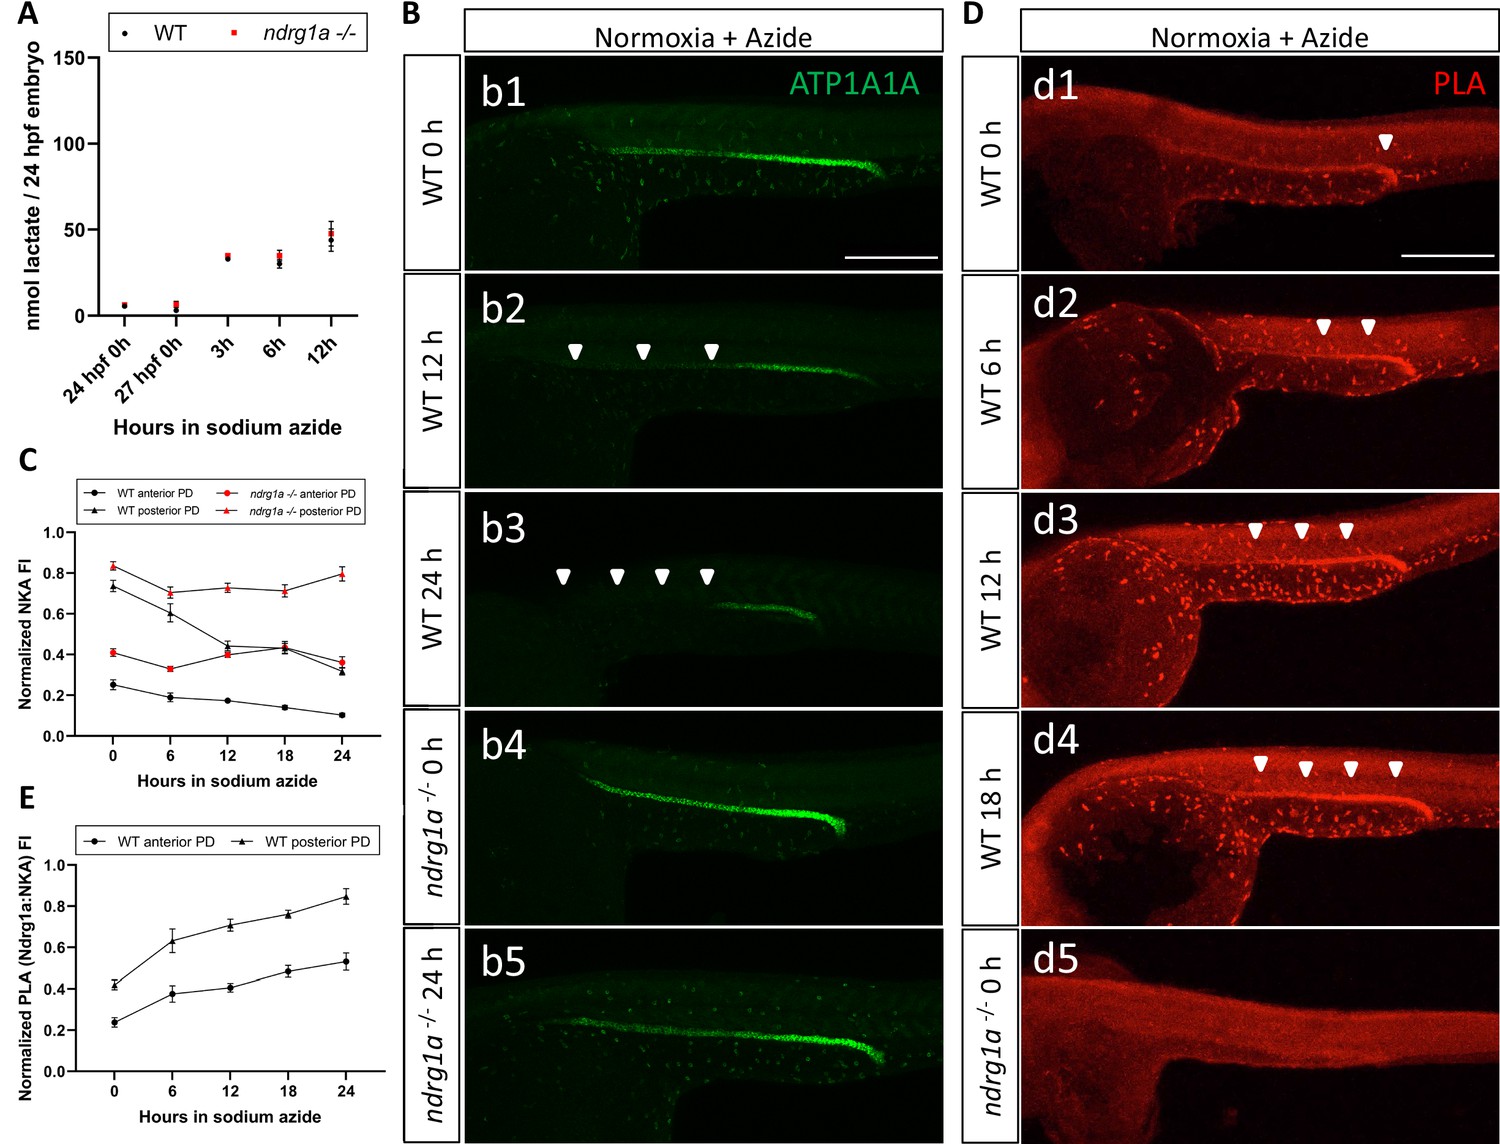
Lactate concentration increases following sodium azide treatment under normoxia and correlates with ATP1A1A downregulation.
(A) Fluorometric lactate assay quantification of total lactate concentration (in nmol lactate) per WT embryo or ndrg1a-/- mutant exposed to 0 (24 hpf or 27 hpf developmental stage control), 3, 6, 12 hr of 300 uM of azide. No significant difference between WT and mutants were observed. Two-way ANOVA analysis was performed; 0 hr (24 hpf) WT vs. ndrg1a-/-: p value => 0.9999, ns; 0 hr (27 hpf developmental stage control) WT vs. ndrg1a-/-: p-value = 0.9994, ns; 3 hr WT vs. ndrg1a-/-: p value => 0.9999, ns; 6 hr WT vs. ndrg1a-/-: p-value = 0.9919, ns; 12 hr WT vs. ndrg1a-/-: p-value = 0.9986, ns. (n=4 experiments with an average of 15 embryos per experimental group; Figure 7—source data 1). (B) Lateral views of WT embryos and ndrg1a-/- mutants exposed at 24 hpf to increasing duration of azide under normoxia: (b1-5); 0 hr (b1, b4), 12hr (b2), 24 hr (b3, b5) and immunolabeled to reveal ATP1A1A. Arrowheads indicate decreased signal. (n=3 experiments with an average of 10 embryos processed per experimental group). Scale bar 300 μm. (C) Normalized NKA fluorescence intensity in the anterior (circle) and posterior (triangle) pronephric duct of WT (black) embryos and ndrg1a-/- (red) mutants. Embryos were exposed at 24 hpf to increasing duration of azide under normoxia (0, 6, 12, 18, and 24 hr) and immunolabeled to reveal ATP1A1A levels (n=2 experiments with an average of 19 pronephros segments processed per experimental group; Figure 7—source data 2). (D) Lateral views of WT embryos (d1-4) and an ndrg1a-/- mutant (d5) labeled using whole-mount proximity ligation assay (PLA) to reveal Ndrg1a and ATP1A1A interaction. Embryos were raised under normoxic conditions in the presence (6, 12, 18, 24 hr exposure) or absence of sodium azide. Annotations: arrowheads point to PLA signal (n=4 experiments with an average of 10 embryos processed per experimental group). Scale bar 300 μm. (E) Normalized PLA intensity in the anterior (circle) and posterior (triangle) pronephric duct of WT embryo. (n=2 experiments with an average of 16 pronephros segments processed per experimental group; Figure 7—source data 3).
-
Figure 7—source data 1
Source data for fluorometric lactate assay showing lactate concentration (nmol lactate/embryo) in whole embryo extracts from 24 hpf WT or ndrg1a-/- mutant exposed to sodium azide for 0, 3, 6, 12 hr under normoxia.
- https://cdn.elifesciences.org/articles/74031/elife-74031-fig7-data1-v2.zip
-
Figure 7—source data 2
Source data for normalized NKA fluorescence intensity in the anterior (circle) and posterior (triangle) pronephric duct of WT (black) embryos and ndrg1a-/- (red) mutants.
- https://cdn.elifesciences.org/articles/74031/elife-74031-fig7-data2-v2.zip
-
Figure 7—source data 3
Source data for normalized PLA intensity in the anterior (circle) and posterior (triangle) pronephric duct of WT embryo.
- https://cdn.elifesciences.org/articles/74031/elife-74031-fig7-data3-v2.zip
Tables
Author response table 1
Distance between anterior pronephric tubules.
| Image | Trial | Distance | Conversion to micron |
|---|---|---|---|
| Snap15 | 1 | 2.005 | 119.06091 |
| 2 | 2.029 | 120.486078 | |
| 3 | 2.003 | 118.942146 | |
| Snap63 | 1 | 1.804 | 107.125128 |
| 2 | 1.835 | 108.96597 | |
| 3 | 1.814 | 107.718948 | |
| Snap137 | 1 | 1.888 | 112.113216 |
| 2 | 1.889 | 112.172598 | |
| 3 | 1.892 | 112.350744 | |
| Snap252 | 1 | 1.142 | 67.814244 |
| 2 | 1.142 | 67.814244 | |
| 3 | 1.153 | 68.467446 | |
| Snap261 | 1 | 1.296 | 76.959072 |
| 2 | 1.278 | 75.890196 | |
| 3 | 1.264 | 75.058848 | |
| Snap304 | 1 | 1.391 | 82.600362 |
| 2 | 1.381 | 82.006542 | |
| 3 | 1.377 | 81.769014 | |
| Average | 1.58794 | 94.29505308 |
Author response table 2
Distance between posterior pronephric tubules.
| Image | Trial | Distance | Conversion to micron |
|---|---|---|---|
| Snap20 | 1 | 0.799 | 47.446218 |
| 2 | 0.813 | 48.277566 | |
| 3 | 0.815 | 48.39633 | |
| Snap96 | 1 | 0.859 | 51.009138 |
| 2 | 0.85 | 50.4747 | |
| 3 | 0.889 | 52.790598 | |
| Snap126 | 1 | 0.681 | 40.439142 |
| 2 | 0.669 | 39.726558 | |
| 3 | 0.687 | 40.795434 | |
| Snap237 | 1 | 0.979 | 58.134978 |
| 2 | 0.969 | 57.541158 | |
| 3 | 0.959 | 56.947338 | |
| Snap282 | 1 | 0.94 | 55.81908 |
| 2 | 0.926 | 54.987732 | |
| 3 | 0.928 | 55.106496 | |
| Snap329 | 1 | 0.62 | 36.81684 |
| 2 | 0.593 | 35.213526 | |
| 3 | 0.616 | 36.579312 | |
| Average | 0.81067 | 48.13920594 |
Additional files
Download links
A two-part list of links to download the article, or parts of the article, in various formats.
Downloads (link to download the article as PDF)
Open citations (links to open the citations from this article in various online reference manager services)
Cite this article (links to download the citations from this article in formats compatible with various reference manager tools)
N-myc downstream regulated gene 1 (ndrg1) functions as a molecular switch for cellular adaptation to hypoxia
eLife 11:e74031.
https://doi.org/10.7554/eLife.74031


