The transcription factor Xrp1 is required for PERK-mediated antioxidant gene induction in Drosophila
- NYU Grossman School of Medicine, United States
Figures
Figure 1 with 1 supplement
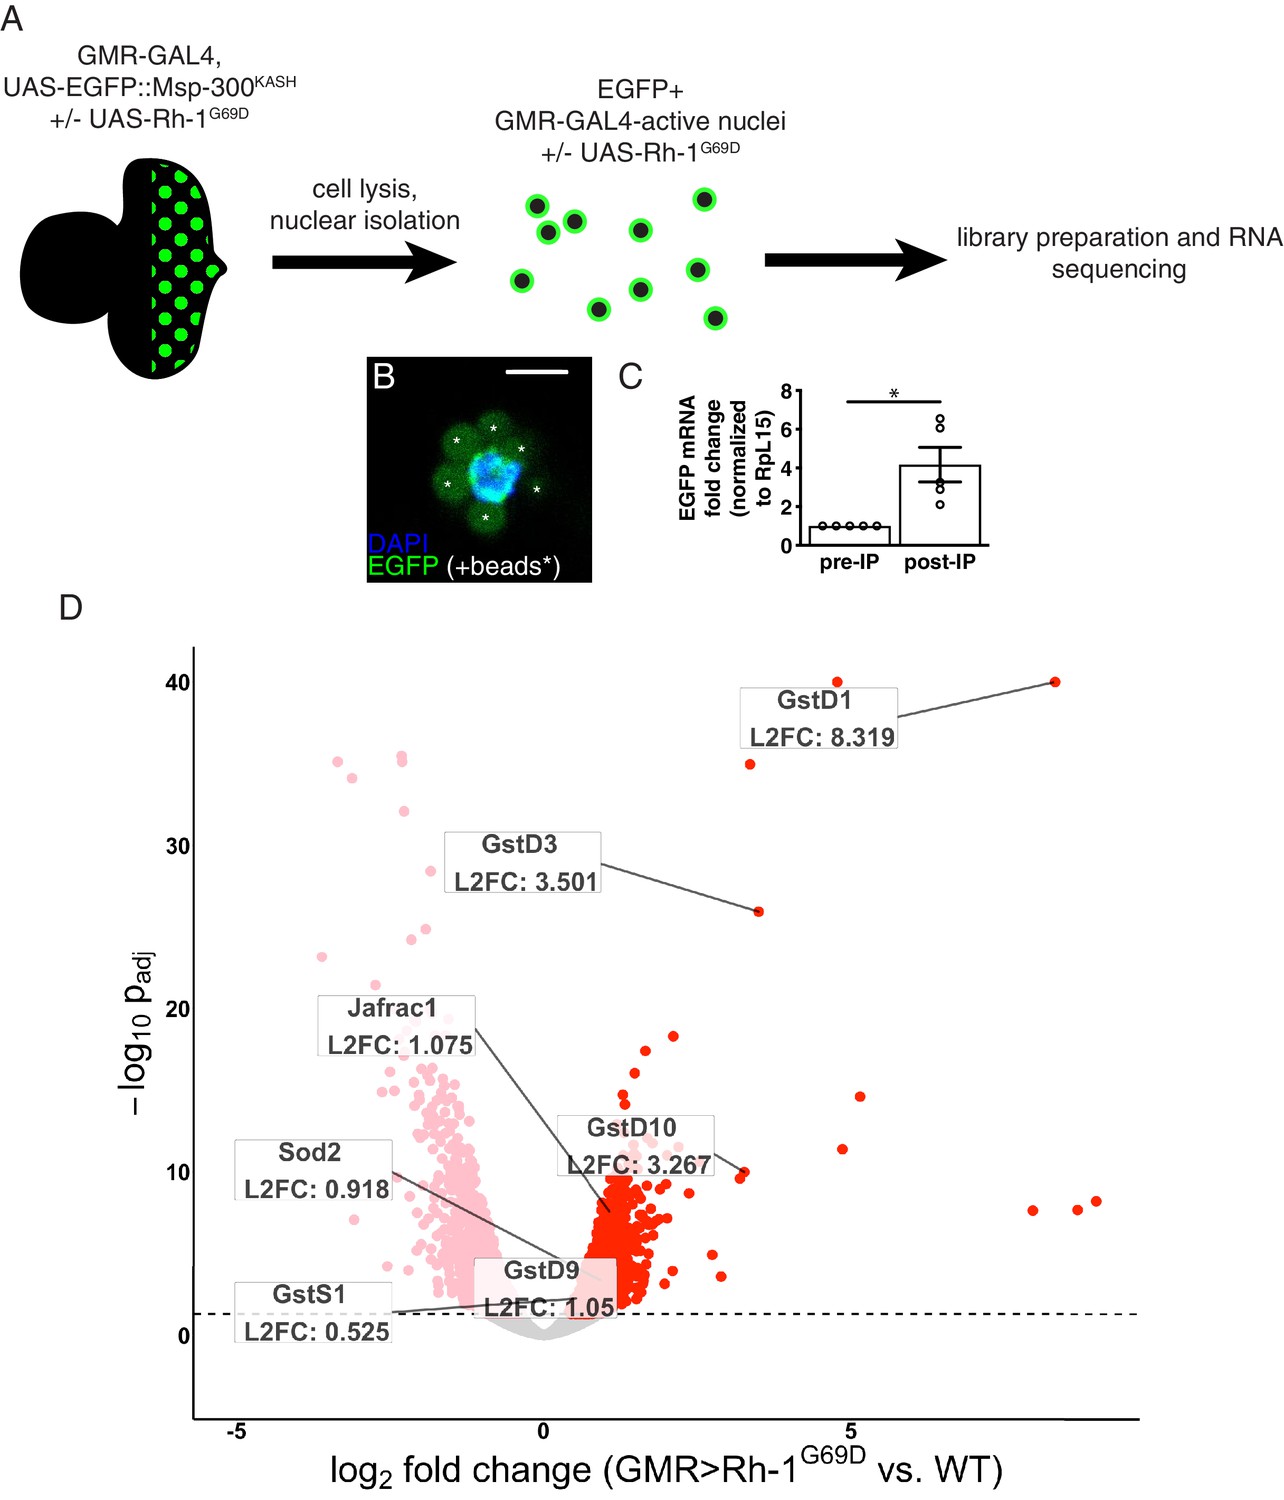
RNA-sequencing reveals upregulation of antioxidant genes in response to ER stress.
(A) Workflow for isolation of tagged nuclei from eye imaginal discs and preparation of total RNA for transcriptional profiling. (B) A representative image of an isolated, EGFP-tagged nucleus. Asterisks label auto-fluorescent anti-EGFP-coupled beads. Scale bar = 5 µm. (C) Representative qRT-PCR of pre- and post-isolation disc nuclei showing a significant enrichment of EGFP mRNA following isolation. The error bar represents standard error (SE). Statistical significance was assessed through a two tailed t-test. * = p < 0.05. (D) Volcano plot of genes differentially expressed in the presence or absence of Rh1G69D expression. Genes significantly up/downregulated in response to Rh1G69D are shown in red and pink, respectively. A select set of antioxidant genes induced by Rh1G69D are labeled with their log2 fold change values. Note: -log10 padj of gstD1 exceeded the bounds of the graph (180) and was constrained to the maximum displayed value of 40 for readability.
Figure 1—figure supplement 1
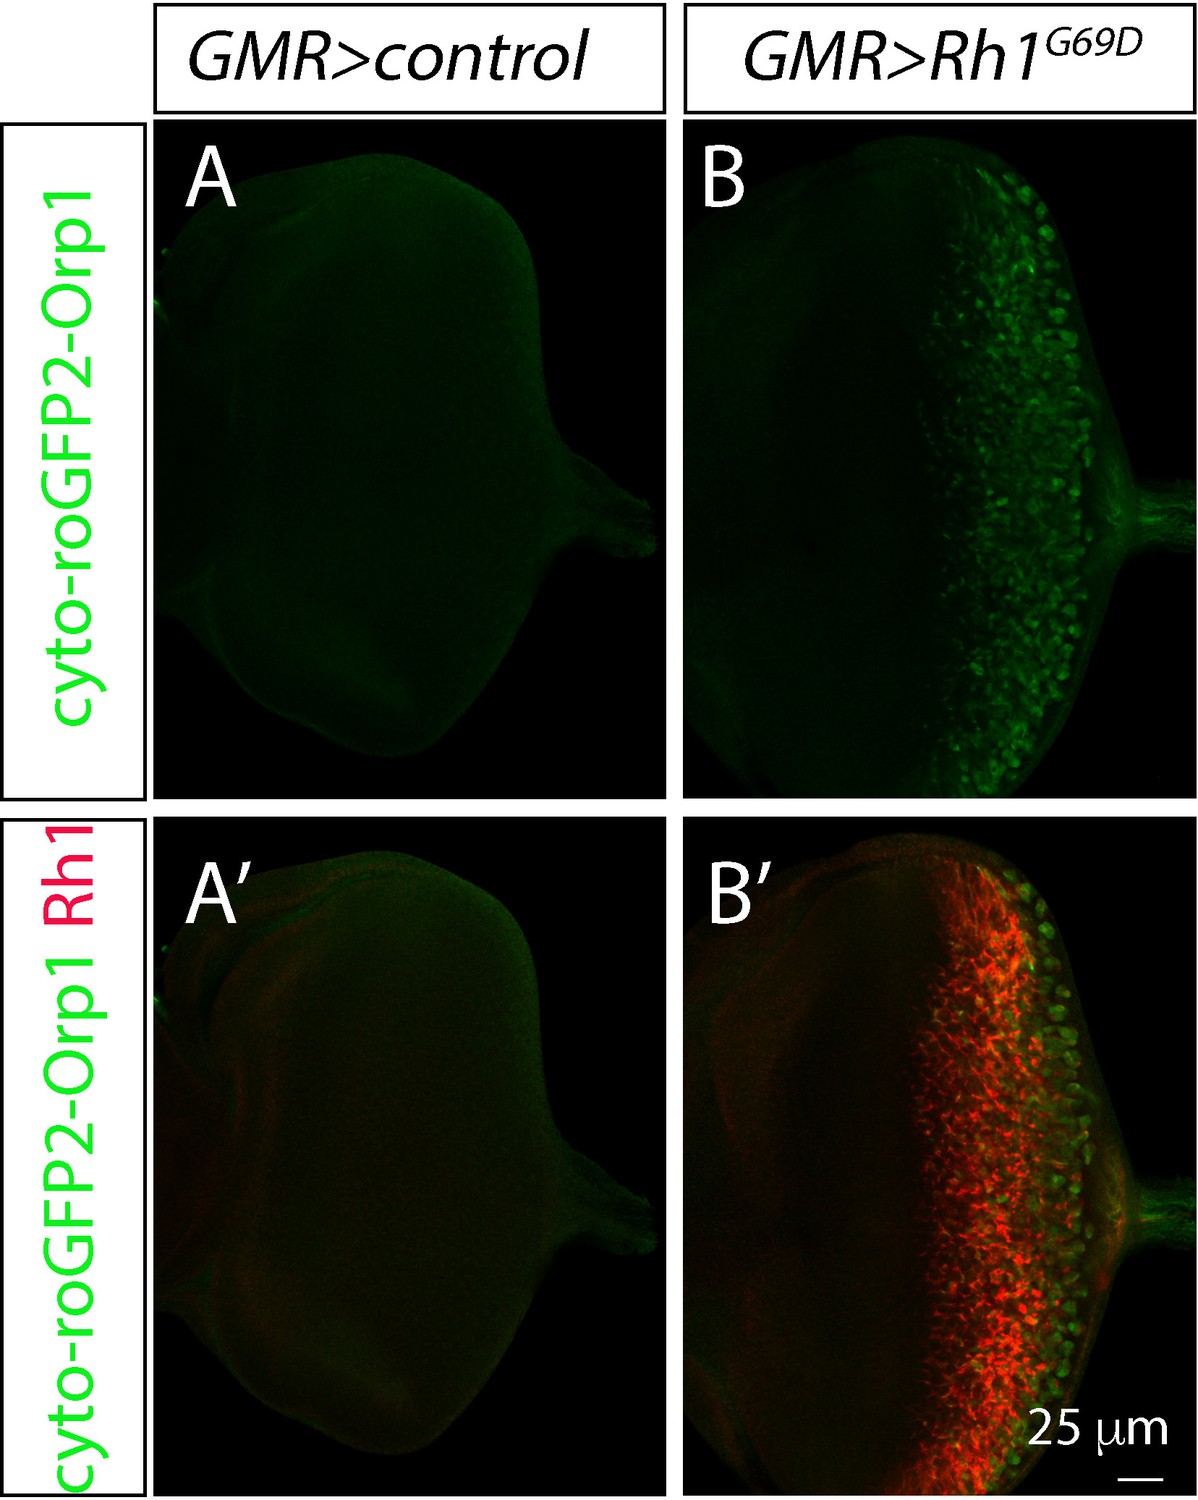
Evidence for ROS build up in eye discs expressing Rh1G69D.
Representative eye imaginal discs expressing the cytosolic ROS sensor cyto-roGFP2-Orp1. The expression of this reporter was driven by GMR-Gal4 either alone (A), or together with UAS-Rh1G69D. (A, B) show GFP single channel images, and (A’, B’) show merged channels with anti-Rh1 (red).
Figure 2 with 3 supplements
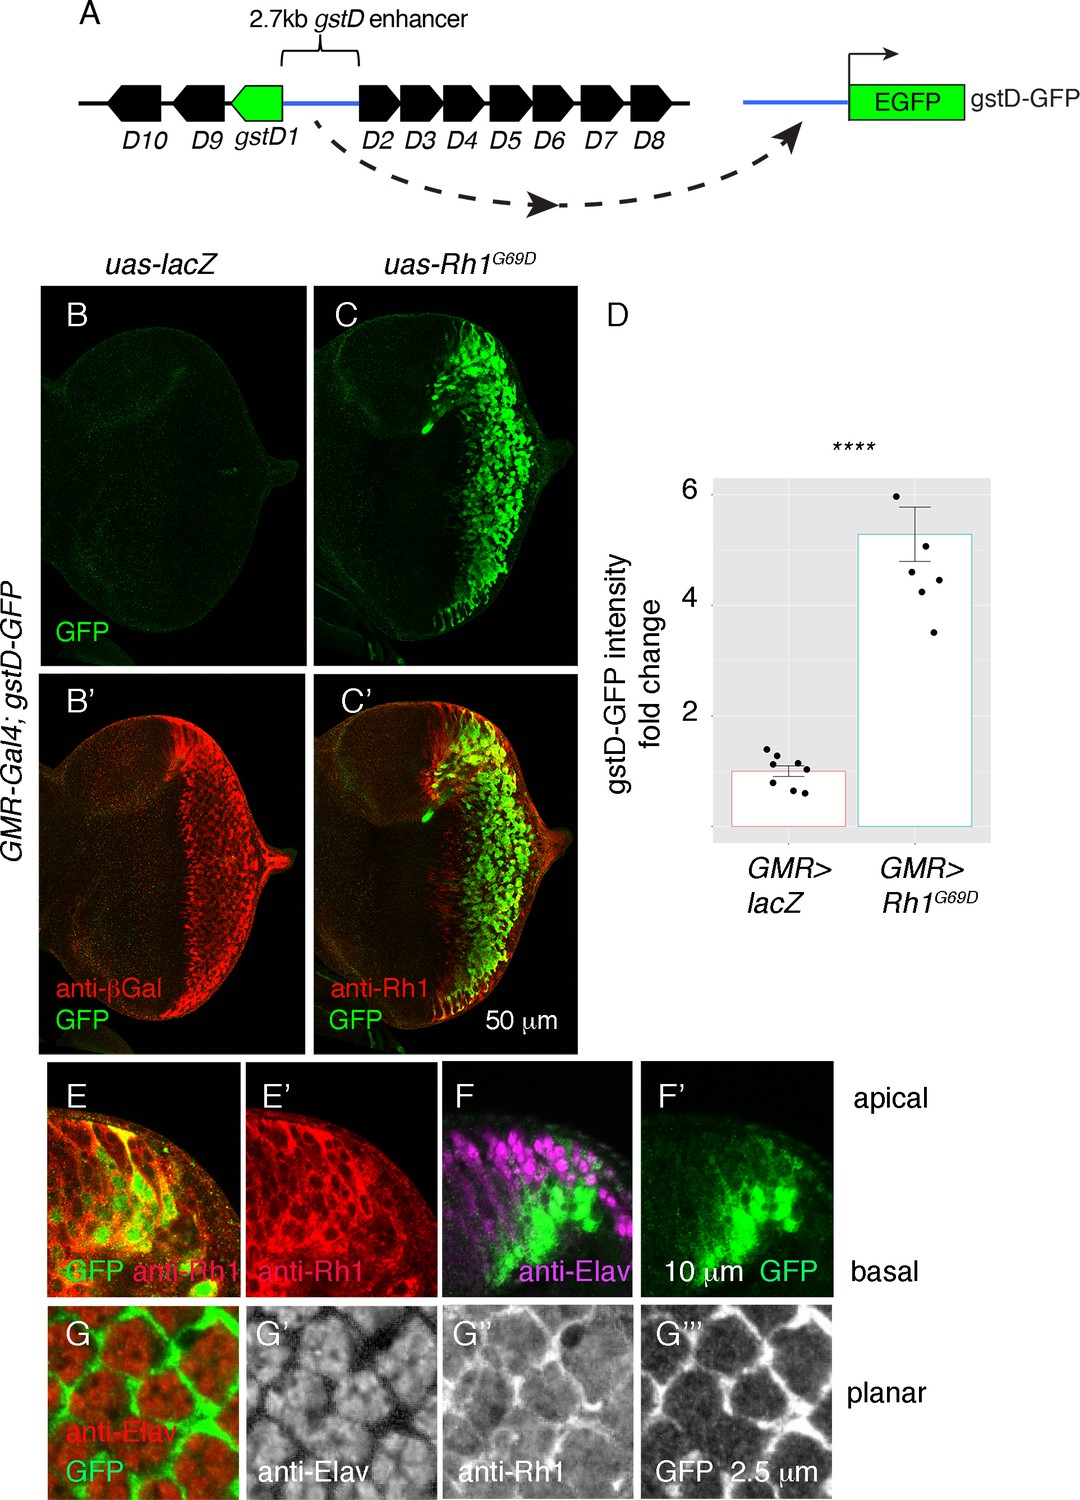
ER stress induces gstD-GFP expression in the eye imaginal disc.
(A) Schematic of the gstD-GFP reporter and the gstD locus, which encodes multiple gstD isozymes in close proximity to the 2.7 kb gstD1/gstD2 intergenic enhancer (scale is approximate). (B–C) Planar views of gstD-GFP larval eye discs also expressing either lacZ or Rh1G69D driven by GMR-Gal4. (B’, C’) show merged images of discs with gstD-GFP expression in green, and Rh1 or lacZ in red. (B, C) show only the green channel. Anterior is to the left and posterior to the right. Scale bar = 50 μm. (D) Quantification of gstD-GFP pixel intensity fold change from eye discs with the indicated genotypes. Statistical significance based on t test (two tailed). **** = p < 0.0001. (E, F) A magnified view of GMR > Rh1G69D eye discs in apico-basal orientation. gstD-GFP signals are marked in green. (E) Posterior eye disc double labeled with anti-Rh1 (red). (F) An equivalent region labeled with anti-Elav antibody that marks photoreceptors (magenta). Scale bar = 10 μm (G) A magnified view of GMR > Rh1G69D eye discs in planar orientation with gstD-GFP (green) and anti-Elav labeling (red). Individual channels are shown separately in (G’ – G’’’). Scale bar = 2.5 µm.
Figure 2—figure supplement 1
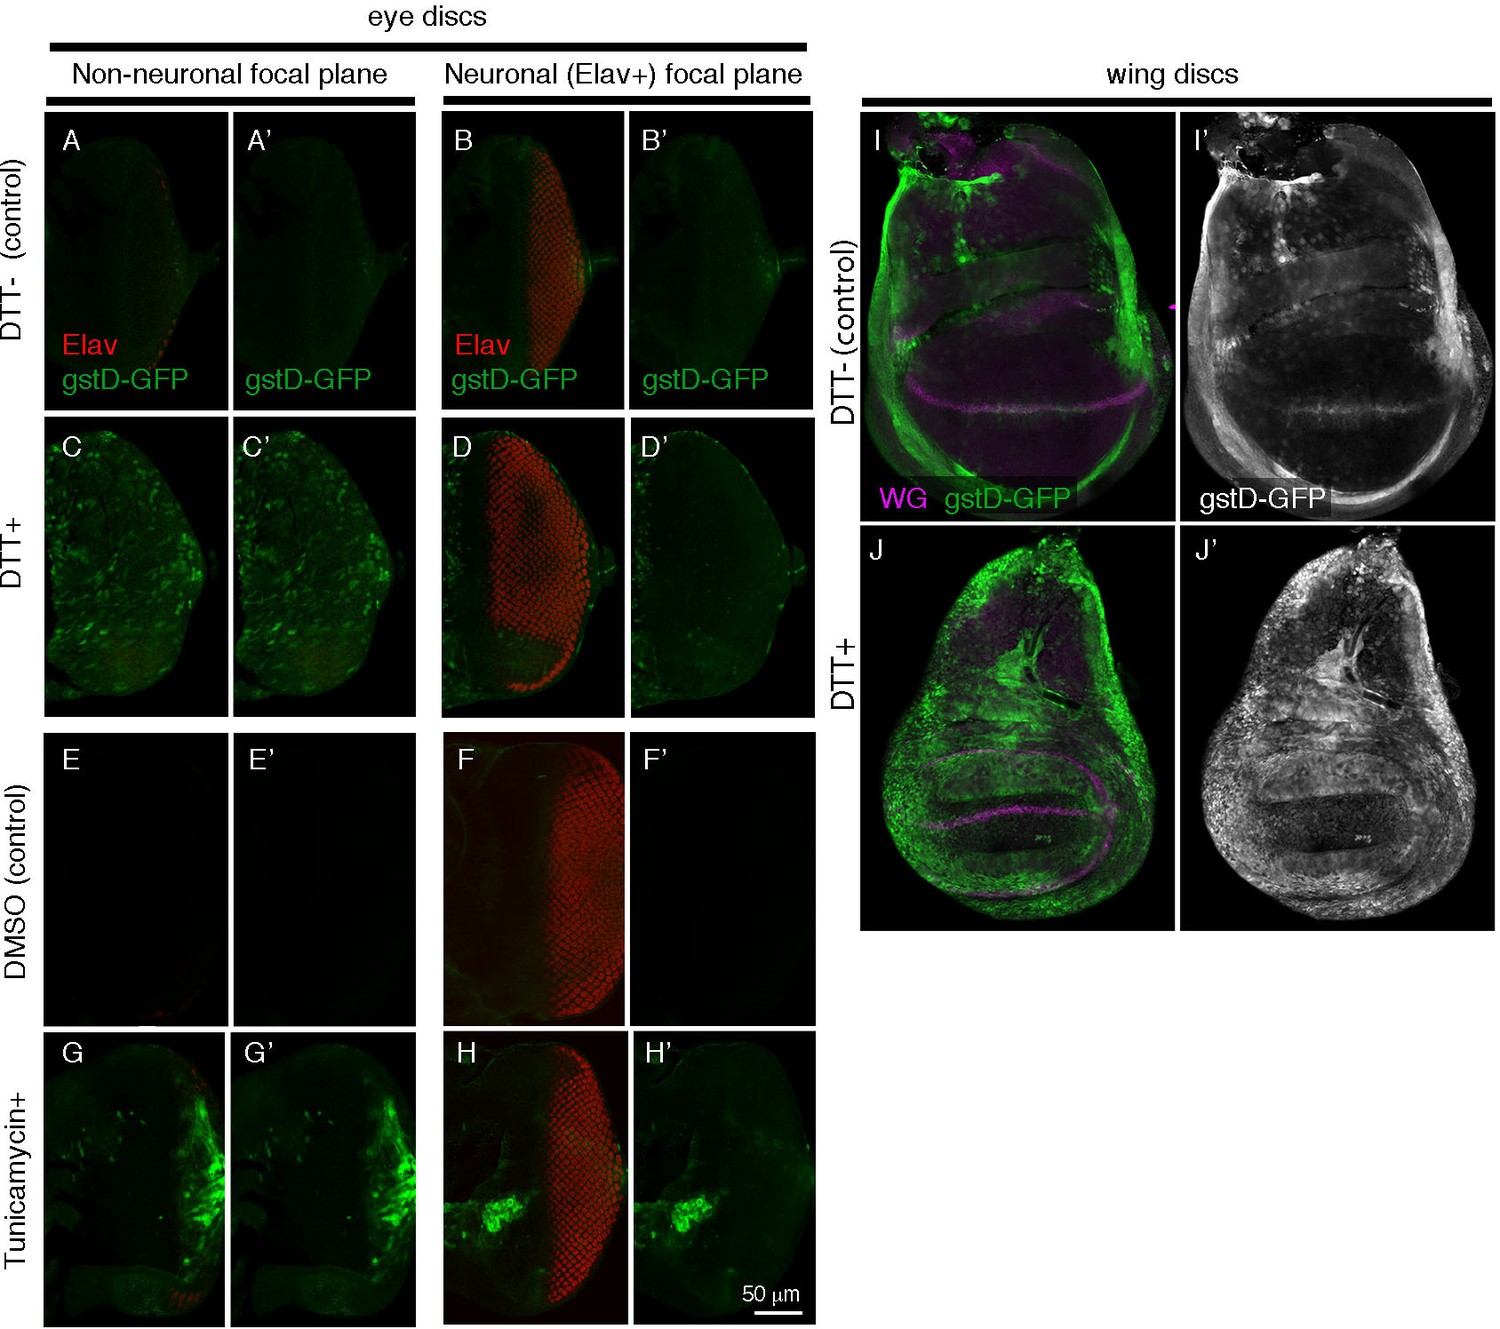
gstD-GFP induction by ER-stress causing chemicals.
gstD-GFP transgenic larval imaginal discs, imaged for gstD-GFP (green). (A–D) Representative images of eye imaginal discs incubated in control culture media (A, B), or with that containing the ER-stress-causing chemical DTT (C, D). Anti-Elav (red) labeling shows photoreceptor nuclei. Shown are images of two different focal planes: (A, C) The support cell layer focal plane that does not include Elav-positive nuclei. (B, D) The Elav-positive focal plane. Note that gstD-GFP is induced primarily in the Elav-negative cell layer. (E, H) Eye discs incubated with tunicamycin dissolved in DMSO (G, H), or just with DMSO (E, F). Shown are two different focal planes, the Elav-negative (E, G) and Elav-positive cell layers (F, H). (I, J) Wing imaginal discs incubated with control culture media (I), or with media containing 2 mM DTT for 4 hr (J). Anti-Wg (magenta) was used for counterstaining. (A’, B’, C’, D’, E’, F’, G’, H’, I’, J’) gstD-GFP single channels. Scale bar in H’ = 50 μm.
Figure 2—figure supplement 2
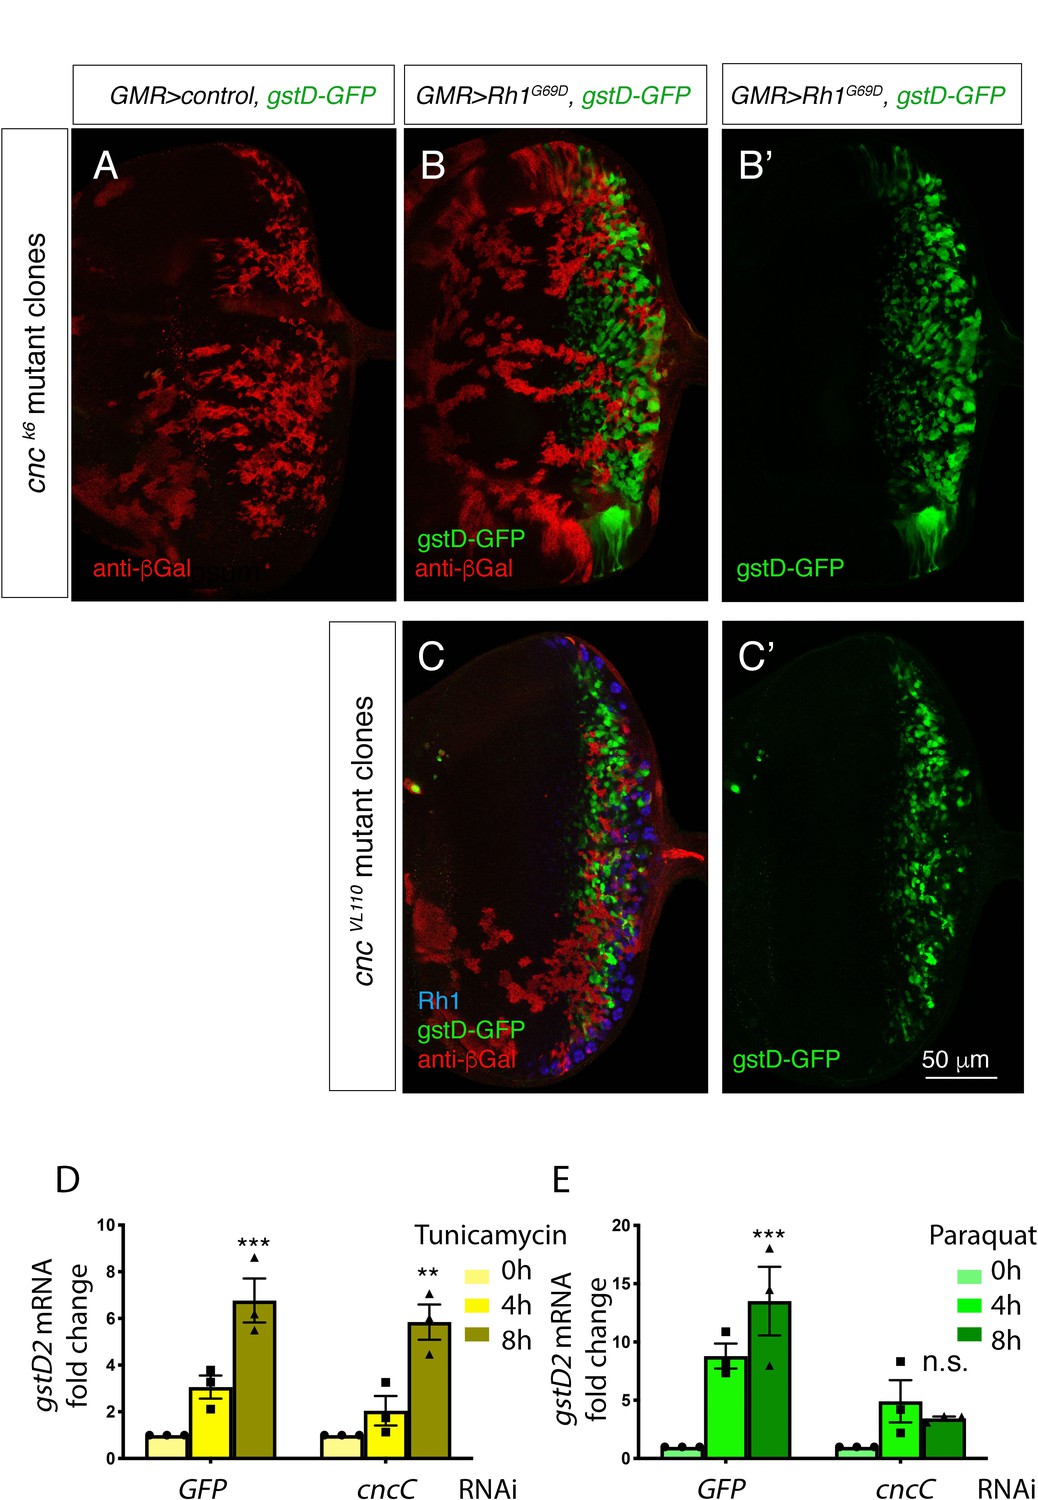
ER stress-induced expression of gstDs is independent of cncC.
(A–C) Eye imaginal discs labeled with gstD-GFP (green). The cncC homozygous mosaic clones are marked by the absence of anti-βGal antibody labeling (red). (A) A control disc with cnck6 mutant clones but not overexpressing Rh1G69D. (B, C) GMR> Rh1G69D eye discs with cncC mutant clones. Note that gstD-GFP signal is present in cnck6 (B) nor cncvl100 homozygous mutant clones. In (C), blue shows anti-Rh1. (B’, C’) show gstD-GFP only channels of (B, C). (D, E) qRT-PCR of gstD2 normalized to Rpl15 in S2 cells where ER stress is induced by 10 μg/ml tunicamycin treatment (D) or 20 mM paraquat (E) for 0, 4, or 8 hr. Cells were treated with dsRNA against either GFP or cncC. Scale bar = 50 um. ** = p < 0.005, *** = p < 0.001.
Figure 2—figure supplement 3
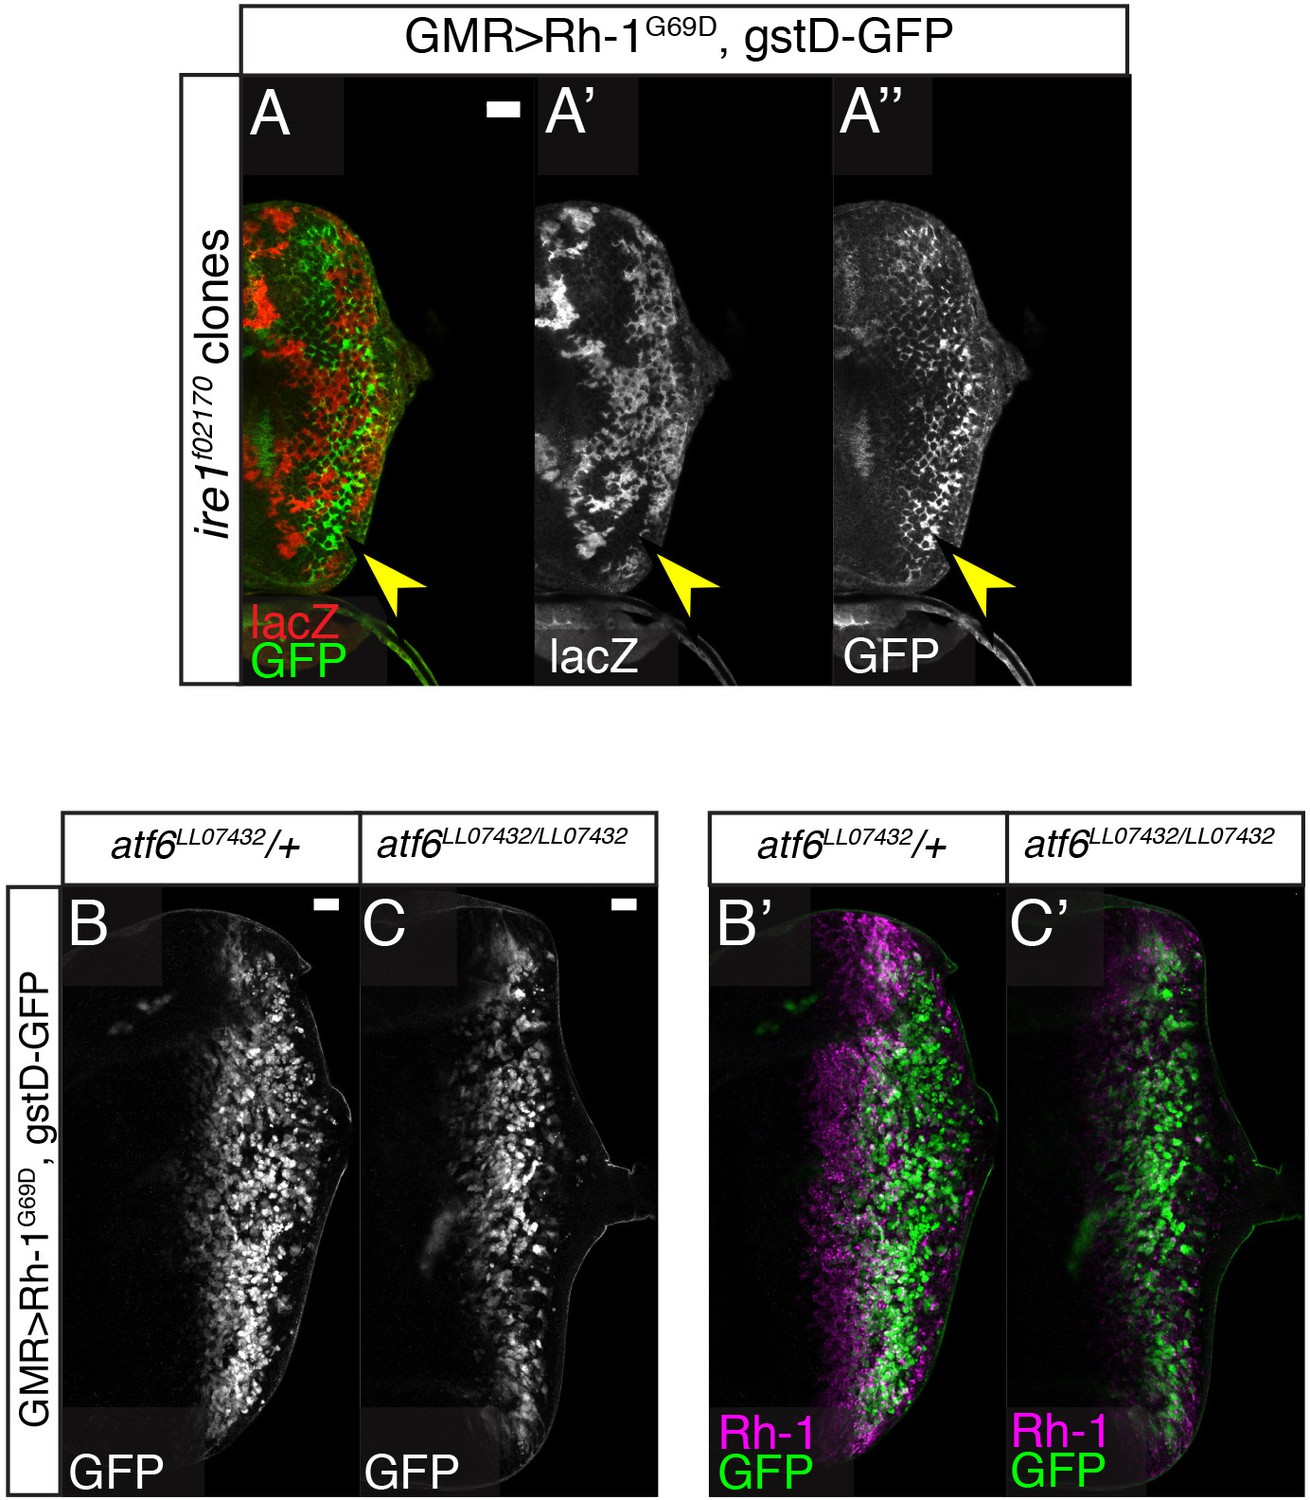
Rh1G69D -induced expression of gstD-GFP neither requires Ire1 nor Atf6.
(A–C) GMR> Rh1G69D eye discs expressing gstD-GFP (green) in the indicated genetic backgrounds. (A) Ire1f02170 homozygous mutant clones marked by the absence of βGal expression (red). Note the presence of gstD-GFP expression within the mutant clones. Also shown are single channels of βGal (A’) and GFP (B’). (B, C) GMR> Rh1G69D eye discs in Atf6LL07432 heterozygous (B) and homozygous backgrounds (C). gstD-GFP single channels (B, C) and those merged with anti-Rh1 (magenta) (B’, C’). Neither GMR-Gal4> eIF2αWT (C), nor GMR-Gal4> eIF2α51D (D) activates this reporter.
Figure 3 with 1 supplement

Perk is necessary and sufficient to induce gstD-GFP expression.
(A–D) Representative eye imaginal discs with gstD-GFP (green) alone channels (A–D), and gstD-GFP (green) channels merged with anti-Rh1 (red) (A’-D’). The genotypes of the discs are as follows: (A) GMR-Gal4; gstD-GFP/+, (B) GMR-Gal4; gstD-GFP/UAS-Rh1G69D, (C) GMR-Gal4; gstD-GFP/UAS-Rh1G69D; Perke01744 (D) GMR-Gal4; gstD-GFP/UAS-Perk. (E) Quantification of gstD-GFP pixel intensity fold change from posterior eye discs of the indicated genotypes from A-D. (F) qRT-PCR of gstD2 normalized to RpL15 in S2 cells treated with 10 ug/mL tunicamycin for 0, 4, or 8 hr. Cells were either pre-treated with control dsRNA (GFP) or those targeting Perk. (G–I) gstD-GFP (green) containing GMR > Rh1G69D eye discs with either control mosaic clones (G), or those with Perk loss-of-function clones (H, I). Homozygous Perk e01744 clones in H’ and I are marked by the absence of β-galactosidase (red) expression. Note that gstD-GFP expression occurs broadly in the background of control mosaic clones, but is largely absent in Perk homozygous mutant clones. (I, I’) A magnified view of the dotted inset in (H’). (I’) β-galactosidase only channel (marking Perk-positive cells; in white). Scale bar = 50 μm. * = p < 0.05, ** = p < 0.005, *** = p < 0.001.
Figure 3—figure supplement 1
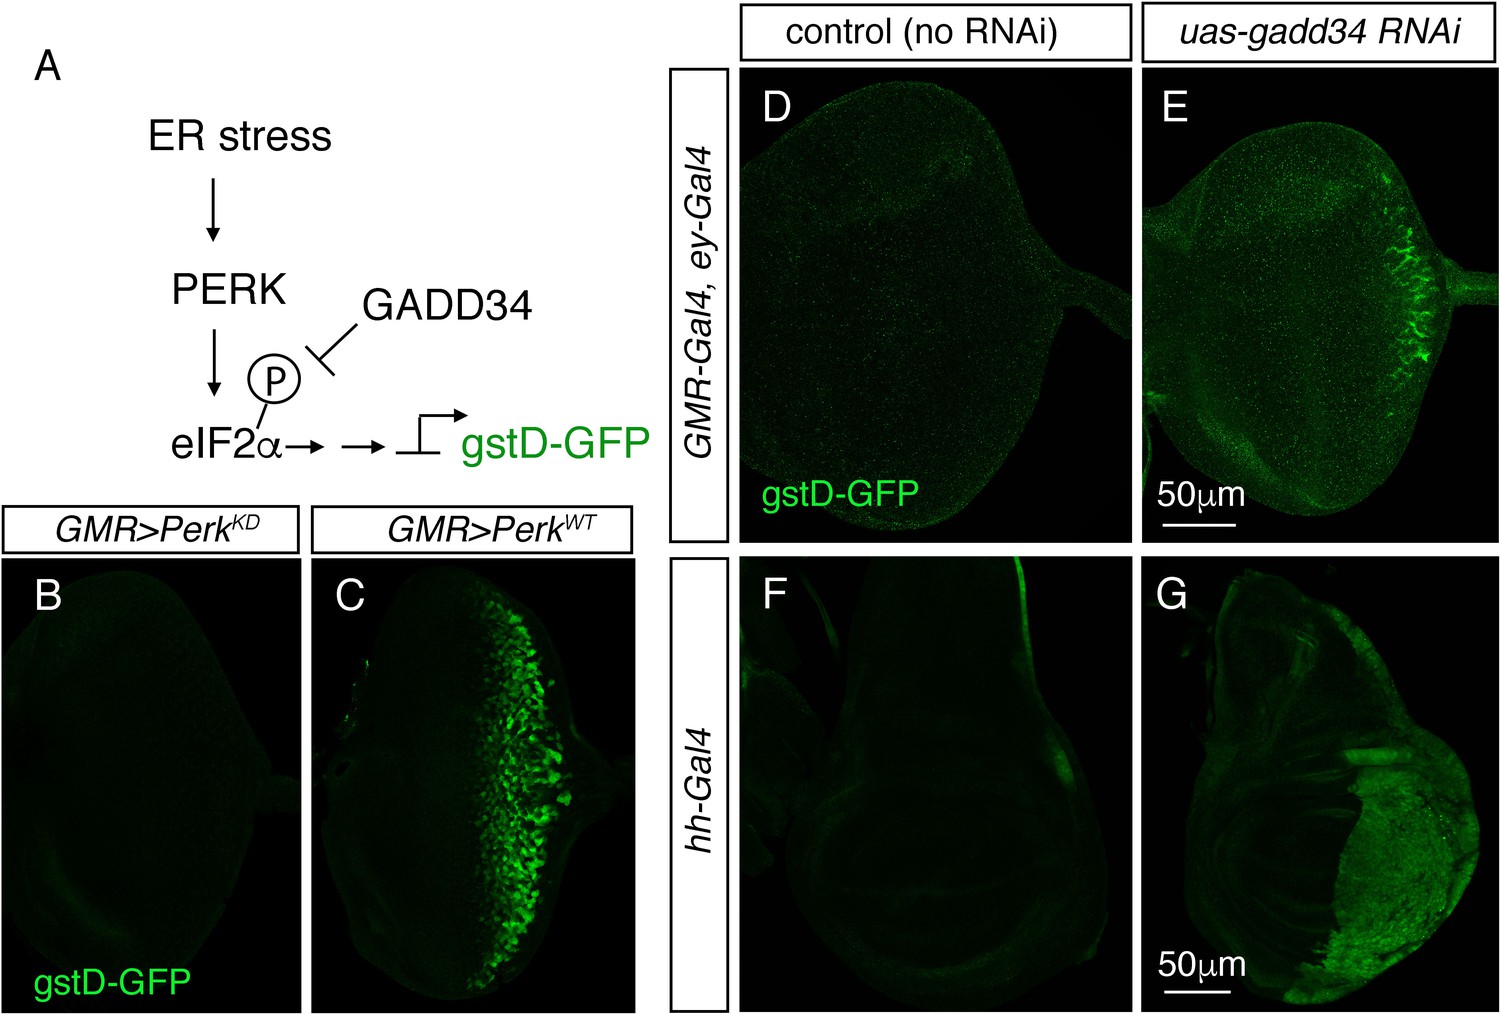
PERK’s kinase domain and eIF2α phosphorylation mediate gstD-GFP induction.
(A) A schematic diagram of eIF2α phosphorylation regulation. (B–G) Late third instar larval imaginal discs expressing gstD-GFP (green). Posterior is to the right. (B–E) Eye imaginal discs. Expression of a Perk transgene with a kinase domain mutation (PerkKD) through the GMR-Gal4 driver does not induce gstD-GFP expression (B), whereas the wild type Perk transgene strongly induces this reporter (C). Expression of gadd34 RNAi through the GMR-Gal4, ey-Gal4 drivers induces gstD-GFP at the posterior edge of the eye disc (E), whereas gstD-GFP is not detected in the no RNAi control (D). (F, G) Wing discs. No RNAi control shows low basal levels of gstD-GFP expression (F), whereas gadd34 RNAi expression through the hh-Gal4 driver induces gstD-GFP throughout the domain of Gal4 expression (G). Scale bars in E, G = 50 μm.
Figure 4
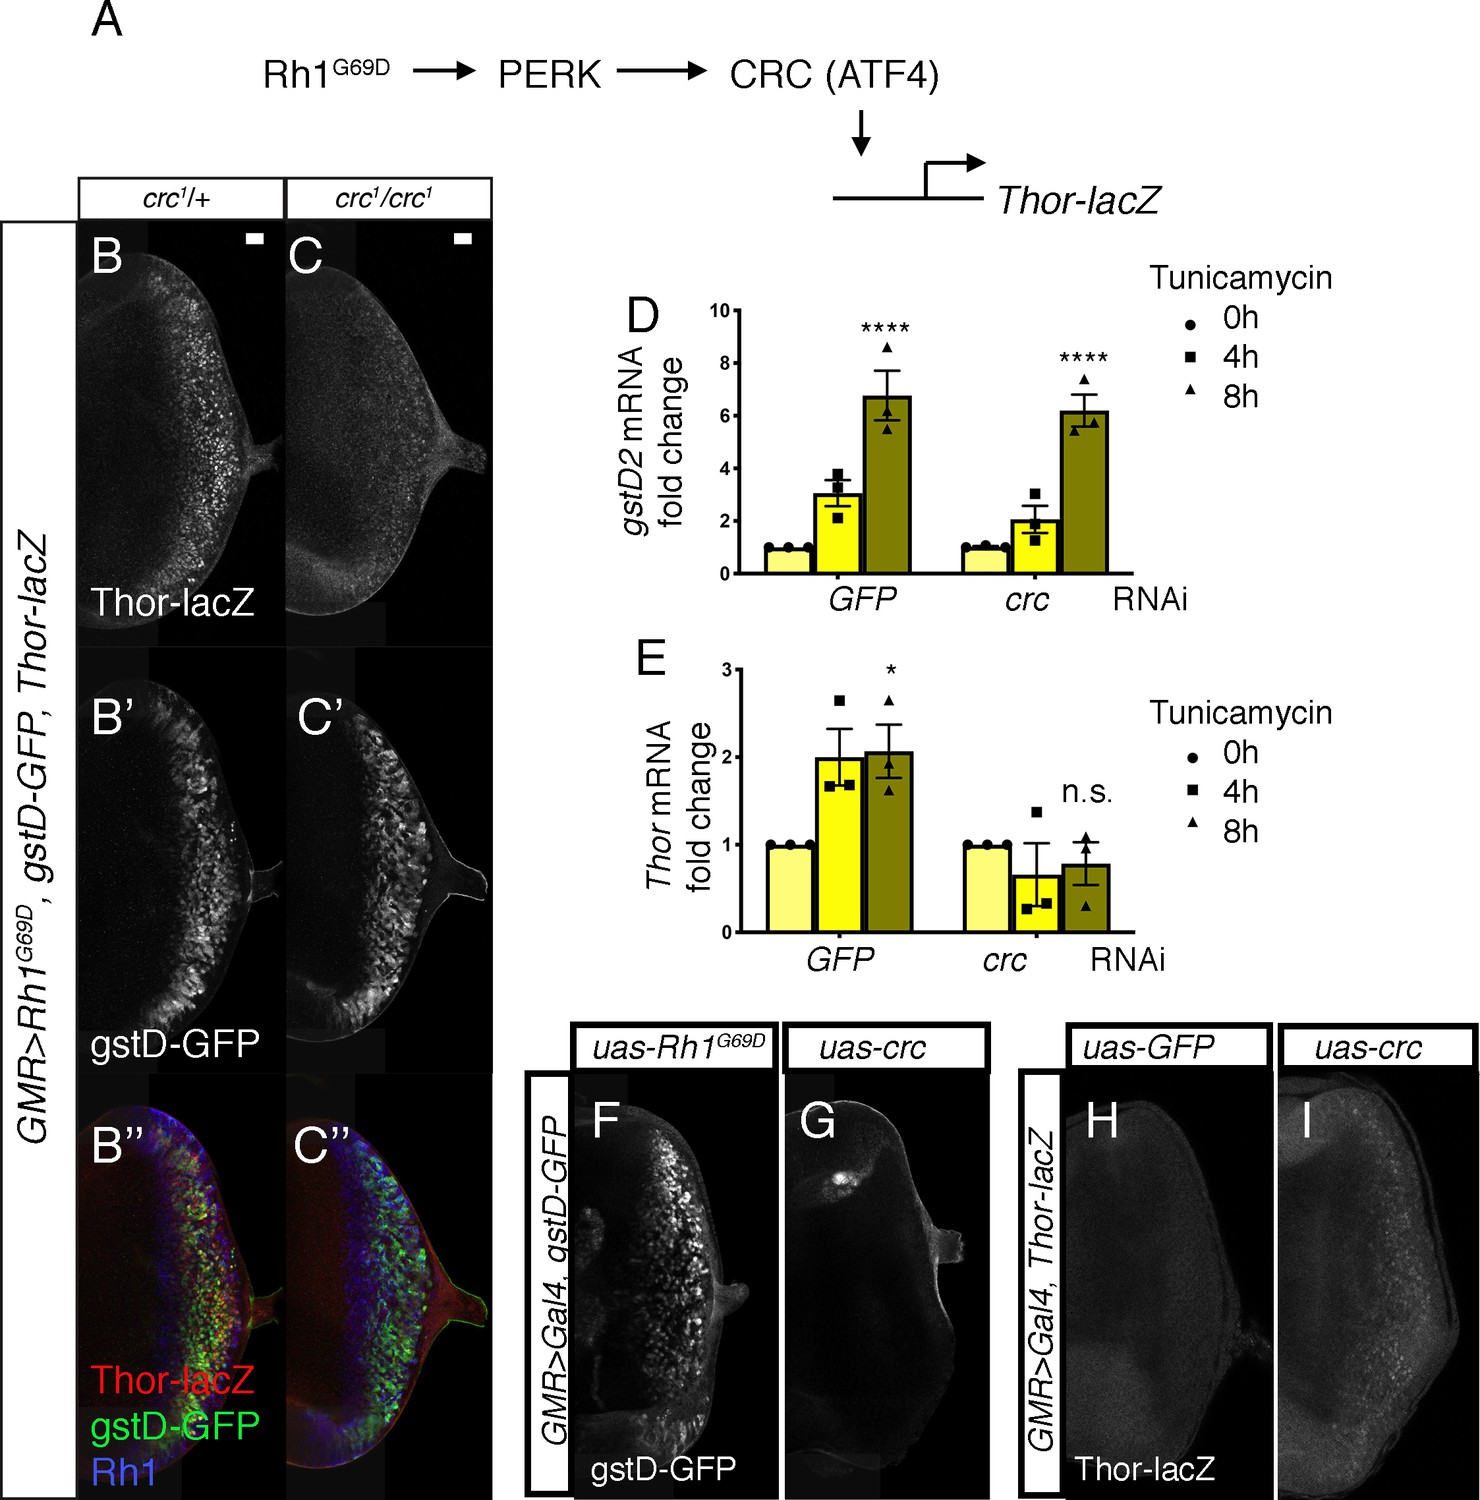
PERK-mediated gstD expression is ATF4 (crc)-independent.
(A) Schematic diagram of the Drosophila PERK-ATF4 signaling pathway. CRC is the Drosophila ATF4 ortholog, and Thor-lacZ is a CRC transcriptional target. (B, C) Eye imaginal discs expressing GMR > Rh1G69D in either the crc1/+ control (B) or in the crc1 homozygous backgrounds (C). These discs also have Thor-lacZ that reports CRC activity (B, C, in white), and gstD-GFP (B’, C’, in white). (B’’, C’’) Images of discs with Thor-lacZ (red), gstD-GFP (green) and anti-Rh1 (blue) channels merged. Note that crc1 homozygous mutants block Thor-lacZ expression (C), but still allows gstD-GFP expression in Rh1G69D expressing cells (C’, C’’). (D, E) qRT-PCR analysis of gstD2 and Thor normalized to Rpl15 in S2 cells challenged with 10 µg/mL tunicamycin for 0, 4, or 8 hr. Cells were either treated with control dsRNA (GFP) or that target crc. (F, G) gstD-GFP expression (white) in eye discs that are overexpressing either Rh1G69D (F) or crcleaderless (G) through the GMR-Gal4 driver. (H, I) Thor-lacZ expression (white) in eye discs overexpressing either a control GFP transgene (H), or crcleaderless (I) through the GMR-Gal4 driver. Scale bar = 20 μm. * = p < 0.05, **** = p < 0.0001. Genotypes: (B) GMR-Gal4; gstD-GFP, crc1/UAS-Rh1G69D, Thor-lacZ. (C) GMR-Gal4; gstD-GFP, crc1/crc1, UAS-Rh1G69D, Thor-lacZ. (F) GMR-Gal4; gstD-GFP/UAS-Rh1G69D. (G) GMR-Gal4; gstD-GFP/UAS-crcleaderless. (H) GMR-Gal4; Thor-lacZ/UAS-GFP. (I) GMR-Gal4; Thor-lacZ/UAS-crcleaderless.
Figure 5
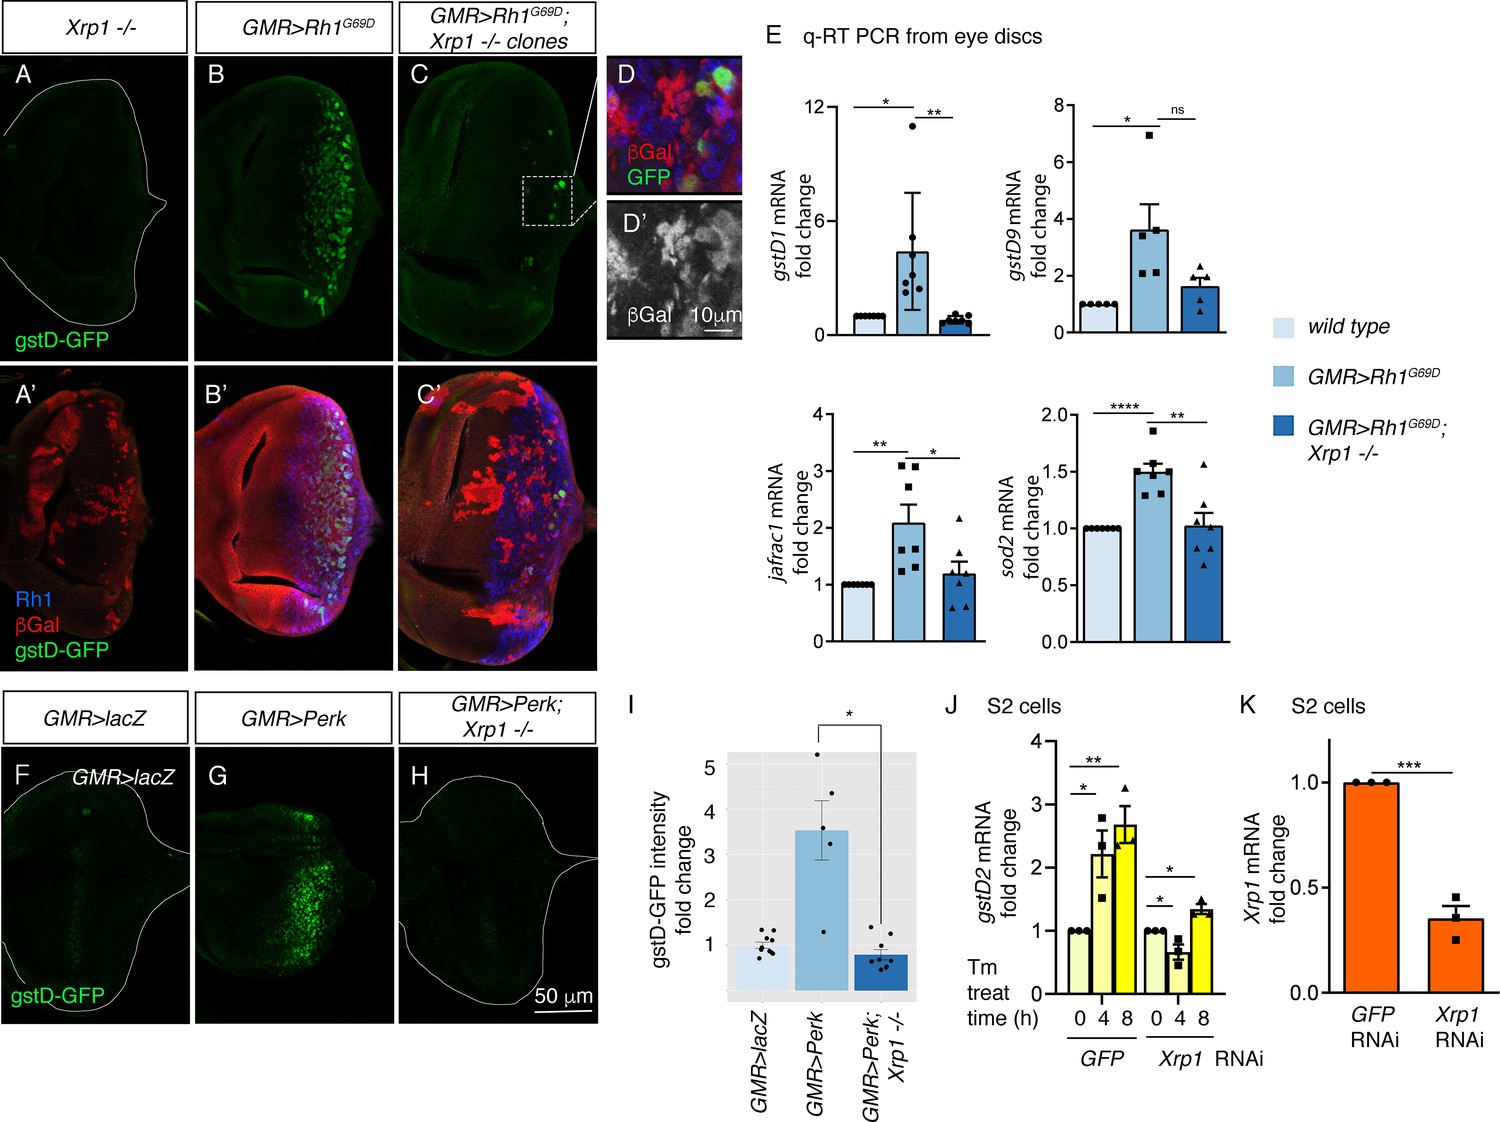
PERK regulates gstD gene expression through the bZIP transcription factor Xrp1.
(A–G) gstD-GFP expression (green) in eye discs. (A, A’) An eye disc with homozygous Xrp1M2-73 mutant clones that are marked by the absence of βGal (red). (B, B’) A GMR> Rh1G69D disc in a control genetic background. (C, C’) A GMR> Rh1G69D disc with Xrp1M2-73 loss-of-function mosaic clones (non-red). (A–C) gstD-GFP only channels. (A’-C’) Merged images with Rh1 is stained in blue and βgal is in red. Note the absence of gstD-GFP in Xrp1 mutant clones. (D, D’) Magnified view of the inset marked in C. The scale bar here represents 10 μm. (D’) is the βGal only channel of the image in (D). (E) Quantitative(q) RT-PCR results of indicated genes from dissected eye discs. The genotypes are color labeled. (F–H) Eye discs expressing control lacZ (E), Perk (F), or expressing Perk in the background of Xrp1M2-73 mosaic clones (G). (I) Quantification of gstD-GFP intensity fold change in the indicated genotypes. (J, K) q RT-PCR results from S2 cells. (J) gstD2 mRNA levels from S2 cells challenged with 10 µg/mL tunicamycin for 0, 4 or 8 hr. The cells were pretreated with dsRNA against either GFP (lanes 1–3) or Xrp1 (lanes 4–6). (K) Xrp1 mRNA levels in cells pretreated with dsRNA against GFP or Xrp1. All qRT-PCR results were normalized with Rpl15. Two tailed t tests were used to assess statistical significance. The scale bar of 50 μm applies to all images except for (D). * = p < 0.05, ** = p < 0.005, *** = p < 0.001. Genotypes: (A) GMR-Gal4, ey-FLP; gstD-GFP/+; FRT82, Xrp1M2-73/FRT82, arm-lacZ. (B) GMR-Gal4, ey-FLP; gstD-GFP/UAS-Rh1G69D. (C) GMR-Gal4, ey-FLP; gstD-GFP/UAS-Rh1G69D; FRT82, Xrp1M2-73/FRT82, arm-lacZ. (E) GMR-Gal4, ey-FLP; gstD-GFP/UAS-lacZ. (F) GMR-Gal4, ey-FLP; gstD-GFP/UAS-Rh1G69D. (G) GMR-Gal4, ey-FLP; gstD-GFP/UAS-Rh1G69D; FRT82, Xrp1M2-73/ FRT82, arm-lacZ.
Figure 6
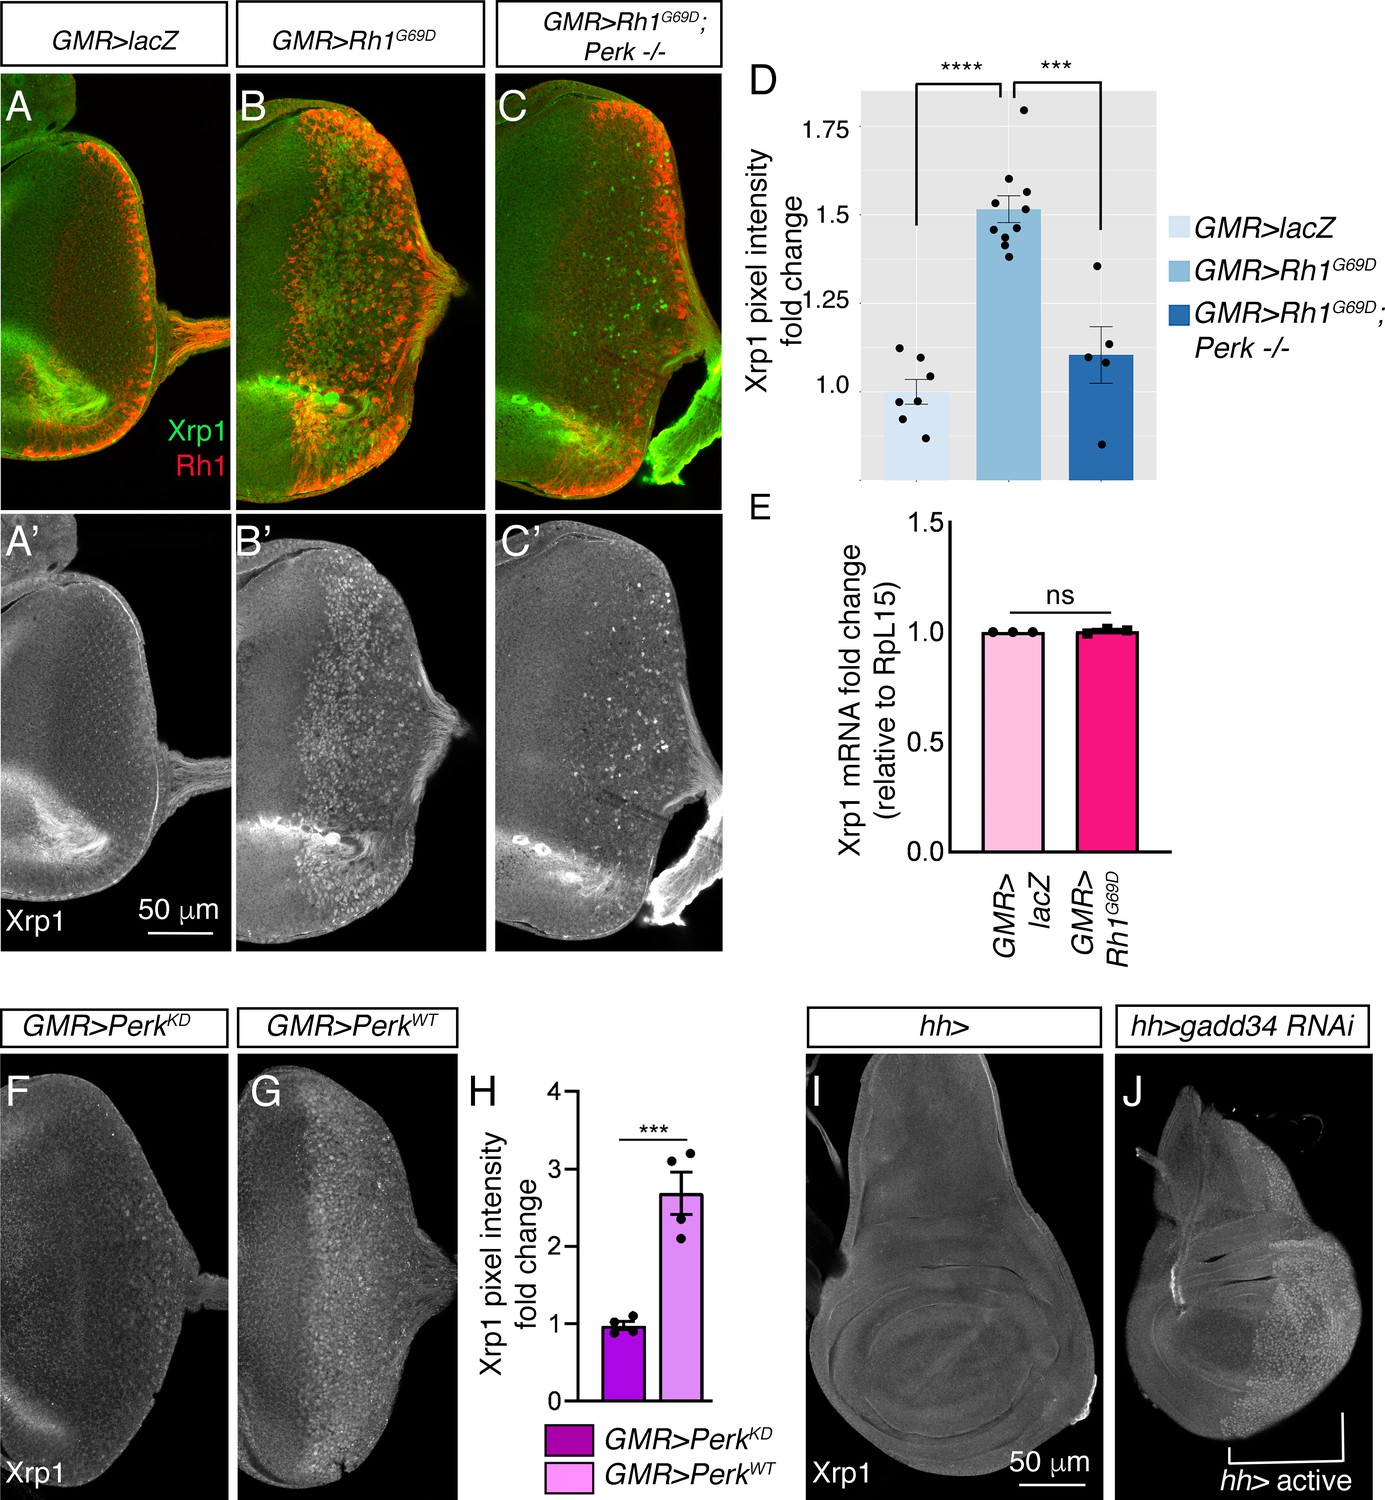
Xrp1 induction is regulated by Perk and eIF2α phosphorylation.
(A–C) Eye discs labeled with anti-Xrp1 (green) and anti-Rh1 (red). (A’-C’) Anti-Xrp1 single channels of images in (A–C). Genotypes: (A, A’) GMR-Gal4; UAS-lacZ/+. (B, B’) GMR-Gal4; UAS-Rh1G69D/+. (C, C’) GMR-Gal4; UAS-Rh1G69D/+; Perke01744. The scale bar represents 50 µm. (D) Quantification of anti-Xrp1 pixel intensities from eye discs in (A–D). (E) qRT-PCR analysis of Xrp1 from GMR > LacZ (control) and GMR > Rh1G69D eye discs. Xrp1 qRT-PCR results were normalized with that of Rpl15. (F, G) Anti-Xrp1 immunolabeling (white) in eye imaginal discs. Genotypes: (F) GMR-Gal4; uas-PerkKD. (G) GMR-Gal4; uas-PerkWT. (H) Quantification of anti-Xrp1 pixel intensities in (F, G). (I, J) Anti-Xrp1 immunolabeling in wing discs. Genotypes: (I) hh-Gal4/+. (J) uas-gadd34 RNAi/+; hh-Gal4. The white bracket indicates the posterior compartment where hh-Gal4 drives the transgene expression. In all graphs, two tailed t tests were used to assess statistical significance. *** = p < 0.0005, **** = p < 0.00005 and ns = non-significant, respectively.
Figure 7
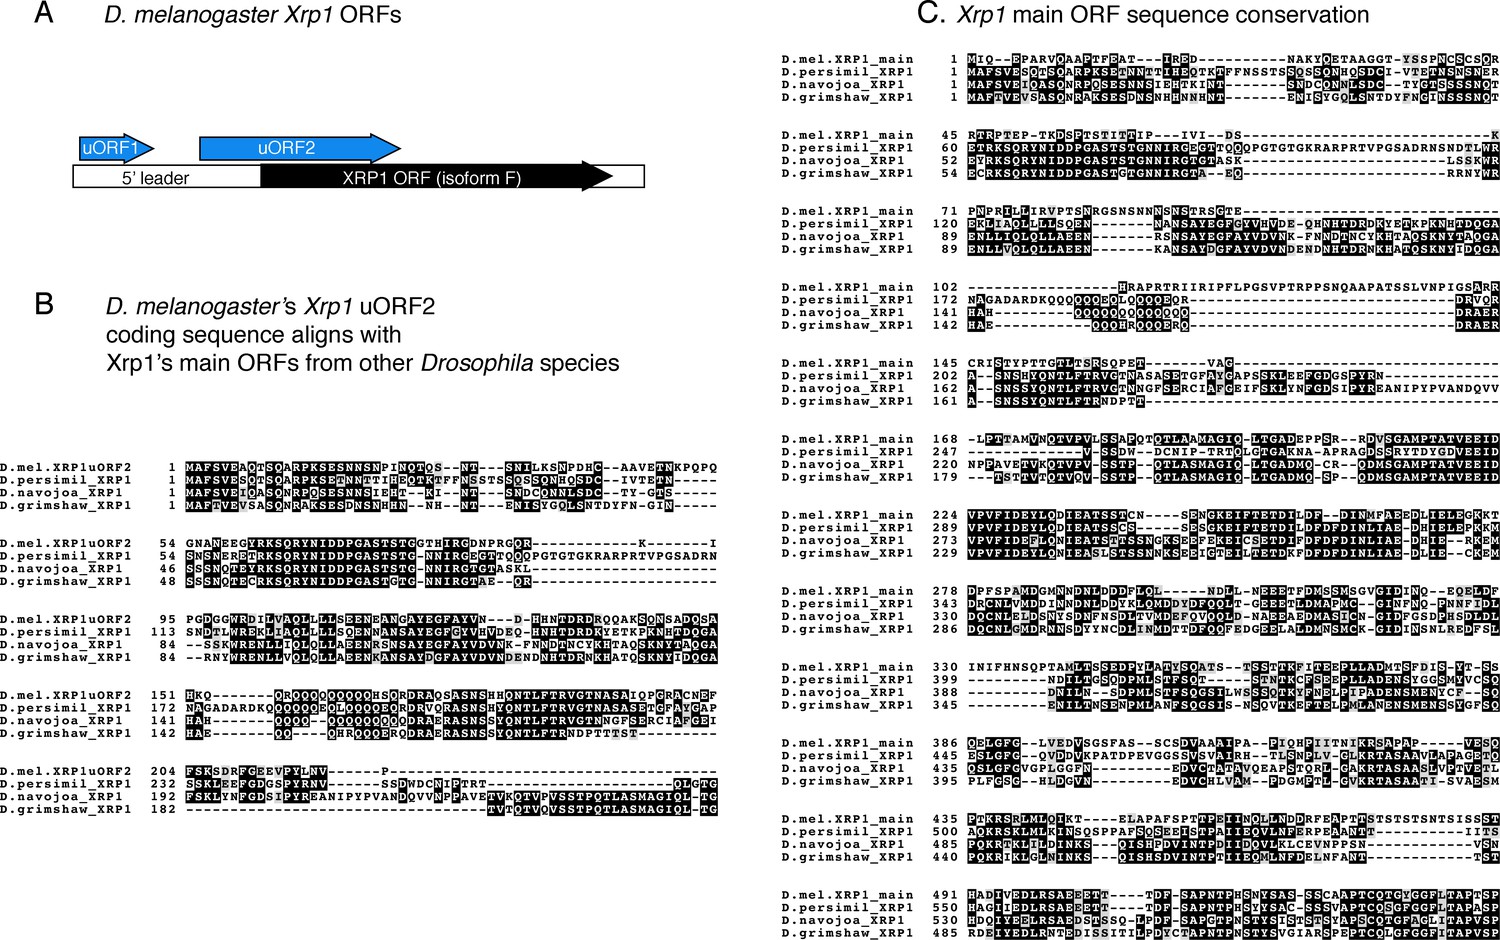
Predicted upstream Open Reading Frames (ORFs) in Xrp1.
(A) A schematic diagram of the predicted ORFs in D. melanogaster Xrp1. uORF1 and uORF2 in the 5’ leader have initiation start codons with Kozak sequences. uORF1 encodes a peptide of 124 amino acid residues. uORF2 encodes a peptide of 288 amino acid residues. uORF2 overlaps with the main Xrp1 ORF, but is in a different reading frame. (B) Amino acid sequence alignment between D. melanogaster Xrp1 uORF2, and the Xrp1 main ORFs from the species, D. persimili, D. navojoa, D. grimshawi. BoxShade was used for visualizing alignments, with those in black indicating sequence identity. The first 219 residues of the D. melanogaster Xrp1 uORF2 show high-sequence conservation with the main Xrp1 ORFs from other species. (C) Amino acid sequence alignment between the main ORFs of D. melanogaster and other Drosophila species. D. melanogaster’s Xrp1 main ORF shows high-sequence conservation with other Drosophila species beginning from the 140th amino acid residue.
Figure 8

Xrp1 binding sites in the gstD enhancer are required for Rh1G69D -induced gstD-GFP expression.
(A) Sequence logos representing Xrp1 and ATF4 position frequency matrices. (B) Binding score analysis for Xrp1 and ATF4 sites in the gstD 2.7 kb enhancer region. Those that score high in the forward strand are depicted in green, whereas those in the reverse strand are shown in blue. The four putative binding sites are numbered below the graphs. (C) Putative binding site sequences. The site numbers match those whose positions are indicated in (B). (D) A schematic diagram of the CUT&RUN approach to assess Xrp1 binding to target DNA. When HA-tagged Xrp1 (light blue) binds to a specific DNA locus, that DNA can be recovered by adding anti-HA antibody (red) and pAG-MNase (dark blue) that cleaves adjacent DNA prior to immunoprecipitation. (E) Putative Xrp1 target gene enrichment after Xrp1HA protein pull down as assessed through q-PCR (using CUT&RUN). The y axis shows fold change increases in target gene DNA recovery in response to DTT treatment (normalized to q-PCR values from controls without DTT treatment). (F - J) Representative eye discs either expressing control lacZ (F) or those expressing GMR> Rh1G69D (G–I), with variants of the gstD-GFP reporter in green: gstD WT-GFP (F, G) gstD ΔATF4-GFP (H) and gstD Xrp1m-GFP (I). (G) shows a merged image with anti-Rh1 (red) and the gstD-GFP reporter (green). (G’, H, I) are gstD-GFP single channel images. (J) Quantification of gstD-GFP intensity fold change. Two tailed t tests were used to assess statistical significance. ** = p < 0.005, *** = p < 0.0005, **** = p < 0.00001, n.s. = not significant.
Additional files
-
Transparent reporting form
- https://cdn.elifesciences.org/articles/74047/elife-74047-transrepform1-v2.pdf
-
Supplementary file 1
Supplementary table 1.
- https://cdn.elifesciences.org/articles/74047/elife-74047-supp1-v2.csv
-
Source data 1
Supplementary Source Data.
- https://cdn.elifesciences.org/articles/74047/elife-74047-supp2-v2.xlsx
Download links
A two-part list of links to download the article, or parts of the article, in various formats.
Downloads (link to download the article as PDF)
Open citations (links to open the citations from this article in various online reference manager services)
Cite this article (links to download the citations from this article in formats compatible with various reference manager tools)
The transcription factor Xrp1 is required for PERK-mediated antioxidant gene induction in Drosophila
eLife 10:e74047.
https://doi.org/10.7554/eLife.74047


