Eco-evolutionary dynamics modulate plant responses to global change depending on plant diversity and species identity
- Department of Physiological Diversity, UFZ, Helmholtz Centre for Environmental Research, Germany
- German Centre of Integrative Biodiversity Research (iDiv) Halle-Jena-Leipzig, Germany
- Institute of Mathematics, Stochastics, Friedrich Schiller University Jena, Germany
- Institute of Biology, Experimental Interaction Ecology, Leipzig University, Germany
Figures
Figure 1
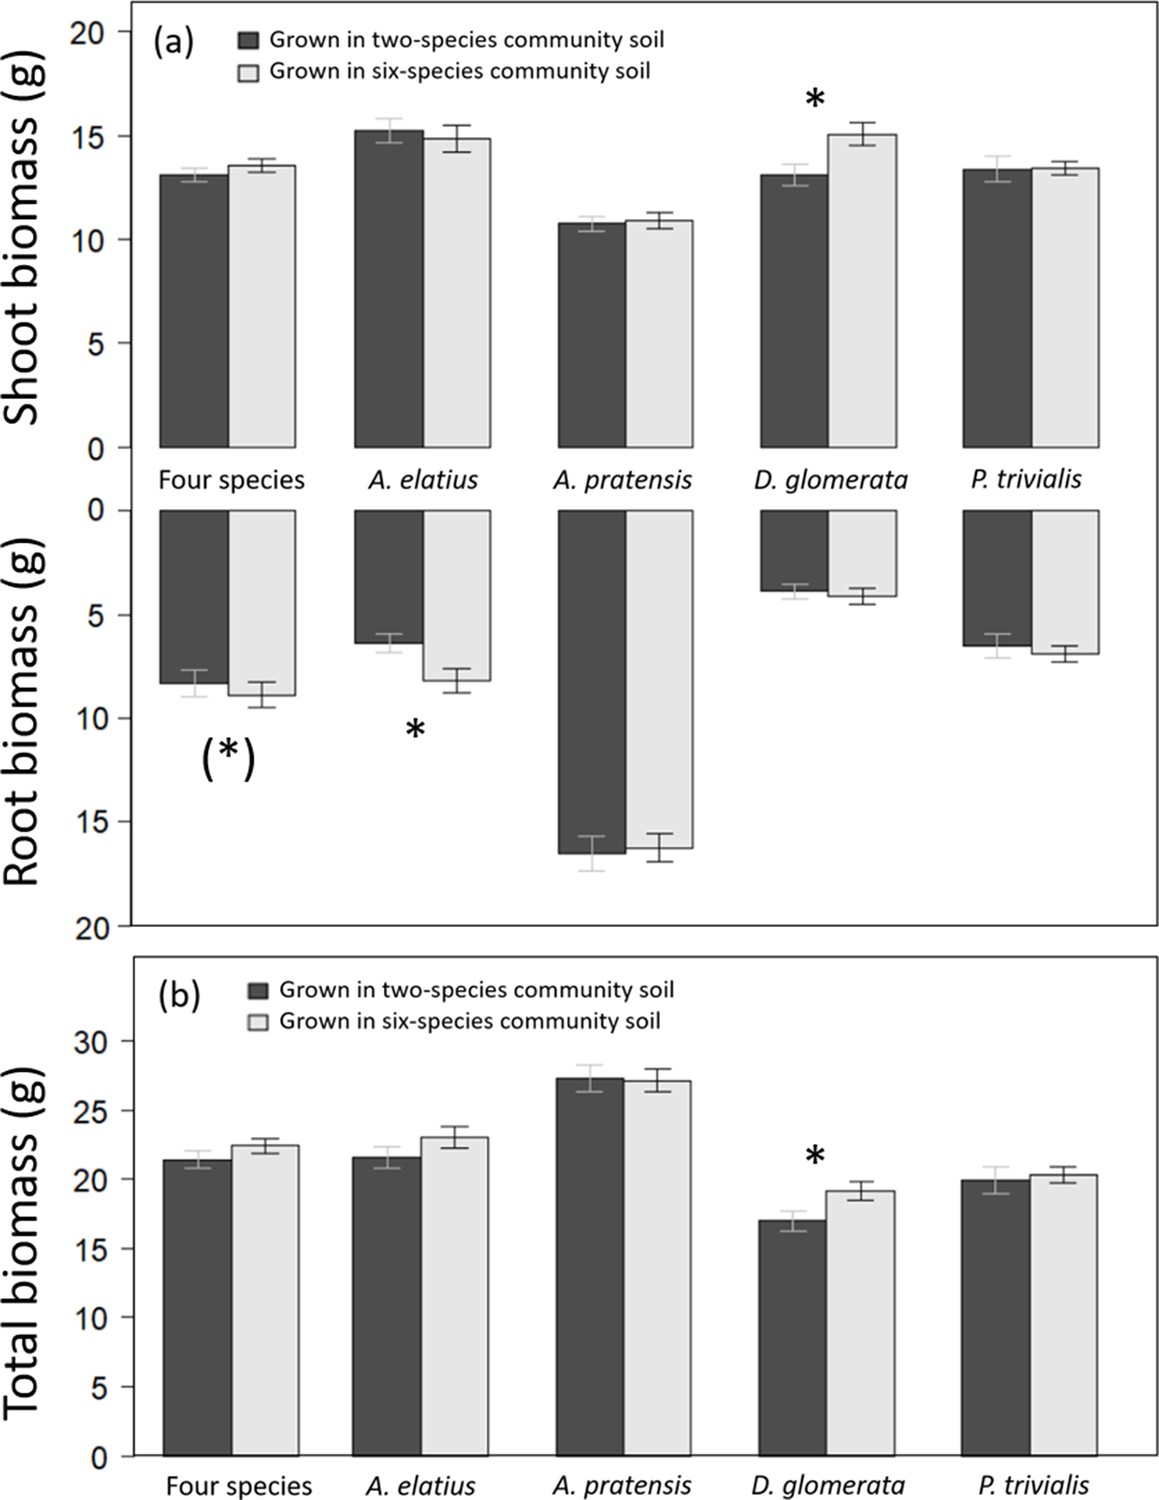
Shoot and root biomass production (a), and total biomass production (b) of plants grown either in soil originated from two-species or six-species communities across all four study species and separately for each species.
Bars show mean values (± 1 SE); stars above bars indicate significant differences (p < 0.05), stars in brackets indicate marginally significant differences (p < 0.1).
Figure 2
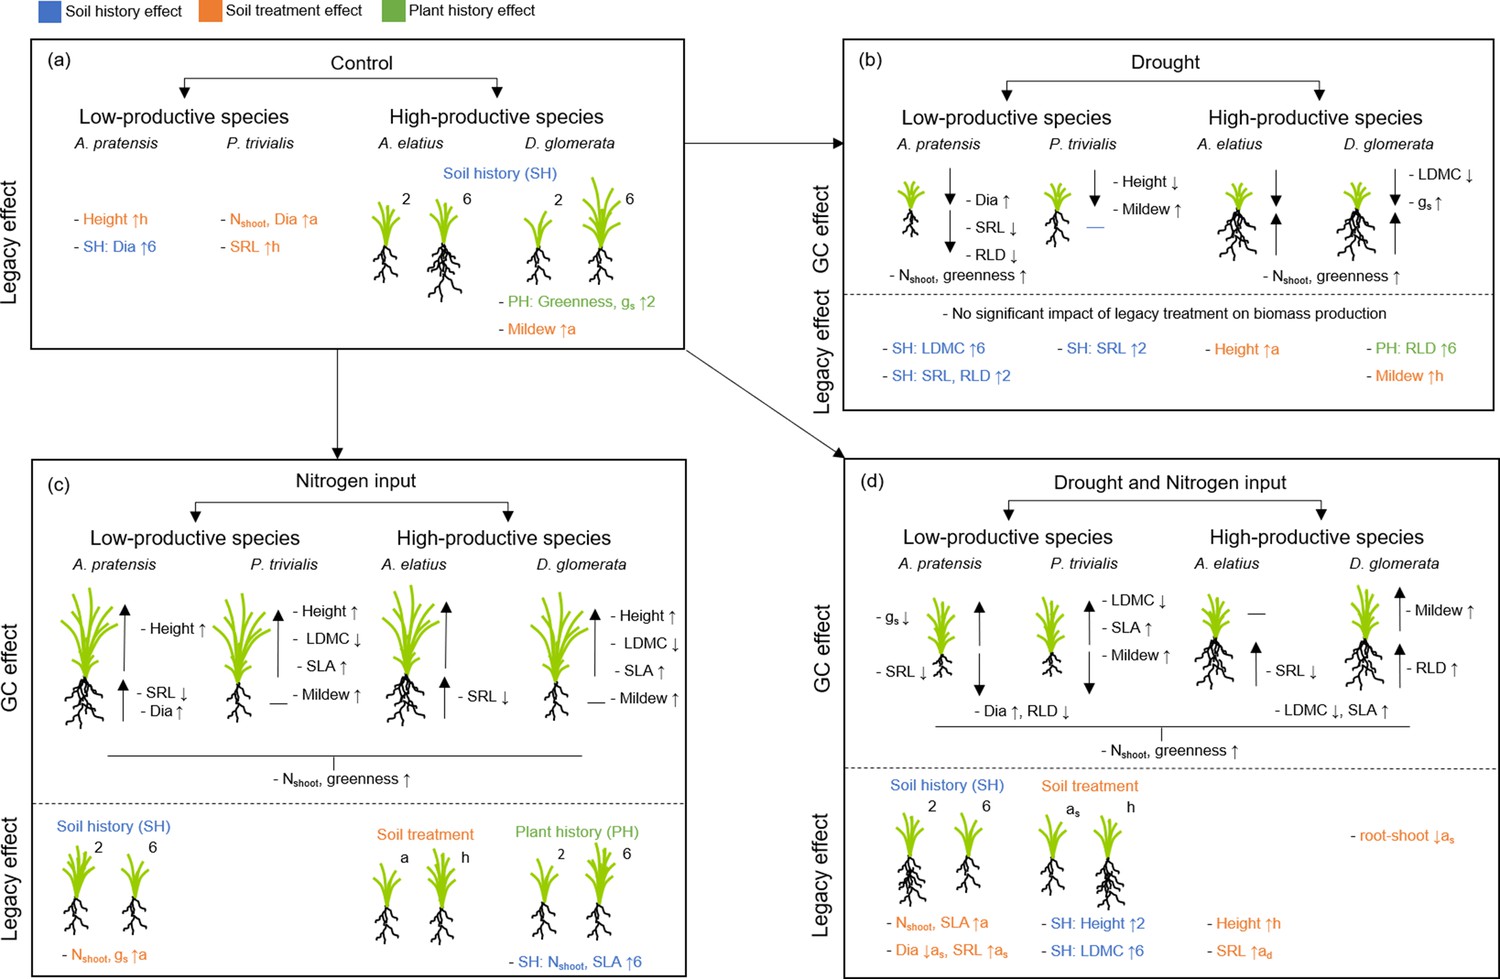
Schematic overview of the results of the common garden experiment testing how plants with a different origin (plant history) or grown in different soil (soil history, soil treatment) differ in performance and trait expression (a), under the influence of global change drivers drought (b), nitrogen input (c), and the combination of both (d).
Illustrated is the impact of legacy treatments (= “legacy effect”) and global change treatments ( = “global change effect”) on shoot and root biomass production as well as on plant traits (growth height (“Height”), shoot nitrogen concentration (“Nshoot”), leaf greenness (“Greenness”), leaf dry matter content (“LDMC”), specific leaf area (“SLA”), stomatal conductance (“gs”), mildew infestation (“Mildew”), root diameter (“Dia”), specific root length (“SRL”), root length density (“RLD”)) of the four study species. For legacy effects, schematic illustrations of plants indicate differences in shoot and/or root biomass, when originated from two-species ( = 2) or six-species ( = 6) communities ( = plant history (PH); green color), when grown in two-species (=2) or six-species ( = 6) community soil ( = soil history (SH), blue color), or when grown in away ( = a) or home ( = h) soil ( = soil treatment; as = away same soil; orange color). Arrows behind traits (for legacy effects) indicate, in which treatment group the value was significantly higher (arrow up) or lower (arrow down), e.g. “- SH: SLA ↑6” indicate that SLA in plants grown in six-species soil was higher than in two-species soil and “- LDMC ↑h” indicate that LDMC was higher in plants grown in home than in away soil. For global change effects, schematic illustrations of plants indicate whether shoot and/or root biomass of plants increased (big arrow up) or decreased (big arrow down) due to the impact of the respective global change driver (black horizontal line indicate no change). Small arrows behind traits (for global change effects) indicate and increase (arrow up) or decrease (arrow down) of the trait value due to the impact of the respective global change driver.
Figure 3
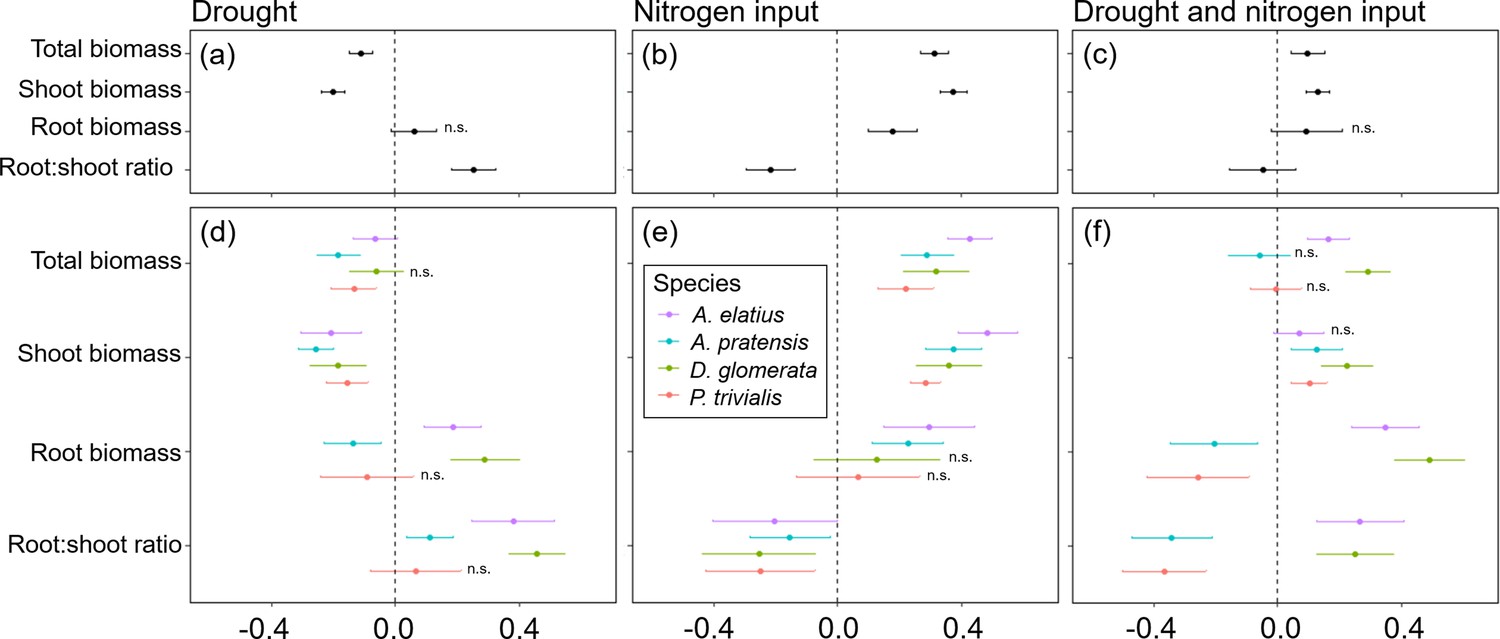
Response of plants treated with drought, nitrogen input, or a combination of both relative to non-treated plants (control) for total biomass, shoot biomass, root biomass, and root-shoot ratio across four study species (a–c) and separately for each species (d–f).
Points are means and error bars are standard deviation. No symbol indicates significant differences between plants treated with global change driver and control plants, n.s. indicate no significant difference.
Figure 4
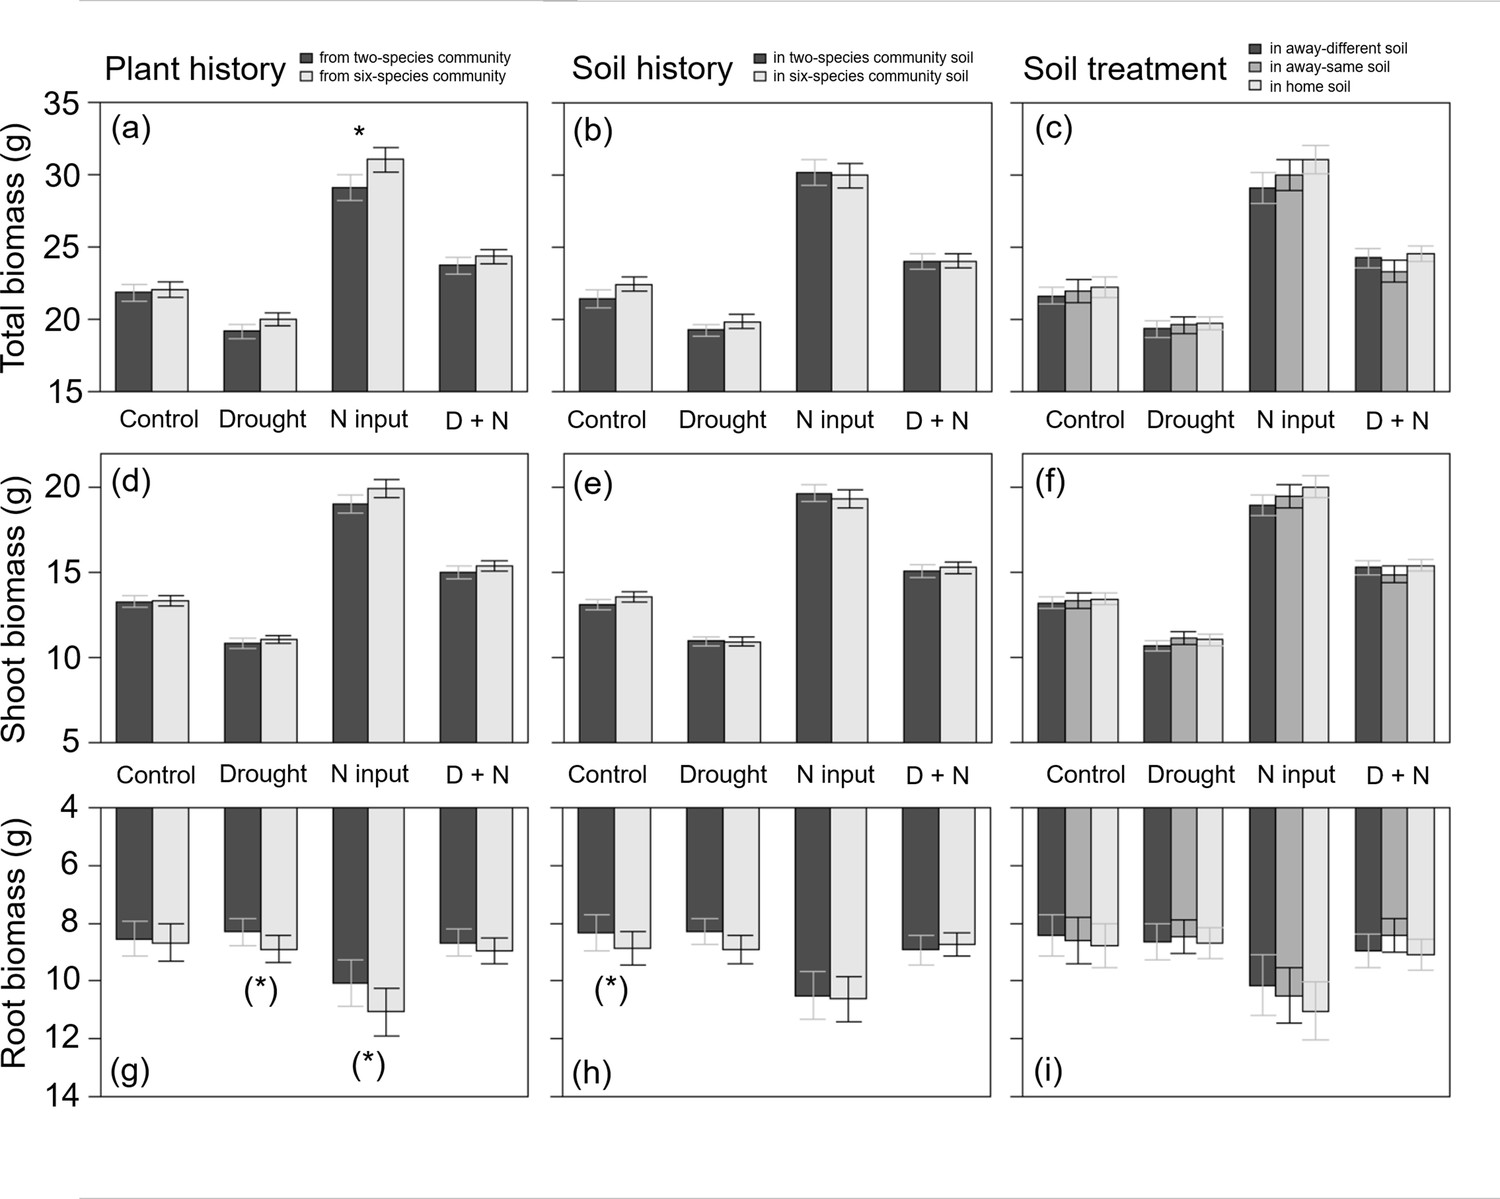
Total biomass (a–c), shoot biomass (d–f), and root biomass (g–i) of plants (across all four study species) originated from two- or six-species communities (plant history; a, d, g); grown in soil originated from two-species or six-species communities (soil history; b, e, h); or grown in home, away-same or away-different soil (soil treatment; c, f, i) and were either non-treated (control) or treated with drought, nitrogen input (N input) or a combination of both (D + N).
Bars show mean values (± 1 SE); stars above bars indicate significant differences (p < 0.05), stars in brackets indicate marginally significant differences (p < 0.1).
Figure 5
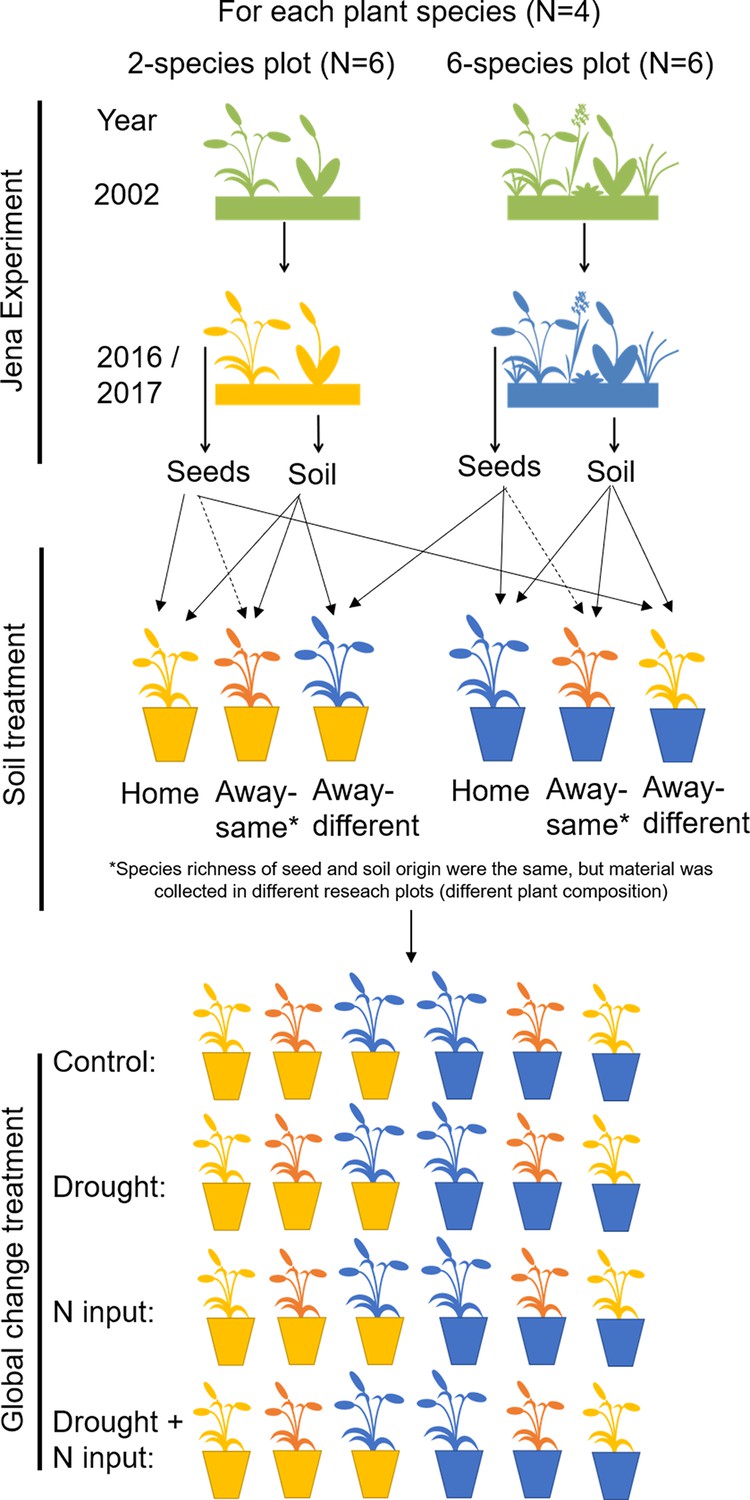
Overview of experimental design.
In 2016, ripe seeds of four grass species were collected in two- and six-species plots of the Dominance Experiment (Jena Experiment), stored in a freezer and allowed to germinate in spring 2017. After germination, soil samples were collected from the plots and mixed with sterilized background soil (5% + 95%), filled in pots and planted with two seedlings (12 pot replicates per plot). In four pots per plot, plant and soil had the same plot origin (home soil); in four pots, species richness of plant and soil origin were the same, but plant species composition was different (away-same soil) and in four pots, species richness of plant and soil origin were different ( = different origin of plant and soil; away-different soil; total Nrpots = 576). Plants were exposed to global change drivers: drought, nitrogen input, or the combination of drought and nitrogen input, or were not treated (control).
Tables
Table 1
Summary of mixed-effect model analyses testing the effects of species identity (N = 4), legacy treatments (plant history, soil history, soil treatment), global change treatments (drought, nitrogen input), and their interactions on plant performance (total biomass, shoot biomass, root biomass).
Shown are degrees of freedom (Df), Chi2, p-values (p) and explained variance (VD; calculated with variance decomposition; in %). Significant effects (p < 0.05) are given in bold, marginally significant effects (p < 0.1) in italics.
| Total biomass | Shoot biomass | Root biomass | ||||||||||
|---|---|---|---|---|---|---|---|---|---|---|---|---|
| Df | Chi2 | p | VD | Df | Chi2 | p | VD | Df | Chi2 | p | VD | |
| Species identity (ID) | 3 | 73.25 | < 0.001 | 19.54 | 3 | 80.17 | < 0.001 | 17.36 | 3 | 121.30 | < 0.001 | 63.65 |
| Plant history | 1 | 3.48 | 0.062 | 0.34 | 1 | 1.36 | 0.244 | 0.05 | 1 | 3.40 | 0.065 | 0.23 |
| Soil history | 1 | 0.01 | 0.915 | < 0.01 | 1 | 0.04 | 0.851 | < 0.01 | 1 | 0.49 | 0.484 | < 0.01 |
| Soil treatment | 2 | 2.17 | 0.338 | 0.02 | 2 | 1.20 | 0.548 | < 0.01 | 2 | 3.66 | 0.161 | 0.08 |
| Drought (D) | 1 | 83.05 | < 0.001 | 10.30 | 1 | 110.26 | < 0.001 | 14.11 | 1 | 2.81 | 0.094 | 0.09 |
| Nitrogen input (N) | 1 | 257.26 | < 0.001 | 22.83 | 1 | 425.93 | < 0.001 | 34.17 | 1 | 15.89 | < 0.001 | 0.78 |
| Species ID x Plant history | 3 | 0.71 | 0.872 | < 0.01 | 3 | 1.77 | 0.621 | < 0.01 | 3 | 0.63 | 0.890 | < 0.01 |
| Species ID x Soil history | 3 | 1.68 | 0.642 | < 0.01 | 3 | 0.18 | 0.980 | < 0.01 | 3 | 3.64 | 0.303 | 0.02 |
| Species ID x Soil treatment | 6 | 4.29 | 0.638 | < 0.01 | 6 | 6.64 | 0.355 | 0.01 | 6 | 2.30 | 0.891 | < 0.01 |
| Species ID x D | 3 | 52.00 | < 0.001 | 3.08 | 3 | 43.11 | < 0.001 | 1.92 | 3 | 98.61 | < 0.001 | 4.45 |
| Species ID x N | 3 | 30.46 | < 0.001 | 1.55 | 3 | 33.73 | < 0.001 | 1.35 | 3 | 18.28 | < 0.001 | 0.62 |
| D x N | 1 | 35.27 | < 0.001 | 1.82 | 1 | 27.47 | < 0.001 | 1.10 | 1 | 10.90 | 0.001 | 0.40 |
| Species ID x Plant history x D | 4 | 0.92 | 0.922 | < 0.01 | 4 | 4.42 | 0.353 | 0.02 | 4 | 0.72 | 0.948 | < 0.01 |
| Species ID x Soil history x D | 4 | 1.17 | 0.883 | < 0.01 | 4 | 5.33 | 0.255 | 0.05 | 4 | 0.54 | 0.969 | < 0.01 |
| Species ID x Soil treatment x D | 8 | 2.81 | 0.946 | < 0.01 | 8 | 4.78 | 0.781 | < 0.01 | 8 | 3.30 | 0.914 | < 0.01 |
| Species ID x Plant history x N | 4 | 2.66 | 0.617 | < 0.01 | 4 | 5.75 | 0.219 | 0.05 | 4 | 1.69 | 0.792 | < 0.01 |
| Species ID x Soil history x N | 4 | 6.59 | 0.159 | 0.13 | 4 | 3.47 | 0.482 | < 0.01 | 4 | 5.26 | 0.262 | 0.04 |
| Species ID x Soil treatment x N | 8 | 9.35 | 0.314 | 0.03 | 8 | 4.62 | 0.797 | < 0.01 | 8 | 15.48 | 0.050 | 0.25 |
| Species ID x Plant history x D x N | 4 | 14.85 | 0.005 | 0.50 | 4 | 27.25 | < 0.001 | 0.87 | 4 | 12.61 | 0.013 | 0.32 |
| Species ID x Soil history x D x N | 4 | 13.14 | 0.011 | 0.43 | 4 | 14.39 | 0.006 | 0.37 | 4 | 11.81 | 0.019 | 0.28 |
| Species ID x Soil treatment x D x N | 8 | 6.19 | 0.626 | < 0.01 | 8 | 7.91 | 0.442 | < 0.01 | 8 | 4.81 | 0.778 | < 0.01 |
Table 2
Summary of mixed-effect model analyses testing the effects of species identity (N = 4), legacy treatments (plant history, soil history, soil treatment), and their interactions on plant performance (total biomass, shoot biomass, root biomass and root-shoot ratio), when non-treated (control) or treated with global change drivers (drought, nitrogen input, drought and nitrogen input [D x N]).
Shown are degrees of freedom (Df), Chi2 and p-values (p). Significant effects (p < 0.05) are given in bold, marginally significant effects (p < 0.1) in italics.
| Total biomass | ||||||||||||
|---|---|---|---|---|---|---|---|---|---|---|---|---|
| Control | Drought | Nitrogen | D x N | |||||||||
| Df | Chi2 | p | Df | Chi2 | p | Df | Chi2 | p | Df | Chi2 | p | |
| Species ID | 3 | 57.93 | < 0.001 | 3 | 37.43 | < 0.001 | 3 | 60.10 | < 0.001 | 3 | 27.83 | < 0.001 |
| Plant history (PH) | 1 | 0.04 | 0.840 | 1 | 2.08 | 0.149 | 1 | 4.86 | 0.027 | 1 | 1.17 | 0.280 |
| Soil history (SH) | 1 | 2.60 | 0.107 | 1 | 0.44 | 0.507 | 1 | 1.15 | 0.283 | 1 | 0.10 | 0.756 |
| Soil treatment (ST) | 2 | 0.80 | 0.670 | 2 | 0.46 | 0.795 | 2 | 3.78 | 0.151 | 2 | 3.28 | 0.194 |
| Species ID x PH | 3 | 1.05 | 0.790 | 3 | 3.44 | 0.328 | 3 | 1.37 | 0.712 | 3 | 0.04 | 0.998 |
| Species ID x SH | 3 | 3.06 | 0.382 | 3 | 2.48 | 0.478 | 3 | 1.61 | 0.657 | 3 | 2.48 | 0.479 |
| Species ID x ST | 6 | 3.44 | 0.752 | 6 | 3.55 | 0.737 | 6 | 4.91 | 0.555 | 6 | 4.04 | 0.672 |
| Shoot biomass | ||||||||||||
| Control | Drought | Nitrogen | D x N | |||||||||
| Df | Chi2 | p | Df | Chi2 | p | Df | Chi2 | p | Df | Chi2 | p | |
| Species ID | 3 | 45.01 | < 0.001 | 3 | 47.33 | < 0.001 | 3 | 64.80 | < 0.001 | 3 | 43.66 | < 0.001 |
| Plant history (PH) | 1 | 0.03 | 0.859 | 1 | 0.45 | 0.502 | 1 | 2.56 | 0.110 | 1 | 0.77 | 0.381 |
| Soil history (SH) | 1 | 1.57 | 0.211 | 1 | 0.11 | 0.743 | 1 | 1.97 | 0.161 | 1 | 0.06 | 0.799 |
| Soil treatment (ST) | 2 | 0.24 | 0.886 | 2 | 2.51 | 0.286 | 2 | 4.39 | 0.112 | 2 | 1.91 | 0.385 |
| Species ID x PH | 3 | 0.18 | 0.980 | 3 | 6.79 | 0.079 | 3 | 4.34 | 0.227 | 3 | 0.60 | 0.900 |
| Species ID x SH | 3 | 7.50 | 0.058 | 3 | 2.08 | 0.556 | 3 | 0.06 | 0.996 | 3 | 0.67 | 0.881 |
| Species ID x ST | 6 | 6.46 | 0.374 | 6 | 2.67 | 0.849 | 6 | 7.67 | 0.263 | 6 | 2.27 | 0.893 |
| Root biomass | ||||||||||||
| Control | Drought | Nitrogen | D x N | |||||||||
| Df | Chi2 | p | Df | Chi2 | p | Df | Chi2 | p | Df | Chi2 | p | |
| Species ID | 3 | 107.40 | < 0.001 | 3 | 93.04 | < 0.001 | 3 | 101.11 | < 0.001 | 3 | 81.40 | < 0.001 |
| Plant history (PH) | 1 | < 0.01 | 0.957 | 1 | 2.79 | 0.095 | 1 | 3.34 | 0.068 | 1 | 1.20 | 0.274 |
| Soil history (SH) | 1 | 2.79 | 0.095 | 1 | 1.27 | 0.259 | 1 | 0.05 | 0.828 | 1 | 0.11 | 0.742 |
| Soil treatment (ST) | 2 | 0.60 | 0.740 | 2 | 0.74 | 0.691 | 2 | 2.08 | 0.354 | 2 | 4.40 | 0.111 |
| Species ID x PH | 3 | 2.74 | 0.434 | 3 | 1.34 | 0.720 | 3 | 0.78 | 0.855 | 3 | 0.76 | 0.860 |
| Species ID x SH | 3 | 3.68 | 0.299 | 3 | 3.00 | 0.391 | 3 | 3.11 | 0.375 | 3 | 4.02 | 0.259 |
| Species ID x ST | 6 | 7.55 | 0.273 | 6 | 5.43 | 0.490 | 6 | 3.05 | 0.803 | 6 | 9.25 | 0.160 |
Table 3
Summary list of response variables and experimental factors of the common garden experiment.
| Variable | Abbreviation | Unit | Description |
|---|---|---|---|
| Response variables | |||
| Biomass production | |||
| Total biomass | Total Bm | gtotal | Shoot and root biomass per pot |
| Shoot mass | Shoot Bm | gshoot | Shoot biomass per pot |
| Root mass | Root Bm | groot | Root biomass per pot |
| Root-shoot ratio | - | groot gshoot−1 | Root biomass divided by shoot biomass per pot |
| Aboveground traits | |||
| Growth height | - | cm | Stretched shoot length of longest vegetative shoot* |
| Shoot nitrogen concentration | NShoot | mg N gshoot−1 | Nitrogen mass per dry shoot mass |
| Leaf greenness | - | - | Unitless estimate of leaf chlorophyll concentration* |
| Specific leaf area | SLA | mmleaf2 mgleaf−1 | Leaf area per dry leaf mass* |
| Leaf dry matter content | LDMC | mgleaf gleaf−1 | Dry leaf mass per water-saturated fresh leaf mass* |
| Stomatal conductance | gs | mmol m−2 s−1 | Stomatal conductance per leaf area* |
| Belowground traits | |||
| Root diameter | Dia | mm | Average root diameter of the root subsample |
| Specific root length | SRL | mroot groot−1 | Root length per dry root biomass (subsample) |
| Root length density | RLD | cmroot cmsoil−3 | Root length (extrapolated) per soil volume (pot) |
| Pathogen infestation | - | % | Percentage of infested leaf area (estimated)* |
| Experimental factors | |||
| Species identity | Species ID | - | Study species |
| Legacy treatments | |||
| Plant history | PH | - | Species richness of the plant community, where the seeds were collected – two or six plant species |
| Soil history | SH | - | Species richness of plant community, where the soil for inoculation was taken – two or six plant species |
| Soil treatment | ST | - | Origin of seed and soil in one pot:
|
| Global change driver treatments | global change driver / global change / GC | ||
| Drought treatment | Drought / D | - | 30% instead of 60% water saturation |
| Nitrogen input treatment | Nitrogen input / N | - | Fertilization with NH4NO3 (150 kg ha-1 year-1 nitrogen) |
-
*
averaged per pot.
Appendix 1—table 1
Summary of mixed-effect model analyses testing the effects of legacy treatments (plant history, soil history, soil treatment) on plant performance (total biomass, shoot biomass, root biomass and root-shoot ratio) of A. elatius, when non-treated (control) or treated with GC drivers (drought, nitrogen input, drought and nitrogen input (D x N)).
Shown are degrees of freedom (Df), Chi2 and p-values (p). Significant effects (p < 0.05) are given in bold, marginally significant effects (p < 0.1) in italics.
| A. elatius | Total biomass | |||||||||||
|---|---|---|---|---|---|---|---|---|---|---|---|---|
| Control | Drought | Nitrogen | D x N | |||||||||
| Df | Chi2 | p | Df | Chi2 | p | Df | Chi2 | p | Df | Chi2 | p | |
| Plant history | 1 | 0.35 | 0.557 | 1 | 0.82 | 0.364 | 1 | 0.71 | 0.401 | 1 | 0.26 | 0.613 |
| Soil history | 1 | 1.08 | 0.298 | 1 | 0.76 | 0.383 | 1 | 0.06 | 0.811 | 1 | 0.47 | 0.494 |
| Soil treatment | 2 | 0.10 | 0.949 | 2 | 2.91 | 0.233 | 2 | 6.44 | 0.040 | 2 | 0.99 | 0.610 |
| Shoot biomass | ||||||||||||
| Control | Drought | Nitrogen | D x N | |||||||||
| Df | Chi2 | p | Df | Chi2 | p | Df | Chi2 | p | Df | Chi2 | p | |
| Plant history | 1 | 0.12 | 0.726 | 1 | 3.36 | 0.067 | 1 | 1.27 | 0.260 | 1 | 0.01 | 0.904 |
| Soil history | 1 | 0.35 | 0.556 | 1 | 0.24 | 0.621 | 1 | 0.55 | 0.460 | 1 | 0.63 | 0.428 |
| Soil treatment | 2 | 2.08 | 0.354 | 2 | 2.89 | 0.236 | 2 | 5.24 | 0.073 | 2 | 0.98 | 0.613 |
| Root biomass | ||||||||||||
| Control | Drought | Nitrogen | D x N | |||||||||
| Df | Chi2 | p | Df | Chi2 | p | Df | Chi2 | p | Df | Chi2 | p | |
| Plant history | 1 | 0.03 | 0.860 | 1 | 0.15 | 0.701 | 1 | 0.01 | 0.916 | 1 | 0.36 | 0.551 |
| Soil history | 1 | 3.81 | 0.051 | 1 | 0.62 | 0.433 | 1 | 0.17 | 0.676 | 1 | 0.22 | 0.636 |
| Soil treatment | 2 | 2.05 | 0.359 | 2 | 2.38 | 0.304 | 2 | 2.25 | 0.325 | 2 | 1.68 | 0.432 |
| Root-shoot ratio | ||||||||||||
| Control | Drought | Nitrogen | D x N | |||||||||
| Df | Chi2 | p | Df | Chi2 | p | Df | Chi2 | p | Df | Chi2 | p | |
| Plant history | 1 | 0.07 | 0.797 | 1 | 1.62 | 0.203 | 1 | 0.16 | 0.691 | 1 | 0.31 | 0.576 |
| Soil history | 1 | 4.86 | 0.027 | 1 | 0.24 | 0.626 | 1 | 0.50 | 0.479 | 1 | 0.07 | 0.787 |
| Soil treatment | 2 | 3.11 | 0.211 | 2 | 2.39 | 0.302 | 2 | 0.18 | 0.915 | 2 | 1.88 | 0.391 |
Appendix 1—table 2
Summary of mixed-effect model analyses testing the effects of legacy treatments (plant history, soil history, soil treatment) on plant performance (total biomass, shoot biomass, root biomass and root-shoot ratio) of A. pratensis, when non-treated (control) or treated with GC drivers (drought, nitrogen input, drought and nitrogen input (D x N)).
Shown are degrees of freedom (Df), Chi2 and p-values (p). Significant effects (p < 0.05) are given in bold, marginally significant effects (p < 0.1) in italics.
| A. pratensis | Total biomass | |||||||||||
|---|---|---|---|---|---|---|---|---|---|---|---|---|
| Control | Drought | Nitrogen | D x N | |||||||||
| Df | Chi2 | p | Df | Chi2 | p | Df | Chi2 | p | Df | Chi2 | p | |
| Plant history | 1 | 0.05 | 0.820 | 1 | 0.27 | 0.603 | 1 | 1.63 | 0.202 | 1 | 1.44 | 0.230 |
| Soil history | 1 | 0.02 | 0.879 | 1 | 1.05 | 0.306 | 1 | 2.97 | 0.085 | 1 | 2.07 | 0.151 |
| Soil treatment | 2 | 3.43 | 0.180 | 2 | 0.17 | 0.917 | 2 | 1.29 | 0.525 | 2 | 2.80 | 0.247 |
| Shoot biomass | ||||||||||||
| Control | Drought | Nitrogen | D x N | |||||||||
| Df | Chi2 | p | Df | Chi2 | p | Df | Chi2 | p | Df | Chi2 | p | |
| Plant history | 1 | 0.11 | 0.741 | 1 | 0.29 | 0.590 | 1 | 0.65 | 0.421 | 1 | 2.23 | 0.135 |
| Soil history | 1 | 0.14 | 0.710 | 1 | 0.33 | 0.564 | 1 | 0.86 | 0.354 | 1 | <0.01 | 0.971 |
| Soil treatment | 2 | 0.15 | 0.927 | 2 | 1.84 | 0.398 | 2 | 1.03 | 0.596 | 2 | 1.35 | 0.509 |
| Root biomass | ||||||||||||
| Control | Drought | Nitrogen | D x N | |||||||||
| Df | Chi2 | p | Df | Chi2 | p | Df | Chi2 | p | Df | Chi2 | p | |
| Plant history | 1 | 0.13 | 0.719 | 1 | 0.23 | 0.629 | 1 | 0.97 | 0.324 | 1 | 0.47 | 0.495 |
| Soil history | 1 | 0.15 | 0.703 | 1 | 1.16 | 0.281 | 1 | 1.83 | 0.176 | 1 | 3.98 | 0.046 |
| Soil treatment | 2 | 2.78 | 0.250 | 2 | 1.38 | 0.501 | 2 | 0.47 | 0.789 | 2 | 3.16 | 0.206 |
| Root-shoot ratio | ||||||||||||
| Control | Drought | Nitrogen | D x N | |||||||||
| Df | Chi2 | p | Df | Chi2 | p | Df | Chi2 | p | Df | Chi2 | p | |
| Plant history | 1 | 0.13 | 0.719 | 1 | 0.01 | 0.920 | 1 | 0.30 | 0.584 | 1 | 0.90 | 0.342 |
| Soil history | 1 | 0.20 | 0.654 | 1 | 0.31 | 0.579 | 1 | 0.42 | 0.517 | 1 | 4.57 | 0.033 |
| Soil treatment | 2 | 1.33 | 0.514 | 2 | 4.94 | 0.084 | 2 | 0.04 | 0.982 | 2 | 0.37 | 0.832 |
Appendix 1—table 3
Summary of mixed-effect model analyses testing the effects of legacy treatments (plant history, soil history, soil treatment) on plant performance (total biomass, shoot biomass, root biomass and root-shoot ratio) of D. glomerata, when non-treated (control) or treated with GC drivers (drought, nitrogen input, drought and nitrogen input (D x N)).
Shown are degrees of freedom (Df), Chi2 and p-values (p). Significant effects (p < 0.05) are given in bold, marginally significant effects (p < 0.1) in italics.
| D. glomerata | Total biomass | |||||||||||
|---|---|---|---|---|---|---|---|---|---|---|---|---|
| Control | Drought | Nitrogen | D x N | |||||||||
| Df | Chi2 | p | Df | Chi2 | p | Df | Chi2 | p | Df | Chi2 | p | |
| Plant history | 1 | 0.56 | 0.456 | 1 | 2.22 | 0.136 | 1 | 3.09 | 0.079 | 1 | 0.13 | 0.715 |
| Soil history | 1 | 6.28 | 0.012 | 1 | 0.76 | 0.384 | 1 | 0.73 | 0.394 | 1 | <0.01 | 0.978 |
| Soil treatment | 2 | 1.52 | 0.467 | 2 | 0.94 | 0.626 | 2 | 1.26 | 0.533 | 2 | 0.73 | 0.693 |
| Shoot biomass | ||||||||||||
| Control | Drought | Nitrogen | D x N | |||||||||
| Df | Chi2 | p | Df | Chi2 | p | Df | Chi2 | p | Df | Chi2 | p | |
| Plant history | 1 | 0.02 | 0.885 | 1 | 1.28 | 0.259 | 1 | 3.18 | 0.075 | 1 | 0.22 | 0.640 |
| Soil history | 1 | 8.27 | 0.004 | 1 | 0.81 | 0.369 | 1 | 0.33 | 0.567 | 1 | 0.15 | 0.700 |
| Soil treatment | 2 | 3.06 | 0.216 | 2 | 0.44 | 0.801 | 2 | 3.34 | 0.188 | 2 | 0.14 | 0.932 |
| Root biomass | ||||||||||||
| Control | Drought | Nitrogen | D x N | |||||||||
| Df | Chi2 | p | Df | Chi2 | p | Df | Chi2 | p | Df | Chi2 | p | |
| Plant history | 1 | 1.40 | 0.236 | 1 | 2.55 | 0.111 | 1 | 1.98 | 0.160 | 1 | 0.04 | 0.848 |
| Soil history | 1 | 0.90 | 0.343 | 1 | 0.45 | 0.501 | 1 | 0.99 | 0.319 | 1 | 0.21 | 0.644 |
| Soil treatment | 2 | 2.49 | 0.288 | 2 | 2.06 | 0.358 | 2 | 0.02 | 0.992 | 2 | 3.16 | 0.206 |
| Root-shoot ratio | ||||||||||||
| Control | Drought | Nitrogen | D x N | |||||||||
| Df | Chi2 | p | Df | Chi2 | p | Df | Chi2 | p | Df | Chi2 | p | |
| Plant history | 1 | 1.65 | 0.199 | 1 | 1.71 | 0.191 | 1 | 0.93 | 0.335 | 1 | 0.01 | 0.936 |
| Soil history | 1 | <0.01 | 0.983 | 1 | 0.44 | 0.505 | 1 | 0.43 | 0.514 | 1 | 0.75 | 0.387 |
| Soil treatment | 2 | 3.14 | 0.208 | 2 | 2.84 | 0.242 | 2 | 0.20 | 0.906 | 2 | 7.72 | 0.021 |
Appendix 1—table 4
Summary of mixed-effect model analyses testing the effects of legacy treatments (plant history, soil history, soil treatment) on plant performance (total biomass, shoot biomass, root biomass and root-shoot ratio) of P. trivialis, when non-treated (control) or treated with GC drivers (drought, nitrogen input, drought and nitrogen input (D x N)).
Shown are degrees of freedom (Df), Chi2 and p-values (p). Significant effects (p < 0.05) are given in bold, marginally significant effects (p < 0.1) in italics.
| P. trivialis | Total biomass | |||||||||||
|---|---|---|---|---|---|---|---|---|---|---|---|---|
| Control | Drought | Nitrogen | D x N | |||||||||
| Df | Chi2 | p | Df | Chi2 | p | Df | Chi2 | p | Df | Chi2 | p | |
| Plant history | 1 | 0.12 | 0.732 | 1 | 1.25 | 0.264 | 1 | 0.28 | 0.599 | 1 | 0.43 | 0.513 |
| Soil history | 1 | 0.12 | 0.731 | 1 | 0.14 | 0.704 | 1 | 0.07 | 0.796 | 1 | 0.05 | 0.826 |
| Soil treatment | 2 | 0.01 | 0.995 | 2 | 1.82 | 0.404 | 2 | 1.69 | 0.430 | 2 | 4.06 | 0.131 |
| Shoot biomass | ||||||||||||
| Control | Drought | Nitrogen | D x N | |||||||||
| Df | Chi2 | p | Df | Chi2 | p | Df | Chi2 | p | Df | Chi2 | p | |
| Plant history | 1 | 0.01 | 0.920 | 1 | 1.91 | 0.167 | 1 | 0.39 | 0.532 | 1 | 0.01 | 0.943 |
| Soil history | 1 | <0.01 | 0.973 | 1 | 0.47 | 0.492 | 1 | 0.46 | 0.499 | 1 | 0.19 | 0.663 |
| Soil treatment | 2 | 1.34 | 0.511 | 2 | 0.81 | 0.667 | 2 | 1.22 | 0.545 | 2 | 2.96 | 0.227 |
| Root biomass | ||||||||||||
| Control | Drought | Nitrogen | D x N | |||||||||
| Df | Chi2 | p | Df | Chi2 | p | Df | Chi2 | p | Df | Chi2 | p | |
| Plant history | 1 | 0.21 | 0.647 | 1 | 0.66 | 0.417 | 1 | 1.48 | 0.224 | 1 | 1.45 | 0.229 |
| Soil history | 1 | 0.33 | 0.566 | 1 | 1.24 | 0.266 | 1 | 0.74 | 0.389 | 1 | 0.03 | 0.870 |
| Soil treatment | 2 | 1.36 | 0.506 | 2 | 1.10 | 0.577 | 2 | 1.99 | 0.370 | 2 | 5.03 | 0.081 |
| Root-shoot ratio | ||||||||||||
| Control | Drought | Nitrogen | D x N | |||||||||
| Df | Chi2 | p | Df | Chi2 | p | Df | Chi2 | p | Df | Chi2 | p | |
| Plant history | 1 | 0.23 | 0.630 | 1 | 0.14 | 0.708 | 1 | 2.00 | 0.158 | 1 | 2.25 | 0.134 |
| Soil history | 1 | 0.23 | 0.630 | 1 | 3.19 | 0.074 | 1 | 1.57 | 0.211 | 1 | 0.15 | 0.697 |
| Soil treatment | 2 | 3.61 | 0.164 | 2 | 0.68 | 0.711 | 2 | 2.16 | 0.340 | 2 | 5.12 | 0.077 |
Appendix 1—table 5
Summary of mixed-effect model analyses testing the effects of species identity, legacy treatments (plant history, soil history, soil treatment) and their interactions on plant trait expressions, when non-treated (control) or treated with GC drivers (drought, nitrogen input, drought and nitrogen input (D x N)).
Shown are degrees of freedom (Df), Chi2 and p-values (p). Significant effects (p < 0.05) are given in bold, marginally significant effects (p < 0.1) in italics.
| Growth height | ||||||||||||
|---|---|---|---|---|---|---|---|---|---|---|---|---|
| Control | Drought | Nitrogen | D x N | |||||||||
| Df | Chi2 | p | Df | Chi2 | p | Df | Chi2 | p | Df | Chi2 | p | |
| Species ID | 3 | 36.51 | <0.001 | 3 | 46.47 | <0.001 | 3 | 26.45 | <0.001 | 3 | 53.85 | <0.001 |
| Plant history (PH) | 1 | 1.76 | 0.185 | 1 | 1.08 | 0.299 | 1 | 0.06 | 0.812 | 1 | 0.75 | 0.387 |
| Soil history (SH) | 1 | 0.48 | 0.488 | 1 | 0.86 | 0.354 | 1 | 1.52 | 0.217 | 1 | 1.40 | 0.237 |
| Soil treatment (ST) | 2 | 3.99 | 0.136 | 2 | 5.49 | 0.064 | 2 | 2.68 | 0.262 | 2 | 4.37 | 0.113 |
| Species ID x PH | 3 | 4.12 | 0.249 | 3 | 4.53 | 0.210 | 3 | 2.62 | 0.455 | 3 | 0.17 | 0.982 |
| Species ID x SH | 3 | 3.65 | 0.301 | 3 | 1.16 | 0.762 | 3 | 1.14 | 0.766 | 3 | 6.66 | 0.084 |
| Species ID x ST | 6 | 8.19 | 0.224 | 6 | 13.52 | 0.035 | 6 | 6.01 | 0.423 | 6 | 7.18 | 0.305 |
| Shoot nitrogen concentration | ||||||||||||
| Control | Drought | Nitrogen | D x N | |||||||||
| Df | Chi2 | p | Df | Chi2 | p | Df | Chi2 | p | Df | Chi2 | p | |
| Species ID | 3 | 49.63 | <0.001 | 3 | 23.08 | <0.001 | 3 | 73.52 | <0.001 | 3 | 30.02 | <0.001 |
| Plant history (PH) | 1 | 0.94 | 0.333 | 1 | 0.08 | 0.775 | 1 | 0.50 | 0.480 | 1 | 0.03 | 0.871 |
| Soil history (SH) | 1 | <0.01 | 0.963 | 1 | 1.50 | 0.221 | 1 | 4.67 | 0.031 | 1 | <0.01 | 0.953 |
| Soil treatment (ST) | 2 | 2.94 | 0.230 | 2 | 1.32 | 0.517 | 2 | 7.52 | 0.023 | 2 | 8.53 | 0.014 |
| Species ID x PH | 3 | 2.80 | 0.424 | 3 | 5.03 | 0.170 | 3 | 4.00 | 0.262 | 3 | 2.20 | 0.533 |
| Species ID x SH | 3 | 1.14 | 0.767 | 3 | 2.99 | 0.392 | 3 | 7.02 | 0.071 | 3 | 0.31 | 0.958 |
| Species ID x ST | 6 | 12.36 | 0.054 | 6 | 6.88 | 0.332 | 6 | 6.13 | 0.409 | 6 | 4.73 | 0.579 |
| Leaf greenness | ||||||||||||
| Control | Drought | Nitrogen | D x N | |||||||||
| Df | Chi2 | p | Df | Chi2 | p | Df | Chi2 | p | Df | Chi2 | p | |
| Species ID | 3 | 45.88 | <0.001 | 3 | 44.96 | <0.001 | 3 | 54.85 | <0.001 | 3 | 71.04 | <0.001 |
| Plant history (PH) | 1 | 1.61 | 0.204 | 1 | 0.11 | 0.740 | 1 | 0.43 | 0.514 | 1 | 0.02 | 0.876 |
| Soil history (SH) | 1 | 0.18 | 0.675 | 1 | 1.84 | 0.175 | 1 | 1.04 | 0.308 | 1 | 0.11 | 0.738 |
| Soil treatment (ST) | 2 | 2.10 | 0.350 | 2 | 1.62 | 0.444 | 2 | 0.41 | 0.813 | 2 | 1.62 | 0.445 |
| Species ID x PH | 3 | 4.39 | 0.222 | 3 | 3.98 | 0.264 | 3 | 1.88 | 0.600 | 3 | 2.78 | 0.427 |
| Species ID x SH | 3 | 4.45 | 0.216 | 3 | 3.44 | 0.329 | 3 | 0.89 | 0.829 | 3 | 0.35 | 0.950 |
| Species ID x ST | 6 | 3.54 | 0.739 | 6 | 3.92 | 0.688 | 6 | 8.79 | 0.186 | 6 | 3.38 | 0.759 |
| LDMC | ||||||||||||
| Control | Drought | Nitrogen | D x N | |||||||||
| Df | Chi2 | p | Df | Chi2 | p | Df | Chi2 | p | Df | Chi2 | p | |
| Species ID | 3 | 32.76 | <0.001 | 3 | 22.47 | <0.001 | 3 | 78.30 | <0.001 | 3 | 43.04 | <0.001 |
| Plant history (PH) | 1 | 0.33 | 0.565 | 1 | 2.01 | 0.156 | 1 | 0.03 | 0.861 | 1 | 0.03 | 0.870 |
| Soil history (SH) | 1 | 0.02 | 0.887 | 1 | 0.56 | 0.456 | 1 | 0.06 | 0.808 | 1 | 0.17 | 0.680 |
| Soil treatment (ST) | 2 | 2.83 | 0.243 | 2 | 1.27 | 0.529 | 2 | 1.34 | 0.511 | 2 | 0.80 | 0.670 |
| Species ID x PH | 3 | 1.71 | 0.635 | 3 | 0.26 | 0.967 | 3 | 1.00 | 0.802 | 3 | 4.79 | 0.188 |
| Species ID x SH | 3 | 1.69 | 0.638 | 3 | 4.04 | 0.257 | 3 | 5.48 | 0.140 | 3 | 2.91 | 0.405 |
| Species ID x ST | 6 | 3.52 | 0.742 | 6 | 1.10 | 0.981 | 6 | 5.73 | 0.454 | 6 | 11.22 | 0.082 |
| SLA | ||||||||||||
| Control | Drought | Nitrogen | D x N | |||||||||
| Df | Chi2 | p | Df | Chi2 | p | Df | Chi2 | p | Df | Chi2 | p | |
| Species ID | 3 | 86.36 | <0.001 | 3 | 57.20 | <0.001 | 3 | 101.71 | <0.001 | 3 | 73.53 | <0.001 |
| Plant history (PH) | 1 | 0.19 | 0.661 | 1 | 0.39 | 0.530 | 1 | 1.55 | 0.214 | 1 | 0.33 | 0.567 |
| Soil history (SH) | 1 | 0.64 | 0.425 | 1 | 0.01 | 0.926 | 1 | 3.35 | 0.067 | 1 | 0.26 | 0.607 |
| Soil treatment (ST) | 2 | 4.38 | 0.112 | 2 | 1.43 | 0.488 | 2 | 2.32 | 0.313 | 2 | 1.50 | 0.472 |
| Species ID x PH | 3 | 1.58 | 0.663 | 3 | 1.26 | 0.738 | 3 | 0.96 | 0.810 | 3 | 4.38 | 0.223 |
| Species ID x SH | 3 | 2.26 | 0.521 | 3 | 1.47 | 0.690 | 3 | 3.69 | 0.297 | 3 | 1.90 | 0.592 |
| Species ID x ST | 6 | 2.38 | 0.882 | 6 | 2.88 | 0.824 | 6 | 4.08 | 0.666 | 6 | 14.22 | 0.027 |
| Stomatal conductance | ||||||||||||
| Control | Drought | Nitrogen | D x N | |||||||||
| Df | Chi2 | p | Df | Chi2 | p | Df | Chi2 | p | Df | Chi2 | p | |
| Temperature | 1 | 0.75 | 0.388 | 1 | 1.40 | 0.237 | 1 | 3.18 | 0.074 | 1 | 0.18 | 0.670 |
| Daytime | 1 | 18.95 | <0.001 | 1 | 13.20 | <0.001 | 1 | 5.72 | <0.001 | 1 | 16.06 | <0.001 |
| Species ID | 3 | 45.36 | <0.001 | 3 | 24.61 | <0.001 | 3 | 42.88 | <0.001 | 3 | 21.71 | <0.001 |
| Plant history (PH) | 1 | 0.60 | 0.438 | 1 | 0.01 | 0.910 | 1 | 0.48 | 0.490 | 1 | 2.95 | 0.086 |
| Soil history (SH) | 1 | 0.10 | 0.757 | 1 | 0.05 | 0.818 | 1 | 1.15 | 0.283 | 1 | 0.07 | 0.797 |
| Soil treatment (ST) | 2 | 0.08 | 0.963 | 2 | 2.67 | 0.263 | 2 | 4.85 | 0.088 | 2 | 0.20 | 0.905 |
| Species ID x PH | 3 | 4.59 | 0.204 | 3 | 3.18 | 0.365 | 3 | 4.89 | 0.180 | 3 | 4.89 | 0.180 |
| Species ID x SH | 3 | 2.60 | 0.457 | 3 | 3.53 | 0.317 | 3 | 3.23 | 0.358 | 3 | 3.36 | 0.340 |
| Species ID x ST | 6 | 8.36 | 0.213 | 6 | 4.47 | 0.614 | 6 | 3.82 | 0.701 | 6 | 4.76 | 0.575 |
| Root diameter | ||||||||||||
| Control | Drought | Nitrogen | D x N | |||||||||
| Df | Chi2 | p | Df | Chi2 | p | Df | Chi2 | p | Df | Chi2 | p | |
| Species ID | 3 | 97.02 | <0.001 | 3 | 103.81 | <0.001 | 3 | 93.37 | <0.001 | 3 | 106.66 | <0.001 |
| Plant history (PH) | 1 | 0.87 | 0.352 | 1 | 0.02 | 0.883 | 1 | <0.01 | 0.951 | 1 | 0.08 | 0.775 |
| Soil history (SH) | 1 | 0.17 | 0.680 | 1 | 0.22 | 0.643 | 1 | 1.41 | 0.235 | 1 | 0.03 | 0.873 |
| Soil treatment (ST) | 2 | 2.42 | 0.298 | 2 | 0.93 | 0.629 | 2 | 1.28 | 0.528 | 2 | 0.46 | 0.793 |
| Species ID x PH | 3 | 0.79 | 0.852 | 3 | 0.19 | 0.979 | 3 | 4.53 | 0.291 | 3 | 3.28 | 0.350 |
| Species ID x SH | 3 | 6.10 | 0.107 | 3 | 3.40 | 0.334 | 3 | 5.40 | 0.145 | 3 | 0.31 | 0.959 |
| Species ID x ST | 6 | 9.36 | 0.155 | 6 | 2.06 | 0.914 | 6 | 1.41 | 0.965 | 6 | 13.49 | 0.036 |
| SRL | ||||||||||||
| Control | Drought | Nitrogen | D x N | |||||||||
| Df | Chi2 | p | Df | Chi2 | p | Df | Chi2 | p | Df | Chi2 | p | |
| Species ID | 3 | 125.58 | <0.001 | 3 | 123.96 | <0.001 | 3 | 117.21 | <0.001 | 3 | 144.90 | <0.001 |
| Plant history (PH) | 1 | 0.31 | 0.579 | 1 | 0.04 | 0.833 | 1 | 2.81 | 0.094 | 1 | 0.05 | 0.830 |
| Soil history (SH) | 1 | <0.01 | 0.986 | 1 | 1.17 | 0.279 | 1 | 1.37 | 0.242 | 1 | 1.48 | 0.224 |
| Soil treatment (ST) | 2 | 1.46 | 0.483 | 2 | 0.67 | 0.717 | 2 | 4.01 | 0.135 | 2 | 0.28 | 0.869 |
| Species ID x PH | 3 | 5.15 | 0.161 | 3 | 2.11 | 0.550 | 3 | 2.96 | 0.397 | 3 | 2.31 | 0.510 |
| Species ID x SH | 3 | 3.89 | 0.274 | 3 | 6.14 | 0.105 | 3 | 3.40 | 0.334 | 3 | 1.93 | 0.586 |
| Species ID x ST | 6 | 13.23 | 0.040 | 6 | 2.92 | 0.819 | 6 | 2.90 | 0.821 | 6 | 14.70 | 0.023 |
| RLD | ||||||||||||
| Control | Drought | Nitrogen | D x N | |||||||||
| Df | Chi2 | p | Df | Chi2 | p | Df | Chi2 | p | Df | Chi2 | p | |
| Species ID | 3 | 99.14 | <0.001 | 3 | 101.33 | <0.001 | 3 | 91.27 | <0.001 | 3 | 75.25 | <0.001 |
| Plant history (PH) | 1 | 0.00 | 0.956 | 1 | 3.36 | 0.067 | 1 | 0.11 | 0.742 | 1 | 0.98 | 0.323 |
| Soil history (SH) | 1 | 2.93 | 0.087 | 1 | 0.14 | 0.710 | 1 | 0.67 | 0.413 | 1 | 0.55 | 0.460 |
| Soil treatment (ST) | 2 | 2.50 | 0.286 | 2 | 2.56 | 0.279 | 2 | 0.03 | 0.983 | 2 | 4.98 | 0.083 |
| Species ID x PH | 3 | 1.35 | 0.716 | 3 | 5.11 | 0.164 | 3 | 2.59 | 0.459 | 3 | 0.59 | 0.900 |
| Species ID x SH | 3 | 5.42 | 0.144 | 3 | 2.89 | 0.409 | 3 | 0.45 | 0.929 | 3 | 0.49 | 0.921 |
| Species ID x ST | 6 | 2.77 | 0.838 | 6 | 4.44 | 0.617 | 6 | 0.91 | 0.989 | 6 | 6.27 | 0.393 |
Appendix 1—table 6
Summary of mixed-effect model analyses testing the effects of legacy treatments (plant history, soil history, soil treatment) on plant trait expressions of A. elatius, when non-treated (control) or treated with GC drivers (drought, nitrogen input, drought and nitrogen input (D x N)).
Shown are degrees of freedom (Df), Chi2 and p-values (p). Significant effects (p < 0.05) are given in bold, marginally significant effects (p < 0.1) in italics.
| A. elatius | Growth height | |||||||||||
|---|---|---|---|---|---|---|---|---|---|---|---|---|
| Control | Drought | Nitrogen | D x N | |||||||||
| Df | Chi2 | p | Df | Chi2 | p | Df | Chi2 | p | Df | Chi2 | p | |
| Plant history | 1 | 0.32 | 0.569 | 1 | 2.94 | 0.087 | 1 | 1.01 | 0.314 | 1 | 0.13 | 0.719 |
| Soil history | 1 | 1.50 | 0.221 | 1 | 0.07 | 0.787 | 1 | 0.14 | 0.706 | 1 | 0.29 | 0.593 |
| Soil treatment | 2 | 2.67 | 0.263 | 2 | 10.64 | 0.005 | 2 | 1.55 | 0.461 | 2 | 7.58 | 0.023 |
| Shoot nitrogen concentration | ||||||||||||
| Control | Drought | Nitrogen | D x N | |||||||||
| Df | Chi2 | p | Df | Chi2 | p | Df | Chi2 | p | Df | Chi2 | p | |
| Plant history | 1 | 0.52 | 0.472 | 1 | 3.46 | 0.063 | 1 | <0.01 | 0.974 | 1 | 0.06 | 0.802 |
| Soil history | 1 | 0.89 | 0.347 | 1 | 0.04 | 0.843 | 1 | 1.64 | 0.200 | 1 | 0.06 | 0.803 |
| Soil treatment | 2 | 1.40 | 0.497 | 2 | 1.54 | 0.462 | 2 | 1.99 | 0.369 | 2 | 2.07 | 0.354 |
| Leaf greenness | ||||||||||||
| Control | Drought | Nitrogen | D x N | |||||||||
| Df | Chi2 | p | Df | Chi2 | p | Df | Chi2 | p | Df | Chi2 | p | |
| Plant history | 1 | 1.19 | 0.275 | 1 | 0.60 | 0.438 | 1 | 1.13 | 0.288 | 1 | 0.22 | 0.636 |
| Soil history | 1 | 1.50 | 0.221 | 1 | 0.99 | 0.321 | 1 | 0.03 | 0.862 | 1 | 0.15 | 0.699 |
| Soil treatment | 2 | 5.20 | 0.074 | 2 | 0.44 | 0.801 | 2 | 3.64 | 0.162 | 2 | 0.84 | 0.656 |
| LDMC | ||||||||||||
| Control | Drought | Nitrogen | D x N | |||||||||
| Df | Chi2 | p | Df | Chi2 | p | Df | Chi2 | p | Df | Chi2 | p | |
| Plant history | 1 | 0.01 | 0.942 | 1 | 1.15 | 0.284 | 1 | <0.01 | 0.987 | 1 | 1.02 | 0.313 |
| Soil history | 1 | 0.07 | 0.798 | 1 | 0.13 | 0.718 | 1 | 0.04 | 0.837 | 1 | 0.31 | 0.580 |
| Soil treatment | 2 | 0.03 | 0.985 | 2 | 0.34 | 0.844 | 2 | 2.00 | 0.369 | 2 | 2.44 | 0.295 |
| SLA | ||||||||||||
| Control | Drought | Nitrogen | D x N | |||||||||
| Df | Chi2 | p | Df | Chi2 | p | Df | Chi2 | p | Df | Chi2 | p | |
| Plant history | 1 | 0.44 | 0.507 | 1 | 0.61 | 0.435 | 1 | 0.48 | 0.488 | 1 | 1.63 | 0.202 |
| Soil history | 1 | 0.04 | 0.836 | 1 | 0.22 | 0.638 | 1 | 0.88 | 0.348 | 1 | 1.08 | 0.300 |
| Soil treatment | 2 | 0.59 | 0.744 | 2 | 0.13 | 0.936 | 2 | 2.74 | 0.254 | 2 | 3.10 | 0.212 |
| Stomatal conductance | ||||||||||||
| Control | Drought | Nitrogen | D x N | |||||||||
| Df | Chi2 | p | Df | Chi2 | p | Df | Chi2 | p | Df | Chi2 | p | |
| Temperature | 1 | 0.05 | 0.827 | 1 | 0.53 | 0.465 | 1 | 0.91 | 0.340 | 1 | 0.09 | 0.763 |
| Daytime | 1 | 6.15 | 0.013 | 1 | 3.92 | 0.048 | 1 | 0.68 | 0.408 | 1 | 0.37 | 0.544 |
| Plant history | 1 | 0.49 | 0.484 | 1 | 0.05 | 0.824 | 1 | 1.23 | 0.267 | 1 | 0.18 | 0.670 |
| Soil history | 1 | 0.83 | 0.361 | 1 | 0.13 | 0.718 | 1 | 0.92 | 0.336 | 1 | <0.01 | 0.998 |
| Soil treatment | 2 | 0.96 | 0.618 | 2 | 1.69 | 0.429 | 2 | 2.99 | 0.224 | 2 | 0.33 | 0.846 |
| Root diameter | ||||||||||||
| Control | Drought | Nitrogen | D x N | |||||||||
| Df | Chi2 | p | Df | Chi2 | p | Df | Chi2 | p | Df | Chi2 | p | |
| Plant history | 1 | 0.24 | 0.627 | 1 | <0.01 | 0.972 | 1 | 0.46 | 0.497 | 1 | 0.45 | 0.503 |
| Soil history | 1 | 1.37 | 0.242 | 1 | 0.53 | 0.467 | 1 | 2.59 | 0.108 | 1 | 0.10 | 0.754 |
| Soil treatment | 2 | 4.85 | 0.089 | 2 | 0.52 | 0.770 | 2 | 1.00 | 0.605 | 2 | 3.86 | 0.145 |
| SRL | ||||||||||||
| Control | Drought | Nitrogen | D x N | |||||||||
| Df | Chi2 | p | Df | Chi2 | p | Df | Chi2 | p | Df | Chi2 | p | |
| Plant history | 1 | 0.80 | 0.371 | 1 | 0.16 | 0.686 | 1 | 2.32 | 0.128 | 1 | 0.54 | 0.462 |
| Soil history | 1 | 0.06 | 0.807 | 1 | 0.02 | 0.884 | 1 | 2.66 | 0.103 | 1 | 0.21 | 0.649 |
| Soil treatment | 2 | 2.94 | 0.230 | 2 | 1.81 | 0.404 | 2 | 4.63 | 0.099 | 2 | 9.49 | 0.009 |
| RLD | ||||||||||||
| Control | Drought | Nitrogen | D x N | |||||||||
| Df | Chi2 | p | Df | Chi2 | p | Df | Chi2 | p | Df | Chi2 | p | |
| Plant history | 1 | 1.02 | 0.313 | 1 | 0.03 | 0.859 | 1 | 2.42 | 0.120 | 1 | 1.44 | 0.230 |
| Soil history | 1 | 2.51 | 0.113 | 1 | 1.14 | 0.286 | 1 | 1.03 | 0.310 | 1 | 0.46 | 0.500 |
| Soil treatment | 2 | 4.52 | 0.104 | 2 | 1.24 | 0.539 | 2 | 0.26 | 0.878 | 2 | 1.40 | 0.497 |
Appendix 1—table 7
Summary of mixed-effect model analyses testing the effects of legacy treatments (plant history, soil history, soil treatment) on plant trait expressions of A. pratensis, when non-treated (control) or treated with GC drivers (drought, nitrogen input, drought and nitrogen input (D x N)).
Shown are degrees of freedom (Df), Chi2 and p-values (p). Significant effects (p < 0.05) are given in bold, marginally significant effects (p < 0.1) in italics.
| A. pratensis | Growth height | |||||||||||
|---|---|---|---|---|---|---|---|---|---|---|---|---|
| Control | Drought | Nitrogen | D x N | |||||||||
| Df | Chi2 | p | Df | Chi2 | p | Df | Chi2 | p | Df | Chi2 | p | |
| Plant history | 1 | 1.50 | 0.221 | 1 | 0.56 | 0.454 | 1 | 0.03 | 0.868 | 1 | 0.94 | 0.332 |
| Soil history | 1 | 0.44 | 0.508 | 1 | 0.15 | 0.700 | 1 | 0.03 | 0.874 | 1 | 0.82 | 0.365 |
| Soil treatment | 2 | 5.77 | 0.056 | 2 | 6.56 | 0.038 | 2 | 3.00 | 0.223 | 2 | 0.26 | 0.879 |
| Shoot nitrogen concentration | ||||||||||||
| Control | Drought | Nitrogen | D x N | |||||||||
| Df | Chi2 | p | Df | Chi2 | p | Df | Chi2 | p | Df | Chi2 | p | |
| Plant history | 1 | 1.75 | 0.186 | 1 | 0.17 | 0.680 | 1 | 0.10 | 0.755 | 1 | 0.84 | 0.358 |
| Soil history | 1 | 0.37 | 0.544 | 1 | 0.96 | 0.328 | 1 | 0.01 | 0.939 | 1 | 0.00 | 0.966 |
| Soil treatment | 2 | 4.61 | 0.100 | 2 | 1.74 | 0.419 | 2 | 9.05 | 0.011 | 2 | 6.83 | 0.033 |
| Leaf greenness | ||||||||||||
| Control | Drought | Nitrogen | D x N | |||||||||
| Df | Chi2 | p | Df | Chi2 | p | Df | Chi2 | p | Df | Chi2 | p | |
| Plant history | 1 | 0.07 | 0.786 | 1 | 1.03 | 0.311 | 1 | 0.58 | 0.445 | 1 | 0.18 | 0.673 |
| Soil history | 1 | 0.03 | 0.869 | 1 | 1.85 | 0.174 | 1 | 0.90 | 0.343 | 1 | 0.19 | 0.661 |
| Soil treatment | 2 | 1.16 | 0.560 | 2 | 0.60 | 0.743 | 2 | 0.61 | 0.737 | 2 | 2.21 | 0.332 |
| LDMC | ||||||||||||
| Control | Drought | Nitrogen | D x N | |||||||||
| Df | Chi2 | p | Df | Chi2 | p | Df | Chi2 | p | Df | Chi2 | p | |
| Plant history | 1 | 0.34 | 0.561 | 1 | 0.38 | 0.538 | 1 | 0.40 | 0.527 | 1 | 2.17 | 0.140 |
| Soil history | 1 | 0.11 | 0.736 | 1 | 3.62 | 0.057 | 1 | 2.32 | 0.128 | 1 | 0.05 | 0.821 |
| Soil treatment | 2 | 0.36 | 0.835 | 2 | 1.42 | 0.492 | 2 | 1.18 | 0.555 | 2 | 3.91 | 0.141 |
| SLA | ||||||||||||
| Control | Drought | Nitrogen | D x N | |||||||||
| Df | Chi2 | p | Df | Chi2 | p | Df | Chi2 | p | Df | Chi2 | p | |
| Plant history | 1 | 0.07 | 0.786 | 1 | 0.32 | 0.572 | 1 | 0.00 | 0.984 | 1 | 1.28 | 0.259 |
| Soil history | 1 | 0.20 | 0.654 | 1 | 2.81 | 0.094 | 1 | 0.23 | 0.632 | 1 | 0.05 | 0.828 |
| Soil treatment | 2 | 2.21 | 0.331 | 2 | 0.70 | 0.704 | 2 | 1.18 | 0.555 | 2 | 8.59 | 0.014 |
| Stomatal conductance | ||||||||||||
| Control | Drought | Nitrogen | D x N | |||||||||
| Df | Chi2 | p | Df | Chi2 | p | Df | Chi2 | p | Df | Chi2 | p | |
| Temperature | 1 | 1.17 | 0.279 | 1 | 0.22 | 0.642 | 1 | 0.44 | 0.507 | 1 | 0.17 | 0.678 |
| Daytime | 1 | 0.77 | 0.379 | 1 | 0.07 | 0.786 | 1 | 1.13 | 0.289 | 1 | 8.38 | 0.004 |
| Plant history | 1 | 0.05 | 0.824 | 1 | 0.16 | 0.690 | 1 | 0.66 | 0.415 | 1 | 0.61 | 0.436 |
| Soil history | 1 | 1.30 | 0.255 | 1 | 0.14 | 0.706 | 1 | 0.79 | 0.373 | 1 | 0.53 | 0.466 |
| Soil treatment | 2 | 2.35 | 0.308 | 2 | 4.41 | 0.110 | 2 | 2.55 | 0.002 | 2 | 1.59 | 0.452 |
| Root diameter | ||||||||||||
| Control | Drought | Nitrogen | D x N | |||||||||
| Df | Chi2 | p | Df | Chi2 | p | Df | Chi2 | p | Df | Chi2 | p | |
| Plant history | 1 | 0.28 | 0.595 | 1 | 0.18 | 0.673 | 1 | 0.20 | 0.653 | 1 | 0.09 | 0.770 |
| Soil history | 1 | 5.61 | 0.018 | 1 | 0.95 | 0.331 | 1 | 1.34 | 0.246 | 1 | 0.01 | 0.942 |
| Soil treatment | 2 | 1.02 | 0.602 | 2 | 0.29 | 0.865 | 2 | 1.25 | 0.535 | 2 | 6.06 | 0.048 |
| SRL | ||||||||||||
| Control | Drought | Nitrogen | D x N | |||||||||
| Df | Chi2 | p | Df | Chi2 | p | Df | Chi2 | p | Df | Chi2 | p | |
| Plant history | 1 | 0.42 | 0.515 | 1 | 0.24 | 0.623 | 1 | 0.61 | 0.435 | 1 | 0.01 | 0.916 |
| Soil history | 1 | 0.33 | 0.567 | 1 | 7.10 | 0.008 | 1 | 0.17 | 0.677 | 1 | 2.73 | 0.098 |
| Soil treatment | 2 | 5.24 | 0.073 | 2 | 0.88 | 0.644 | 2 | 0.11 | 0.945 | 2 | 6.03 | 0.049 |
| RLD | ||||||||||||
| Control | Drought | Nitrogen | D x N | |||||||||
| Df | Chi2 | p | Df | Chi2 | p | Df | Chi2 | p | Df | Chi2 | p | |
| Plant history | 1 | 0.28 | 0.595 | 1 | 0.12 | 0.729 | 1 | 0.08 | 0.781 | 1 | 0.09 | 0.763 |
| Soil history | 1 | 0.75 | 0.387 | 1 | 4.79 | 0.029 | 1 | 0.13 | 0.716 | 1 | 0.03 | 0.861 |
| Soil treatment | 2 | 0.28 | 0.869 | 2 | 2.39 | 0.303 | 2 | 0.19 | 0.909 | 2 | 3.02 | 0.221 |
Appendix 1—table 8
Summary of mixed-effect model analyses testing the effects of legacy treatments (plant history, soil history, soil treatment) on plant trait expressions of D. glomerata, when non-treated (control) or treated with GC drivers (drought, nitrogen input, drought and nitrogen input (D x N)).
Shown are degrees of freedom (Df), Chi2 and p-values (p). Significant effects (P < 0.05) are given in bold, marginally significant effects (P < 0.1) in italics.
| D. glomerata | Growth height | |||||||||||
|---|---|---|---|---|---|---|---|---|---|---|---|---|
| Control | Drought | Nitrogen | D x N | |||||||||
| Df | Chi2 | p | Df | Chi2 | p | Df | Chi2 | p | Df | Chi2 | p | |
| Plant history | 1 | 0.73 | 0.394 | 1 | 0.11 | 0.741 | 1 | 0.06 | 0.802 | 1 | 0.01 | 0.912 |
| Soil history | 1 | 0.69 | 0.405 | 1 | 0.91 | 0.340 | 1 | 1.25 | 0.263 | 1 | 0.18 | 0.675 |
| Soil treatment | 2 | 1.66 | 0.436 | 2 | 1.06 | 0.589 | 2 | 2.37 | 0.306 | 2 | 1.09 | 0.581 |
| Shoot nitrogen concentration | ||||||||||||
| Control | Drought | Nitrogen | D x N | |||||||||
| Df | Chi2 | p | Df | Chi2 | p | Df | Chi2 | p | Df | Chi2 | p | |
| Plant history | 1 | 1.13 | 0.289 | 1 | 0.56 | 0.455 | 1 | 2.38 | 0.123 | 1 | 0.56 | 0.453 |
| Soil history | 1 | <0.01 | 0.952 | 1 | 2.18 | 0.140 | 1 | 8.44 | 0.004 | 1 | 0.05 | 0.818 |
| Soil treatment | 2 | 2.72 | 0.257 | 2 | 2.46 | 0.293 | 2 | 3.07 | 0.215 | 2 | 0.71 | 0.701 |
| Leaf greenness | ||||||||||||
| Control | Drought | Nitrogen | D x N | |||||||||
| Df | Chi2 | p | Df | Chi2 | p | Df | Chi2 | p | Df | Chi2 | p | |
| Plant history | 1 | 4.93 | 0.026 | 1 | 0.02 | 0.886 | 1 | 0.17 | 0.680 | 1 | 0.13 | 0.723 |
| Soil history | 1 | 1.23 | 0.267 | 1 | 1.17 | 0.279 | 1 | 0.15 | 0.703 | 1 | 0.01 | 0.908 |
| Soil treatment | 2 | 2.33 | 0.313 | 2 | 3.58 | 0.167 | 2 | 1.16 | 0.560 | 2 | 0.68 | 0.713 |
| LDMC | ||||||||||||
| Control | Drought | Nitrogen | D x N | |||||||||
| Df | Chi2 | p | Df | Chi2 | p | Df | Chi2 | p | Df | Chi2 | p | |
| Plant history | 1 | 0.86 | 0.353 | 1 | 1.18 | 0.278 | 1 | 0.37 | 0.540 | 1 | 0.64 | 0.423 |
| Soil history | 1 | 2.03 | 0.154 | 1 | 0.12 | 0.727 | 1 | 2.21 | 0.137 | 1 | 0.28 | 0.594 |
| Soil treatment | 2 | 2.36 | 0.307 | 2 | 0.20 | 0.905 | 2 | 1.74 | 0.418 | 2 | 3.05 | 0.218 |
| SLA | ||||||||||||
| Control | Drought | Nitrogen | D x N | |||||||||
| Df | Chi2 | p | Df | Chi2 | p | Df | Chi2 | p | Df | Chi2 | p | |
| Plant history | 1 | 1.41 | 0.235 | 1 | 0.01 | 0.904 | 1 | 1.50 | 0.220 | 1 | 0.14 | 0.706 |
| Soil history | 1 | 2.29 | 0.130 | 1 | 0.28 | 0.595 | 1 | 3.86 | 0.050 | 1 | 0.02 | 0.888 |
| Soil treatment | 2 | 2.60 | 0.272 | 2 | 1.88 | 0.392 | 2 | 0.09 | 0.956 | 2 | 0.89 | 0.641 |
| Stomatal conductance | ||||||||||||
| Control | Drought | Nitrogen | D x N | |||||||||
| Df | Chi2 | p | Df | Chi2 | p | Df | Chi2 | p | Df | Chi2 | p | |
| Temperature | 1 | 1.12 | 0.289 | 1 | <0.01 | 0.951 | 1 | 0.04 | 0.843 | 1 | 0.08 | 0.782 |
| Daytime | 1 | 24.06 | <0.001 | 1 | 12.16 | <0.001 | 1 | 4.04 | 0.044 | 1 | 4.37 | 0.037 |
| Plant history | 1 | 3.77 | 0.052 | 1 | 1.05 | 0.304 | 1 | 1.79 | 0.181 | 1 | 4.89 | 0.027 |
| Soil history | 1 | 1.44 | 0.231 | 1 | 1.55 | 0.214 | 1 | 0.47 | 0.493 | 1 | 2.34 | 0.126 |
| Soil treatment | 2 | 0.43 | 0.805 | 2 | 1.62 | 0.445 | 2 | 0.27 | 0.872 | 2 | 1.04 | 0.595 |
| Root diameter | ||||||||||||
| Control | Drought | Nitrogen | D x N | |||||||||
| Df | Chi2 | p | Df | Chi2 | p | Df | Chi2 | p | Df | Chi2 | p | |
| Plant history | 1 | 0.64 | 0.422 | 1 | 0.02 | 0.876 | 1 | 1.83 | 0.176 | 1 | 2.43 | 0.119 |
| Soil history | 1 | 0.33 | 0.567 | 1 | 2.50 | 0.114 | 1 | 0.34 | 0.559 | 1 | 0.16 | 0.691 |
| Soil treatment | 2 | 0.60 | 0.741 | 2 | 3.21 | 0.201 | 2 | 0.16 | 0.924 | 2 | 2.03 | 0.363 |
| SRL | ||||||||||||
| Control | Drought | Nitrogen | D x N | |||||||||
| Df | Chi2 | p | Df | Chi2 | p | Df | Chi2 | p | Df | Chi2 | p | |
| Plant history | 1 | 2.55 | 0.111 | 1 | 0.54 | 0.462 | 1 | 0.08 | 0.777 | 1 | 0.36 | 0.548 |
| Soil history | 1 | 1.73 | 0.188 | 1 | 1.42 | 0.233 | 1 | 0.32 | 0.570 | 1 | 0.22 | 0.643 |
| Soil treatment | 2 | 2.23 | 0.329 | 2 | 0.24 | 0.888 | 2 | 2.28 | 0.320 | 2 | 2.38 | 0.304 |
| RLD | ||||||||||||
| Control | Drought | Nitrogen | D x N | |||||||||
| Df | Chi2 | p | Df | Chi2 | p | Df | Chi2 | p | Df | Chi2 | p | |
| Plant history | 1 | 0.01 | 0.923 | 1 | 7.58 | 0.006 | 1 | 0.77 | 0.380 | 1 | 0.03 | 0.862 |
| Soil history | 1 | 0.27 | 0.602 | 1 | 0.02 | 0.901 | 1 | 0.54 | 0.464 | 1 | 0.18 | 0.673 |
| Soil treatment | 2 | 0.36 | 0.835 | 2 | 4.51 | 0.105 | 2 | 0.96 | 0.619 | 2 | 5.25 | 0.073 |
Appendix 1—table 9
Summary of mixed-effect model analyses testing the effects of legacy treatments (plant history, soil history, soil treatment) on plant trait expressions of P. trivialis, when non-treated (control) or treated with GC drivers (drought, nitrogen input, drought and nitrogen input (D x N)).
Shown are degrees of freedom (Df), Chi2 and p-values (p). Significant effects (p < 0.05) are given in bold, marginally significant effects (p < 0.1) in italics.
| P. trivialis | Growth height | |||||||||||
|---|---|---|---|---|---|---|---|---|---|---|---|---|
| Control | Drought | Nitrogen | D x N | |||||||||
| Df | Chi2 | p | Df | Chi2 | p | Df | Chi2 | p | Df | Chi2 | p | |
| Plant history | 1 | 2.81 | 0.094 | 1 | 0.32 | 0.571 | 1 | 0.98 | 0.323 | 1 | 0.16 | 0.688 |
| Soil history | 1 | 0.62 | 0.429 | 1 | 0.92 | 0.338 | 1 | 1.12 | 0.289 | 1 | 5.02 | 0.025 |
| Soil treatment | 2 | 4.77 | 0.092 | 2 | 1.59 | 0.452 | 2 | 2.99 | 0.224 | 2 | 1.14 | 0.566 |
| Shoot nitrogen concentration | ||||||||||||
| Control | Drought | Nitrogen | D x N | |||||||||
| Df | Chi2 | p | Df | Chi2 | p | Df | Chi2 | p | Df | Chi2 | p | |
| Plant history | 1 | <0.01 | 0.986 | 1 | 0.01 | 0.934 | 1 | 0.07 | 0.785 | 1 | 0.01 | 0.915 |
| Soil history | 1 | 0.15 | 0.695 | 1 | 0.57 | 0.452 | 1 | 0.06 | 0.802 | 1 | 0.45 | 0.503 |
| Soil treatment | 2 | 9.66 | 0.008 | 2 | 2.33 | 0.313 | 2 | 1.18 | 0.554 | 2 | 3.86 | 0.145 |
| Leaf greenness | ||||||||||||
| Control | Drought | Nitrogen | D x N | |||||||||
| Df | Chi2 | P | Df | Chi2 | P | Df | Chi2 | P | Df | Chi2 | P | |
| Plant history | 1 | 0.14 | 0.708 | 1 | 2.41 | 0.120 | 1 | 0.04 | 0.845 | 1 | 2.35 | 0.126 |
| Soil history | 1 | 1.41 | 0.236 | 1 | 1.10 | 0.295 | 1 | 0.38 | 0.537 | 1 | 0.09 | 0.769 |
| Soil treatment | 2 | 0.13 | 0.936 | 2 | 0.37 | 0.833 | 2 | 5.22 | 0.074 | 2 | 0.97 | 0.616 |
| LDMC | ||||||||||||
| Control | Drought | Nitrogen | D x N | |||||||||
| Df | Chi2 | P | Df | Chi2 | P | Df | Chi2 | P | Df | Chi2 | P | |
| Plant history | 1 | 0.81 | 0.369 | 1 | 0.24 | 0.627 | 1 | 0.05 | 0.826 | 1 | 1.34 | 0.247 |
| Soil history | 1 | 0.08 | 0.776 | 1 | 0.01 | 0.927 | 1 | 0.47 | 0.492 | 1 | 4.25 | 0.039 |
| Soil treatment | 2 | 3.34 | 0.188 | 2 | 0.72 | 0.696 | 2 | 3.01 | 0.222 | 2 | 2.64 | 0.268 |
| SLA | ||||||||||||
| Control | Drought | Nitrogen | D x N | |||||||||
| Df | Chi2 | p | Df | Chi2 | p | Df | Chi2 | p | Df | Chi2 | p | |
| Plant history | 1 | 0.26 | 0.611 | 1 | 0.21 | 0.643 | 1 | 1.44 | 0.231 | 1 | 0.80 | 0.372 |
| Soil history | 1 | 0.41 | 0.522 | 1 | 0.40 | 0.528 | 1 | 1.47 | 0.226 | 1 | 0.33 | 0.565 |
| Soil treatment | 2 | 2.29 | 0.319 | 2 | 0.53 | 0.769 | 2 | 3.35 | 0.187 | 2 | 4.08 | 0.130 |
| Stomatal conductance | ||||||||||||
| Control | Drought | Nitrogen | D x N | |||||||||
| Df | Chi2 | p | Df | Chi2 | p | Df | Chi2 | p | Df | Chi2 | p | |
| Temperature | 1 | 10.96 | 0.001 | 1 | 8.08 | 0.004 | 1 | 7.25 | 0.007 | 1 | 4.31 | 0.038 |
| Daytime | 1 | 3.93 | 0.047 | 1 | 1.12 | 0.289 | 1 | 1.22 | 0.270 | 1 | 6.35 | 0.012 |
| Plant history | 1 | <0.01 | 0.949 | 1 | 0.60 | 0.439 | 1 | 2.96 | 0.085 | 1 | 0.29 | 0.589 |
| Soil history | 1 | 0.68 | 0.410 | 1 | 0.95 | 0.330 | 1 | 2.72 | 0.099 | 1 | 0.14 | 0.704 |
| Soil treatment | 2 | 2.46 | 0.293 | 2 | 0.54 | 0.763 | 2 | 0.95 | 0.622 | 2 | 1.49 | 0.474 |
| Root diameter | ||||||||||||
| Control | Drought | Nitrogen | D x N | |||||||||
| Df | Chi2 | p | Df | Chi2 | p | Df | Chi2 | p | Df | Chi2 | p | |
| Plant history | 1 | 0.16 | 0.686 | 1 | 0.07 | 0.794 | 1 | 0.55 | 0.458 | 1 | 2.91 | 0.088 |
| Soil history | 1 | 3.06 | 0.080 | 1 | 0.31 | 0.579 | 1 | 0.95 | 0.329 | 1 | 0.06 | 0.800 |
| Soil treatment | 2 | 7.48 | 0.024 | 2 | 0.28 | 0.870 | 2 | 0.07 | 0.967 | 2 | 2.00 | 0.369 |
| SRL | ||||||||||||
| Control | Drought | Nitrogen | D x N | |||||||||
| Df | Chi2 | p | Df | Chi2 | p | Df | Chi2 | p | Df | Chi2 | p | |
| Plant history | 1 | 2.10 | 0.147 | 1 | 0.94 | 0.332 | 1 | 1.82 | 0.178 | 1 | 1.04 | 0.308 |
| Soil history | 1 | 1.83 | 0.177 | 1 | 3.68 | 0.055 | 1 | 2.26 | 0.133 | 1 | 0.19 | 0.660 |
| Soil treatment | 2 | 5.73 | 0.057 | 2 | 0.56 | 0.755 | 2 | 1.97 | 0.374 | 2 | 1.83 | 0.401 |
| RLD | ||||||||||||
| Control | Drought | Nitrogen | D x N | |||||||||
| Df | Chi2 | p | Df | Chi2 | p | Df | Chi2 | p | Df | Chi2 | p | |
| Plant history | 1 | 0.23 | 0.632 | 1 | 0.01 | 0.904 | 1 | 0.01 | 0.920 | 1 | 0.54 | 0.463 |
| Soil history | 1 | 3.38 | 0.066 | 1 | 0.07 | 0.792 | 1 | 0.01 | 0.926 | 1 | 0.16 | 0.685 |
| Soil treatment | 2 | 0.63 | 0.731 | 2 | 0.61 | 0.739 | 2 | 0.16 | 0.924 | 2 | 3.25 | 0.197 |
Appendix 1—table 10
Summary of mixed-effect model analyses testing the effects of legacy treatments (plant history, soil history, soil treatment) on mildew infestation of D. glomerata and P. trivialis, when non-treated (control) or treated with GC drivers (drought, nitrogen input, drought and nitrogen input (D x N)).
Shown are degrees of freedom (Df), Chi2 and p-values (p). Significant effects (p < 0.05) are given in bold, marginally significant effects (p < 0.1) in italics.
| Mildew infestation | D. glomerata | |||||||||||
|---|---|---|---|---|---|---|---|---|---|---|---|---|
| Control | Drought | Nitrogen | D x N | |||||||||
| Df | Chi2 | p | Df | Chi2 | p | Df | Chi2 | p | Df | Chi2 | p | |
| Plant history | 1 | 0.58 | 0.447 | 1 | 1.18 | 0.277 | 1 | 0.88 | 0.348 | 1 | 0.26 | 0.613 |
| Soil history | 1 | 0.41 | 0.522 | 1 | 2.63 | 0.105 | 1 | <0.01 | 0.946 | 1 | 0.11 | 0.746 |
| Soil treatment | 2 | 6.01 | 0.049 | 2 | 7.65 | 0.022 | 2 | 0.93 | 0.628 | 2 | 0.09 | 0.958 |
| P. trivialis | ||||||||||||
| Control | Drought | Nitrogen | D x N | |||||||||
| Df | Chi2 | p | Df | Chi2 | p | Df | Chi2 | p | Df | Chi2 | p | |
| Plant history | 1 | <0.01 | 0.996 | 1 | <0.01 | 0.973 | 1 | 0.03 | 0.860 | 1 | 0.21 | 0.647 |
| Soil history | 1 | 1.20 | 0.274 | 1 | 2.66 | 0.103 | 1 | 1.68 | 0.195 | 1 | 0.05 | 0.817 |
| Soil treatment | 2 | 3.94 | 0.139 | 2 | 1.78 | 0.412 | 2 | 0.16 | 0.921 | 2 | 2.10 | 0.350 |
Appendix 1—table 11
Summary of mixed-effect model analyses testing the effects of species identity (N = 4), legacy treatments (plant history, soil history, soil treatment) and their interactions on root-shoot ratio, when non-treated (control) or treated with global change drivers (drought, nitrogen input, drought and nitrogen input (D x N)).
Shown are degrees of freedom (Df), Chi2 and p-values (p). Significant effects (p < 0.05) are given in bold, marginally significant effects (p < 0.1) in italics.
| Root-Shoot ratio | ||||||||||||
|---|---|---|---|---|---|---|---|---|---|---|---|---|
| Control | Drought | Nitrogen | D x N | |||||||||
| Df | Chi2 | p | Df | Chi2 | p | Df | Chi2 | p | Df | Chi2 | p | |
| Species ID | 3 | 115.37 | <0.001 | 3 | 116.36 | <0.001 | 3 | 101.12 | <0.001 | 3 | 108.37 | <0.001 |
| Plant history (PH) | 1 | 0.02 | 0.880 | 1 | 1.48 | 0.225 | 1 | 1.64 | 0.200 | 1 | 0.46 | 0.496 |
| Soil history (SH) | 1 | 1.81 | 0.178 | 1 | 1.60 | 0.206 | 1 | 0.24 | 0.622 | 1 | <0.01 | 0.992 |
| Soil treatment (ST) | 2 | 0.46 | 0.793 | 2 | 1.96 | 0.376 | 2 | 1.19 | 0.551 | 2 | 3.54 | 0.170 |
| Species ID x PH | 3 | 3.88 | 0.275 | 3 | 1.47 | 0.690 | 3 | 0.86 | 0.836 | 3 | 2.77 | 0.428 |
| Species ID x SH | 3 | 5.98 | 0.113 | 3 | 3.99 | 0.263 | 3 | 2.53 | 0.471 | 3 | 3.71 | 0.295 |
| Species ID x ST | 6 | 10.54 | 0.104 | 6 | 6.76 | 0.344 | 6 | 1.85 | 0.933 | 6 | 14.79 | 0.022 |
Appendix 2—table 1
Summary of mixed-effect model analyses testing the effects of species identity (N = 4), legacy treatments (plant history, soil history, soil treatment), global change treatments (drought, nitrogen input) and their interactions on root-shoot ratio.
Shown are degrees of freedom (Df), Chi2 and P-values (P). Significant effects (P < 0.05) are given in bold, marginally significant effects (P < 0.1) in italics.
| Root-shoot ratio | |||
|---|---|---|---|
| Df | Chi2 | p | |
| Species identity (ID) | 3 | 133.41 | <0.001 |
| Plant history | 1 | 1.11 | 0.292 |
| Soil history | 1 | 1.08 | 0.300 |
| Soil treatment | 2 | 1.81 | 0.404 |
| Drought (D) | 1 | 60.01 | <0.001 |
| Nitrogen input (N) | 1 | 89.83 | <0.001 |
| Species ID x Plant history | 3 | 0.87 | 0.832 |
| Species ID x Soil history | 3 | 4.07 | 0.254 |
| Species ID x Soil treatment | 6 | 2.79 | 0.835 |
| Species ID x D | 3 | 95.53 | <0.001 |
| Species ID x N | 3 | 9.31 | 0.025 |
| D x N | 1 | 2.19 | 0.139 |
| Species ID x Plant history x D | 4 | 2.02 | 0.733 |
| Species ID x Soil history x D | 4 | 1.58 | 0.812 |
| Species ID x Soil treatment x D | 8 | 4.97 | 0.760 |
| Species ID x Plant history x N | 4 | 2.91 | 0.573 |
| Species ID x Soil history x N | 4 | 3.18 | 0.528 |
| Species ID x Soil treatment x N | 8 | 18.18 | 0.020 |
| Species ID x Plant history x D x N | 4 | 10.42 | 0.034 |
| Species ID x Soil history x D x N | 4 | 11.14 | 0.025 |
| Species ID x Soil treatment x D x N | 8 | 5.20 | 0.736 |
Appendix 2—table 2
Summary of mixed-effect model analyses testing the effects of species identity (N = 4), legacy treatments (plant history, soil history, soil treatment), global change treatments (drought, nitrogen input) and their interactions on plant performance (total biomass, shoot biomass, root biomass and root-shoot ratio).
Shown are degrees of freedom (Df), Chi2 and p-values (p). Significant effects (p < 0.05) are given in bold, marginally significant effects (p < 0.1) in italics.
| Total biomass | Shoot biomass | Root biomass | Root-shoot ratio | |||||||||
|---|---|---|---|---|---|---|---|---|---|---|---|---|
| Df | Chi | p | Df | Chi | p | Df | Chi | p | Df | Chi | p | |
| Species ID | 3 | 73.25 | <0.001 | 3 | 80.17 | <0.001 | 3 | 121.30 | <0.001 | 3 | 133.41 | <0.001 |
| Plant history | 1 | 3.48 | 0.062 | 1 | 1.36 | 0.244 | 1 | 3.40 | 0.065 | 1 | 1.11 | 0.292 |
| Soil history | 1 | 0.01 | 0.915 | 1 | 0.04 | 0.851 | 1 | 0.49 | 0.484 | 1 | 1.08 | 0.300 |
| Soil treatment | 2 | 2.17 | 0.338 | 2 | 1.20 | 0.548 | 2 | 3.66 | 0.161 | 2 | 1.81 | 0.404 |
| Drought (D) | 1 | 83.05 | <0.001 | 1 | 110.26 | <0.001 | 1 | 2.81 | 0.094 | 1 | 60.01 | <0.001 |
| Nitrogen input (N) | 1 | 257.26 | <0.001 | 1 | 425.93 | <0.001 | 1 | 15.89 | <0.001 | 1 | 89.83 | <0.001 |
| D x N | 1 | 29.23 | <0.001 | 1 | 23.02 | <0.001 | 1 | 8.50 | 0.004 | 1 | 1.75 | 0.185 |
| Plant history x D | 1 | 0.22 | 0.639 | 1 | 0.21 | 0.643 | 1 | 0.01 | 0.916 | 1 | <0.01 | 0.977 |
| Soil history x D | 1 | <0.01 | 0.944 | 1 | 0.07 | 0.786 | 1 | 0.10 | 0.746 | 1 | 0.23 | 0.635 |
| Soil treatment x D | 2 | 1.79 | 0.409 | 2 | 0.77 | 0.681 | 2 | 1.37 | 0.503 | 2 | 1.29 | 0.526 |
| Plant history x N | 1 | 1.48 | 0.224 | 1 | 1.59 | 0.207 | 1 | 0.60 | 0.437 | 1 | 0.35 | 0.553 |
| Soil history x N | 1 | 3.44 | 0.064 | 1 | 1.33 | 0.249 | 1 | 2.46 | 0.116 | 1 | 0.83 | 0.363 |
| Soil treatment x N | 2 | 1.43 | 0.489 | 2 | 1.40 | 0.496 | 2 | 0.43 | 0.806 | 2 | 0.49 | 0.782 |
| Plant history x D x N | 1 | 2.12 | 0.146 | 1 | 0.84 | 0.358 | 1 | 1.78 | 0.183 | 1 | 1.27 | 0.260 |
| Soil history x D x N | 1 | 0.95 | 0.330 | 1 | 2.78 | 0.095 | 1 | 0.08 | 0.780 | 1 | 0.03 | 0.864 |
| Soil treatment x D x N | 2 | 1.37 | 0.504 | 2 | 1.93 | 0.381 | 2 | 0.91 | 0.635 | 2 | 0.73 | 0.693 |
Appendix 2—table 3
Summary of mixed-effect model analyses testing the effects of species identity (N = 4), legacy treatments (plant history, soil history, soil treatment), global change treatments (drought, nitrogen input) and their interactions on plant trait expression.
Shown are degrees of freedom (Df), Chi2 and p-values (p). Significant effects (p < 0.05) are given in bold, marginally significant effects (p < 0.1) in italics.
| Growth height | Shoot nitrogen conc. | Leaf greenness | |||||||
|---|---|---|---|---|---|---|---|---|---|
| Df | Chi2 | p | Df | Chi2 | p | Df | Chi2 | p | |
| Species ID | 3 | 71.45 | <0.001 | 3 | 57.20 | <0.001 | 3 | 79.55 | <0.001 |
| Plant history | 1 | 0.15 | 0.694 | 1 | <0.01 | 0.960 | 1 | 0.05 | 0.830 |
| Soil history | 1 | 1.60 | 0.207 | 1 | 0.64 | 0.425 | 1 | 0.17 | 0.683 |
| Soil treatment | 2 | 3.98 | 0.137 | 2 | 2.27 | 0.321 | 2 | 0.60 | 0.742 |
| Drought (D) | 1 | 18.71 | <0.001 | 1 | 65.46 | <0.001 | 1 | 66.15 | <0.001 |
| Nitrogen input (N) | 1 | 32.93 | <0.001 | 1 | 772.20 | <0.001 | 1 | 523.86 | <0.001 |
| D x N | 1 | 1.10 | 0.294 | 1 | 48.85 | <0.001 | 1 | <0.01 | 0.997 |
| Plant history x D | 1 | 2.99 | 0.084 | 1 | 0.06 | 0.806 | 1 | <0.01 | 0.950 |
| Soil history x D | 1 | 0.51 | 0.477 | 1 | 0.11 | 0.735 | 1 | 1.57 | 0.210 |
| Soil treatment x D | 2 | 3.54 | 0.171 | 2 | 0.02 | 0.990 | 2 | 0.69 | 0.707 |
| Plant history x N | 1 | 0.50 | 0.478 | 1 | 1.34 | 0.246 | 1 | 0.91 | 0.341 |
| Soil history x N | 1 | 1.41 | 0.235 | 1 | 0.19 | 0.666 | 1 | 1.54 | 0.215 |
| Soil treatment x N | 2 | 1.87 | 0.392 | 2 | 3.30 | 0.192 | 2 | 2.42 | 0.299 |
| Plant history x D x N | 1 | 0.83 | 0.364 | 1 | 0.21 | 0.645 | 1 | 0.79 | 0.373 |
| Soil history x D x N | 1 | 0.69 | 0.407 | 1 | 3.06 | 0.080 | 1 | <0.01 | 0.977 |
| Soil treatment x D x N | 2 | 4.94 | 0.085 | 2 | 1.56 | 0.458 | 2 | 0.04 | 0.983 |
| LDMC | SLA | Stomatal conductance | |||||||
| Df | Chi2 | p | Df | Chi2 | p | Df | Chi2 | p | |
| Air temperature | - | - | - | - | - | - | 1 | 5.34 | 0.021 |
| Daytime | - | - | - | - | - | - | 1 | 38.25 | <0.001 |
| Species ID | 3 | 80.52 | <0.001 | 3 | 124.00 | <0.001 | 3 | 47.15 | <0.001 |
| Plant history | 1 | 0.80 | 0.373 | 1 | 0.06 | 0.805 | 1 | 1.25 | 0.264 |
| Soil history | 1 | 0.10 | 0.750 | 1 | 1.22 | 0.270 | 1 | 0.37 | 0.543 |
| Soil treatment | 2 | 1.13 | 0.570 | 2 | 1.64 | 0.441 | 2 | 3.38 | 0.185 |
| Drought (D) | 1 | 0.94 | 0.333 | 1 | 0.11 | 0.743 | 1 | 0.90 | 0.343 |
| Nitrogen input (N) | 1 | 62.84 | <0.001 | 1 | 61.63 | <0.001 | 1 | 8.16 | 0.004 |
| D x N | 1 | 6.69 | 0.010 | 1 | 0.01 | 0.904 | 1 | 9.33 | 0.002 |
| Plant history x D | 1 | 0.04 | 0.841 | 1 | 0.34 | 0.559 | 1 | 0.06 | 0.806 |
| Soil history x D | 1 | 0.49 | 0.484 | 1 | 0.02 | 0.883 | 1 | 0.65 | 0.420 |
| Soil treatment x D | 2 | 0.24 | 0.887 | 2 | 0.23 | 0.889 | 2 | 0.18 | 0.914 |
| Plant history x N | 1 | 0.65 | 0.421 | 1 | 0.16 | 0.688 | 1 | 0.69 | 0.406 |
| Soil history x N | 1 | 0.12 | 0.734 | 1 | 1.07 | 0.300 | 1 | 0.63 | 0.428 |
| Soil treatment x N | 2 | 0.66 | 0.719 | 2 | 2.92 | 0.232 | 2 | 0.08 | 0.960 |
| Plant history x D x N | 1 | 0.16 | 0.687 | 1 | 1.77 | 0.183 | 1 | 0.87 | 0.351 |
| Soil history x D x N | 1 | <0.01 | 0.962 | 1 | 0.95 | 0.331 | 1 | 0.02 | 0.887 |
| Soil treatment x D x N | 2 | 2.27 | 0.322 | 2 | 1.33 | 0.514 | 2 | 3.73 | 0.155 |
| Root diameter | SRL | RLD | |||||||
| Df | Chi2 | p | Df | Chi2 | p | Df | Chi2 | p | |
| Species ID | 3 | 165.58 | <0.001 | 3 | 174.84 | <0.001 | 3 | 125.84 | <0.001 |
| Plant history | 1 | 0.03 | 0.872 | 1 | 0.32 | 0.569 | 1 | 1.14 | 0.286 |
| Soil history | 1 | 0.37 | 0.544 | 1 | 0.36 | 0.546 | 1 | 0.25 | 0.617 |
| Soil treatment | 2 | 1.50 | 0.473 | 2 | 2.80 | 0.246 | 2 | 4.97 | 0.083 |
| Drought (D) | 1 | 11.19 | 0.001 | 1 | 7.67 | 0.006 | 1 | 16.09 | <0.001 |
| Nitrogen input (N) | 1 | 19.83 | <0.001 | 1 | 6.68 | 0.010 | 1 | 1.29 | 0.257 |
| D x N | 1 | 0.25 | 0.619 | 1 | 1.27 | 0.261 | 1 | 2.14 | 0.144 |
| Plant history x D | 1 | 0.37 | 0.544 | 1 | 0.34 | 0.559 | 1 | 0.67 | 0.414 |
| Soil history x D | 1 | 0.12 | 0.725 | 1 | 0.48 | 0.491 | 1 | 0.07 | 0.798 |
| Soil treatment x D | 2 | 1.67 | 0.434 | 2 | 0.65 | 0.723 | 2 | 0.44 | 0.802 |
| Plant history x N | 1 | 0.40 | 0.528 | 1 | 1.91 | 0.167 | 1 | <0.01 | 0.944 |
| Soil history x N | 1 | 0.42 | 0.515 | 1 | 0.15 | 0.703 | 1 | 0.86 | 0.353 |
| Soil treatment x N | 2 | 0.27 | 0.872 | 2 | 1.69 | 0.430 | 2 | 0.08 | 0.959 |
| Plant history x D x N | 1 | 0.20 | 0.652 | 1 | 1.22 | 0.270 | 1 | 0.12 | 0.734 |
| Soil history x D x N | 1 | 1.48 | 0.224 | 1 | 3.47 | 0.063 | 1 | 3.94 | 0.047 |
| Soil treatment x D x N | 2 | 0.75 | 0.686 | 2 | 0.84 | 0.659 | 2 | 1.02 | 0.600 |
Appendix 2—table 4
Summary of mixed-effect model analyses testing the effects legacy treatments (plant history, soil history, soil treatment), global change treatments (drought, nitrogen input) and their interactions on plant performance (total biomass, shoot biomass, root biomass and root-shoot ratio) of A. elatius and A. pratensis.
Shown are degrees of freedom (Df), Chi2 and p-values (p). Significant effects (p < 0.05) are given in bold, marginally significant effects (p < 0.1) in italics.
| A. elatius | ||||||||||||
|---|---|---|---|---|---|---|---|---|---|---|---|---|
| Total biomass | Shoot biomass | Root biomass | Root-shoot ratio | |||||||||
| Df | Chi2 | p | Df | Chi2 | p | Df | Chi2 | p | Df | Chi2 | p | |
| Plant history | 1 | 0.26 | 0.609 | 1 | 0.05 | 0.827 | 1 | 0.10 | 0.747 | 1 | 0.11 | 0.738 |
| Soil history | 1 | 0.39 | 0.533 | 1 | 0.03 | 0.865 | 1 | 1.02 | 0.312 | 1 | 1.28 | 0.258 |
| Soil treatment | 2 | 2.06 | 0.357 | 2 | 1.59 | 0.452 | 2 | 1.31 | 0.520 | 2 | 0.30 | 0.861 |
| Drought (D) | 1 | 21.54 | <0.001 | 1 | 50.79 | <0.001 | 1 | 6.13 | 0.013 | 1 | 67.84 | <0.001 |
| Nitrogen input (N) | 1 | 125.48 | <0.001 | 1 | 128.72 | <0.001 | 1 | 31.68 | <0.001 | 1 | 13.70 | <0.001 |
| D x N | 1 | 36.23 | <0.001 | 1 | 45.06 | <0.001 | 1 | 1.86 | 0.173 | 1 | 0.13 | 0.715 |
| Plant history x D | 1 | 1.01 | 0.315 | 1 | 2.37 | 0.123 | 1 | 0.05 | 0.823 | 1 | 1.28 | 0.258 |
| Soil history x D | 1 | 0.27 | 0.606 | 1 | 2.01 | 0.156 | 1 | 0.71 | 0.399 | 1 | 2.11 | 0.146 |
| Soil treatment x D | 2 | 1.21 | 0.545 | 2 | 3.22 | 0.200 | 2 | 0.13 | 0.939 | 2 | 1.21 | 0.545 |
| Plant history x N | 1 | 0.92 | 0.337 | 1 | 2.00 | 0.157 | 1 | 0.02 | 0.879 | 1 | 0.46 | 0.497 |
| Soil history x N | 1 | 0.87 | 0.352 | 1 | 0.05 | 0.832 | 1 | 1.37 | 0.242 | 1 | 2.29 | 0.130 |
| Soil treatment x N | 2 | 3.07 | 0.215 | 2 | 0.80 | 0.669 | 2 | 6.25 | 0.044 | 2 | 5.64 | 0.060 |
| Plant history x D x N | 1 | 0.07 | 0.792 | 1 | <0.01 | 0.980 | 1 | 0.15 | 0.696 | 1 | 0.02 | 0.884 |
| Soil history x D x N | 1 | 0.61 | 0.434 | 1 | 0.05 | 0.822 | 1 | 0.89 | 0.344 | 1 | 1.17 | 0.279 |
| Soil treatment x D x N | 2 | 3.61 | 0.165 | 2 | 2.25 | 0.326 | 2 | 1.33 | 0.515 | 2 | 0.56 | 0.757 |
| A. pratensis | ||||||||||||
| Total biomass | Shoot biomass | Root biomass | Root-shoot ratio | |||||||||
| Df | Chi2 | p | Df | Chi2 | p | Df | Chi2 | p | Df | Chi2 | p | |
| Plant history | 1 | 0.57 | 0.452 | 1 | 0.42 | 0.518 | 1 | 0.43 | 0.512 | 1 | <0.01 | 0.985 |
| Soil history | 1 | 0.68 | 0.408 | 1 | <0.01 | 0.945 | 1 | 1.47 | 0.225 | 1 | 0.80 | 0.371 |
| Soil treatment | 2 | 0.34 | 0.845 | 2 | 0.29 | 0.865 | 2 | 0.23 | 0.892 | 2 | 0.07 | 0.967 |
| Drought (D) | 1 | 71.43 | <0.001 | 1 | 38.06 | <0.001 | 1 | 60.92 | <0.001 | 1 | 0.15 | 0.696 |
| Nitrogen input (N) | 1 | 74.74 | <0.001 | 1 | 162.92 | <0.001 | 1 | 9.71 | 0.002 | 1 | 55.50 | <0.001 |
| D x N | 1 | 26.47 | <0.001 | 1 | 3.98 | 0.046 | 1 | 24.94 | <0.001 | 1 | 16.49 | <0.001 |
| Plant history x D | 1 | 0.08 | 0.772 | 1 | 0.51 | 0.477 | 1 | 0.48 | 0.488 | 1 | 1.07 | 0.301 |
| Soil history x D | 1 | 0.43 | 0.512 | 1 | 0.37 | 0.546 | 1 | 0.20 | 0.653 | 1 | 0.01 | 0.912 |
| Soil treatment x D | 2 | 1.17 | 0.557 | 2 | 0.19 | 0.911 | 2 | 2.12 | 0.346 | 2 | 3.60 | 0.165 |
| Plant history x N | 1 | 0.40 | 0.529 | 1 | 1.26 | 0.261 | 1 | 0.02 | 0.875 | 1 | 0.14 | 0.709 |
| Soil history x N | 1 | 5.45 | 0.020 | 1 | 1.19 | 0.275 | 1 | 4.53 | 0.033 | 1 | 1.24 | 0.265 |
| Soil treatment x N | 2 | 2.78 | 0.249 | 2 | 2.50 | 0.287 | 2 | 1.21 | 0.547 | 2 | 0.13 | 0.938 |
| Plant history x D x N | 1 | 0.55 | 0.458 | 1 | 0.02 | 0.881 | 1 | 0.59 | 0.442 | 1 | 0.08 | 0.771 |
| Soil history x D x N | 1 | 0.28 | 0.595 | 1 | 0.30 | 0.585 | 1 | 0.78 | 0.376 | 1 | 1.44 | 0.230 |
| Soil treatment x D x N | 2 | 0.91 | 0.634 | 2 | 0.05 | 0.975 | 2 | 1.45 | 0.485 | 2 | 2.41 | 0.300 |
Appendix 2—table 5
Summary of mixed-effect model analyses testing the effects legacy treatments (plant history, soil history, soil treatment), global change treatments (drought, nitrogen input) and their interactions on plant performance (total biomass, shoot biomass, root biomass and root-shoot ratio) of D. glomerata and P. trivialis.
Shown are degrees of freedom (Df), Chi2 and p-values (p). Significant effects (p < 0.05) are given in bold, marginally significant effects (p < 0.1) in italics.
| D. glomerata | ||||||||||||
|---|---|---|---|---|---|---|---|---|---|---|---|---|
| Total biomass | Shoot biomass | Root biomass | Root-shoot ratio | |||||||||
| Df | Chi2 | p | Df | Chi2 | p | Df | Chi2 | p | Df | Chi2 | p | |
| Plant history | 1 | 1.51 | 0.219 | 1 | 1.32 | 0.251 | 1 | 1.12 | 0.289 | 1 | 0.19 | 0.662 |
| Soil history | 1 | 0.00 | 0.957 | 1 | 0.01 | 0.912 | 1 | 0.07 | 0.787 | 1 | 0.05 | 0.829 |
| Soil treatment | 2 | 0.79 | 0.673 | 2 | 0.11 | 0.948 | 2 | 2.65 | 0.266 | 2 | 2.94 | 0.230 |
| Drought (D) | 1 | 0.98 | 0.323 | 1 | 12.71 | <0.001 | 1 | 20.48 | <0.001 | 1 | 58.54 | <0.001 |
| Nitrogen input (N) | 1 | 82.06 | <0.001 | 1 | 124.42 | <0.001 | 1 | 8.87 | 0.003 | 1 | 16.79 | <0.001 |
| D x N | 1 | 0.07 | 0.790 | 1 | 0.04 | 0.843 | 1 | 0.61 | 0.434 | 1 | 0.53 | 0.467 |
| Plant history x D | 1 | 0.05 | 0.821 | 1 | 0.55 | 0.458 | 1 | 0.24 | 0.623 | 1 | 1.40 | 0.236 |
| Soil history x D | 1 | 0.56 | 0.453 | 1 | 2.20 | 0.138 | 1 | 0.14 | 0.706 | 1 | 0.27 | 0.601 |
| Soil treatment x D | 2 | 0.09 | 0.955 | 2 | 0.55 | 0.758 | 2 | 1.09 | 0.579 | 2 | 3.01 | 0.222 |
| Plant history x N | 1 | 1.55 | 0.213 | 1 | 1.85 | 0.174 | 1 | 0.62 | 0.432 | 1 | 0.29 | 0.592 |
| Soil history x N | 1 | 1.42 | 0.234 | 1 | 2.24 | 0.135 | 1 | 0.26 | 0.612 | 1 | 0.25 | 0.618 |
| Soil treatment x N | 2 | 0.05 | 0.976 | 2 | 0.72 | 0.699 | 2 | 1.94 | 0.378 | 2 | 3.83 | 0.147 |
| Plant history x D x N | 1 | 4.64 | 0.031 | 1 | 3.35 | 0.067 | 1 | 4.09 | 0.043 | 1 | 3.81 | 0.051 |
| Soil history x D x N | 1 | 4.21 | 0.040 | 1 | 3.68 | 0.055 | 1 | 2.87 | 0.090 | 1 | 1.64 | 0.200 |
| Soil treatment x D x N | 2 | 1.70 | 0.428 | 2 | 3.03 | 0.220 | 2 | 0.66 | 0.718 | 2 | 0.32 | 0.853 |
| P. trivialis | ||||||||||||
| Total biomass | Shoot biomasp | Root biomass | Root-shoot ratio | |||||||||
| Df | Chi2 | p | Df | Chi2 | P | Df | Chi2 | p | Df | Chi2 | p | |
| Plant history | 1 | 0.91 | 0.340 | 1 | 0.03 | 0.870 | 1 | 1.49 | 0.222 | 1 | 1.36 | 0.244 |
| Soil history | 1 | 0.26 | 0.611 | 1 | 0.08 | 0.781 | 1 | 2.43 | 0.119 | 1 | 4.29 | 0.038 |
| Soil treatment | 2 | 1.23 | 0.540 | 2 | 1.18 | 0.556 | 2 | 0.62 | 0.732 | 2 | 0.09 | 0.956 |
| Drought (D) | 1 | 23.05 | <0.001 | 1 | 22.42 | <0.001 | 1 | 8.93 | 0.003 | 1 | 0.00 | 0.988 |
| Nitrogen input (N) | 1 | 27.28 | <0.001 | 1 | 87.31 | <0.001 | 1 | 1.12 | 0.290 | 1 | 45.86 | <0.001 |
| D x N | 1 | 3.81 | 0.051 | 1 | 2.16 | 0.141 | 1 | 2.81 | 0.094 | 1 | 2.10 | 0.147 |
| Plant history x D | 1 | 0.08 | 0.775 | 1 | 1.03 | 0.311 | 1 | 0.03 | 0.874 | 1 | 0.20 | 0.656 |
| Soil history x D | 1 | <0.01 | 0.969 | 1 | 0.21 | 0.649 | 1 | 0.15 | 0.696 | 1 | 0.21 | 0.646 |
| Soil treatment x D | 2 | 0.80 | 0.670 | 2 | 0.69 | 0.708 | 2 | 0.38 | 0.828 | 2 | 1.04 | 0.594 |
| Plant history x N | 1 | <0.01 | 0.972 | 1 | 0.87 | 0.350 | 1 | 0.32 | 0.569 | 1 | 0.73 | 0.391 |
| Soil history x N | 1 | <0.01 | 0.984 | 1 | 0.01 | 0.936 | 1 | 0.01 | 0.920 | 1 | 0.03 | 0.857 |
| Soil treatment x N | 2 | 4.20 | 0.123 | 2 | 1.87 | 0.392 | 2 | 6.33 | 0.042 | 2 | 7.28 | 0.026 |
| Plant history x D x N | 1 | 0.25 | 0.614 | 1 | <0.01 | 0.978 | 1 | 0.17 | 0.680 | 1 | 0.00 | 0.972 |
| Soil history x D x N | 1 | 0.02 | 0.890 | 1 | 1.11 | 0.292 | 1 | 1.09 | 0.296 | 1 | 2.88 | 0.089 |
| Soil treatment x D x N | 2 | 0.35 | 0.838 | 2 | 0.49 | 0.782 | 2 | 1.16 | 0.559 | 2 | 1.97 | 0.373 |
Appendix 2—table 6
Summary of mixed-effect model analyses testing the effects of legacy treatments (plant history, soil history, soil treatment), global change treatments (drought, nitrogen input) and their interactions on plant trait expressions of A. elatius.
Shown are degrees of freedom (Df), Chi2 and p-values (p). Significant effects (p < 0.05) are given in bold, marginally significant effects (p < 0.1) in italics.
| A. elatius | Growth height | Shoot nitrogen conc. | Leaf greenness | ||||||
|---|---|---|---|---|---|---|---|---|---|
| Df | Chi2 | p | Df | Chi2 | p | Df | Chi2 | p | |
| Plant history | 1 | 0.24 | 0.625 | 1 | 0.12 | 0.725 | 1 | 0.07 | 0.795 |
| Soil history | 1 | 0.61 | 0.436 | 1 | 0.36 | 0.547 | 1 | 0.67 | 0.413 |
| Soil treatment | 2 | 2.01 | 0.365 | 2 | 0.80 | 0.670 | 2 | 0.19 | 0.907 |
| Drought (D) | 1 | 2.11 | 0.146 | 1 | 36.64 | <0.001 | 1 | 30.19 | <0.001 |
| Nitrogen input (N) | 1 | 5.35 | 0.021 | 1 | 142.97 | <0.001 | 1 | 153.54 | <0.001 |
| D x N | 1 | 0.02 | 0.881 | 1 | 32.71 | <0.001 | 1 | 0.27 | 0.604 |
| Plant history x D | 1 | 4.68 | 0.030 | 1 | 1.41 | 0.236 | 1 | 0.48 | 0.487 |
| Soil history x D | 1 | 0.01 | 0.904 | 1 | 0.26 | 0.612 | 1 | 0.06 | 0.813 |
| Soil treatment x D | 2 | 3.10 | 0.212 | 2 | 0.38 | 0.827 | 2 | 1.58 | 0.453 |
| Plant history x N | 1 | 1.15 | 0.284 | 1 | 1.08 | 0.300 | 1 | 3.76 | 0.053 |
| Soil history x N | 1 | 0.61 | 0.434 | 1 | 0.20 | 0.656 | 1 | 1.09 | 0.295 |
| Soil treatment x N | 2 | 3.03 | 0.220 | 2 | 0.27 | 0.874 | 2 | 2.37 | 0.305 |
| Plant history x D x N | 1 | 0.59 | 0.443 | 1 | 1.85 | 0.174 | 1 | 0.37 | 0.545 |
| Soil history x D x N | 1 | 0.93 | 0.334 | 1 | 0.03 | 0.854 | 1 | 0.06 | 0.813 |
| Soil treatment x D x N | 2 | 7.64 | 0.022 | 2 | 0.26 | 0.877 | 2 | 1.95 | 0.377 |
| LDMC | SLA | Stomatal conductance | |||||||
| Df | Chi2 | P | Df | Chi2 | P | Df | Chi2 | P | |
| Air temperature | - | - | - | - | - | - | 1 | <0.01 | 0.948 |
| Daytime | - | - | - | - | - | - | 1 | 8.05 | 0.005 |
| Plant history | 1 | 0.46 | 0.500 | 5 | 1.69 | 0.194 | 1 | 0.49 | 0.486 |
| Soil history | 1 | 0.19 | 0.666 | 6 | 1.83 | 0.176 | 1 | 0.05 | 0.823 |
| Soil treatment | 2 | 1.37 | 0.504 | 8 | 1.14 | 0.565 | 2 | 3.38 | 0.184 |
| Drought (D) | 1 | 7.57 | 0.006 | 9 | 12.37 | <0.001 | 1 | 4.58 | 0.032 |
| Nitrogen input (N) | 1 | 1.05 | 0.307 | 10 | 0.05 | 0.832 | 1 | 2.00 | 0.158 |
| D x N | 1 | 0.02 | 0.889 | 11 | 1.87 | 0.171 | 1 | 0.17 | 0.681 |
| Plant history x D | 1 | 1.48 | 0.224 | 12 | 1.94 | 0.164 | 1 | 1.08 | 0.298 |
| Soil history x D | 1 | 0.36 | 0.549 | 13 | 0.79 | 0.373 | 1 | 0.05 | 0.830 |
| Soil treatment x D | 2 | <0.01 | 0.998 | 15 | 1.73 | 0.420 | 2 | 0.73 | 0.693 |
| Plant history x N | 1 | 0.01 | 0.904 | 16 | 0.08 | 0.782 | 1 | 0.04 | 0.836 |
| Soil history x N | 1 | 0.01 | 0.936 | 17 | 1.69 | 0.193 | 1 | 0.36 | 0.549 |
| Soil treatment x N | 2 | 2.16 | 0.339 | 19 | 2.01 | 0.367 | 2 | 0.24 | 0.886 |
| Plant history x D x N | 1 | <0.01 | 0.999 | 20 | 1.96 | 0.162 | 1 | 0.42 | 0.518 |
| Soil history x D x N | 1 | 0.10 | 0.752 | 21 | 0.15 | 0.696 | 1 | 1.48 | 0.224 |
| Soil treatment x D x N | 2 | 0.35 | 0.840 | 23 | 0.50 | 0.781 | 2 | 1.99 | 0.369 |
| Root diameter | SRL | RLD | |||||||
| Df | Chi2 | P | Df | Chi2 | P | Df | Chi2 | P | |
| Plant history | 1 | 0.08 | 0.783 | 1 | 0.31 | 0.576 | 1 | 0.09 | 0.767 |
| Soil history | 1 | 0.23 | 0.629 | 1 | 0.22 | 0.639 | 1 | 0.82 | 0.364 |
| Soil treatment | 2 | 2.89 | 0.236 | 2 | 5.30 | 0.071 | 2 | 3.35 | 0.187 |
| Drought (D) | 1 | 0.32 | 0.572 | 1 | 5.25 | 0.022 | 1 | 0.04 | 0.851 |
| Nitrogen input (N) | 1 | 3.46 | 0.063 | 1 | 13.72 | <0.001 | 1 | 0.13 | 0.723 |
| D x N | 1 | 0.01 | 0.932 | 1 | 1.62 | 0.204 | 1 | <0.01 | 0.989 |
| Plant history x D | 1 | 0.39 | 0.531 | 1 | 0.11 | 0.740 | 1 | 0.77 | 0.380 |
| Soil history x D | 1 | 0.01 | 0.938 | 1 | 0.95 | 0.329 | 1 | 0.29 | 0.590 |
| Soil treatment x D | 2 | 2.11 | 0.349 | 2 | 0.51 | 0.775 | 2 | 0.45 | 0.797 |
| Plant history x N | 1 | 0.09 | 0.764 | 1 | 1.41 | 0.235 | 1 | 1.29 | 0.256 |
| Soil history x N | 1 | 1.35 | 0.246 | 1 | 0.32 | 0.573 | 1 | 3.53 | 0.060 |
| Soil treatment x N | 2 | 0.68 | 0.711 | 2 | 1.06 | 0.590 | 2 | 1.76 | 0.416 |
| Plant history x D x N | 1 | 1.68 | 0.194 | 1 | 2.73 | 0.099 | 1 | 3.70 | 0.054 |
| Soil history x D x N | 1 | 4.45 | 0.035 | 1 | 0.52 | 0.469 | 1 | 1.46 | 0.227 |
| Soil treatment x D x N | 2 | 2.00 | 0.369 | 2 | 2.75 | 0.253 | 2 | 2.26 | 0.324 |
Appendix 2—table 7
Summary of mixed-effect model analyses testing the effects of legacy treatments (plant history, soil history, soil treatment), global change treatments (drought, nitrogen input) and their interactions on plant trait expressions of A. pratensis.
Shown are degrees of freedom (Df), Chi2 and p-values (p). Significant effects (p < 0.05) are given in bold, marginally significant effects (p < 0.1) in italics.
| A. pratensis | Growth height | Shoot nitrogen conc. | Leaf greenness | ||||||
|---|---|---|---|---|---|---|---|---|---|
| Df | Chi2 | p | Df | Chi2 | p | Df | Chi2 | p | |
| Plant history | 1 | 1.35 | 0.246 | 1 | 0.16 | 0.687 | 1 | 0.49 | 0.485 |
| Soil history | 1 | 0.71 | 0.400 | 1 | <0.01 | 0.967 | 1 | 0.11 | 0.745 |
| Soil treatment | 2 | 8.50 | 0.014 | 2 | 1.38 | 0.501 | 2 | 0.20 | 0.903 |
| Drought (D) | 1 | 1.07 | 0.300 | 1 | 15.42 | <0.001 | 1 | 16.09 | <0.001 |
| Nitrogen input (N) | 1 | 10.63 | 0.001 | 1 | 246.65 | <0.001 | 1 | 143.35 | <0.001 |
| D x N | 1 | 1.40 | 0.236 | 1 | 17.58 | <0.001 | 1 | 0.86 | 0.353 |
| Plant history x D | 1 | 0.16 | 0.692 | 1 | <0.01 | 0.979 | 1 | 0.58 | 0.446 |
| Soil history x D | 1 | 0.31 | 0.577 | 1 | 0.52 | 0.471 | 1 | 3.04 | 0.081 |
| Soil treatment x D | 2 | 1.11 | 0.575 | 2 | 0.50 | 0.778 | 2 | 3.39 | 0.183 |
| Plant history x N | 1 | 0.28 | 0.597 | 1 | 0.17 | 0.681 | 1 | <0.01 | 0.994 |
| Soil history x N | 1 | 0.01 | 0.919 | 1 | 0.10 | 0.747 | 1 | 1.10 | 0.293 |
| Soil treatment x N | 2 | 2.42 | 0.299 | 2 | 6.58 | 0.037 | 2 | 0.19 | 0.911 |
| Plant history x D x N | 1 | 0.18 | 0.672 | 1 | 0.87 | 0.352 | 1 | 1.06 | 0.304 |
| Soil history x D x N | 1 | 0.45 | 0.501 | 1 | 0.49 | 0.485 | 1 | 0.03 | 0.863 |
| Soil treatment x D x N | 2 | 0.85 | 0.654 | 2 | 2.08 | 0.353 | 2 | 0.32 | 0.854 |
| LDMC | SLA | Stomatal conductance | |||||||
| Df | Chi2 | P | Df | Chi2 | P | Df | Chi2 | P | |
| Air temperature | - | - | - | - | - | - | 1 | 0.16 | 0.685 |
| Daytime | - | - | - | - | - | - | 1 | 1.78 | 0.182 |
| Plant history | 1 | 2.82 | 0.093 | 1 | 0.19 | 0.665 | 1 | 0.43 | 0.513 |
| Soil history | 1 | 1.80 | 0.180 | 1 | 0.94 | 0.332 | 1 | 0.41 | 0.520 |
| Soil treatment | 2 | 3.57 | 0.168 | 2 | 5.69 | 0.058 | 2 | 3.67 | 0.159 |
| Drought (D) | 1 | 4.02 | 0.045 | 1 | 1.29 | 0.255 | 1 | 6.17 | 0.013 |
| Nitrogen input (N) | 1 | 0.75 | 0.388 | 1 | 2.93 | 0.087 | 1 | 3.64 | 0.056 |
| D x N | 1 | 0.33 | 0.566 | 1 | 0.41 | 0.524 | 1 | 3.45 | 0.063 |
| Plant history x D | 1 | 0.13 | 0.715 | 1 | 0.27 | 0.604 | 1 | 0.03 | 0.862 |
| Soil history x D | 1 | 0.16 | 0.685 | 1 | <0.01 | 0.980 | 1 | 0.64 | 0.423 |
| Soil treatment x D | 2 | 1.40 | 0.497 | 2 | 1.39 | 0.499 | 2 | 0.01 | 0.993 |
| Plant history x N | 1 | 1.03 | 0.311 | 1 | 1.02 | 0.313 | 1 | 0.58 | 0.447 |
| Soil history x N | 1 | <0.01 | 0.950 | 1 | 0.78 | 0.377 | 1 | 0.18 | 0.669 |
| Soil treatment x N | 2 | 0.64 | 0.726 | 2 | 2.56 | 0.278 | 2 | 0.27 | 0.874 |
| Plant history x D x N | 1 | 0.80 | 0.372 | 1 | 1.67 | 0.197 | 1 | 2.57 | 0.109 |
| Soil history x D x N | 1 | 4.17 | 0.041 | 1 | 1.01 | 0.315 | 1 | 0.23 | 0.634 |
| Soil treatment x D x N | 2 | 0.18 | 0.912 | 2 | 1.09 | 0.581 | 2 | 15.71 | <0.001 |
| Root diameter | SRL | RLD | |||||||
| Df | Chi2 | P | Df | Chi2 | P | Df | Chi2 | P | |
| Plant history | 1 | 0.01 | 0.935 | 1 | 0.28 | 0.597 | 1 | 0.06 | 0.809 |
| Soil history | 1 | 0.18 | 0.676 | 1 | 0.01 | 0.934 | 1 | 0.92 | 0.337 |
| Soil treatment | 2 | 0.54 | 0.763 | 2 | 0.97 | 0.615 | 2 | 0.12 | 0.940 |
| Drought (D) | 1 | 39.31 | <0.001 | 1 | 5.25 | 0.022 | 1 | 82.01 | <0.001 |
| Nitrogen input (N) | 1 | 51.80 | <0.001 | 1 | 5.33 | 0.021 | 1 | 0.34 | 0.560 |
| D x N | 1 | 0.09 | 0.767 | 1 | 5.57 | 0.018 | 1 | 4.32 | 0.038 |
| Plant history x D | 1 | 0.01 | 0.906 | 1 | 0.30 | 0.587 | 1 | 0.26 | 0.611 |
| Soil history x D | 1 | 0.09 | 0.769 | 1 | 0.01 | 0.910 | 1 | 0.02 | 0.877 |
| Soil treatment x D | 2 | 2.58 | 0.276 | 2 | 4.88 | 0.087 | 2 | 0.11 | 0.948 |
| Plant history x N | 1 | 0.03 | 0.869 | 1 | 0.19 | 0.660 | 1 | 0.17 | 0.682 |
| Soil history x N | 1 | 6.39 | 0.011 | 1 | 8.14 | 0.004 | 1 | 0.63 | 0.426 |
| Soil treatment x N | 2 | 1.82 | 0.402 | 2 | 3.27 | 0.195 | 2 | 1.24 | 0.539 |
| Plant history x D x N | 1 | 0.54 | 0.461 | 1 | 0.15 | 0.700 | 1 | 0.28 | 0.594 |
| Soil history x D x N | 1 | 1.82 | 0.178 | 1 | 1.87 | 0.172 | 1 | 0.27 | 0.605 |
| Soil treatment x D x N | 2 | 3.23 | 0.199 | 2 | 1.63 | 0.443 | 2 | 0.70 | 0.703 |
Appendix 2—table 8
Summary of mixed-effect model analyses testing the effects of legacy treatments (plant history, soil history, soil treatment), global change treatments (drought, nitrogen input) and their interactions on plant trait expressions of D. glomerata.
Shown are degrees of freedom (Df), Chi2 and p-values (p). Significant effects (p < 0.05) are given in bold, marginally significant effects (p < 0.1) in italics.
| D. glomerata | Growth height | Shoot nitrogen conc. | Leaf greenness | ||||||
|---|---|---|---|---|---|---|---|---|---|
| Df | Chi2 | p | Df | Chi2 | p | Df | Chi2 | p | |
| Plant history | 1 | 0.05 | 0.831 | 1 | 0.58 | 0.444 | 1 | 0.22 | 0.640 |
| Soil history | 1 | 1.56 | 0.212 | 1 | 1.35 | 0.245 | 1 | 0.27 | 0.606 |
| Soil treatment | 2 | 5.25 | 0.073 | 2 | 0.75 | 0.687 | 2 | 0.55 | 0.760 |
| Drought (D) | 1 | <0.01 | 0.976 | 1 | 19.10 | <0.001 | 1 | 29.41 | <0.001 |
| Nitrogen input (N) | 1 | 11.51 | 0.001 | 1 | 183.85 | <0.001 | 1 | 172.91 | <0.001 |
| D x N | 1 | <0.01 | 0.949 | 1 | 3.72 | 0.054 | 1 | 0.08 | 0.781 |
| Plant history x D | 1 | 0.01 | 0.920 | 1 | 0.05 | 0.828 | 1 | 2.75 | 0.097 |
| Soil history x D | 1 | 0.82 | 0.366 | 1 | 0.08 | 0.774 | 1 | 0.22 | 0.639 |
| Soil treatment x D | 2 | 0.48 | 0.785 | 2 | 0.25 | 0.880 | 2 | 0.21 | 0.899 |
| Plant history x N | 1 | 0.91 | 0.341 | 1 | 2.96 | 0.086 | 1 | 0.61 | 0.437 |
| Soil history x N | 1 | 0.23 | 0.633 | 1 | 0.32 | 0.571 | 1 | 1.75 | 0.186 |
| Soil treatment x N | 2 | 0.35 | 0.840 | 2 | 0.29 | 0.866 | 2 | 4.92 | 0.085 |
| Plant history x D x N | 1 | 0.12 | 0.733 | 1 | 1.62 | 0.204 | 1 | 0.54 | 0.462 |
| Soil history x D x N | 1 | 0.71 | 0.400 | 1 | 5.07 | 0.024 | 1 | <0.01 | 0.998 |
| Soil treatment x D x N | 2 | 0.06 | 0.969 | 2 | 2.15 | 0.341 | 2 | 0.33 | 0.846 |
| LDMC | SLA | Stomatal conductance | |||||||
| Df | Chi2 | p | Df | Chi2 | p | Df | Chi2 | p | |
| Air temperature | - | - | - | - | - | - | 1 | 0.39 | 0.531 |
| Daytime | - | - | - | - | - | - | 1 | 20.31 | <0.001 |
| Plant history | 1 | 0.12 | 0.727 | 1 | 0.80 | 0.371 | 1 | 5.08 | 0.024 |
| Soil history | 1 | 0.58 | 0.445 | 1 | 0.32 | 0.573 | 1 | <0.01 | 0.944 |
| Soil treatment | 2 | 0.58 | 0.749 | 2 | 1.20 | 0.548 | 2 | 0.54 | 0.765 |
| Drought (D) | 1 | 0.07 | 0.798 | 1 | 0.54 | 0.461 | 1 | 9.01 | 0.003 |
| Nitrogen input (N) | 1 | 55.57 | <0.001 | 1 | 57.43 | <0.001 | 1 | 2.72 | 0.099 |
| D x N | 1 | 20.69 | <0.001 | 1 | 6.61 | 0.010 | 1 | 6.34 | 0.012 |
| Plant history x D | 1 | 0.04 | 0.842 | 1 | 0.46 | 0.498 | 1 | 0.07 | 0.793 |
| Soil history x D | 1 | 0.01 | 0.926 | 1 | 0.09 | 0.762 | 1 | <0.01 | 0.991 |
| Soil treatment x D | 2 | 1.43 | 0.490 | 2 | 0.09 | 0.958 | 2 | 0.19 | 0.907 |
| Plant history x N | 1 | 0.99 | 0.320 | 1 | 0.02 | 0.893 | 1 | 0.32 | 0.571 |
| Soil history x N | 1 | 2.48 | 0.115 | 1 | 2.19 | 0.139 | 1 | 0.69 | 0.406 |
| Soil treatment x N | 2 | 0.13 | 0.938 | 2 | 1.56 | 0.459 | 2 | 0.09 | 0.958 |
| Plant history x D x N | 1 | 2.00 | 0.157 | 1 | 0.09 | 0.768 | 1 | 0.33 | 0.566 |
| Soil history x D x N | 1 | 1.30 | 0.254 | 1 | 4.99 | 0.026 | 1 | 5.98 | 0.014 |
| Soil treatment x D x N | 2 | 3.56 | 0.169 | 2 | 1.09 | 0.579 | 2 | 1.57 | 0.456 |
| Root diameter | SRL | RLD | |||||||
| Df | Chi2 | p | Df | Chi2 | p | Df | Chi2 | p | |
| Plant history | 1 | 0.60 | 0.438 | 1 | 0.96 | 0.326 | 1 | 2.61 | 0.107 |
| Soil history | 1 | 0.06 | 0.805 | 1 | 0.07 | 0.791 | 1 | 0.01 | 0.933 |
| Soil treatment | 2 | 0.07 | 0.967 | 2 | 0.58 | 0.749 | 2 | 2.44 | 0.296 |
| Drought (D) | 1 | 0.93 | 0.335 | 1 | 1.16 | 0.281 | 1 | 9.45 | 0.002 |
| Nitrogen input (N) | 1 | 1.22 | 0.270 | 1 | 0.37 | 0.545 | 1 | 7.05 | 0.008 |
| D x N | 1 | 0.80 | 0.370 | 1 | 1.73 | 0.189 | 1 | 0.08 | 0.773 |
| Plant history x D | 1 | 3.60 | 0.058 | 1 | 0.64 | 0.425 | 1 | 0.25 | 0.614 |
| Soil history x D | 1 | 1.41 | 0.235 | 1 | 0.62 | 0.430 | 1 | 0.23 | 0.632 |
| Soil treatment x D | 2 | 0.65 | 0.721 | 2 | 1.95 | 0.377 | 2 | 2.43 | 0.297 |
| Plant history x N | 1 | 0.19 | 0.667 | 1 | 2.05 | 0.152 | 1 | 0.03 | 0.854 |
| Soil history x N | 1 | 0.60 | 0.437 | 1 | <0.01 | 0.994 | 1 | 0.21 | 0.646 |
| Soil treatment x N | 2 | 0.85 | 0.653 | 2 | 0.97 | 0.616 | 2 | 1.76 | 0.414 |
| Plant history x D x N | 1 | 1.49 | 0.222 | 1 | 0.14 | 0.712 | 1 | 3.11 | 0.078 |
| Soil history x D x N | 1 | 0.49 | 0.483 | 1 | 3.54 | 0.060 | 1 | 1.07 | 0.301 |
| Soil treatment x D x N | 2 | 1.65 | 0.438 | 2 | 1.16 | 0.559 | 2 | 0.20 | 0.907 |
Appendix 2—table 9
Summary of mixed-effect model analyses testing the effects of legacy treatments (plant history, soil history, soil treatment), global change treatments (drought, nitrogen input) and their interactions on plant trait expressions of P. trivialis.
Shown are degrees of freedom (Df), Chi2 and P-values (P). Significant effects (P < 0.05) are given in bold, marginally significant effects (P < 0.1) in italics.
| P. trivialis | Growth height | Shoot nitrogen conc. | Leaf greenness | ||||||
|---|---|---|---|---|---|---|---|---|---|
| Df | Chi2 | P | Df | Chi2 | P | Df | Chi2 | P | |
| Plant history | 1 | 0.06 | 0.800 | 1 | 0.00 | 0.997 | 1 | 0.93 | 0.334 |
| Soil history | 1 | 2.29 | 0.131 | 1 | 0.05 | 0.824 | 1 | 1.10 | 0.294 |
| Soil treatment | 2 | 1.66 | 0.435 | 2 | 0.51 | 0.776 | 2 | 1.15 | 0.563 |
| Drought (D) | 1 | 30.17 | <0.001 | 1 | 5.46 | 0.019 | 1 | 1.42 | 0.233 |
| Nitrogen input (N) | 1 | 12.16 | <0.001 | 1 | 297.03 | <0.001 | 1 | 108.82 | <0.001 |
| D x N | 1 | 1.72 | 0.190 | 1 | 17.06 | <0.001 | 1 | 1.09 | 0.296 |
| Plant history x D | 1 | 0.22 | 0.637 | 1 | 0.11 | 0.736 | 1 | 3.08 | 0.079 |
| Soil history x D | 1 | 2.28 | 0.131 | 1 | 0.53 | 0.469 | 1 | 0.06 | 0.806 |
| Soil treatment x D | 2 | 3.11 | 0.211 | 2 | 1.03 | 0.598 | 2 | 0.18 | 0.916 |
| Plant history x N | 1 | 5.16 | 0.023 | 1 | 0.05 | 0.821 | 1 | 0.13 | 0.719 |
| Soil history x N | 1 | 3.49 | 0.062 | 1 | 0.04 | 0.842 | 1 | 0.36 | 0.549 |
| Soil treatment x N | 2 | 2.08 | 0.354 | 2 | 1.04 | 0.594 | 2 | 1.98 | 0.371 |
| Plant history x D x N | 1 | 0.92 | 0.336 | 1 | 0.03 | 0.865 | 1 | 0.11 | 0.738 |
| Soil history x D x N | 1 | 0.13 | 0.718 | 1 | 0.18 | 0.669 | 1 | 0.00 | 0.967 |
| Soil treatment x D x N | 2 | 2.11 | 0.348 | 2 | 5.57 | 0.062 | 2 | 1.74 | 0.418 |
| LDMC | SLA | Stomatal conductance | |||||||
| Df | Chi2 | P | Df | Chi2 | P | Df | Chi2 | P | |
| Air temperature | - | - | - | - | - | - | 1 | 38.70 | <0.001 |
| Daytime | - | - | - | - | - | - | 1 | 18.64 | <0.001 |
| Plant history | 1 | <0.01 | 0.965 | 1 | 0.62 | 0.431 | 1 | 0.18 | 0.675 |
| Soil history | 1 | 0.08 | 0.777 | 1 | 0.49 | 0.485 | 1 | 0.71 | 0.399 |
| Soil treatment | 2 | 1.64 | 0.441 | 2 | 2.12 | 0.346 | 2 | 3.25 | 0.197 |
| Drought (D) | 1 | 2.85 | 0.091 | 1 | 2.75 | 0.097 | 1 | 0.22 | 0.636 |
| Nitrogen input (N) | 1 | 57.72 | <0.001 | 1 | 41.44 | <0.001 | 1 | 0.06 | 0.800 |
| D x N | 1 | 0.39 | 0.534 | 1 | 0.62 | 0.431 | 1 | 2.87 | 0.090 |
| Plant history x D | 1 | 1.09 | 0.296 | 1 | 0.38 | 0.540 | 1 | 2.86 | 0.091 |
| Soil history x D | 1 | 2.26 | 0.133 | 1 | 0.45 | 0.502 | 1 | 0.01 | 0.908 |
| Soil treatment x D | 2 | 0.19 | 0.908 | 2 | 1.33 | 0.515 | 2 | 0.40 | 0.819 |
| Plant history x N | 1 | 3.37 | 0.066 | 1 | 1.56 | 0.212 | 1 | 0.35 | 0.554 |
| Soil history x N | 1 | 0.54 | 0.461 | 1 | 0.21 | 0.645 | 1 | 2.45 | 0.118 |
| Soil treatment x N | 2 | 1.89 | 0.388 | 2 | 3.10 | 0.213 | 2 | 1.36 | 0.508 |
| Plant history x D x N | 1 | 0.13 | 0.720 | 1 | 0.58 | 0.446 | 1 | 0.14 | 0.704 |
| Soil history x D x N | 1 | 1.15 | 0.283 | 1 | 1.01 | 0.315 | 1 | 7.44 | 0.006 |
| Soil treatment x D x N | 2 | 3.30 | 0.192 | 2 | 0.99 | 0.610 | 2 | 2.20 | 0.333 |
| Root diameter | SRL | RLD | |||||||
| Df | Chi2 | P | Df | Chi2 | P | Df | Chi2 | P | |
| Plant history | 1 | 2.10 | 0.147 | 1 | 2.38 | 0.123 | 1 | 0.04 | 0.840 |
| Soil history | 1 | 0.08 | 0.781 | 1 | 0.30 | 0.581 | 1 | 1.31 | 0.253 |
| Soil treatment | 2 | 0.13 | 0.938 | 2 | 0.31 | 0.856 | 2 | 1.13 | 0.568 |
| Drought (D) | 1 | 14.18 | <0.001 | 1 | 0.89 | 0.347 | 1 | 18.25 | <0.001 |
| Nitrogen input (N) | 1 | 0.17 | 0.677 | 1 | 3.49 | 0.062 | 1 | 0.03 | 0.872 |
| D x N | 1 | 0.88 | 0.349 | 1 | 0.25 | 0.618 | 1 | 1.16 | 0.282 |
| Plant history x D | 1 | 0.40 | 0.525 | 1 | 0.27 | 0.602 | 1 | 0.16 | 0.692 |
| Soil history x D | 1 | 0.48 | 0.487 | 1 | 0.20 | 0.655 | 1 | 1.36 | 0.244 |
| Soil treatment x D | 2 | 5.85 | 0.054 | 2 | 0.50 | 0.777 | 2 | 0.43 | 0.808 |
| Plant history x N | 1 | 1.28 | 0.258 | 1 | 0.07 | 0.795 | 1 | 0.28 | 0.594 |
| Soil history x N | 1 | 1.21 | 0.271 | 1 | 0.36 | 0.549 | 1 | 0.65 | 0.418 |
| Soil treatment x N | 2 | 2.99 | 0.225 | 2 | 9.11 | 0.011 | 2 | 0.33 | 0.846 |
| Plant history x D x N | 1 | 0.33 | 0.566 | 1 | 0.05 | 0.821 | 1 | 0.02 | 0.878 |
| Soil history x D x N | 1 | 4.11 | 0.043 | 1 | 9.74 | 0.002 | 1 | 2.06 | 0.151 |
| Soil treatment x D x N | 2 | 0.52 | 0.772 | 2 | 1.40 | 0.495 | 2 | 1.43 | 0.488 |
Appendix 2—table 10
Summary of mixed-effect model analyses testing the effects of legacy treatments (plant history, soil history, soil treatment), global change treatments (drought, nitrogen input) and their interactions on mildew infestation of D. glomerata and P. trivialis.
Shown are degrees of freedom (Df), Chi2 and p-values (p). Significant effects (p < 0.05) are given in bold, marginally significant effects (p < 0.1) in italics.
| Mildew infestation | D. glomerata | P. trivialis | ||||
|---|---|---|---|---|---|---|
| Df | Chi2 | p | Df | Chi2 | p | |
| Plant history | 1 | 0.29 | 0.588 | 1 | 0.01 | 0.939 |
| Soil history | 1 | 0.24 | 0.622 | 1 | 4.16 | 0.041 |
| Soil treatment | 2 | 0.22 | 0.896 | 2 | 3.36 | 0.187 |
| Drought (D) | 1 | 2.44 | 0.119 | 1 | 10.69 | 0.001 |
| Nitrogen input (N) | 1 | 42.75 | <0.001 | 1 | 38.76 | <0.001 |
| D x N | 1 | 1.05 | 0.305 | 1 | 0.98 | 0.321 |
| Plant history x D | 1 | 0.03 | 0.855 | 1 | 0.02 | 0.889 |
| Soil history x D | 1 | 2.25 | 0.134 | 1 | 0.07 | 0.788 |
| Soil treatment x D | 2 | 5.79 | 0.055 | 2 | 0.25 | 0.884 |
| Plant history x N | 1 | <0.01 | 0.953 | 1 | 0.25 | 0.614 |
| Soil history x N | 1 | 0.21 | 0.643 | 1 | 0.50 | 0.477 |
| Soil treatment x N | 2 | 0.32 | 0.854 | 2 | 1.22 | 0.544 |
| Plant history x D x N | 1 | 3.00 | 0.083 | 1 | 0.09 | 0.770 |
| Soil history x D x N | 1 | 1.69 | 0.193 | 1 | 0.93 | 0.335 |
| Soil treatment x D x N | 2 | 7.15 | 0.028 | 2 | 0.62 | 0.734 |
Additional files
Download links
A two-part list of links to download the article, or parts of the article, in various formats.
Downloads (link to download the article as PDF)
Open citations (links to open the citations from this article in various online reference manager services)
Cite this article (links to download the citations from this article in formats compatible with various reference manager tools)
Eco-evolutionary dynamics modulate plant responses to global change depending on plant diversity and species identity
eLife 11:e74054.
https://doi.org/10.7554/eLife.74054


