MicroRNA-138 controls hippocampal interneuron function and short-term memory in mice
- Lab of Systems Neuroscience, Institute for Neuroscience, Department of Health Science and Technology, Swiss Federal Institute of Technology ETH, Switzerland
- Institute for Physiological Chemistry, Biochemical-Pharmacological Center Marburg, Philipps-University of Marburg, Germany
- Section of Bioinformatics and Systems Cardiology, Department of Internal Medicine III and Klaus Tschira Institute for Integrative Computational Cardiology, University of Heidelberg, Germany
Figures
Figure 1 with 1 supplement
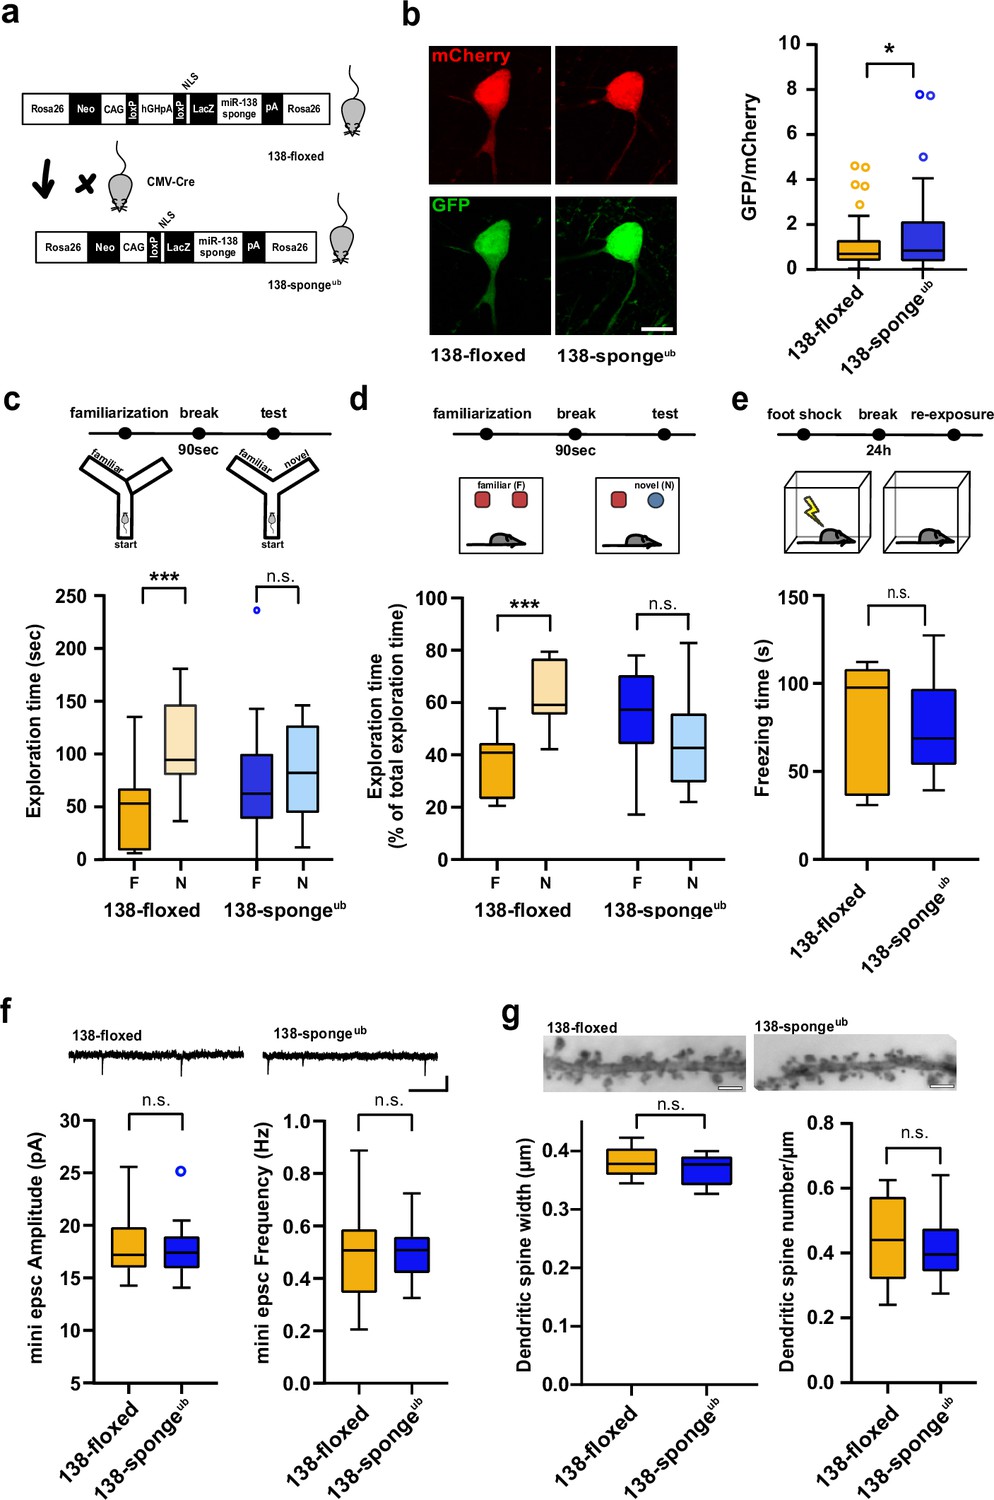
Impaired working memory in ubiquitous 138-sponge mice.
(a) Schematic overview of the strategy for generating 138-spongeub mice. (b) Left: representative images of mCherry and GFP expression in hippocampal neurons from 138-floxed and 138-spongeub mice, respectively. Right: bar graphs of GFP/mCherry ratios from CA1 hippocampal neurons infected with a 138-pbds sensor construct; 138-floxed: n=105 cells from two mice, 138-spongeub: n=127 cells from three mice; p=0.02 (KS-test). (c) Upper panel: schematic representation of the Y-maze novelty preference task; lower panel: exploration time spent in familiar (F) and novel (N) arm; 138-floxed: n=12 mice; 138-spongeub: n=14 mice; ***p=0.005; n.s.=0.711 (Student’s two-tailed heteroscedastic t-test). (d) Upper panel: schematic representation of the novel object recognition task; lower panel: exploration time presented as percentage of total time spent with either novel or familiar object; 138-floxed: n=12 mice; 138-spongeub: n=12 mice; ****p<0.00002; n.s. p=0.11 (Student’s two-tailed heteroscedastic t-test). (e) Upper: schematic representation of the contextual fear conditioning task; lower: time (s) mice spent freezing 24 hr after the foot shock was administrated; 138-floxed: n=7 mice; 138-spongeub: n=7 mice; n.s. p=0.97 (Student’s two-tailed heteroscedastic t-test). (f) mEPSC recording in CA1 pyramidal neurons. Upper panel: example traces; scale bar: 20 pA, 500 ms. Lower panel left: mEPSC amplitude (138-floxed: range, from 14.3 to 25.6 pA; median, 17.2 pA; interquartile range [IQR], 3.9 pA. 138-spongeub: range, from 14.1 to 25.2 pA; median, 17.4 pA; IQR, 3.1 pA; n.s. p=0.74 Student’s two-tailed heteroscedastic t-test). Lower panel right: mEPSC frequency (138-floxed: range, from 0.2 to 0.9 Hz; median, 0.5 Hz; IQR, 0.2 Hz. 138-spongeub: range, from 0.3 to 0.7 Hz; median, 0.5 Hz; IQR, 0.1 Hz; n.s. p=0.91 Student’s two-tailed heteroscedastic t-test). 138-floxed: n=13 cells/4 mice; 138-spongeub: n=13 cells/3 mice. (g) Upper panel: representative images of Golgi-stained CA1 pyramidal neuron dendritic segments of the indicated genotypes. Lower panel: quantification of dendritic spine width (left) and density (number/μm; right) based on Golgi staining; 138-floxed: n=15 cells/3 mice (1312 spines total); 138-spongeub: n=18 cells/3 mice (1687 spines total) (n.s., p=0.25 (width); p=0.49 (density); Student’s two-tailed heteroscedastic t-test). mEPSC, miniature excitatory postsynaptic current.
-
Figure 1—source data 1
This file contains the raw data on which the graphs in Figure 1 are based.
- https://cdn.elifesciences.org/articles/74056/elife-74056-fig1-data1-v2.xlsx
Figure 1—figure supplement 1
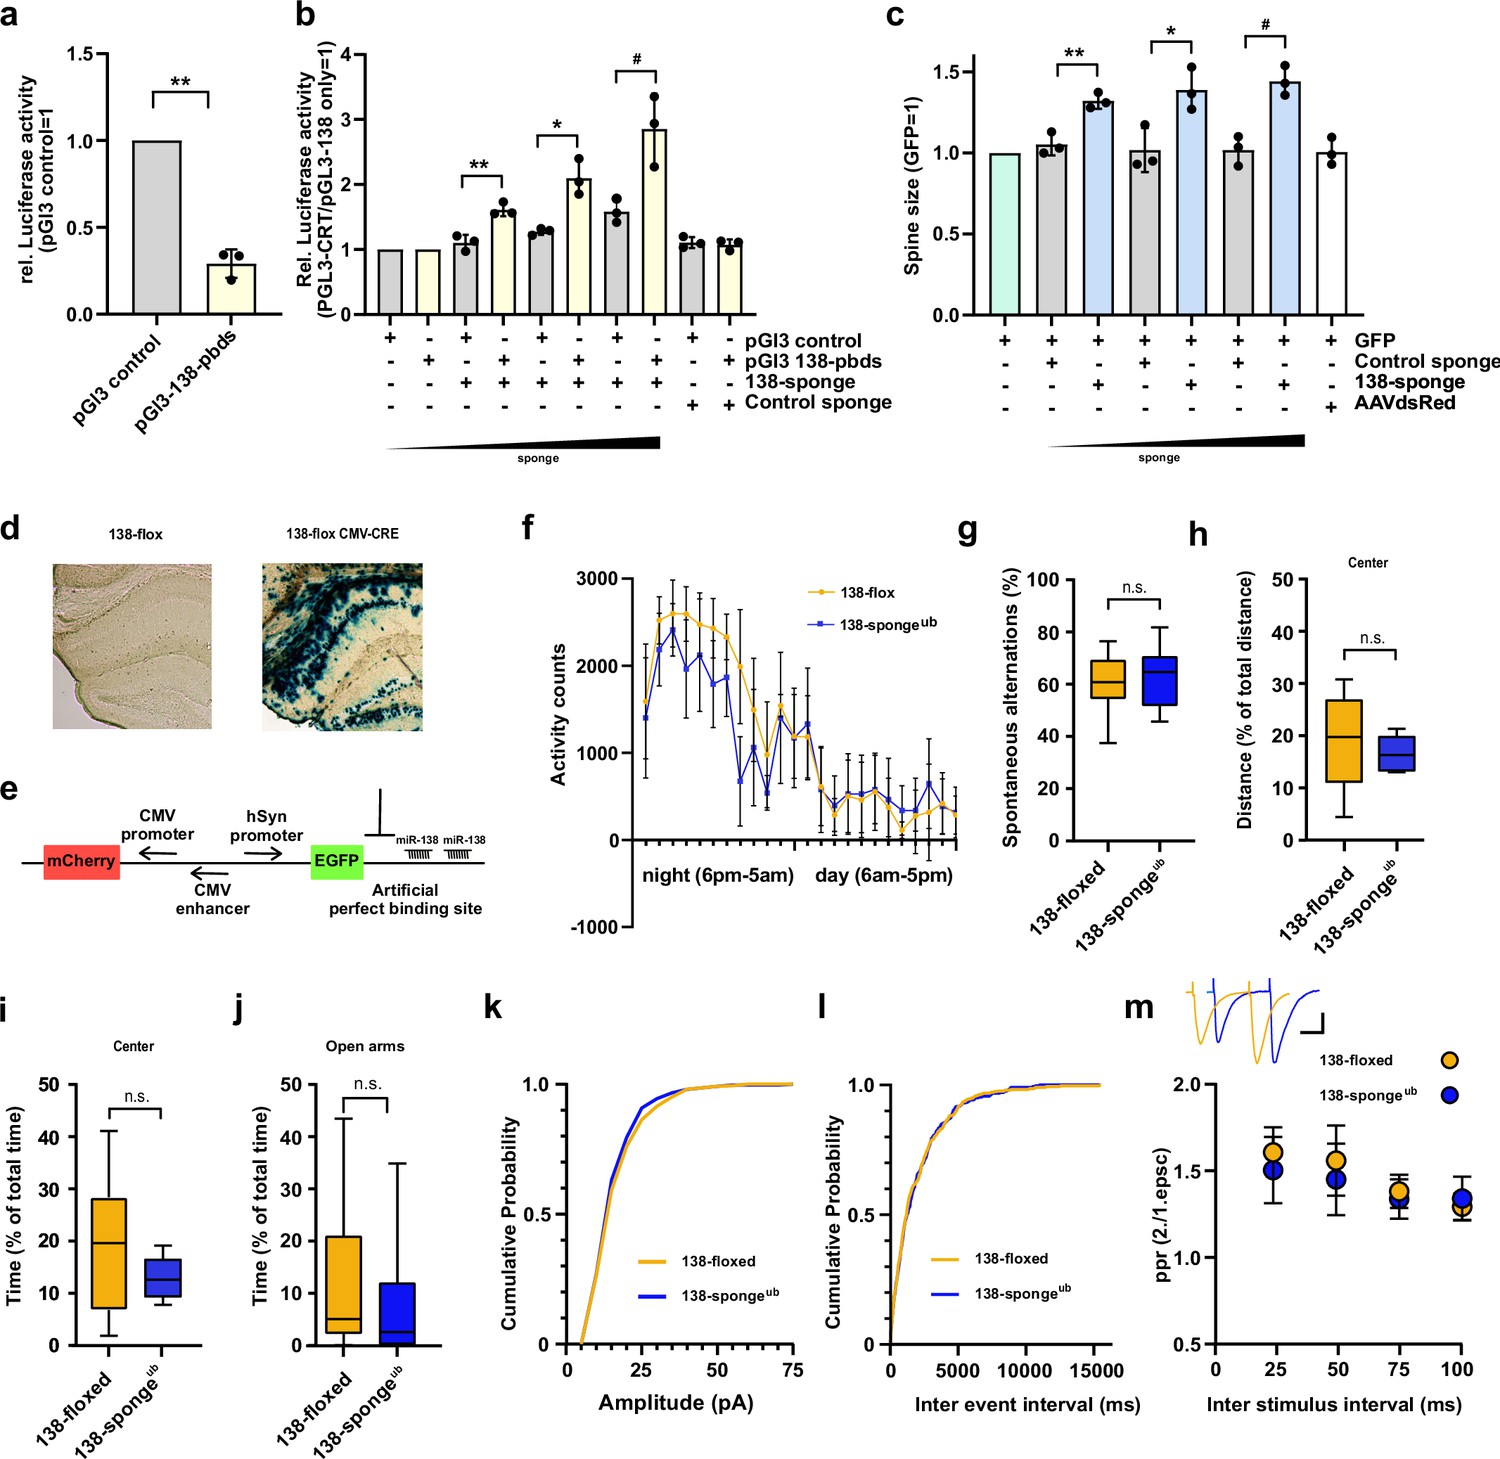
Validation, behavioural and electrophysiological characterization of ubiquitous miR-138 sponge mice.
(a) Relative luciferase activity in hippocampal neurons (DIV 12–17) transfected with pGL3 CTR (control) or pGL3-138 pbds (sensor) constructs. pGL3-CTR=1. n=3 independent transfections. **p=0.0013 (One sample t-test). (b) Relative luciferase activity in hippocampal neurons (DIV 12–17) transfected as in (a), in addition with either control (100 ng) or increasing amounts of 138 sponge (25–100 ng). pGL3-CTR/pGL3-138 only =1. n=3 independent transfections, **p=0.005, *p=0.032, #p=0.045 (Student’s two-tailed heteroscedastic t-test). (c) Quantification of relative dendritic spine volume in rat hippocampal neurons (DIV10–18) transfected with GFP and increasing amounts (25–100 ng) of either control or 138 sponge. GFP only =1. n=3 independent transfections; each value represents at least 150 spines per cell, from six individual neurons per experiment. **p=0.006, *p=0.027, #p=0.004 (Student’s two-tailed heteroscedastic t-test). (d) Representative enzymatic b-Gal staining of hippocampal slices obtained from 138-floxed mice (P21) injected with either saline (left) or rAAV-CMV-CRE (right). (e) Schematic of the sensor principle. (f) Activity counts of mice from indicated genotypes monitored over 24 hr in their home cage; 138-floxed: n=7 mice, 138-spongeub: n=7 mice; data shown as mean ±s.d. (g) Percentage of spontaneous alternations in the Y-Maze. 138-floxed: n=14 mice; 138-spongeub: n=14 mice; p=0.43 (Student’s two-tailed heteroscedastic t-test). (h, i) Percentage of total distance travelled (h)/time spent (i) in the center of an open field arena during 30 min exploration by mice of the indicated genotypes; 138-floxed: n=14 mice; 138-spongeub: n=14 mice; (h) p=0.30, (i) p=0.054 (Student’s two-tailed heteroscedastic t-test). (j) Percentage of total time spent in the open arms of an elevated plus maze (EPM) during 5 min exploration by mice of the indicated genotypes; 138-floxed: n=14 mice; 138-spongeub: n=14 mice; p=0.50 (Mann-Whitney test). (k, l) Cumulative distribution mEPSC amplitude (p=0.65; Kolmogorov-Smirnov [KS] test) (k) and frequency (p=0.85; KS test) (l). (m) PPR of stimulated EPSCs in CA1 pyramidal neurons. Upper panel: example traces of PPR (inter stimulus interval of 50 ms) for 138-floxed (orange) and 138-spongeub (blue); scale bar: 100 pA, 20 ms. Lower panel: PPRs for different interstimulus intervals ranging from 25 ms to 100 ms (138-floxed vs. 138-spongeub [mean ±s.d.]: 25 ms, 1.6±0.1 vs. 1.5±0.2 [n=13]; 50 ms: 1.6±0.2 vs. 1.5±0.2 [n=13]; 75 ms: 1.4±0.1 vs. 1.3±0.1 [n=11]; 100 ms: 1.3±0.1 vs. 1.3±0.1 [n=11]. n.s. p=0.14, 0.09, 0.17, and 0.13 for 25, 50, 75, and 100 ms) inter stimulus intervals, respectively. Mann-Whitney test. PPR, paired-pulse ratio.
-
Figure 1—figure supplement 1—source data 1
This file contains the raw data on which the graphs in Figure 1—figure supplement 1 are based.
- https://cdn.elifesciences.org/articles/74056/elife-74056-fig1-figsupp1-data1-v2.xlsx
Figure 2 with 1 supplement
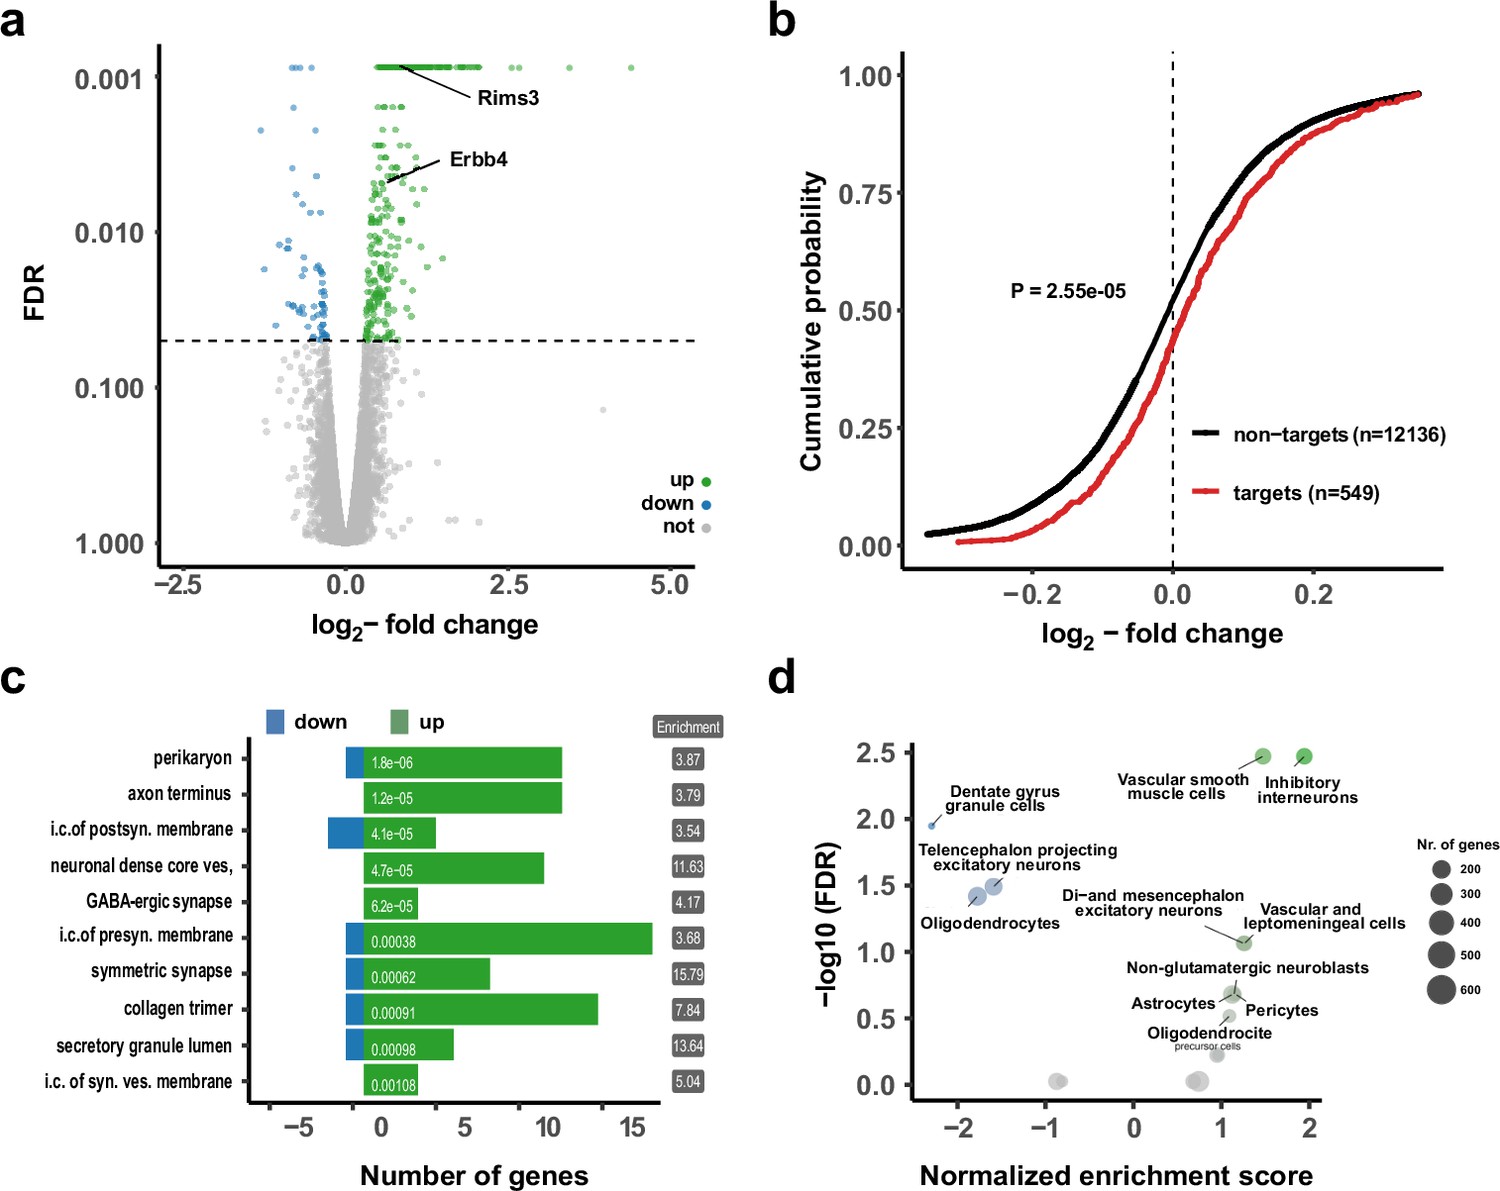
Upregulation of interneuron-enriched synaptic genes in ubiquitous miR-138 sponge mice.
(a) Volcano plot of differentially expressed genes (DEGs) obtained from polyA-RNAseq of total hippocampal RNA from 138-flox and 138-spongeub mice. N=3. Genes with FDR <0.05 are labeled blue (downregulated) or green (upregulated). Rims3 and Erbb4 are indicated. (b) Cumulative distribution plots of log2-fold expression changes (138-spongeub/138-floxed) for genes either containing (targets, red curve) or not containing (non-targets, black curve) predicted miR-138 binding sites. p=2.55e–05 (KS-test). (c) Gene ontology (GO) term analysis for DEGs. Top ten enriched cellular component (CC) GO terms with less than 200 total genes are shown. (d) Enrichment analysis of DEGs in different brain cell types based on published single-cell RNA-seq data (Zeisel et al., 2018). Normalized enrichment score >0: upregulated in 138-spongeub mice. KS, Kolmogorov-Smirnov.
Figure 2—figure supplement 1
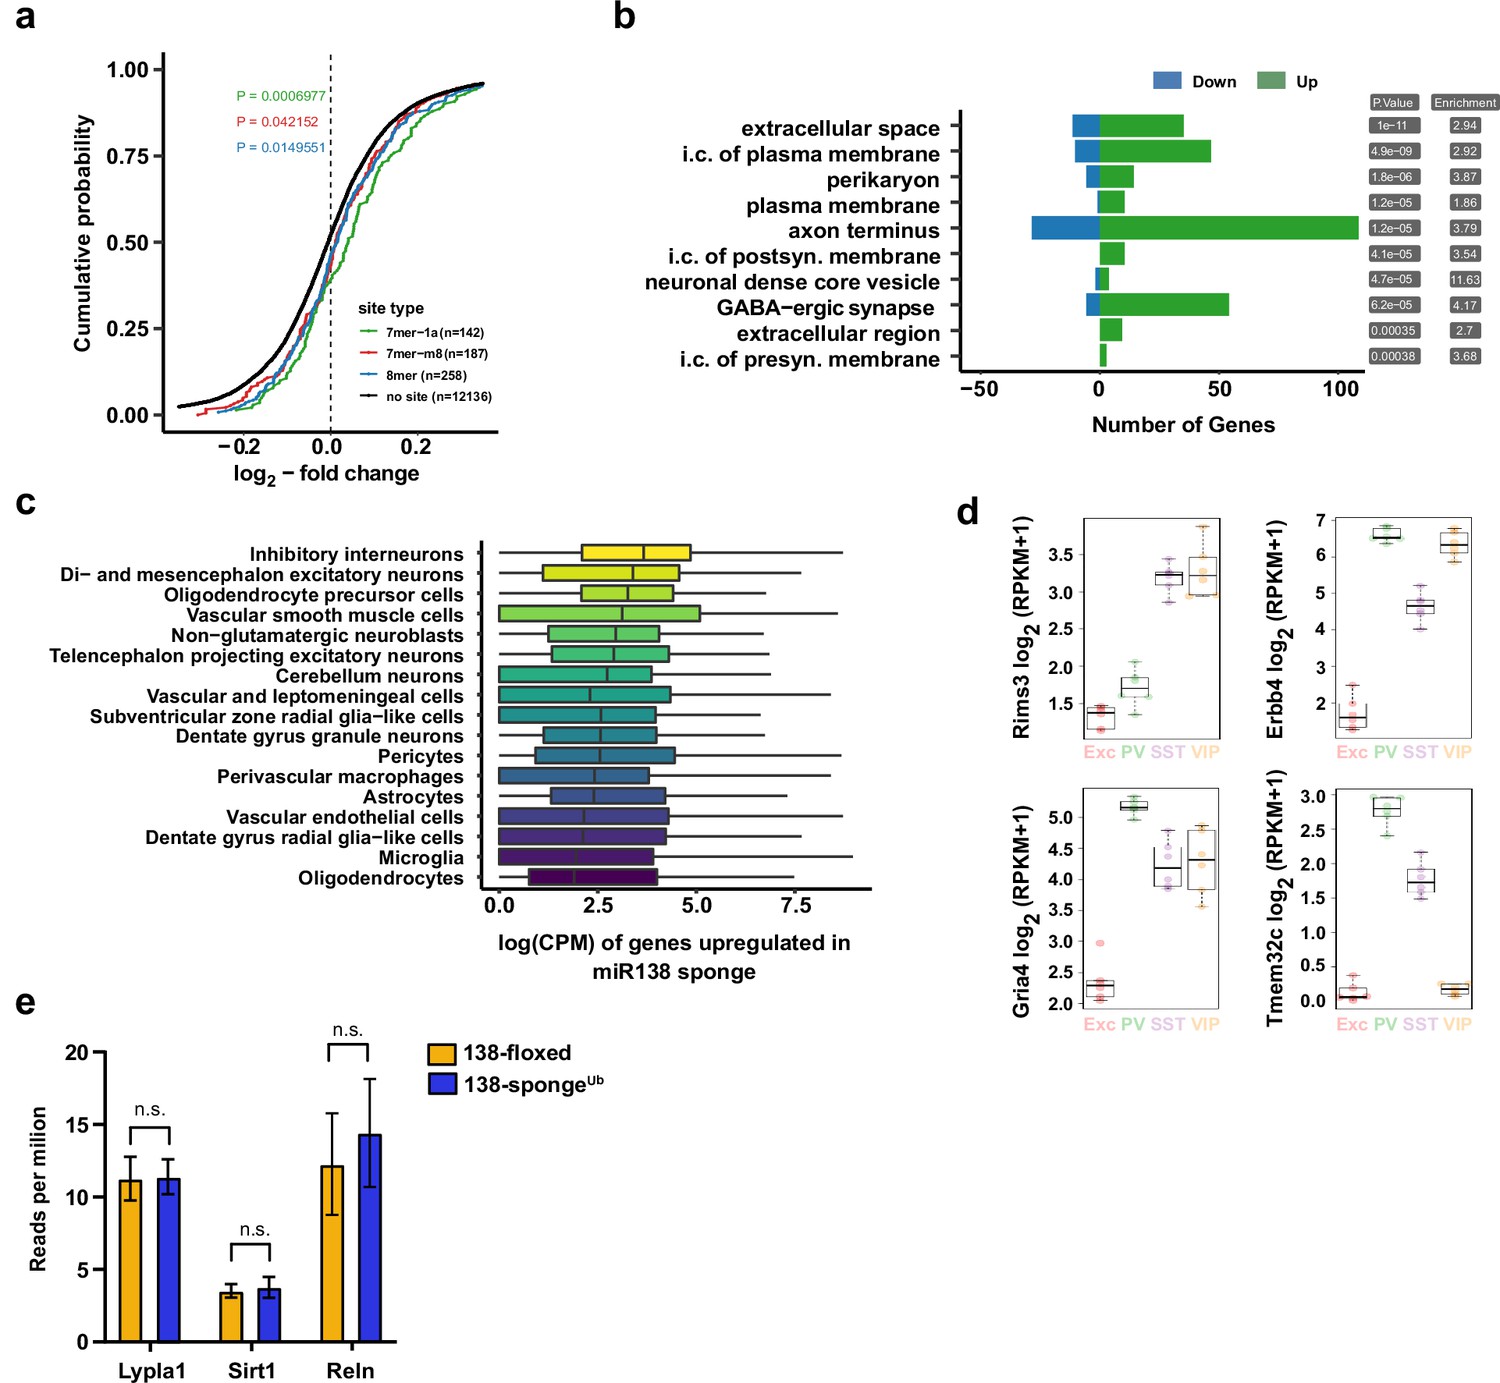
Gene expression analysis in ubiquitous miR-138 sponge mice.
(a) Cumulative distribution plots of log2-fold expression changes (138-spongeub/138-floxed) for genes either containing 7mer-1a (green), 7mer-m8 (red), 8mer (blue), or no (no site, black curve) predicted miR-138 binding sites. P value is calculated compared to the no site population and indicated in the graph (KS-test). (b) Gene ontology (GO) term analysis for DEGs. Top ten enriched cellular component (CC) GO terms are shown. (c) Normalized expression levels, in single-cell clusters from Zeisel et al., 2018, of the genes upregulated in the miR-138 sponge. The genes are most abundantly expressed in inhibitory neurons. (d) Expression plots of selected miR-138 binding site containing transcripts in different neuronal subtypes. EXC: excitatory neurons; PV: parvalbumin+interneurons; SST: somatostatin +interneurons; VIP: Vasoactive intestinal peptide+interneurons based on http://research-pub.gene.com/NeuronSubtypeTranscriptomes/. (e) Expression of validated miR138-5p targets based on RNA-seq in 138-floxed and 138-spongeUb mice. n=3 mice. Lypla1 n.s. p=0.90; Sirt1 n.s. p=0.66; Reln n.s. p=0.50 (Student’s two-tailed heteroscedastic t-test). DEG, differentially expressed gene; KS, Kolmogorov-Smirnov.
-
Figure 2—figure supplement 1—source data 1
This file contains the raw data on which the graphs in Figure 2—figure supplement 1 are based.
- https://cdn.elifesciences.org/articles/74056/elife-74056-fig2-figsupp1-data1-v2.xlsx
Figure 3 with 1 supplement
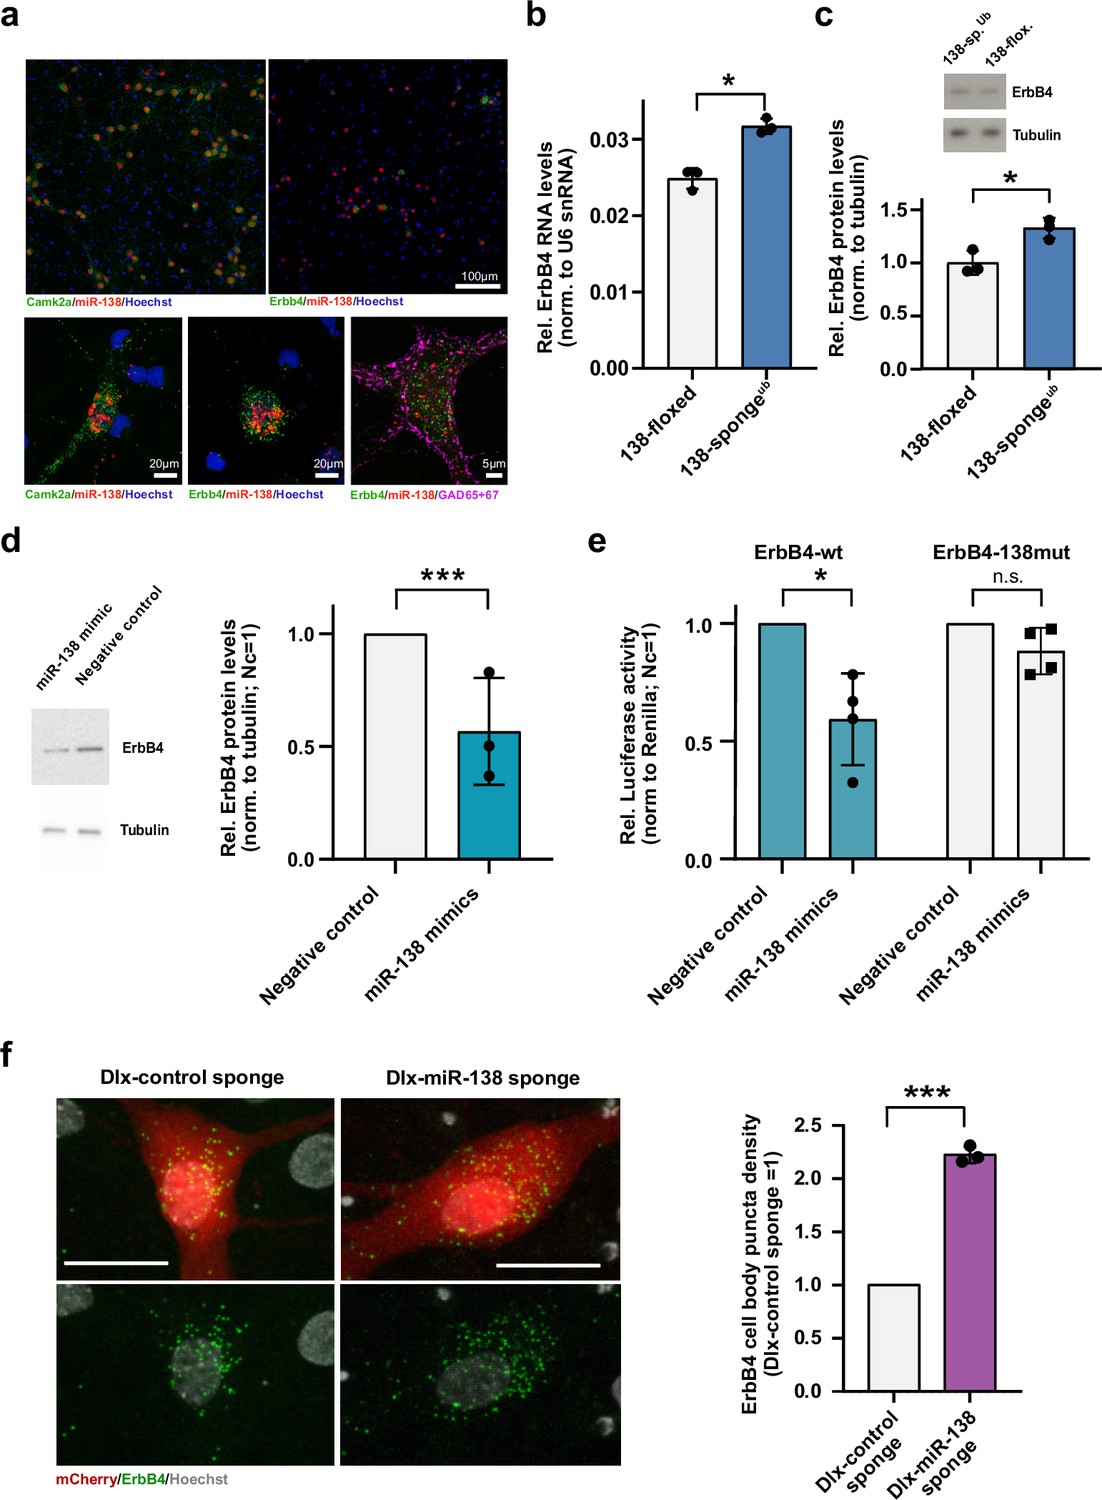
Erbb4 is a direct miR-138 target in rat hippocampal interneurons.
(a) Single-molecule (Sm) FISH analysis of miR-138 (red) together with Camk2a or Erbb4 mRNA to label excitatory or inhibitory neurons, respectively. Hoechst was used to counterstain nuclei. GAD65/67 antibody staining was used to identify GABAergic neurons. Scale bar =100 μm (upper); 20 μm (lower left and center), 5 μm (lower right). (b) qPCR analysis of ErbB4 mRNA in total hippocampal RNA obtained from 138-floxed or 138-spongeub mice. U6 snRNA was used for normalization. n=3 mice; *p=0.003, (Student’s two-tailed heteroscedastic t-test). (c, d) Western blot analysis of Erbb4 protein in hippocampal lysates from 138-floxed or 138-spongeub mice (c) or lysates from rat hippocampal neurons (DIV12) transfected with miR-138 or control mimic (d). Tubulin was used for normalization. (c) n=3 mice; *p=0.025 (Student’s two-tailed heteroscedastic t-test); (d) n=3 independent transfections; ***p=0.0009 (one sample t-test). (e) Relative luciferase activity in rat cortical neurons (DIV9-12) transfected with Erbb4 3′UTR constructs with (138mut) or without (wt) a mutation in the miR-138 binding site, together with miR-138 or negative control mimics. Negative control mimic =1. n=4 independent transfections, *p=0.025, n.s. p=0.09 (Student’s two-tailed heteroscedastic t-test). (f) Sm FISH analysis of Erbb4 (green) in rat hippocampal interneurons infected with Dlx-control-sponge or miR-138-sponge. Left panel: representative neurons, scale bar =20 μm. Green: Erbb4 FISH; gray: DAPI (nuclei); red: mCherry (Dlx5/6 expressing interneurons). Right panel: Erbb4 FISH quantification. Control sponge =1. N=3 independent infections (10–12 cells per condition), ***p=0.0004 (one-sample t-test).
-
Figure 3—source data 1
This file contains the raw data on which the graphs in Figure 3 are based.
- https://cdn.elifesciences.org/articles/74056/elife-74056-fig3-data1-v2.xlsx
Figure 3—figure supplement 1
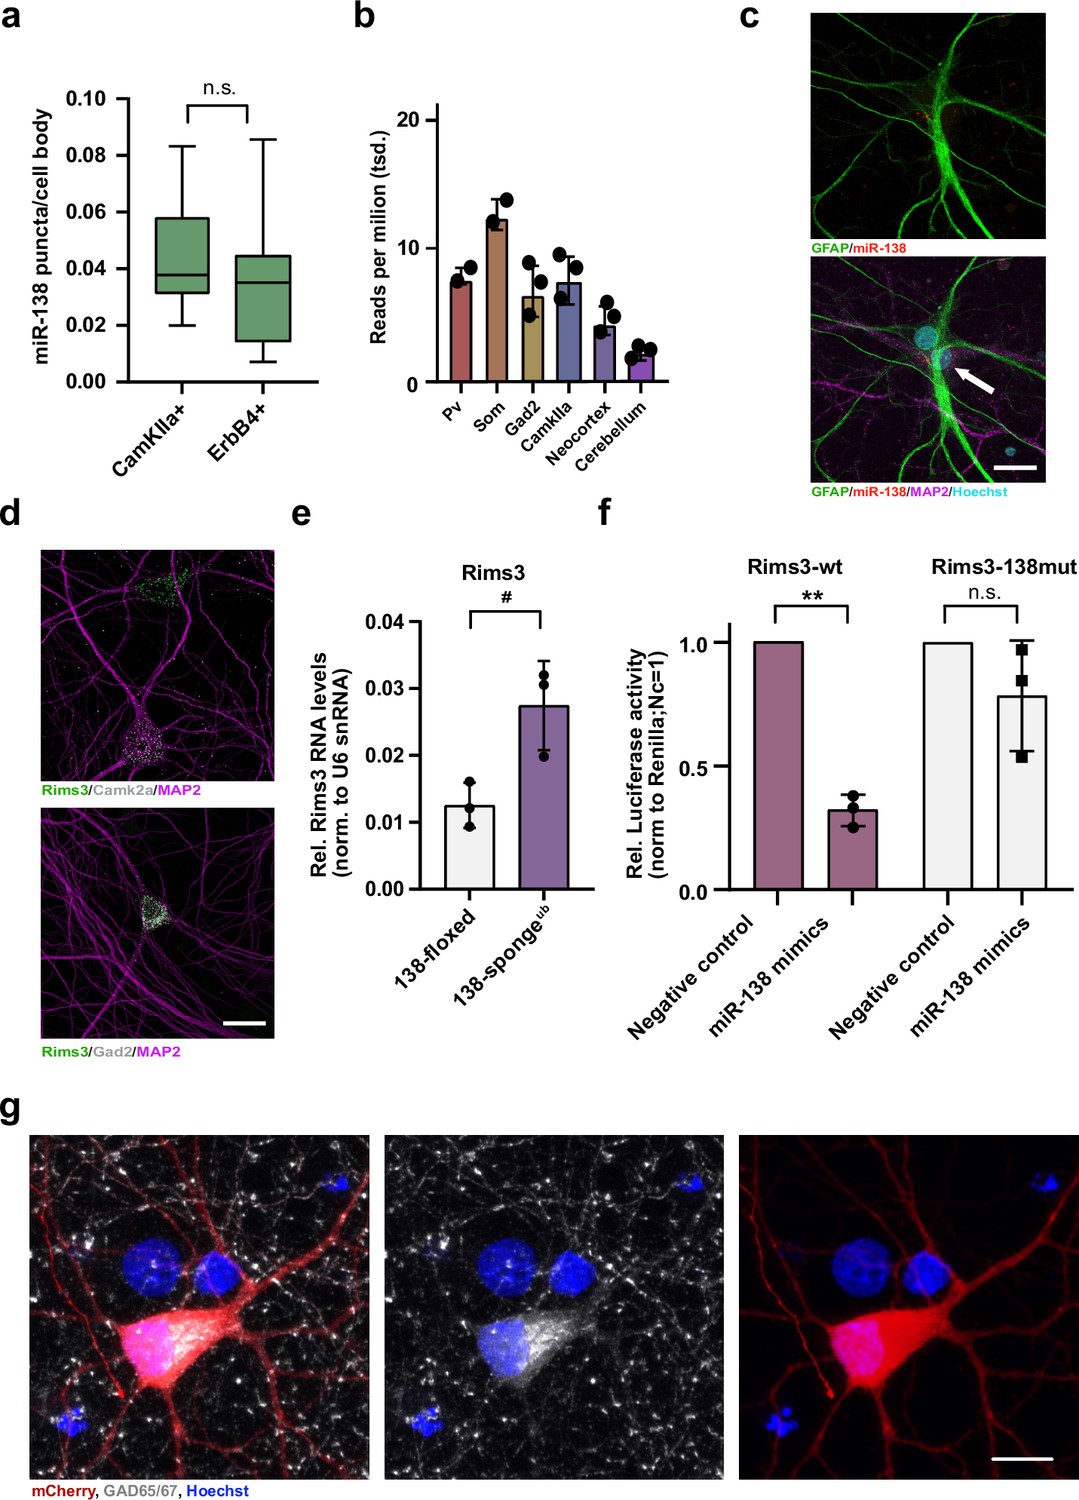
Validation of miR-138 target genes in rat hippocampal interneurons.
(a) Quantification of miR138-5p smFISH in Camk2a- and Erbb4-positive neurons. Camk2a-positive n =10 cells; ErbB4-positive n=7 cells, p=0.48 (Student’s two-tailed heteroscedastic t-test). (b) Quantification of miR138-5p levels in mouse brain tissue based on small RNA-seq data from He et al., 2012. (c) Single-molecule FISH analysis of miR-138 (red) together with GFAP antibody stain (green) to label glia cells. Hoechst was used to counterstain nuclei. Arrow points to miR-138/MAP2 positive, GFAP-negative neuron adjacent to glial cell. Scale bar =20 µm. (d) Single-molecule FISH analysis of Rims3 mRNA (green) together with Camk2a (gray; left) or Gad2 (gray; right) mRNA to label glutamatergic and GABAergic neurons, respectively. Scale bar =20 µm. (e) qPCR analysis of Rims3 mRNA in total hippocampal RNA obtained from 138-floxed or 138-spongeub mice. U6 snRNA was used for normalization. n=3 mice; *p=0.04 (Student’s two-tailed heteroscedastic t-test). (f) Relative luciferase activity in rat cortical neurons (DIV9-12) transfected with Rims3 3′UTR constructs with (138mut) or without (wt) a mutation in the miR-138 binding site, together with miR-138 or negative control mimics. Negative control mimic =1. n=3 independent transfections, *p=0.002, n.s. p=0.23 (Student’s two-tailed heteroscedastic t-test). (g) Representative picture of primary rat hippocampal neurons infected with Dlx5/6-mCherry-138 sponge (red) and stained for GAD65/67 (gray) and Hoechst (blue). Scale bar =10 μm. smFISH, single-molecule fluorescence in situ hybridization.
-
Figure 3—figure supplement 1—source data 1
This file contains the raw data on which the graphs in Figure 3—figure supplement 1 are based.
- https://cdn.elifesciences.org/articles/74056/elife-74056-fig3-figsupp1-data1-v2.xlsx
Figure 4 with 1 supplement
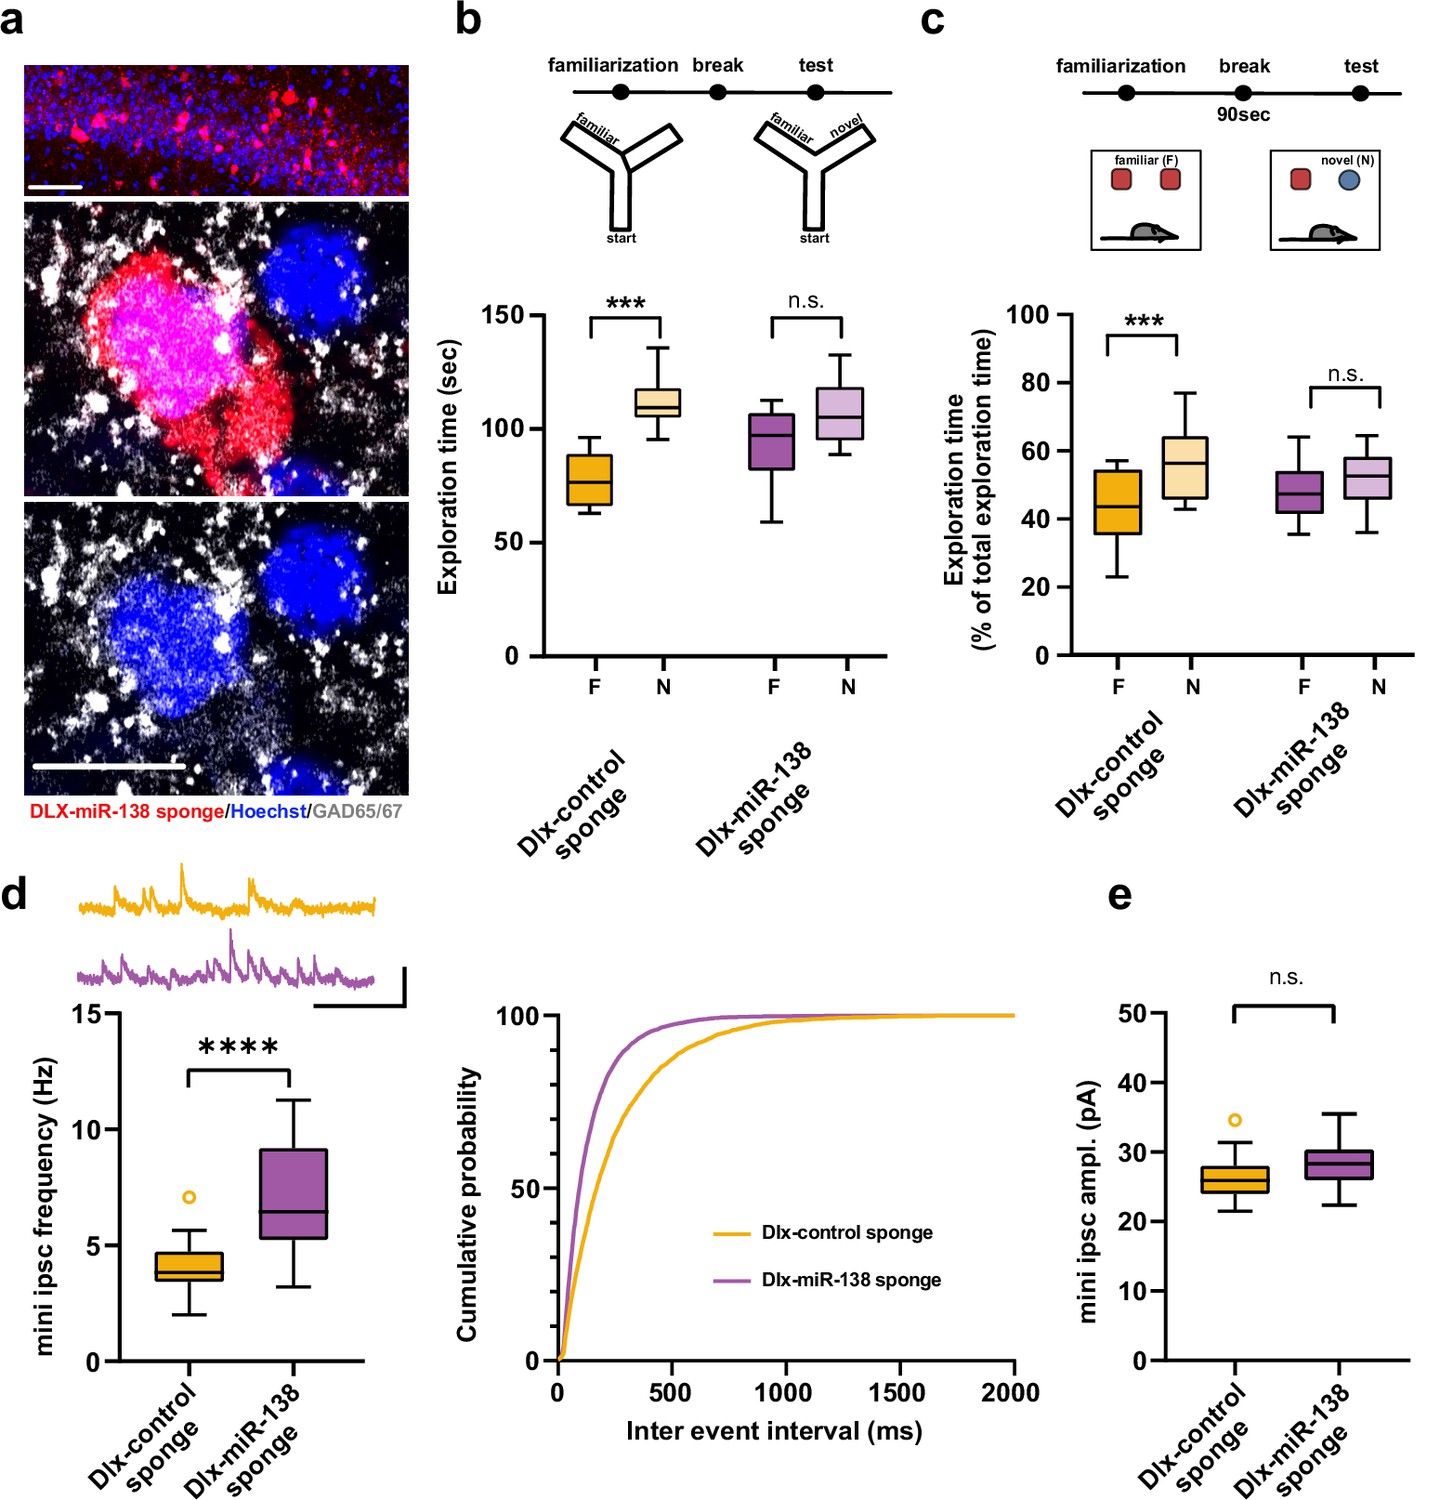
Impaired short-term memory and inhibitory synaptic transmission upon miR-138 inhibition in hippocampal interneurons.
(a) Representative pictures of hippocampal interneurons in vivo infected with rAAV-Dlx-138-sponge. Upper panel: infected interneurons in hippocampal area CA1. Scale bar =50 μm. Middle and lower panels: neurons in hippocampal area CA1 at higher magnification. Left neuron: infected with rAAV-Dlx-138-sponge, expressing GAD65/67; right neuron: not infected, no GAD65/67 expression. Scale bar =10 μm. red: mCherry; gray: GAD65/67, blue: Hoechst nuclei. (b) Upper panel: schematic representation of the Y-maze novelty preference task; lower panel: exploration time spent in familiar (F) and novel (N) arm; Dlx-control sponge n=8 mice; Dlx-miR-138 sponge n=9 mice; ****p=0.00005; n.s.=0.079 (Student’s two-tailed heteroscedastic t-test). (c) Upper panel: schematic representation of the novel object recognition task; lower panel: exploration time presented as percentage of total time spent with either novel or familiar object; Dlx-control sponge n=9 mice; Dlx-miR-138 sponge n=10 mice; *p=0.03; n.s.=0.33 (Student’s two-tailed heteroscedastic t-test). (d) mIPSC frequency in CA1 pyramidal neurons. Upper panel left: example traces, Dlx-control sponge in orange, Dlx-miR-138 sponge in purple, scale bar: 50 pA, 200 ms. Lower panel left: mIPSC frequency (Dlx-control sponge: range, from 2.0 to 7.1 Hz; median, 3.8 Hz; IQR, 1.3 Hz. Dlx-miR-138 sponge: range, from 3.2 to 11.3 Hz; median, 6.4 Hz; IQR, 4.0 Hz; ****p<0.0001, Student’s two-tailed heteroscedastic t-test). Right panel: Cumulative distribution mIPSC frequency (p<0.0001; Kolmogorov-Smirnov test). (e) mIPSC amplitude in CA1 pyramidal neurons (Dlx-control sponge: range, from 21.5 to 34.6 pA; median, 25.9 pA; IQR, 4.0 pA. Dlx-miR-138 sponge: range, from 22.3 to 35.5 pA; median, 28.3 pA; IQR, 4.4 pA; n.s. p=0.13 Student’s two-tailed heteroscedastic t-test). Dlx-control sponge n=19 cells/2 mice; Dlx-miR-138 sponge n=19 cells/2 mice. IQR, interquartile range; mIPSC, miniature inhibitory postsynaptic current.
-
Figure 4—source data 1
This file contains the raw data on which the graphs in Figure 4 are based.
- https://cdn.elifesciences.org/articles/74056/elife-74056-fig4-data1-v2.xlsx
Figure 4—figure supplement 1
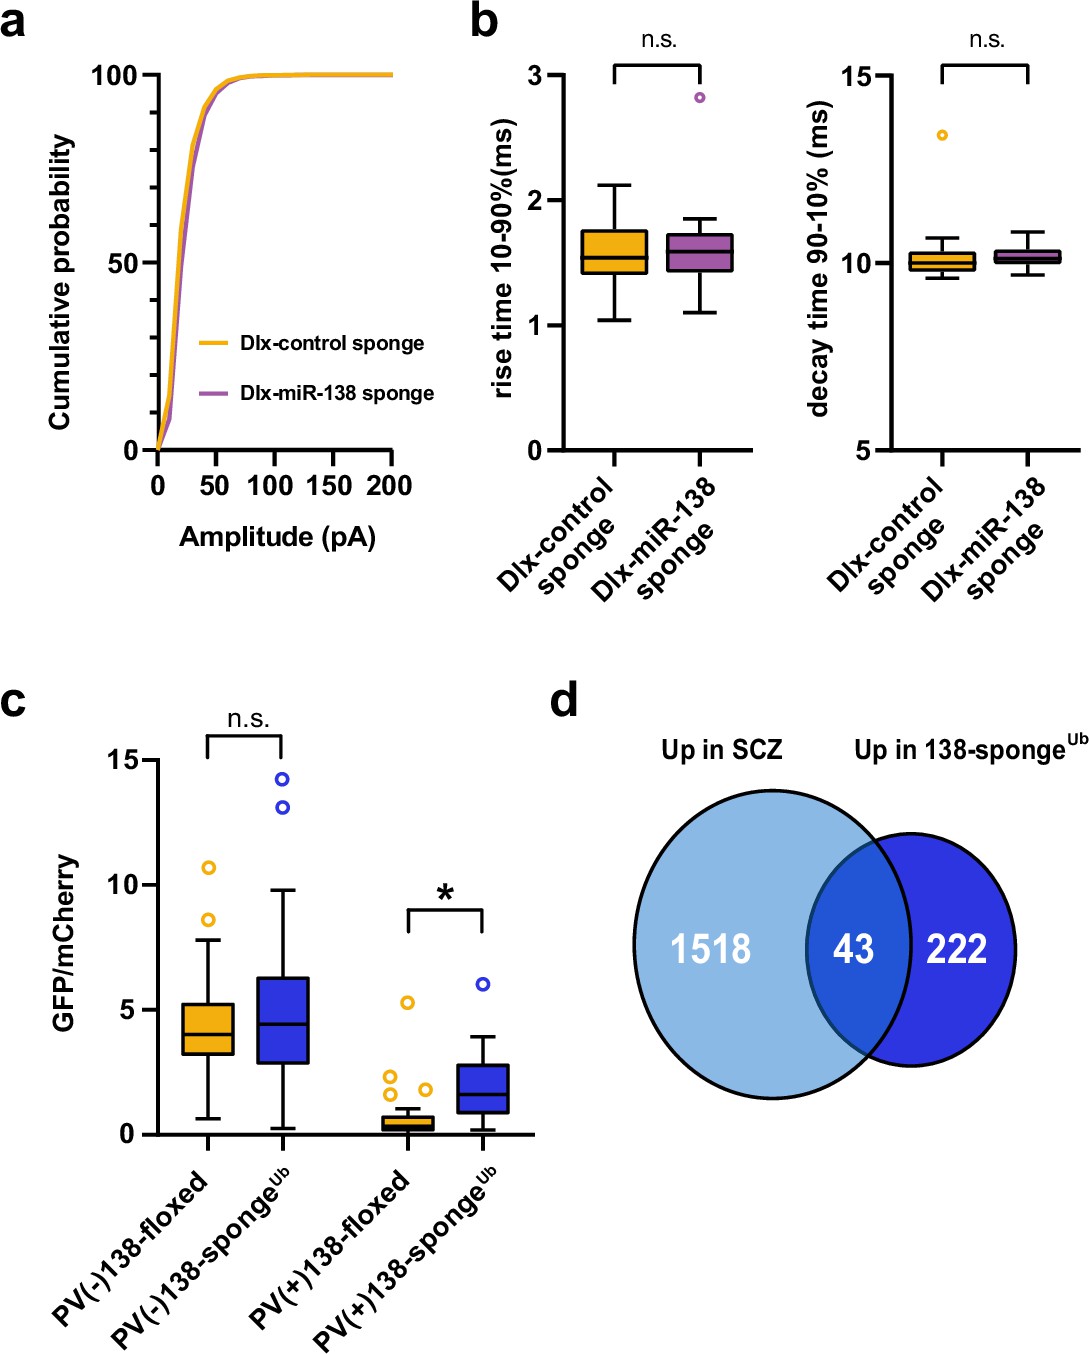
Inhibitory synaptic transmission upon miR-138 inhibition in hippocampal interneurons and validation of miR-138 sponge activity in PV-expressing hippocampal interneurons.
(a) Cumulative distribution of mIPSC amplitude (p<0.0001; Kolmogorov-Smirnov test). (b) mIPSC rise (10%–90%) and decay (90%–10%) time. Left panel: mIPSC rise (10%–90%) time (Dlx control sponge: range, from 1.0 to 2.1 ms; median, 1.5 ms; IQR, 0.4 ms. Dlx miR-138 sponge: range, from 1.1 to 2.8 ms; median, 1.6 ms; IQR, 0.3 ms; n.s. p=0.76 Mann-Whitney test). Right panel: mIPSC decay (90%–10%) time (Dlx control sponge: range, from 9.6 to 13.4 ms; median, 10.0 ms; IQR, 0.6 ms. Dlx miR-138 sponge: range, from 9.7 to 10.8 ms; median, 10.1 ms; IQR, 0.4 ms; n.s. p=0.3 Mann-Whitney test). Dlx control sponge n=19 cells/2 mice; Dlx miR-138 sponge n=19 cells/2 mice. (c) Bar graphs of GFP/mCherry ratios from PV+ or PV− CA1 hippocampal neurons in 138-floxed or 138-spongeUb mice infected with a 138-pbds sensor construct; 138-floxed/PV+: n=32 (two mice); 138-floxed/PV−: n=40 (two mice); 138-sponge/PV+: n=32 (three mice); 138-sponge/PV−: n=42 (three mice); n.s. p=0.113; *p=3.6×10⁻⁶ (Kolmogorov-Smirnov-Test). (d) Venn diagram describing the overlap between transcripts upregulated in SCZ patients (Gandal et al., 2018) and miR-138 sponge mice (Figure 2a). Fold enrichment =1.43; p=0.00859 (Fisher test). IQR, interquartile range; mIPSC, miniature inhibitory postsynaptic current; SCZ, schizophrenia.
-
Figure 4—figure supplement 1—source data 1
This file contains the raw data on which the graphs in Figure 4—figure supplement 1 are based.
- https://cdn.elifesciences.org/articles/74056/elife-74056-fig4-figsupp1-data1-v2.xlsx
Figure 5 with 1 supplement
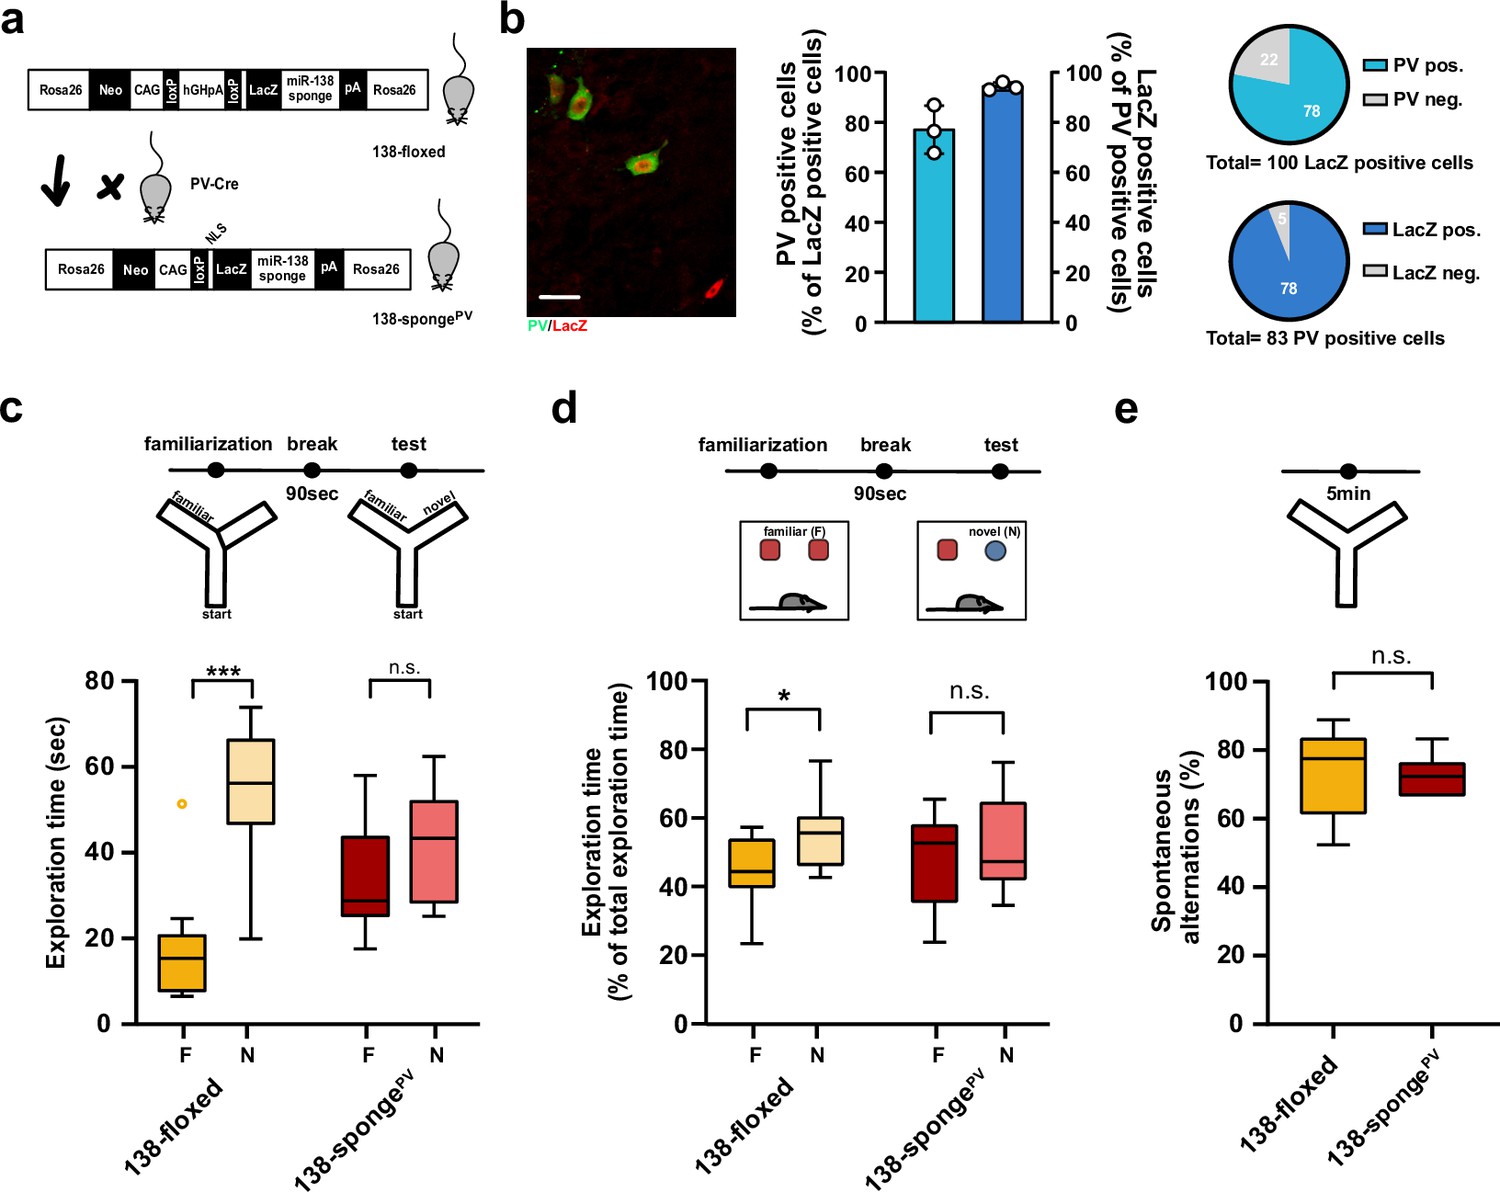
Impaired short-term memory in PV-expressing interneuron specific miR-138 sponge mice.
(a) Schematic overview of the strategy for generating miR-138 spongePV mice. (b) Beta-gal expression is largely restricted to PV expressing interneuron. Left panel: representative picture from a CA1 region of a 138-spongePV hippocampal slice co-stained for the lacZ product beta-galactosidase (red) and PV (green). Scale bar =20 μm. Right panel: quantification of PV+/lacZ+ cells in 138-spongePV mice. n=3 mice. (c) Behavioral characterization of 138-spongePV mouse line, upper: schematic representation of the Y-maze novelty preference task; lower: exploration time spent in familiar (F) and novel (N) arm; 138-floxed n=10 mice; 138-spongePV n=10 mice; ***p=0.0002; n.s. p=0.19 (Mann-Whitney test). (d) Upper: schematic representation of the novel object recognition task; Lower: exploration time presented as percentage of total time spent with either novel or familiar object; 138-floxed n=10 mice; miR-138 sponge n=10 mice; *p=0.035, n.s. p=0.57 (Student’s two-tailed heteroscedastic t-test). (e) Percentage of spontaneous alternations in the Y-Maze. 138-floxed n=10; 138-spongePV n=10; n.s. p=0.90 (Student’s two-tailed heteroscedastic t-test). PV, parvalbumin.
-
Figure 5—source data 1
This file contains the raw data on which the graphs in Figure 5 are based.
- https://cdn.elifesciences.org/articles/74056/elife-74056-fig5-data1-v2.xlsx
Figure 5—figure supplement 1
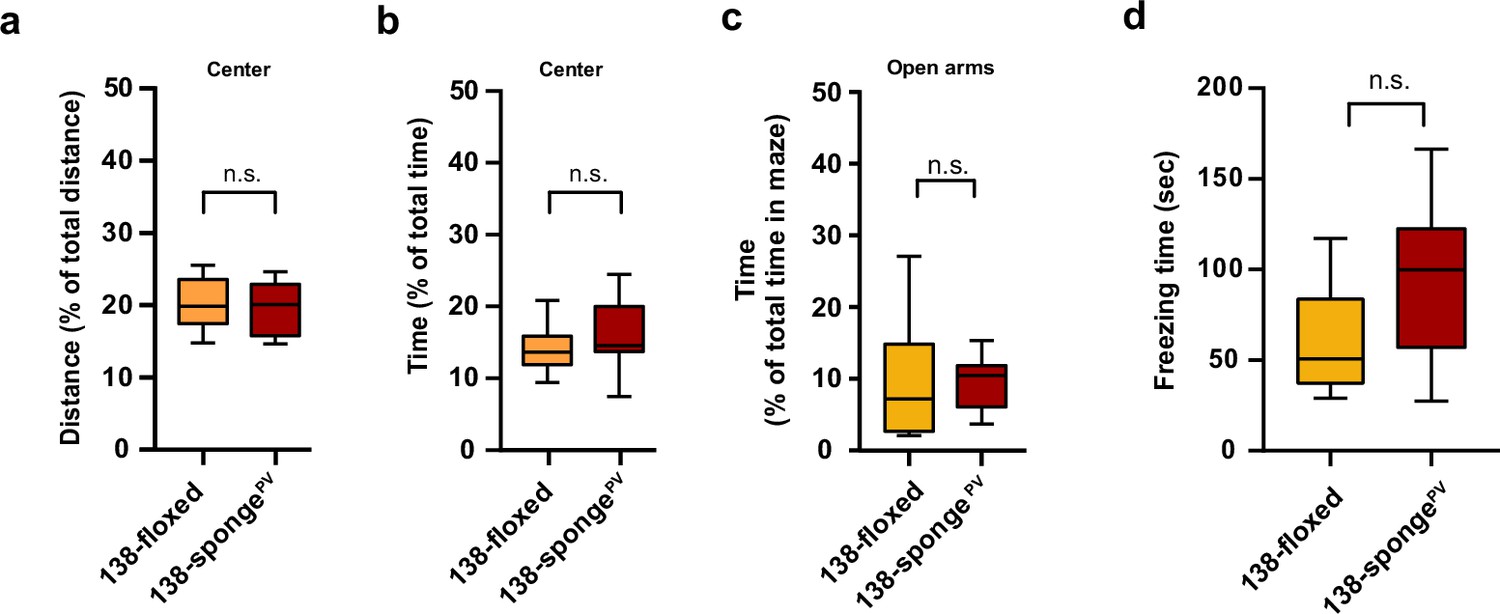
Behavioural characterization of PV-expressing interneuron specific miR-138 sponge mice.
(a, b) Percentage of total distance travelled (a)/time spent (b) in the center of an open field arena during 30 min exploration by mice of the indicated genotypes; 138-floxed n=10 mice; 138-spongePV n=10 mice; (a) p=0.74 (b) p=0.28 (Student’s two-tailed heteroscedastic t-test). (c) Percentage of total time spent in the open arms of an elevated plus maze (EPM) during 5 min exploration by mice of the indicated genotypes; 138-floxed n=10 mice; 138-spongePV n=10 mice; p=0.53 (Mann-Whitney test). (d) Time (s) mice spent freezing 24 hr after the foot shock was administrated; 138-floxed n=9 mice; 138-spongePV n=9 mice; p=0.075 (Student’s two-tailed heteroscedastic t-test).
-
Figure 5—figure supplement 1—source data 1
This file contains the raw data on which the graphs in Figure 5—figure supplement 1 are based.
- https://cdn.elifesciences.org/articles/74056/elife-74056-fig5-figsupp1-data1-v2.xlsx
Figure 6 with 1 supplement
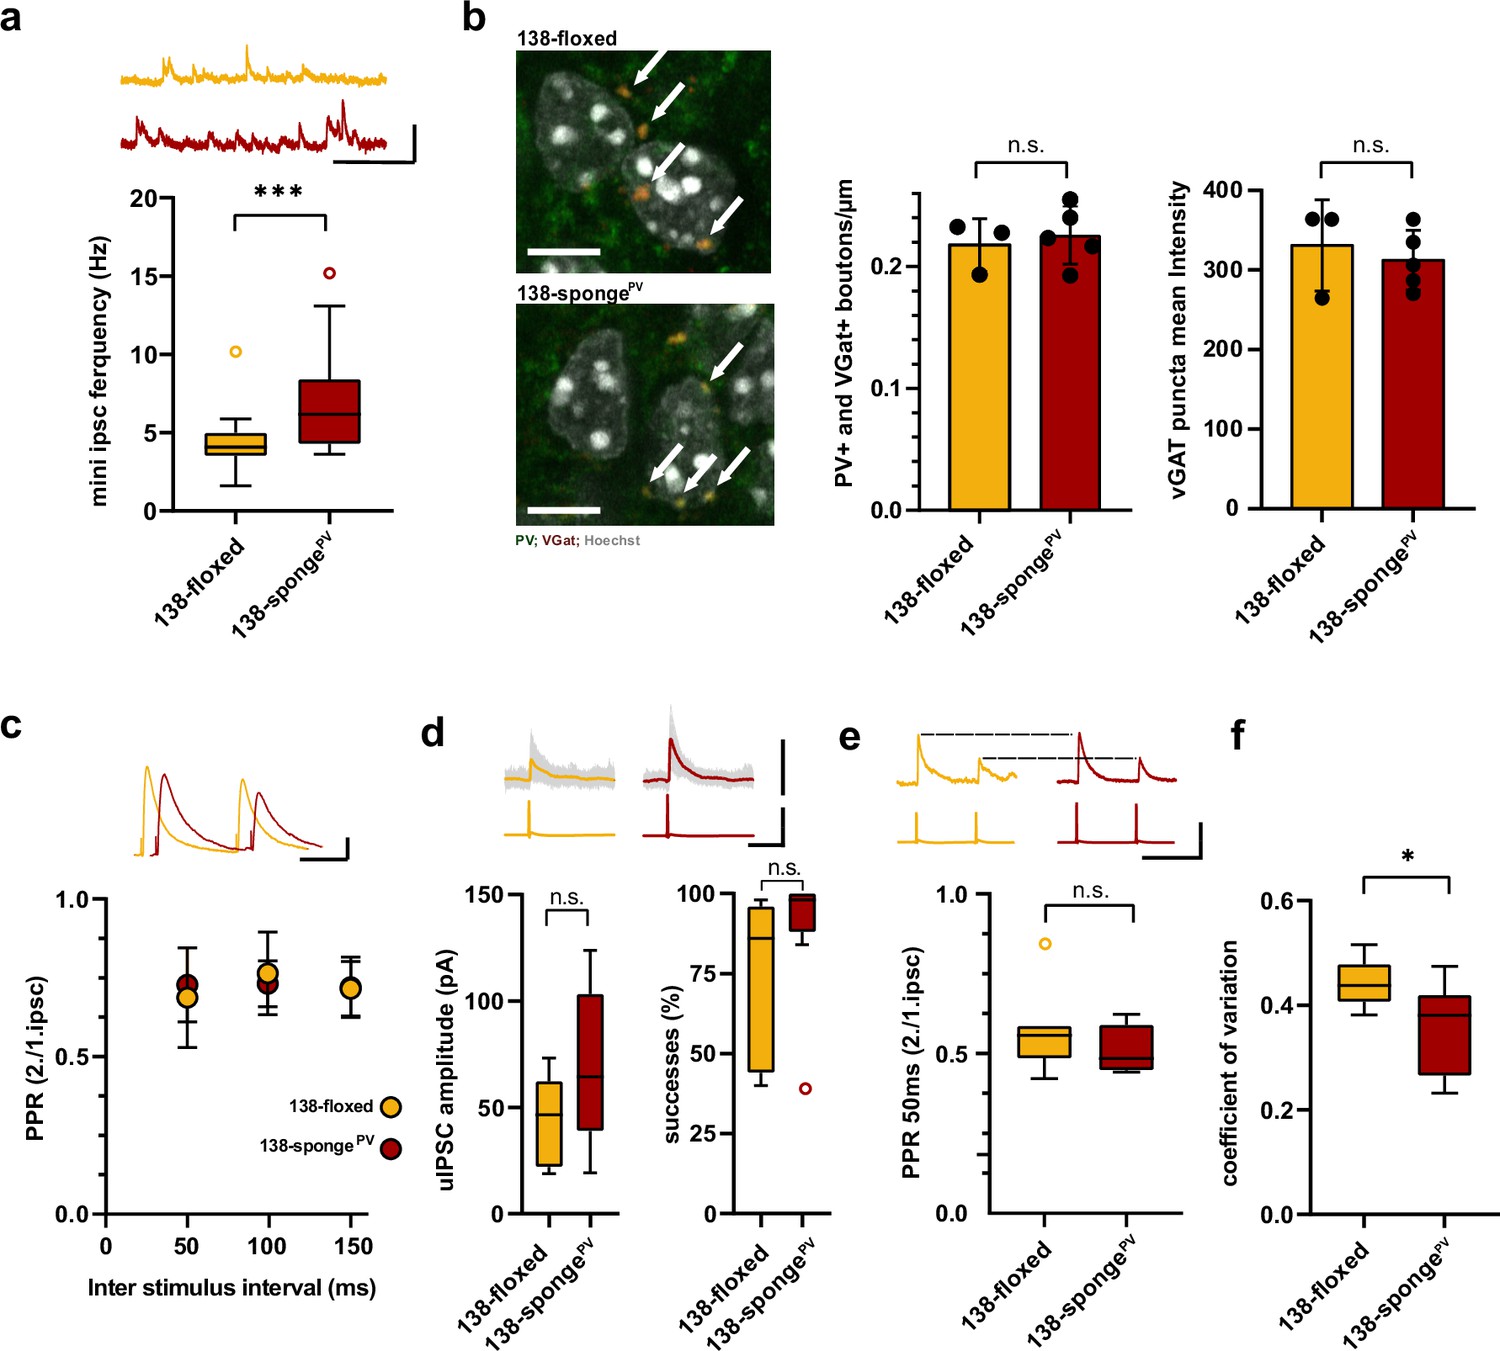
Enhanced inhibitory synaptic transmission onto hippcampal pyramidal neurons in PV-expressing interneuron specific miR-138 sponge mice.
(a) mIPSC frequency in CA1 pyramidal neurons. Upper panel: example traces, 138-floxed in orange, 138-songePV in red, scale bar: 50 pA, 200 ms. Lower panel: mIPSC frequency (138-floxed: range, from 1.6 to 10.2 Hz; median, 4.1 Hz; IQR, 1.5 Hz. 138-spongePV: range, from 3.6 to 15.2 Hz; median, 6.2 Hz; IQR, 4.2 Hz; ***p=0.0002, Mann-Whitney test). 138-floxed n=22 cells/5 mice; 138-spongePV n=23 cells/5 mice. (b) PV+, VGAT+ bouton density. Left panel: representative pictures (arrows point the PV+; VGAT+ boutons). Middle panel: number of boutons per CA1 pyramidal neuron cell perimeter based on Hoechst counterstain. Right panel: VGAT puncta mean intensity; 138-floxed: n=73 cells/3 mice; 138-spongePV: n=95 cells/5 mice; data represents the average per mouse±s.d; n.s., p=0.65 (bouton density), n.s., p=0.59 (mean intensity) (Student’s two-tailed heteroscedastic t-test); (c) Paired pulse ratio (PPR) of stimulated IPSCs in CA1 pyramidal neurons. Upper panel: example traces of PPR (inter stimulus interval of 100 ms) for 138-floxed (orange) and 138-spongeub (red); scale bar: 100 pA, 50 ms. Lower panel: PPRs for different interstimulus intervals ranging from 50 to 150 ms (138-floxed vs. 138-spongePV [mean ±s.d.]: 50 ms, 0.7 ±0.2 vs. 0.7±0.1 [n=13]; 100 ms: 0.8±0.1 vs. 0.7±0.1 [n=13]; 150 ms: 0.7±0.1 [n=12] vs. 0.7±0.1. n.s. p=0.45, p=0.69, and p=0.89 for 50, 100, and 150 ms, respectively. Mann-Whitney test). (d) Unitary connections between presynaptic fast-spiking interneurons and postsynaptic CA1 pyramidal cells. Upper panel: example traces, 138-floxed: average of 50 sweeps in orange, 26 single sweeps in gray, 138-songePV: average of 50 sweeps in red, 26 single sweeps in gray; scale bar: 100 pA, 100 mV, 25 ms. Lower panel left: uIPSC amplitude (138-floxed: range, from 18.9 to 73.2 pA; median, 46.6 pA; IQR, 40.2 pA. 138-spongePV: range, from 19.3 to 123.8 pA; median, 64.5 pA; IQR, 64.4 pA; n.s. p=0.11 Student’s two-tailed heteroscedastic t-test). Lower panel right: Success rate (138-floxed: range, from 40% to 98%; median, 86%; IQR, 54%. 138-spongePV: range, from 38% to 100%; median, 98%; IQR, 12%; n.s. p=0.14 Mann-Whitney test). 138-floxed n=7 pairs/3 mice; 138-spongePV n=9 pairs/5 mice. (e) PPR of unitary connections. Upper panel: example traces, 138-floxed in orange, 138-songePV in red, uIPSCs are normalized to the first uIPSC, scale bar: 100 mV, 50 ms. Lower panel: PPR (2nd/1st uIPSC) (138-floxed: range, from 0.42 to 0.85; median, 0.56; IQR, 0.10. 138-spongePV: range, from 0.44 to 0.62; median, 0.49; IQR, 0.14; n.s. p=0.34 Student’s two-tailed heteroscedastic t-test). 138-floxed n=7 pairs/3 mice; 138-spongePV n=9 pairs/5 mice. (f) Coefficient of variation (138-floxed: range, from 0.38 to 0.52; median, 0.44; IQR, 0.07. 138-spongePV: range, from 0.23 to 0.47; median, 0.38; IQR, 0.15; *p=0.028, Student’s two-tailed heteroscedastic t-test). 138-floxed n=7 pairs/3 mice; 138-spongePV n=9 pairs/5 mice. IQR, interquartile range; mIPSC, miniature inhibitory postsynaptic current; uIPSC, unitary inhibitory postsynaptic current.
-
Figure 6—source data 1
This file contains the raw data on which the graphs in Figure 6 are based.
- https://cdn.elifesciences.org/articles/74056/elife-74056-fig6-data1-v2.xlsx
Figure 6—figure supplement 1
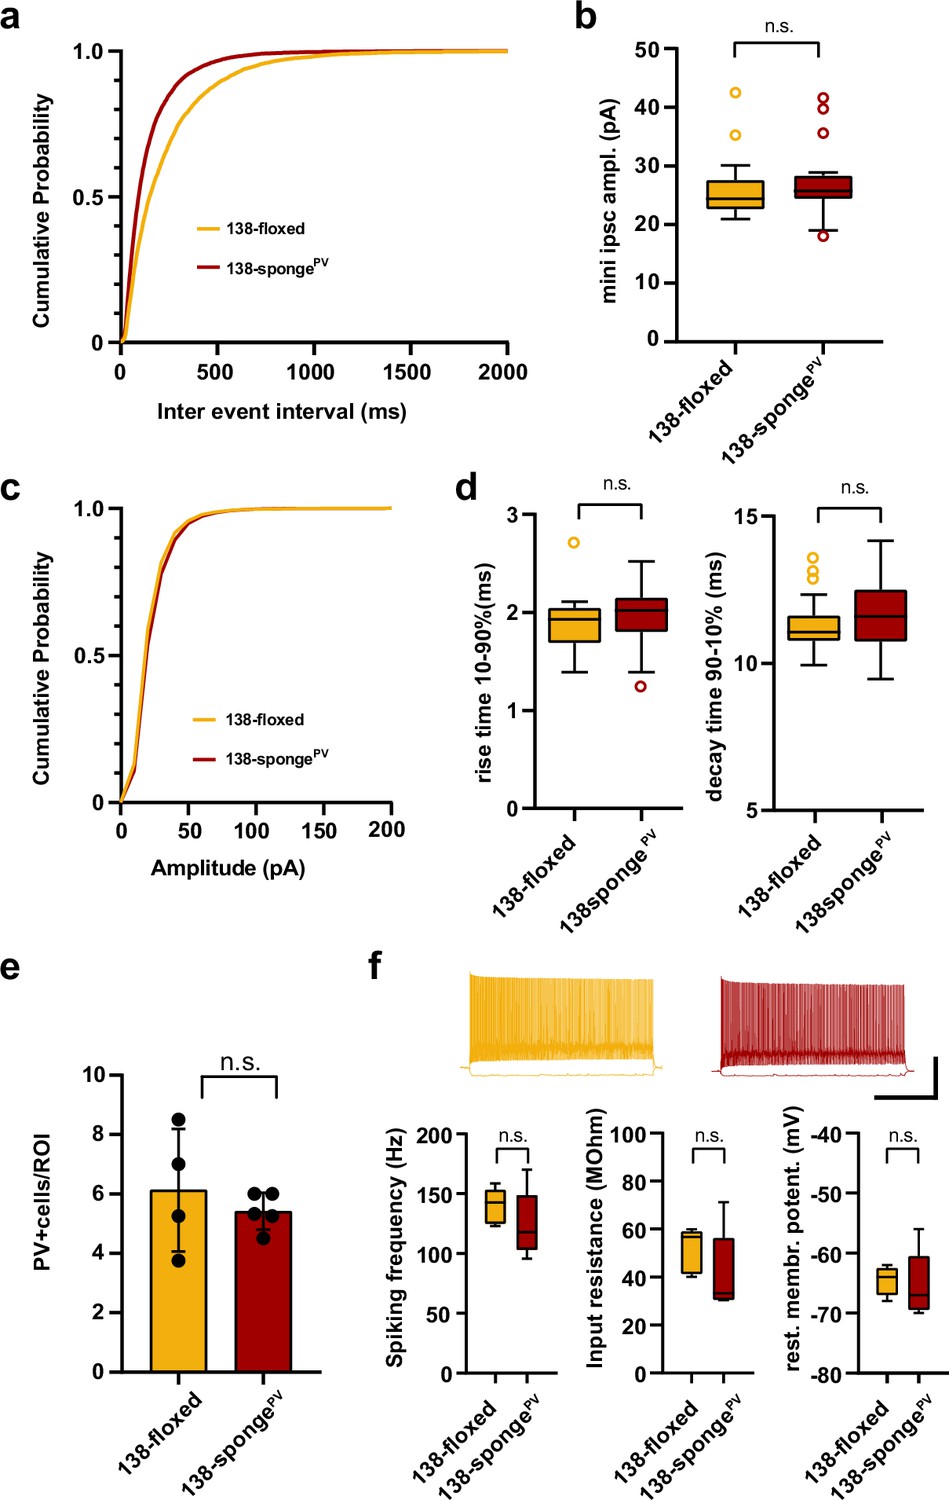
Electrophysiological characterization of hippocampal neurons in PV-expressing interneuron specific miR-138 sponge mice.
(a–d) mIPSC in CA1 pyramidal neurons. (a) Cumulative distribution of mIPSCs frequency (p <0.0001; Kolmogorov-Smirnov [KS] test). (b) mIPSC amplitude (138-floxed: range, from 20.9 to 42.5 pA; median, 24.4 pA; IQR, 5.0 pA. 138-spongePV: range, from 18.0 to 41.6 pA; median, 25.7 pA; IQR, 4.0 pA; n.s. P = 0.22 Mann-Whitney test). (c) Cumulative distribution of mIPSCs amplitude (p<0.0001 KS test). 138-floxed n=22 cells/5 mice; 138-spongeub n=23 cells/5 mice. (d) mIPSC rise (10%–90%) and decay (90%–10%) time. Left panel: mIPSC rise (10%–90%) time (138-floxed: range, from 1.4 to 2.7 ms; median, 1.9 ms; IQR, 0.4 ms. 138-spongePV: range, from 1.3 to 2.5 ms; median, 2.0 ms; IQR, 0.4 ms; n.s. p=0.28 Mann-Whitney test). Right panel: mIPSC decay (90%–10%) time (138-floxed: range, from 9.9 to 13.6 ms; median, 11.1 ms; IQR, 0.9 ms. 138-spongePV: range, from 9.5 to 14.2 ms; median, 11.6 ms; IQR, 1.8 ms; n.s. p=0.20 Mann-Whitney test). 138-floxed n=22 cells/5 mice; 138-spongeub n=23 cells/5 mice. (e) Density of PV+ interneurons in CA1 hippocampus of mice with the indicated genotype. Values are expressed relative to a defined region of interest (ROI). 138-floxed: n=16 ROIs/4 mice; 138-spongePV: n=18 ROIs/5 mice; data represents the average per mouse±s.d.; n.s. p=0.8049 (Mann-Whitney test). (f) Properties of fast-spiking interneurons. Upper panel: example traces, 138-floxed in orange, 138-songePV in red, scale bar: 50 mV, 500 ms. Lower panel left: spiking frequency (138-floxed: range, from 123 to 159 Hz; median, 143 Hz; IQR, 29 Hz. 138-spongePV: range, from 96 to 170 Hz; median, 118 Hz; IQR, 46 Hz; n.s. p=0.31 Student’s two-tailed heteroscedastic t-test). Lower panel middle: input resistance (138-floxed: range, from 40 to 60 MΩ; median, 57 MΩ; IQR, 18 MΩ. 138-spongePV: range, from 30 to 71 MΩ; median, 33 MΩ; IQR, 26 MΩ; n.s. p=0.22 Mann-Whitney test). Lower panel right: resting membrane potential (138-floxed: range, from –68 to –62 mV; median, –64 mV; IQR, 4.5 mV. 138-spongePV: range, from –70 to –56 mV; median, –67 mV; IQR, 9 mV; n.s. p=0.78 Student’s two-tailed heteroscedastic t-test). 138-floxed n=5 cells/3 mice; 138-spongeub n=5 cells/5 mice. IQR, interquartile range; mIPSC, miniature inhibitory postsynaptic current.
-
Figure 6—figure supplement 1—source data 1
This file contains the raw data on which the graphs in Figure 6—figure supplement 1 are based.
- https://cdn.elifesciences.org/articles/74056/elife-74056-fig6-figsupp1-data1-v2.xlsx
Tables
Key resources table
| Reagent type (species) or resource | Designation | Source or reference | Identifiers | Additional information |
|---|---|---|---|---|
| Strain, strain background (Mus musculus) | miR-138-flox | Taconic Artemis GmbH (Cologne, Germany) | C57BL/6NTac-Gt(ROSA)26So tm2459(LacZ, antimir_138) Arte | |
| Strain, strain background (M. musculus) | CMV-Cre | Jackson Laboratories | B6.C-Tg(CMV-Cre)1Cgn (CMV-CRE) | |
| Strain, strain background (M. musculus) | PV-Cre | Jackson Laboratories | B6;129P2-Pvalbtm1(cre)Arbr/J (PV-CRE) | |
| Recombinant DNA reagent | pAAV-6P-SEWB (modified) | Christensen et al., 2010 | Used for cloning of miR-138 sponge plasmids | |
| Recombinant DNA reagent | pAAV-mDlx-GFP-Fishell-1 | Addgene, 83900 | Used for cloning of mDlx-miR-138 sponge plasmids | |
| Recombinant DNA reagent | pGL3-promoter vector | Promega, Mannheim | Used for cloning of miR-138 perfect binding site reporter | |
| Recombinant DNA reagent | C1-mCherry | Addgene, 632524 | Used for cloning of miRNA sensor plasmids | |
| Recombinant DNA reagent | AAV-hSyn-EGFP | Addgene, 114213 | Used for cloning of miRNA sensor plasmids | |
| Recombinant DNA reagent | pmirGLO dual-luciferase expression vector reporter | Promega, Madison, WI | Used for cloning of luciferase reporter constructs | |
| Sequence-based reagent | Mir-138 FISH probe (Fast Red) | Thermo Fisher Scientific | VM1-10093-VCP | Sequence not provided by commercial supplier |
| Sequence-based reagent | ErbB4 FISH probe (488) | Thermo Fisher Scientific | VC4-3146482-VC | Sequence not provided by commercial supplier |
| Sequence-based reagent | Rims3 FISH probe (488) | Thermo Fisher Scientific | VC4-3146880-VCP | Sequence not provided by commercial supplier |
| Sequence-based reagent | Camk2a FISH probe (488) | Thermo Fisher Scientific | VC6-11639-VCP | Sequence not provided by commercial supplier |
| Sequence-based reagent | Gad2 FISH probe (647) | Thermo Fisher Scientific | VC6-16451-VCP | Sequence not provided by commercial supplier |
| Antibody | aGAD65+67 (rabbit polyclonal) | Abcam | Ab11070 | 1:100 (in vitro); 1:1000 (ex vivo) |
| Antibody | aMAP2 (Mouse monoclonal) | Sigma-Aldrich | M9942 | 1:1000 |
| Antibody | aGFAP (rabbit polyclonal) | Dako | Z0334 | 1:1000 |
| Antibody | aParvalbumin (mouse monoclonal) | SWANT | 235 | 1:1000 |
| Antibody | aVGAT (rabbit polyclonal) | Synaptic systems | 131003 | 1:1000 |
| Antibody | amCherry (rabbit polyclonal) | Abcam | Ab167453 | 1:1000 |
| Antibody | aBeta galatosidase (chicken polyclonal) | Abcam | Ab9361 | 1:4000 |
| Antibody | aMouse Alexa Fluor 488 (Donkey polyclonal) | Invitrogen | A21202 | 1:500 |
| Antibody | aRabbit Alexa Fluor 546 (Goat polyclonal) | Invitrogen | A11010 | 1:500 |
| Antibody | aChicken Alexa Fluor 546 (Goat polyclonal) | Invitrogen | A11040 | 1:500 |
| Antibody | aMouse Alexa Fluor 647 (Donkey polyclonal) | Invitrogen | A31571 | 1:500 |
| Chemical compound, drug | Hoechst 33342 | Thermo Fisher Scientific | 62249 |
Additional files
Download links
A two-part list of links to download the article, or parts of the article, in various formats.
Downloads (link to download the article as PDF)
Open citations (links to open the citations from this article in various online reference manager services)
Cite this article (links to download the citations from this article in formats compatible with various reference manager tools)
MicroRNA-138 controls hippocampal interneuron function and short-term memory in mice
eLife 11:e74056.
https://doi.org/10.7554/eLife.74056


