Fast bacterial growth reduces antibiotic accumulation and efficacy
- Living Systems Institute, University of Exeter, United Kingdom
- Biosciences, University of Exeter, United Kingdom
- Department of Mathematics, University of Exeter, United Kingdom
- Centre for Superbug Solutions, Institute for Molecular Bioscience, The University of Queensland, Australia
- Department of Chemistry and Chemical Biology, Rutgers, the State University of New Jersey, United States
- EPSRC Hub for Quantitative Modelling in Healthcare, University of Exeter, United Kingdom
- Department of Bioinformatics and Mathematical Modelling, Institute of Biophysics and Biomedical Engineering, Bulgarian Academy of Sciences, Bulgaria
Figures
Figure 1 with 15 supplements
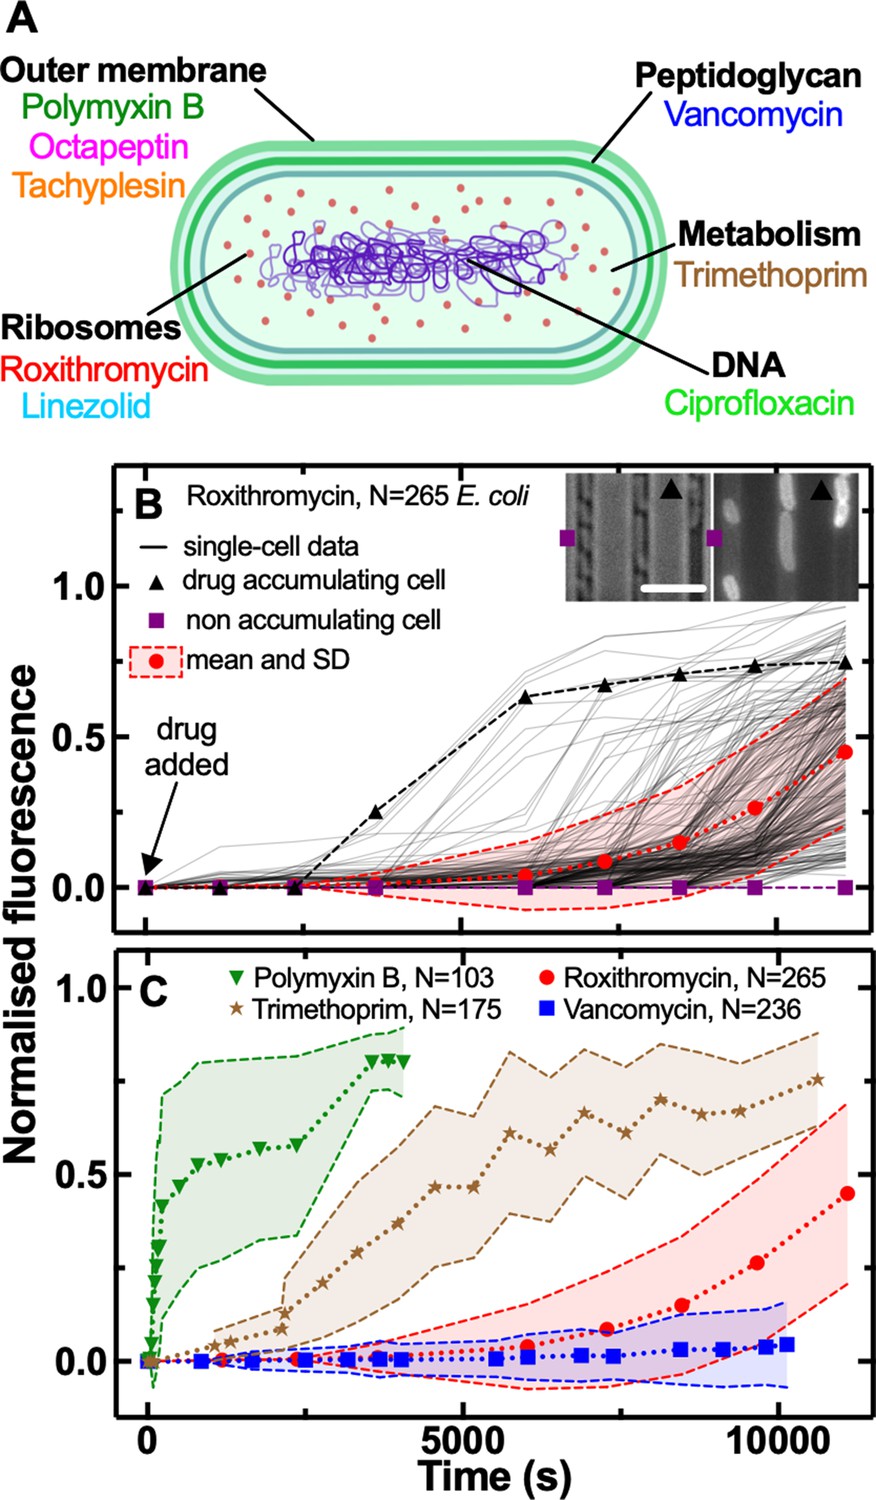
Phenotypic heterogeneity in the accumulation of the major classes of antibiotics.
(A) Illustration depicting the eight antibiotics employed in this study alongside their bacterial targets. (B) Accumulation of the fluorescent derivative of roxithromycin in 265 individual E. coli (continuous lines) after adding the probe at 46 µg mL–1 extracellular concentration in M9 minimal medium from t=0 onwards. Fluorescence values were background subtracted and normalised first by cell size and then to the maximum value in the dataset (see Methods). The circles and shaded areas represent the mean and SD of the values from 265 bacteria collated from biological triplicate. The squares represent the fluorescent values of a representative bacterium that does not accumulate the fluorescent derivative of roxithromycin, whereas the triangles represent the fluorescent values of a representative bacterium that accumulates the drug. Insets: representative brightfield and fluorescence images after 7000 s incubation in the fluorescent derivative of roxithromycin, the symbols indicate the two representative bacteria above. Scale bar: 5 µm. (C) Population average (symbols) and SD (shaded areas) of the accumulation of the fluorescent derivatives of polymyxin B (triangles), trimethoprim (stars), roxithromycin (circles), and vancomycin (squares) probes added at 46 µg mL–1 extracellular concentration in M9 minimal medium from t=0 onwards. Data are obtained by averaging at least one hundred single-cell values (i.e. N=103, 175, 265, and 236, respectively) collated from biological triplicate. Corresponding single-cell data along with data for the fluorescent derivatives of linezolid, tachyplesin, octapeptin, and ciprofloxacin probes are reported in Figure 1—figure supplement 2.
-
Figure 1—source data 1
Measurements of single-cell drug accumulation, size, elongation rate and doubling time in E. coli, S. aureus, P. aeruginosa and B. cenocepacia.
- https://cdn.elifesciences.org/articles/74062/elife-74062-fig1-data1-v1.zip
Figure 1—figure supplement 1

Measurement of single-cell elongation rates.
Average elongation rate during growth in lysogeny broth (LB) after injection of E. coli in the mother machine at t=0. The data are the mean and standard error of the mean calculated over measurements performed on 30 individual bacteria collated from biological triplicate.
Figure 1—figure supplement 2
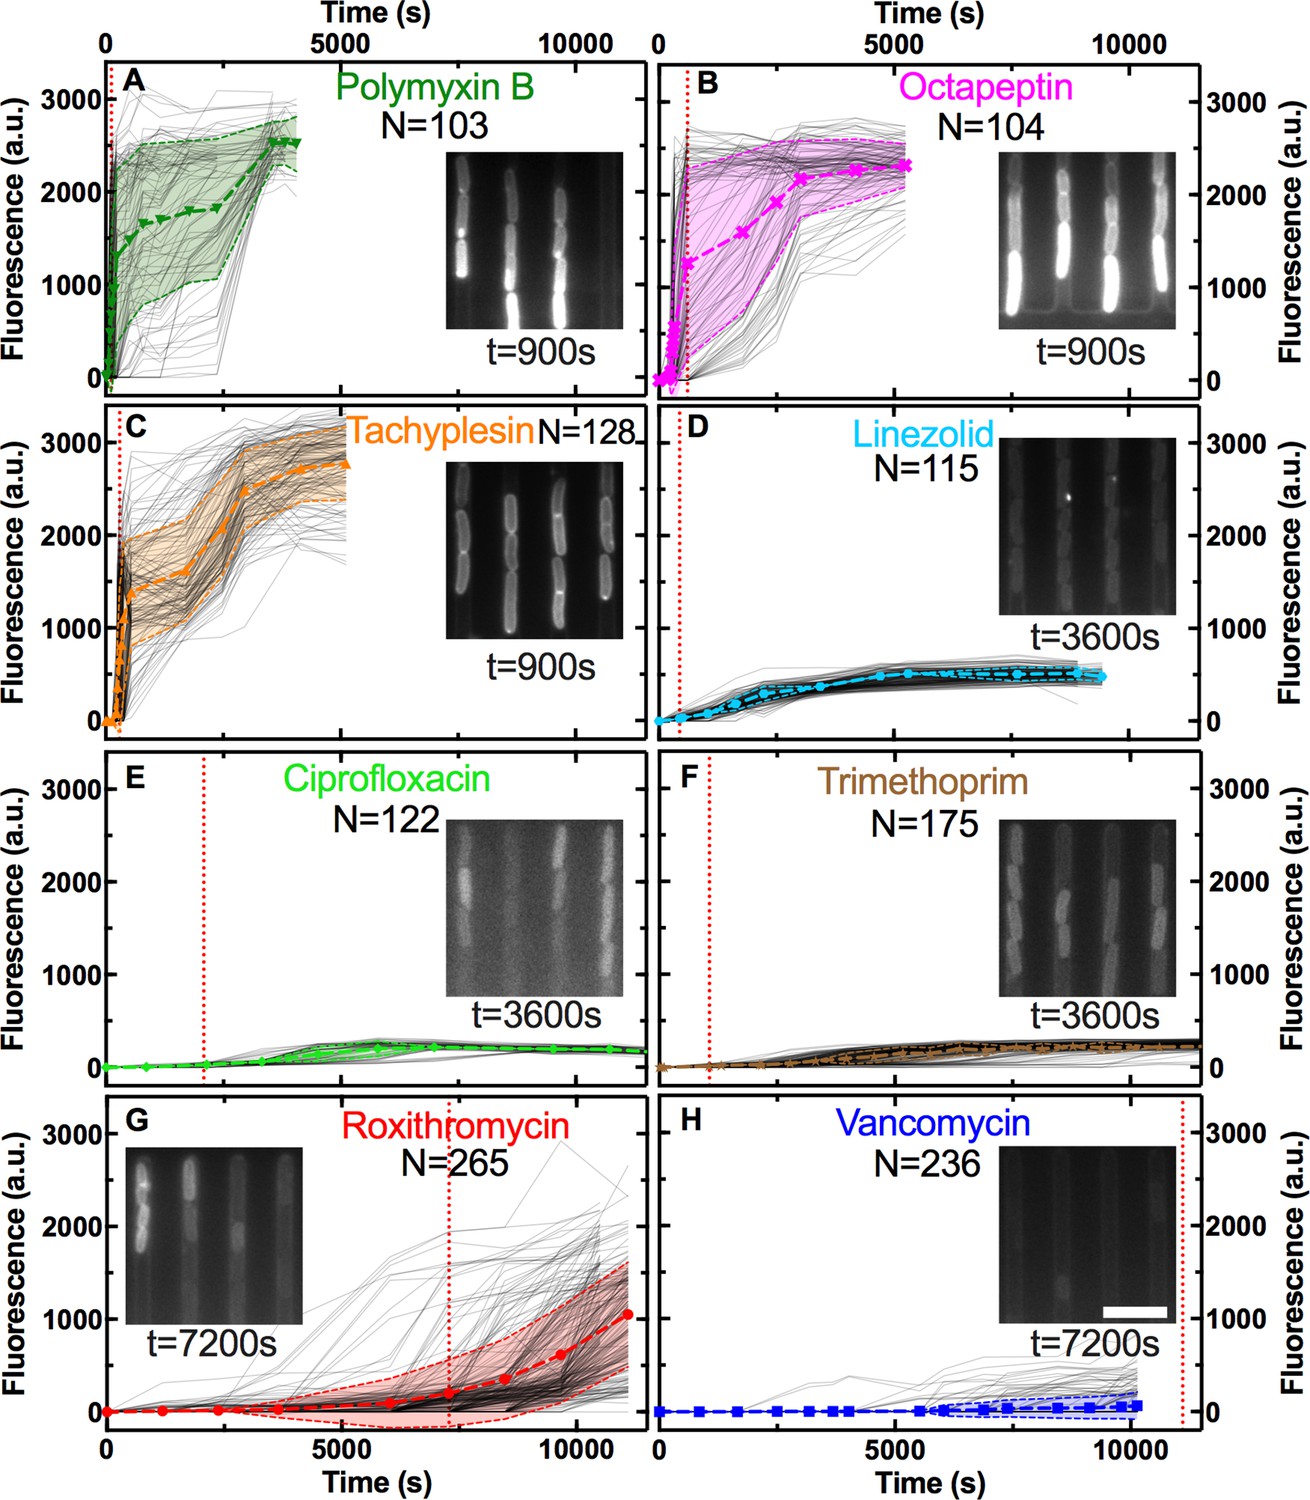
Measurement of single-cell drug accumulation.
Accumulation of the fluorescent derivatives of (A) polymyxin B, (B) octapeptin, (C) tachyplesin, (D) linezolid, (E) ciprofloxacin, (F) trimethoprim, (G) roxithromycin, and (H) vancomycin in 103, 104, 128, 115, 122, 175, 265, and 236 individual E. coli, respectively (continuous lines), after adding each probe at 46 µg mL–1 extracellular concentration in M9 minimal medium from t=0 onwards. Data were collated from biological triplicate. Fluorescence values were background subtracted and normalised by cell size (see Methods). The symbols and shaded areas represent the mean and SD of the corresponding single-cell values. Insets: representative fluorescence images showing the accumulation of each probe at the specified time point. Scale bar: 5 µm. The vertical dotted lines represent the time point at which the median of each dataset became larger than zero. The median remained zero throughout the entire experiments carried out with vancomycin-NBD, hence the dotted line has been arbitrarily set at 11,500 s in (H) for comparison purposes only.
Figure 1—figure supplement 3
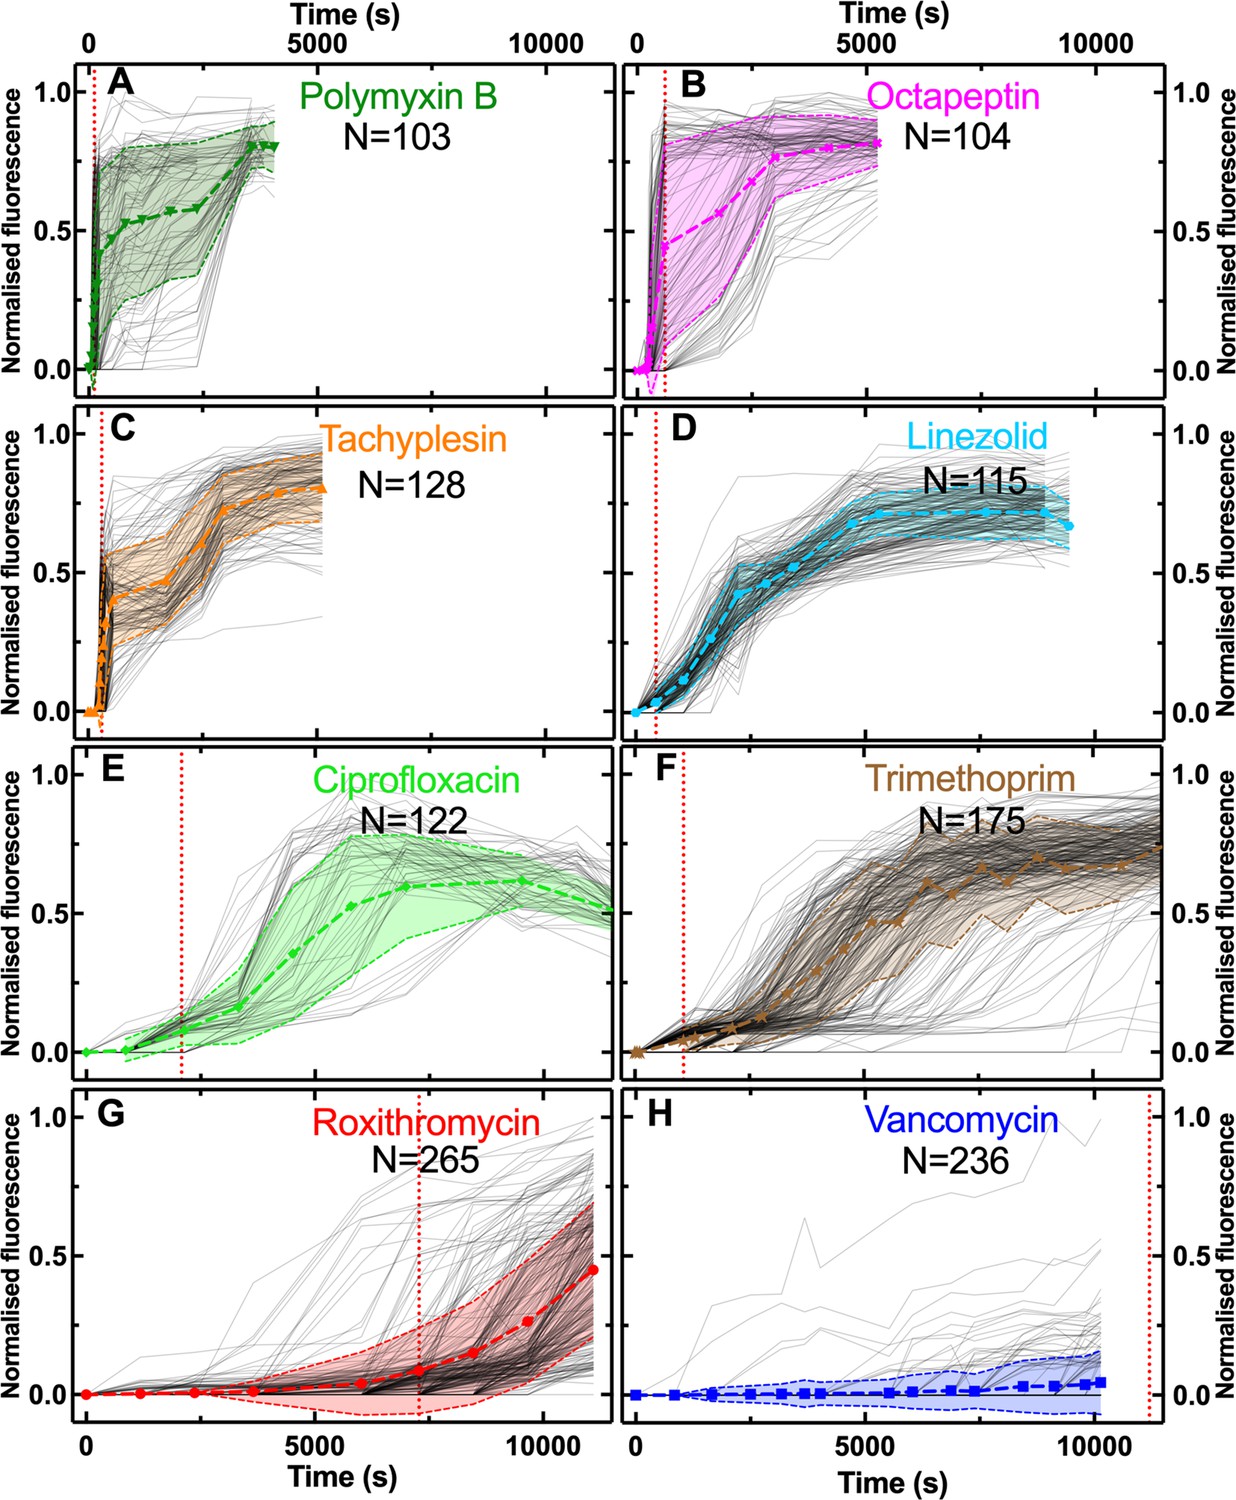
Measurement of normalised single-cell drug accumulation.
Normalised accumulation of the fluorescent derivatives of (A) polymyxin B, (B) octapeptin, (C) tachyplesin, (D) linezolid, (E) ciprofloxacin, (F) trimethoprim, (G) roxithromycin, and (H) vancomycin. These data are reproduced from Figure 1—figure supplement 2 after normalising all fluorescent values to the maximum fluorescence value in each dataset.
Figure 1—figure supplement 4

Heterogeneity in the accumulation of different antibiotics.
Population averages (symbols) and SDs (shaded areas) of the accumulation of the fluorescent derivatives of tachyplesin (triangles), octapeptin (crosses), linezolid (hexagons), and ciprofloxacin (diamonds) added at 46 µg mL–1 extracellular concentration in M9 minimal medium from t=0 onwards. Data were obtained by averaging N=128, 104, 115, and 122 single-cell values, respectively, collated from biological triplicate presented in Figure 1—figure supplement 2.
Figure 1—figure supplement 5
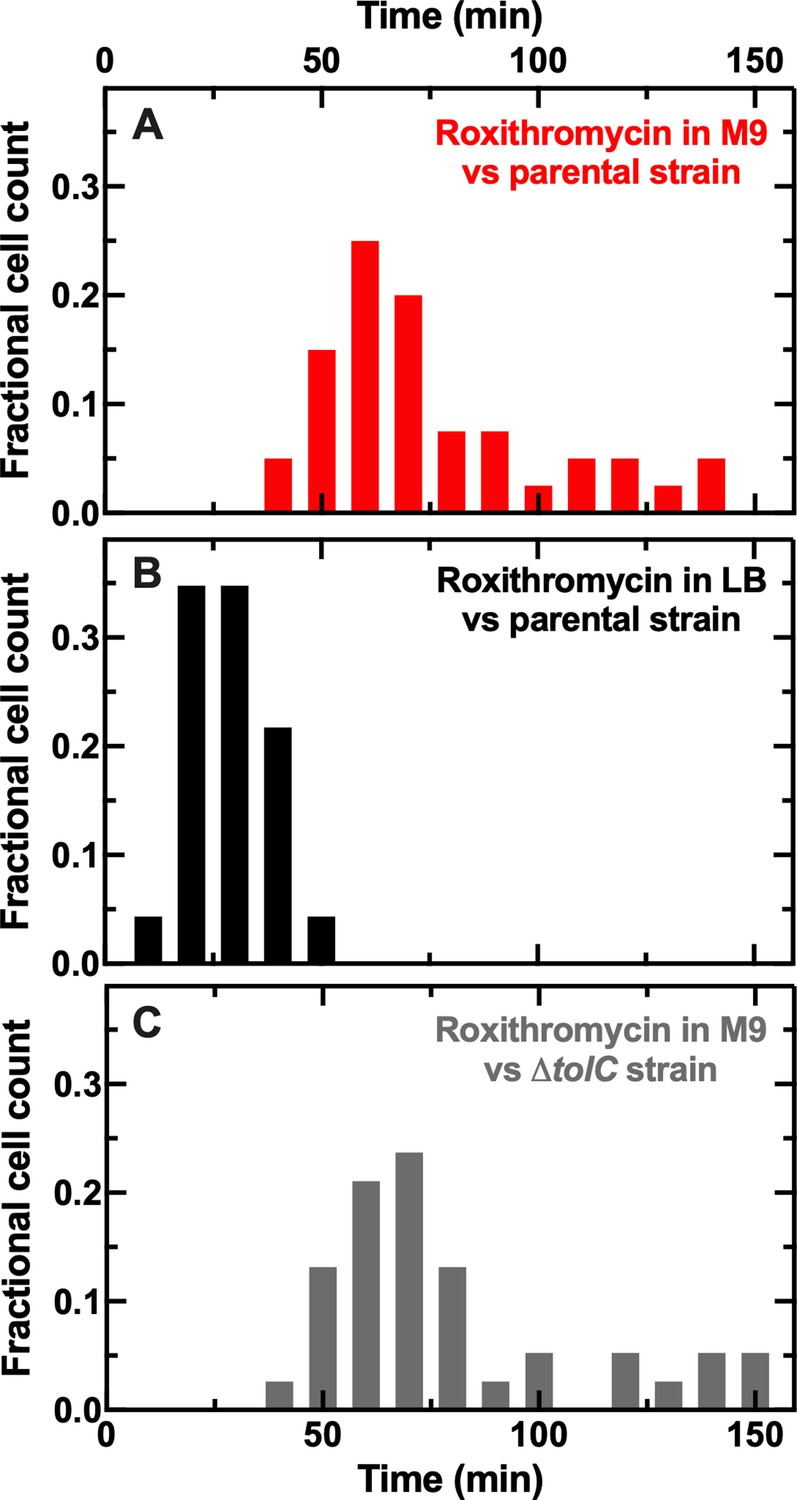
Measurement of single-cell doubling times.
Distribution of single cell doubling times during treatment with roxithromycin dissolved in (A) miminal medium M9 and (B) lysogeny broth (LB) as a drug milieu against the parental and (C) a ΔtolC knockout strain. The fluorescent derivative of roxithromycin was delivered at an extracellular concentration of 46 µg mL–1 at t=0 to N=40, 38, and 46 individual bacteria, respectively. The average doubling time was (75±28), (29±9), and (80±30) min, respectively. The distributions of doubling times in (A) and (C) were not statistically different (p-value =0.51), whereas the distributions in (A) and (B) were statistically different (****). None of the bacteria reported in (A) and (C) underwent a full cell cycle from birth to division during treatment, since all the bacteria that divided during treatment were born before treatment started. 65% of the bacteria reported in (B) underwent a full cell cycle.
Figure 1—figure supplement 6
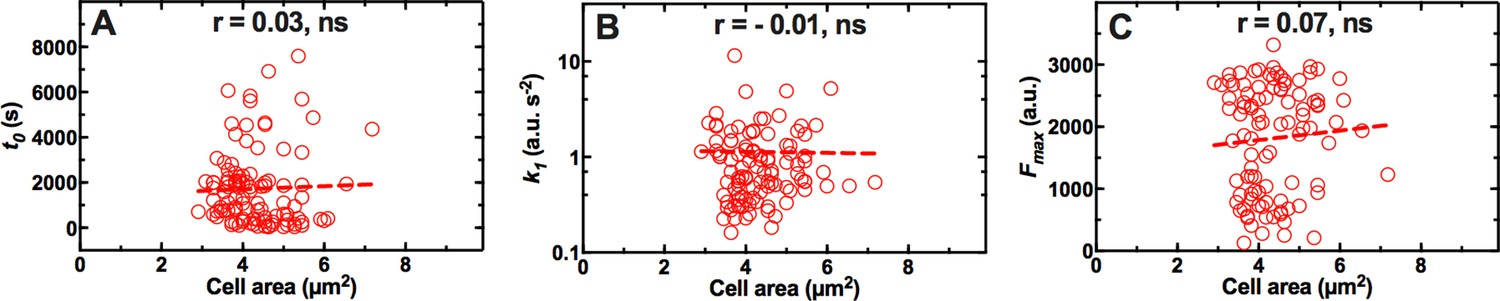
Interdependence between cell size and drug accumulation.
Absence of correlation between the area of each single bacterium before antibiotic treatment and the kinetic parameters (A) t0, (B) k1 and (C) Fmax describing the onset, uptake rate and level of saturation of the fluorescent derivative of roxithromycin in N=104 E. coli after adding the probe at 192 µg mL–1 extracellular concentration in M9 minimal medium from t=0 onwards. Data were collated from biological triplicate. We also found no correlation between cell area and the three kinetic accumulation parameters above for the other seven antibiotic probes investigated.
Figure 1—figure supplement 7

Staining of bacteria with different antibiotics.
Temporal dependence of the fraction of E. coli stained by fluorescent derivatives of polymyxin B (downwards triangles), tachyplesin (upwards triangles), octapeptin (crosses), linezolid (hexagons), trimethoprim (stars), ciprofloxacin (diamonds), roxithromycin (circles), or vancomycin (squares). The stained fraction at each time point is defined as the ratio of the number of bacteria displaying a fluorescence distinguishable from the background over the total number of bacteria at that time point. Symbols and error bars are the mean and standard error of the mean values calculated by averaging the N=103, 128, 104, 115, 175, 122, 265, and 236 individual bacteria, respectively, from biological triplicate presented in Figure 1—figure supplement 2.
Figure 1—figure supplement 8
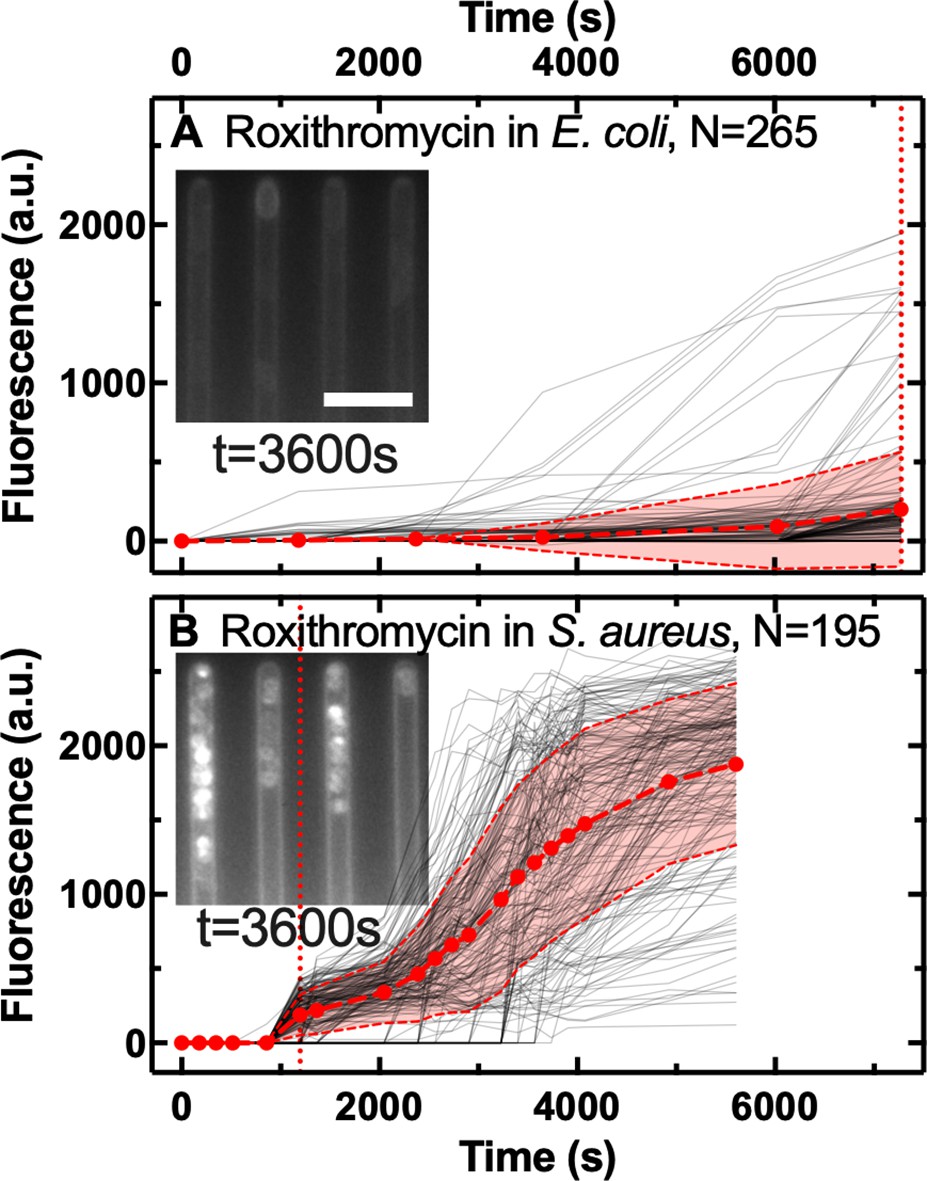
Comparison of single-cell roxithromycin accumulation in E. coli and S. aureus.
Accumulation of the fluorescent derivative of roxithromycin in (A) N=265 individual E. coli and (B) N=195 individual S. aureus (continuous lines), after adding the probe at 46 µg mL–1 extracellular concentration in M9 minimal medium from t=0 onwards. Data were collated from biological triplicate. Fluorescence values were background subtracted and normalised by cell size. The symbols and shaded areas are the mean and SD of the corresponding single-cell values. The measured minimum inhibitory concentration (MIC) of roxithromycin-NBD against E. coli and S. aureus was 192 and 1 µg mL–1, respectively. Insets: representative fluorescence images showing the accumulation of the fluorescent derivative of roxithromycin 3600 s post addition to the bacteria hosting channels. Scale bar: 5 µm. The vertical dotted lines represent the time points at which the median of each dataset became larger than zero.
Figure 1—figure supplement 9

Comparison of single-cell vancomycin accumulation in E. coli and S. aureus.
Accumulation of the fluorescent derivative of vancomycin in (A) N=236 individual E. coli and (B) N=63 individual S. aureus (continuous lines) cells, after adding the probe at 46 µg mL–1 extracellular concentration in M9 minimal medium from t=0 onwards. Data were collated from biological triplicate. Fluorescence values were background subtracted and normalised by cell size. The symbols and shaded areas are the mean and SD of the corresponding single-cell values. The measured minimum inhibitory concentration (MIC) of vancomycin-NBD against E. coli and S. aureus was >192 and 0.5 µg mL–1, respectively. I Insets: representative fluorescence images showing the accumulation of the fluorescent derivative of roxithromycin 1800 s post addition to the bacteria hosting channels. Scale bar: 5 µm. The vertical dotted lines represent the time points at which the median of each dataset became larger than zero.
Figure 1—figure supplement 10
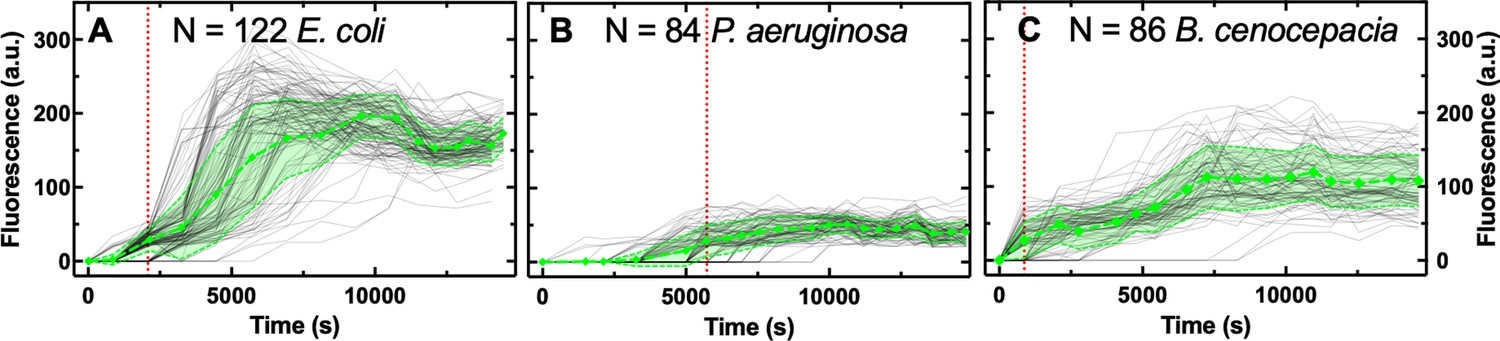
Comparison of single-cell ciprofloxacin accumulation in E. coli, P. aeruginosa, and B. cenocepacia.
Accumulation of the fluorescent derivative of ciprofloxacin in (A) N=122 individual E. coli, (B) N=84 individual P. aeruginosa and (C) N=86 individual B. cenocepacia (continuous lines) cells, after adding the probe at 46 µg mL–1 extracellular concentration in M9 minimal medium from t=0 onwards. Data were collated from biological triplicate. Fluorescence values were background subtracted and normalised by cell size. The symbols and shaded areas are the mean and SD of the corresponding single-cell values. The measured minimum inhibitory concentration (MIC) of ciprofloxacin-NBD against E. coli, P. aeruginosa, and S. aureus was 8, 32, and 32 µg mL–1, respectively. The vertical dotted lines represent the time points at which the median of each dataset became larger than zero. As expected ciprofloxacin-NBD accumulated to a significantly lower extent in P. aeruginosa since it lacks general porins, thus displaying a lower permeability compared to E. coli and B. cenocepacia (Rybenkov et al., 2021).
Figure 1—figure supplement 11
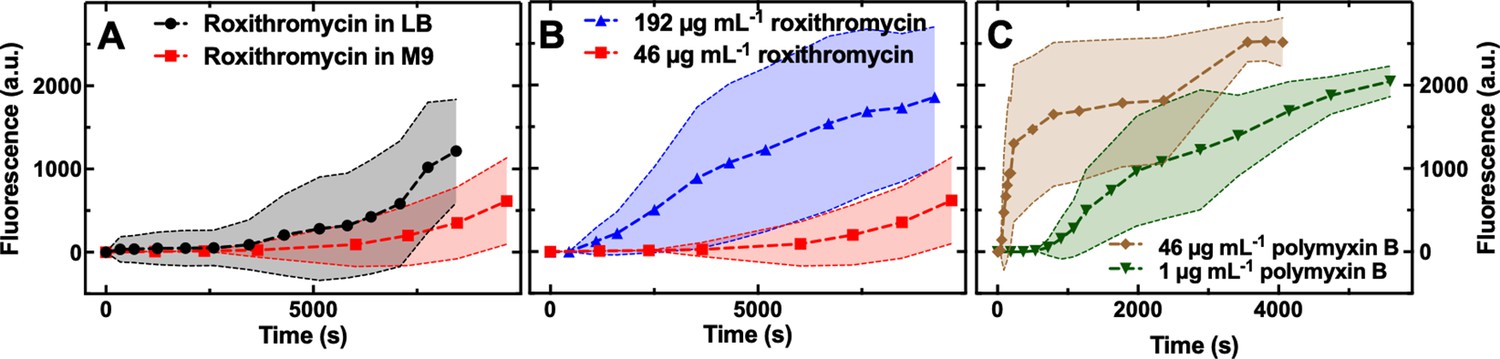
Impact of drug milieu and concentration on drug accumulation.
(A) Accumulation of the fluorescent derivative of roxithromycin in lysogeny broth (LB) (circles) or M9 medium (squares) drug milieu delivered to N=46 and 265 individual E. coli, respectively, at an extracellular concentration of 46 µg mL–1. (B) Accumulation of the fluorescent derivative of roxithromycin delivered at a concentration of 192 (upward triangles) and 46 (squares) µg mL–1 in a M9 medium drug milieu to N=110 and 265 individual E. coli, respectively. (C) Accumulation of the fluorescent derivative of polymyxin B delivered at a concentration of 46 (diamonds) and 1 (downward triangles) µg mL–1 in a M9 medium drug milieu to N=101 and 97 individual E. coli, respectively. Data were collated from biological triplicate and fluorescence values were background subtracted and normalised by cell size. The symbols and shaded areas represent the mean and SD of the corresponding single-cell values.
Figure 1—figure supplement 12

Impact of drug labelling on drug accumulation.
(A) Accumulation of unlabelled ciprofloxacin (triangles) and of the fluorescent derivative ciprofloxacin-NBD (diamonds) delivered to N=48 and 122 individual E. coli, respectively, at an extracellular concentration of 200 and 46 µg mL–1 in M9 medium, respectively. It is worth noting that unlabelled ciprofloxacin was not detectable neither extracellularly nor intracellularly at concentrations below 200 µg mL–1. (B) Accumulation of the fluorescent derivatives roxithromycin-NBD (squares) and roxithromycin-DMACA (hexagons) at an extracellular concentration of 46 µg mL–1 in a M9 medium drug milieu delivered to N=265 and 77 individual E. coli, respectively. In both figures data were collated from biological triplicate and fluorescence values were background subtracted and normalised by cell size. The symbols and shaded areas are the mean and SD of the corresponding single-cell values normalised to the maximum mean fluorescence value in each dataset.
Figure 1—figure supplement 13
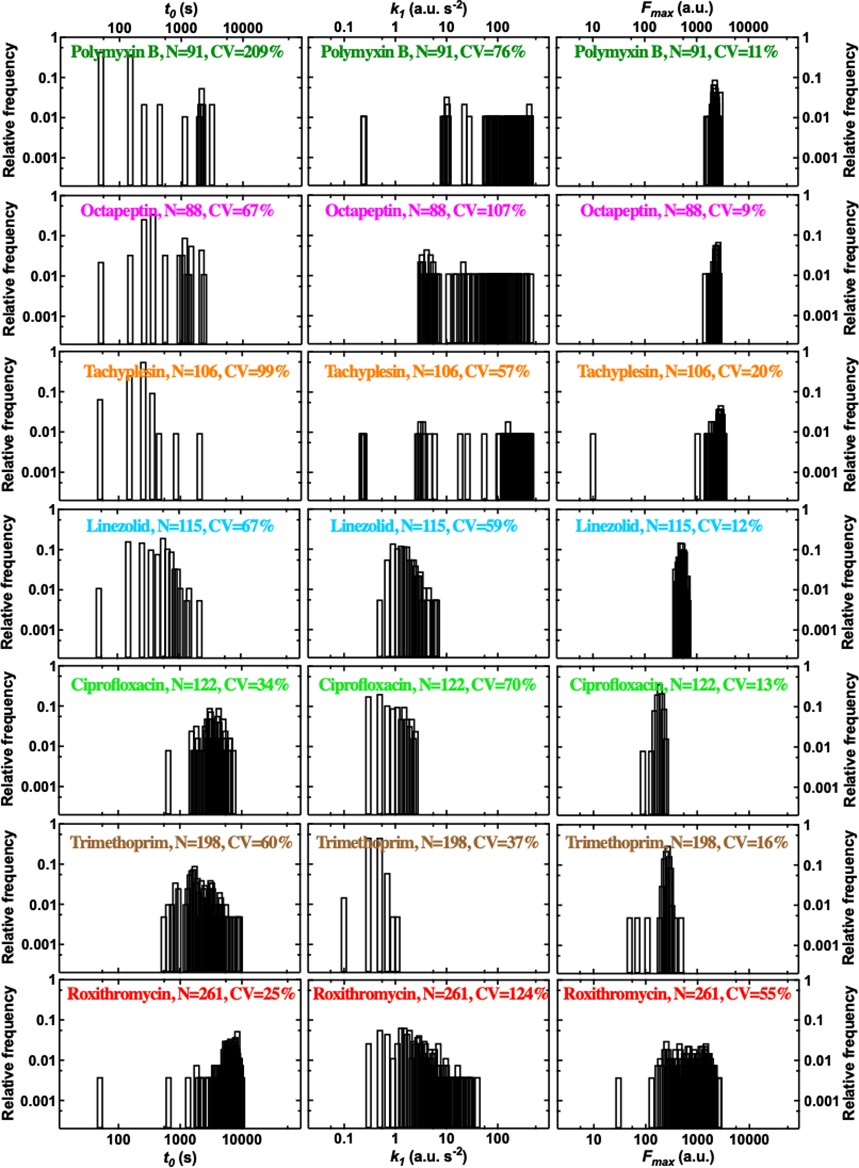
Main single-cell kinetic parameters inferred using our mathematical model.
Distributions of t0, k1 and Fmax kinetic parameters describing the accumulation of the fluorescent derivatives of polymyxin B, octapeptin, tachyplesin, linezolid, ciprofloxacin, trimethoprim, and roxithromycin (from top to bottom, respectively). These parameters were inferred by fitting the single-cell data reported in Figure 1—figure supplement 2 using our mathematical model (see Methods). Data for which the fitting algorithm returned divergent transitions were not reported and typically represented less than 1% of the data (compare N here and in Figure 1—figure supplement 2). t0 is the inferred accumulation onset, i.e., the time at which each bacterium fluorescence became distinguishable from background fluorescence, k1 is the inferred rate of uptake, Fmax is the inferred fluorescence saturation level at steady-state. CV is the coefficient of variation of the single-cell values in each dataset.
Figure 1—figure supplement 14

Second order single-cell kinetic parameters inferred using our mathematical model.
Distributions of k2, dr and dc kinetic parameters describing the accumulation of fluorescent antibiotic derivatives of polymyxin B, octapeptin, tachyplesin, linezolid, ciprofloxacin, trimethoprim, and roxithromycin (from top to bottom, respectively). These parameters were inferred by fitting the single-cell data reported in Figure 1—figure supplement 2 using our mathematical model (see Methods). Data for which the fitting algorithm returned divergent transitions were not reported and typically represented less than 1% of the data (compare N here and in Figure 1—figure supplement 2). k2 is the inferred adaptive inhibitory rate constant that describes the dip we observed in some single-cell trajectories in Figure 1—figure supplement 2, dr is the drug loss rate constant, dc is the dampening rate constant. CV is the coefficient of variation of the single-cell values in each dataset. Membrane targeting antibiotic probes displayed, on average, a higher adaptive inhibitory rate constant (k2=0.006, 0.007, and 0.006 a.u. s–2 for tachyplesin, polymyxin B, and octapeptin, respectively) compared to antibiotics with intracellular targets (k2=0.0001, 0.00005, 0.0003, and 0.0001 s for linezolid, trimethoprim, ciprofloxacin, and roxithromycin, respectively). Remarkably, we found notable cell-to-cell differences in k2 across all investigated drugs with a maximum CV of 251% for roxithromycin and a minimum CV of 67% for trimethoprim. Membrane targeting antibiotic probes also displayed, on average, a higher drug loss rate constant (dr =0.09, 0.09, and 0.03 s–1 for tachyplesin, polymyxin B, and octapeptin, respectively) compared to antibiotics with intracellular targets (dr =0.0003, 0.001, 0.0005, and 0.001 s for linezolid, trimethoprim, ciprofloxacin, and roxithromycin, respectively). Remarkably, we found notable cell-to-cell differences in dr across all investigated drugs with a maximum CV of 208% for roxithromycin and a minimum CV of 44% for trimethoprim. Membrane targeting antibiotic probes also displayed, on average, a higher dampening rate constant (dc =0.009, 0.01, and 0.009 s–1 for tachyplesin, polymyxin B, and octapeptin, respectively) compared to antibiotics with intracellular targets (dc =0.0006, 0.0005, 0.002, and 0.0003 s for linezolid, trimethoprim, ciprofloxacin, and roxithromycin, respectively). Remarkably, we found notable cell-to-cell differences in dc across all investigated drugs with a maximum CV of 187% for tachyplesin and a minimum CV of 28% for linezolid.
Figure 1—figure supplement 15
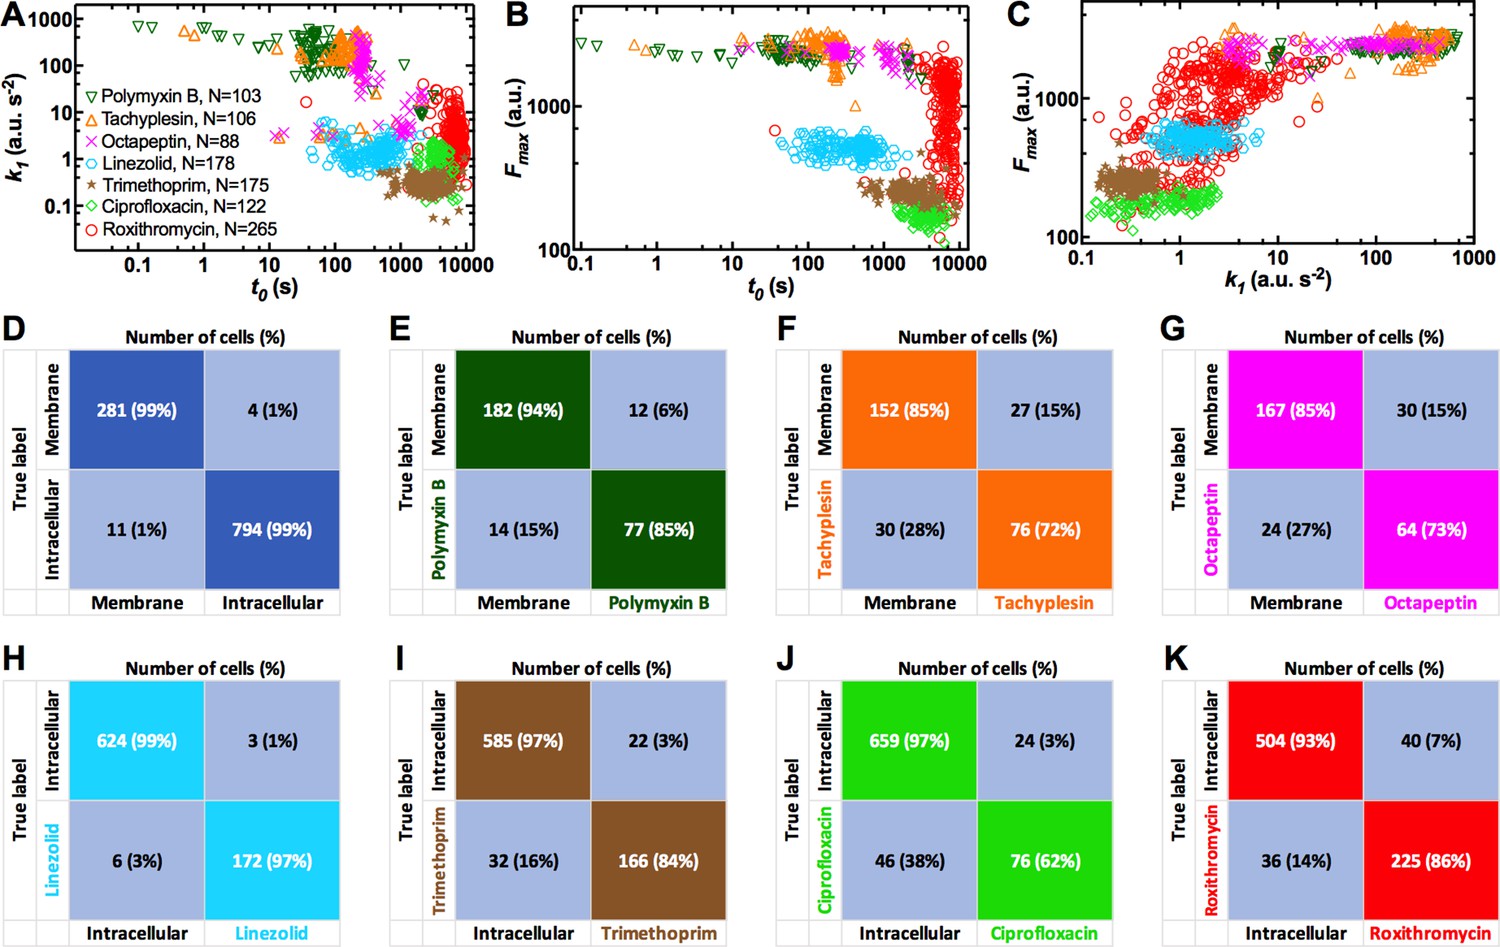
Coupling between accumulation parameters.
Correlation between (A) t0 and k1, (B) t0 and Fmax, (C) k1 and Fmax describing the accumulation of the fluorescent derivatives of polymyxin B (downward triangles), tachyplesin (upward triangles), octapeptin (crosses), linezolid (hexagons), trimethoprim (stars), ciprofloxacin (diamonds), or roxithromycin (circles) in N=103, 106, 88, 178, 175, 122, and 265 individual E. coli, respectively. Each data point represents the values of two kinetic parameters inferred for an individual bacterium from the data in Figure 1—figure supplement 2 using our mathematical model. Statistical classification of the accumulation of (D) membrane-targeting antibiotics (i.e. polymyxin B, tachyplesin, and octapeptin) vs intracellular-targeting antibiotics (i.e. linezolid, trimethoprim, ciprofloxacin, and roxithromycin), (E) polymyxin B, (F) tachyplesin, or (G) octapeptin vs the remaining membrane-targeting antibiotics, (H) linezolid, (I) trimethoprim, (J) ciprofloxacin, or (K) roxithromycin vs remaining antibiotics with an intracellular target. These confusion tables are predictions generated using only the two kinetic parameters that can be rapidly measured experimentally, namely t0 and k1. Similar statistical classifications were obtained when using the full set of kinetic parameters, i.e., k2, dr, and dc in addition to t0 and k1.
Figure 2 with 1 supplement
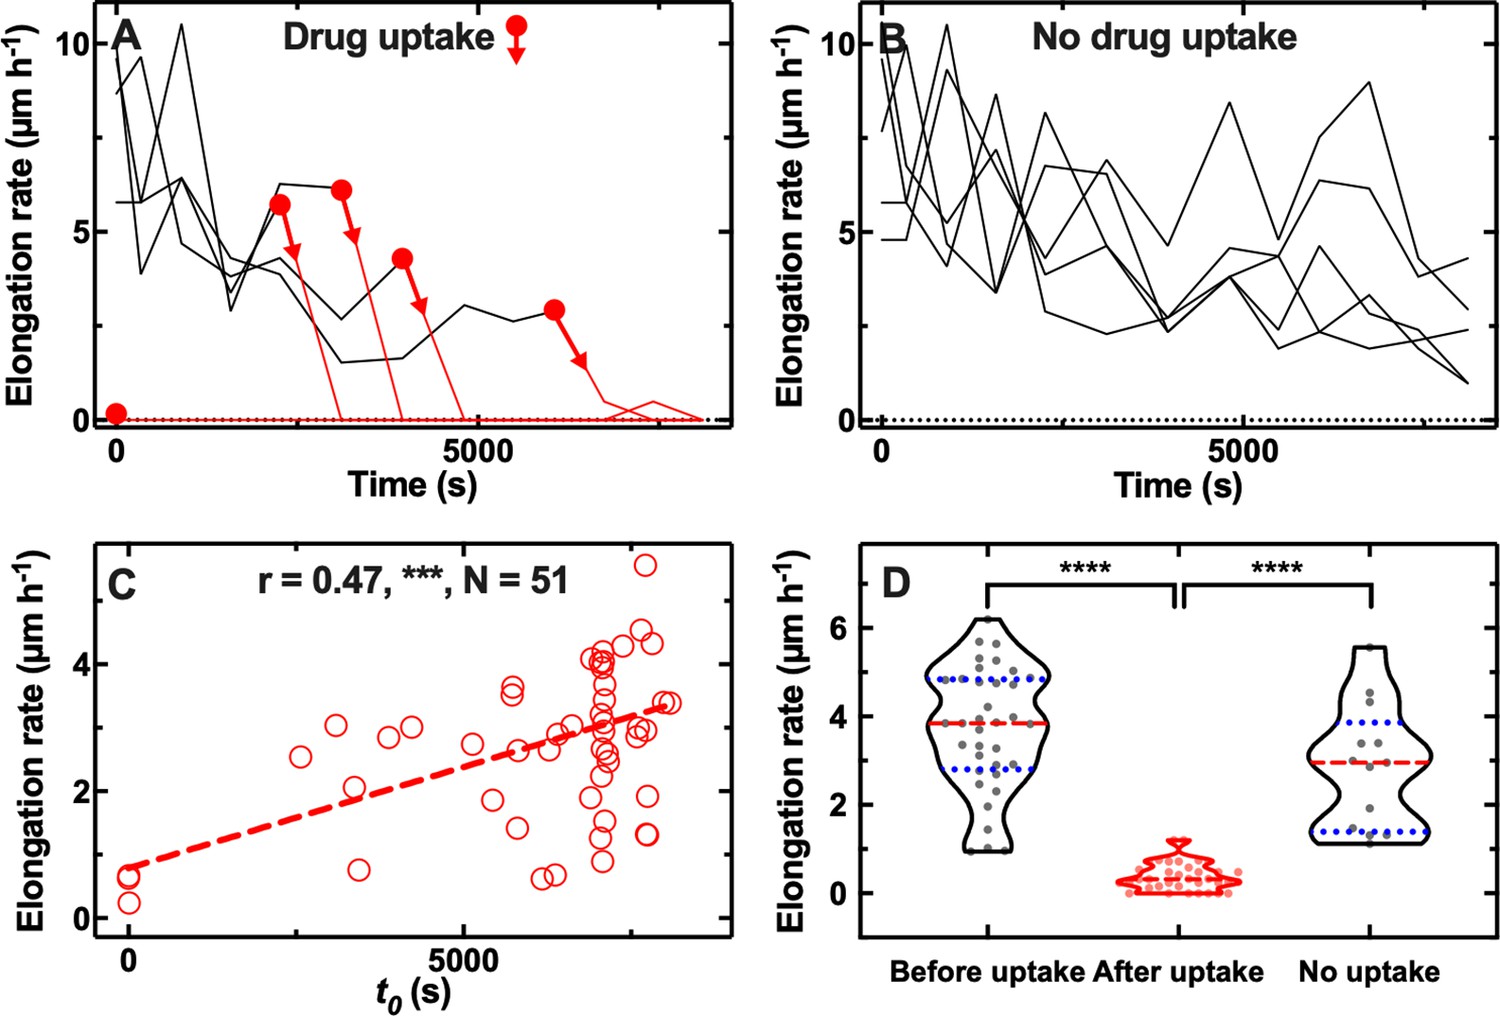
Correlation between antibiotic efficacy and antibiotic accumulation.
Temporal patterns of elongation rate during exposure to the fluorescent derivative of roxithromycin for (A) five representative E. coli bacteria that accumulated the drug and (B) five representative E. coli bacteria that did not accumulate the drug. The fluorescent derivative of roxithromycin was delivered at t=0 at a concentration of 46 µg mL–1 and was dissolved in lysogeny broth (LB), circles and arrows indicate t0, the time point at which each bacterium started to accumulate the drug (i.e. bacterial fluorescence signal became distinguishable from the background). (C) Correlation between each bacterium t0 and its average elongation rate throughout exposure to the fluorescent derivative of roxithromycin (i.e. 0<t< 8100 s). r is the Pearson coefficient quantifying the correlation above, ***: p-value<0.001, N=52 bacteria. (D) Average elongation rates for bacteria that had not yet started (before uptake) or had started (after uptake) accumulating the fluorescent derivative of roxithromycin, as well as for bacteria that did not accumulate the drug (no uptake). The red dashed and blue dotted lines within each violin plot represent the median and quartiles of each data set, respectively. Paired t-test between elongation rates before and after onset in accumulation: ****: p-value<0.0001, N=36 pairs. Unpaired t-test between the elongation rates of bacteria that did not take up the drug compared to the elongation rate of bacteria that had not yet started taking up the drug: not significant, p-value=0.07, N=13 and 36 bacteria, respectively. Unpaired t-test between the elongation rates of bacteria that did not take up the drug compared to the elongation rate of bacteria that had started taking up the drug: ****: p-value<0.0001, N=13 and 36 bacteria, respectively.
-
Figure 2—source data 1
Single-cell elongation rates during roxithromycin treatment.
Temporal patterns of elongation rate during exposure to the fluorescent derivative of roxithromycin for five representative E. coli bacteria that accumulated the drug and five representative E. coli bacteria that did not accumulate the drug. The fluorescent derivative of roxithromycin was delivered at t=0 at a concentration of 46 µg mL–1 and was dissolved in lysogeny broth (LB).
- https://cdn.elifesciences.org/articles/74062/elife-74062-fig2-data1-v1.csv
-
Figure 2—source data 2
Correlation between drug accumulation and efficacy.
Correlation between each bacterium t0 and its average elongation rate throughout exposure to the fluorescent derivative of roxithromycin.
- https://cdn.elifesciences.org/articles/74062/elife-74062-fig2-data2-v1.csv
-
Figure 2—source data 3
Average elongation rates for bacteria that had not yet started ccumulating the fluorescent derivative of roxithromycin.
- https://cdn.elifesciences.org/articles/74062/elife-74062-fig2-data3-v1.csv
-
Figure 2—source data 4
Average elongation rates for bacteria that had started accumulating the fluorescent derivative of roxithromycin.
- https://cdn.elifesciences.org/articles/74062/elife-74062-fig2-data4-v1.csv
-
Figure 2—source data 5
Average elongation rates for bacteria that did not accumulate the fluorescent derivative of roxithromycin.
- https://cdn.elifesciences.org/articles/74062/elife-74062-fig2-data5-v1.csv
Figure 2—figure supplement 1
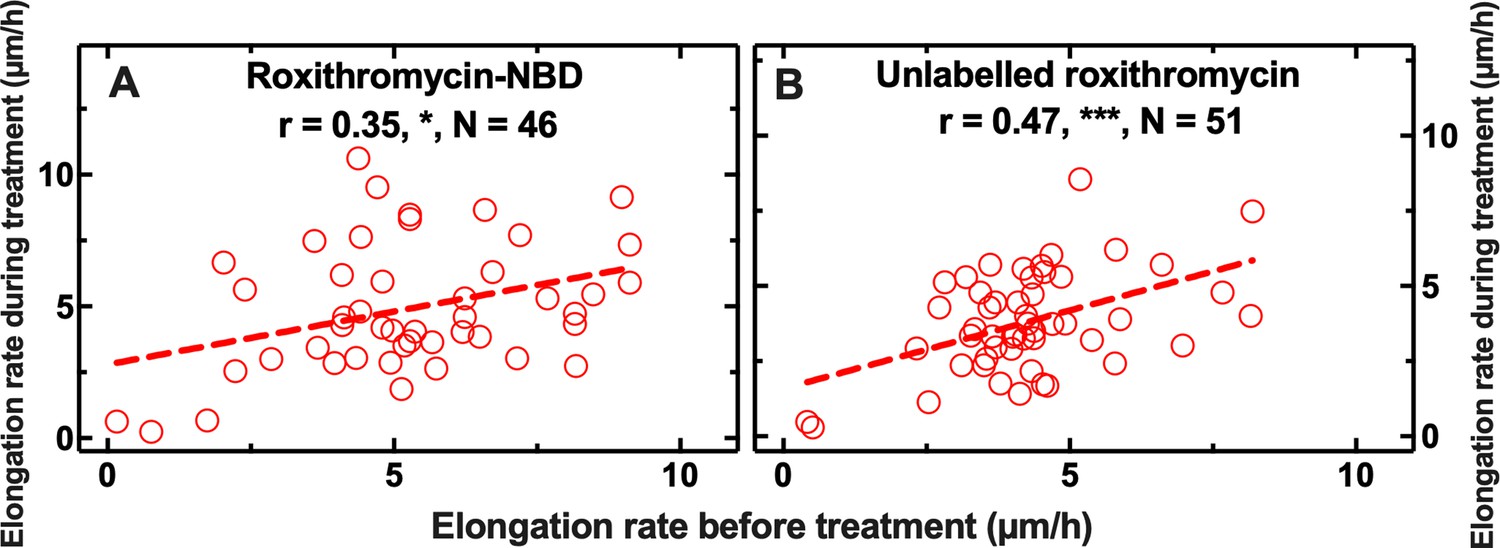
Interdependence between single-cell elongation rate before treatment and single-cell elongation rate during exposure to (A) roxithromycin-NBD and (B) unlabelled roxithromycin.
r is the Pearson correlation coefficient, *: p-value<0.05, ***: p-value<0.001. N=46 and 51 individual E. coli investigated and collated from biological triplicate. In each experiment E. coli was grown for 2 hr in the microfluidic device with continuous supply of fresh lysogeny broth (LB). During this 2 hr growth period the elongation rate of each bacterium was measured between consecutive time points and the average elongation rate for each bacterium was calculated. At the end of this 2 hr growth period, 46 µg mL–1 roxithromycin-NBD or unlabelled roxithromycin dissolved in LB was continuously delivered for a 4 hr treatment period in the microfluidic device. During this 4 hr treatment period the elongation rate of each bacterium was measured as indicated above. The data in (A) are reproduced from Figures 2C and 4A.
Figure 3 with 1 supplement

Effect of the presence of screening cells on the accumulation of antibiotics in single cells.
Dependence of the kinetic parameters t0, k1, and Fmax for the accumulation of fluorescent derivatives of polymyxin B (A–C) and roxithromycin (D–F) on the number of screening cells between the bacterium under investigation and the main microfluidic chamber where the drug is continuously injected. Each data point is the value of a kinetic parameter inferred for an individual bacterium from the data in Figure 1—figure supplement 2 using our mathematical model, N=103 and 265 for polymyxin B and roxithromycin, respectively. The red dashed and blue dotted lines within each violin plot represent the median and quartiles of each data set, respectively. r is the Pearson coefficient quantifying the correlation between each inferred kinetic parameter and the number of screening cells in front of each bacterium. ns: not significant correlation, *: p-value<0.05, **: p-value<0.01, ***: p-value<0.001, ****: p-value<0.0001. Inset: representative brightfield and fluorescence images illustrating, from left to right, a bacterium screened by 0, 1, 2, 3, and 4 cells, respectively; roxithromycin-NBD was injected in the main microfluidic chamber in the left-hand side of the image and diffused from left to right. The fluorescence image shows early roxithromycin-NBD accumulation in the bacterium screened by the highest number of cells.
-
Figure 3—source data 1
Impact of microcolony architecture on drug accumulation.
Dependence of the kinetic parameters t0, k1, and Fmax for the accumulation of fluorescent derivatives of polymyxin B and roxithromycin on the number of screening cells between the bacterium under investigation and the main microfluidic chamber where the drug is continuously injected.
- https://cdn.elifesciences.org/articles/74062/elife-74062-fig3-data1-v1.csv
-
Figure 3—source data 2
Simulations of antibiotic diffusion and absorption.
Antibiotic concentrations at the bacterial surface for bacteria with 0, 1, 2, 3 or 4 screening cells between themselves and the open end of the channel with an absorption rate of 0.2 mol m–2 s–1 or 0.002 mol m–2 s–1.
- https://cdn.elifesciences.org/articles/74062/elife-74062-fig3-data2-v1.csv
Figure 3—figure supplement 1
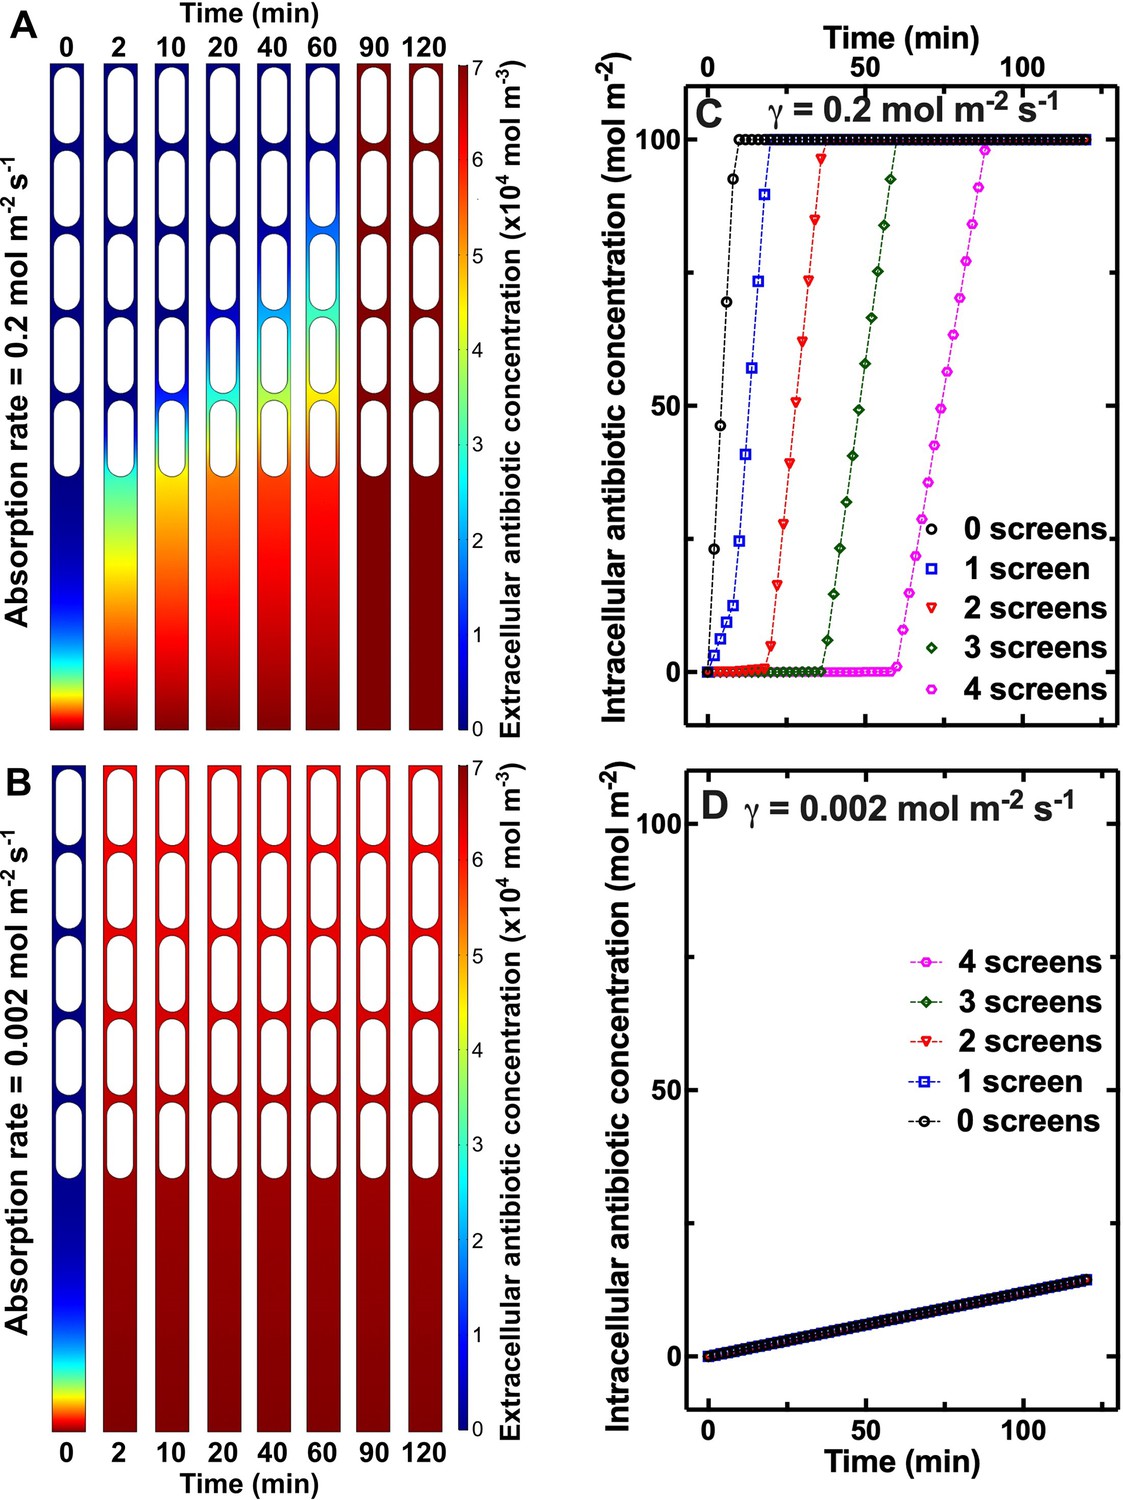
Simulations of antibiotic diffusion and absorption.
Numerical simulations of antibiotic diffusion in microfluidic channels hosting a single file of five bacteria with an absorption rate of (A) 0.2 mol m–2 s–1 or (B) 0.002 mol m–2 s–1. Antibiotic was added at t=0 and the extracellular antibiotic concentration at the open end of the channel (at the bottom of maps) was kept constant at 7×10⁴ mol m–3. (C) and (D) corresponding antibiotic concentrations at the bacterial surface for bacteria with 0, 1, 2, 3 or 4 screening cells between themselves and the open end of the channel (black circles, blue squares, red triangles, green diamonds, and magenta hexagons, respectively).
Figure 4 with 4 supplements
Differential cell growth and expression of key molecular pathways prior antibiotic treatment contributes to heterogeneity in roxithromycin accumulation.
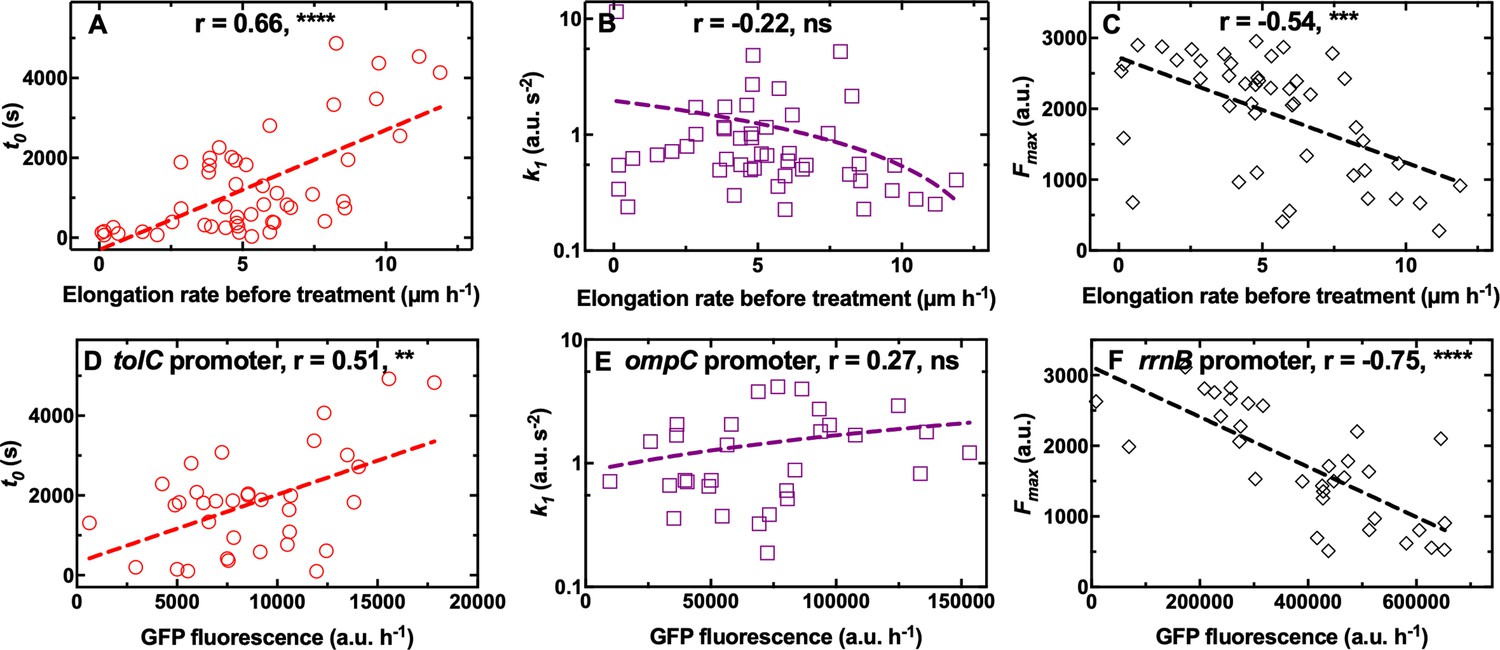
(A–C) Correlation between the single-cell kinetic parameters t0, k1 and Fmax describing the accumulation of roxithromycin-NBD and the bacterial elongation rate during the 2 hr growth period preceding antibiotic treatment (see Methods). Measurements were carried out on N=50 individual E. coli, collated from biological triplicate, before and after exposure to 192 µg mL–1 roxithromycin-NBD dissolved in M9. (D–F) Correlation between single-cell green fluorescent protein (GFP) fluorescence, as a proxy for the expression of tolC, ompC, and rrnB promoters, and single-cell kinetic parameters t0, k1 and Fmax describing the accumulation of roxithromycin-DMACA (at an extracellular concentration of 192 µg mL–1). r is the Pearson coefficient quantifying the correlation between each inferred kinetic parameter and the corresponding elongation rate of each cell. ns: not significant correlation, **: p-value<0.01, ***: p-value<0.001, ****: p-value<0.0001. Dashed lines are linear regressions to the data. Measurements were carried out on N=34, 30, and 33 individual E. coli collated from biological triplicate for the tolC, ompC, and rrnB reporter strains, respectively.
-
Figure 4—source data 1
Correlation between octapeptin accumulation and cell growth state.
Interdependence between single-cell elongation rate before treatment and the onset t0, the rate k1, and the saturation Fmax in the accumulation of the fluorescent derivative of octapeptin.
- https://cdn.elifesciences.org/articles/74062/elife-74062-fig4-data1-v1.csv
-
Figure 4—source data 2
Correlation between tachyplesin accumulation and cell growth state.
Interdependence between single-cell elongation rate before treatment and the onset t0, the rate k1, and the saturation Fmax in the accumulation of the fluorescent derivative of tachyplesin.
- https://cdn.elifesciences.org/articles/74062/elife-74062-fig4-data2-v1.csv
-
Figure 4—source data 3
Correlation between trimethoprim accumulation and cell growth state.
Interdependence between single-cell elongation rate before treatment and the onset t0, the rate k1, and the saturation Fmax in the accumulation of the fluorescent derivative of trimethoprim.
- https://cdn.elifesciences.org/articles/74062/elife-74062-fig4-data3-v1.csv
-
Figure 4—source data 4
Correlation between roxithromycin accumulation and cell growth state.
Interdependence between single-cell elongation rate before treatment and the onset t0, the rate k1, and the saturation Fmax in the accumulation of the fluorescent derivative of roxithromycin.
- https://cdn.elifesciences.org/articles/74062/elife-74062-fig4-data4-v1.csv
-
Figure 4—source data 5
Correlation between the expression of tolC and roxithromycin accumulation.
Correlation between single-cell GFP fluorescence, as a proxy for the expression of tolC promoter and the single-cell kinetic parameter t0 describing the onset in the accumulation of roxithromycin-DMACA (at an extracellular concentration of 192 µg mL–1).
- https://cdn.elifesciences.org/articles/74062/elife-74062-fig4-data5-v1.csv
-
Figure 4—source data 6
Correlation between the expression of ompC and roxithromycin accumulation.
Correlation between single-cell GFP fluorescence, as a proxy for the expression of ompC promoter and the single-cell kinetic parameter k1 describing the rate of uptake in the accumulation of roxithromycin-DMACA (at an extracellular concentration of 192 µg mL–1).
- https://cdn.elifesciences.org/articles/74062/elife-74062-fig4-data6-v1.csv
-
Figure 4—source data 7
Correlation between the expression of rrnB and roxithromycin accumulation.
Correlation between single-cell GFP fluorescence, as a proxy for the expression of rrnB promoter and the single-cell kinetic parameter Fmax describing the saturation level in the accumulation of roxithromycin-DMACA (at an extracellular concentration of 192 µg mL–1).
- https://cdn.elifesciences.org/articles/74062/elife-74062-fig4-data7-v1.csv
-
Figure 4—source data 8
Correlation between the expression of rrnH and roxithromycin accumulation.
Correlation between single-cell GFP fluorescence, as a proxy for the expression of rrnH promoter, and the single-cell kinetic parameter Fmax describing the saturation level in the accumulation of roxithromycin-DMACA (at an extracellular concentration of 192 µg mL–1).
- https://cdn.elifesciences.org/articles/74062/elife-74062-fig4-data8-v1.csv
Figure 4—figure supplement 1

Correlation between drug accumulation and cell growth state.
Interdependence between single-cell elongation rate before treatment and the onset t0, the rate k1, and the saturation Fmax in the accumulation of fluorescent derivatives of (A–C) octapeptin, (D–F) tachyplesin, and (G–I) trimethoprim, respectively. r is the Pearson correlation coefficient, **: p-value<0.01, ns: not significant, p-value>0.05. N=28, 27, and 61 individual E. coli investigated for the accumulation of the fluorescent derivatives of octapeptin, tachyplesin, and trimethoprim, respectively, and collated from biological triplicate. In each experiment E. coli were grown for 2 hr in the microfluidic device with continuous supply of fresh lysogeny broth (LB). During this 2 hr growth period the elongation rate of each bacterium was measured between consecutive time points and the average elongation rate for each bacterium was calculated. At the end of this 2 hr growth period, one of the three fluorescent antibiotic derivatives above was continuously delivered for a 4 hr treatment period in the microfluidic device at a concentration of 46 µg mL–1 in M9 minimal medium. During this 4 hr treatment period single-cell fluorescence data were obtained and dynamic accumulation parameters t0, k1 and Fmax were inferred by fitting these single-cell data to our mathematical model (see Methods).
Figure 4—figure supplement 2
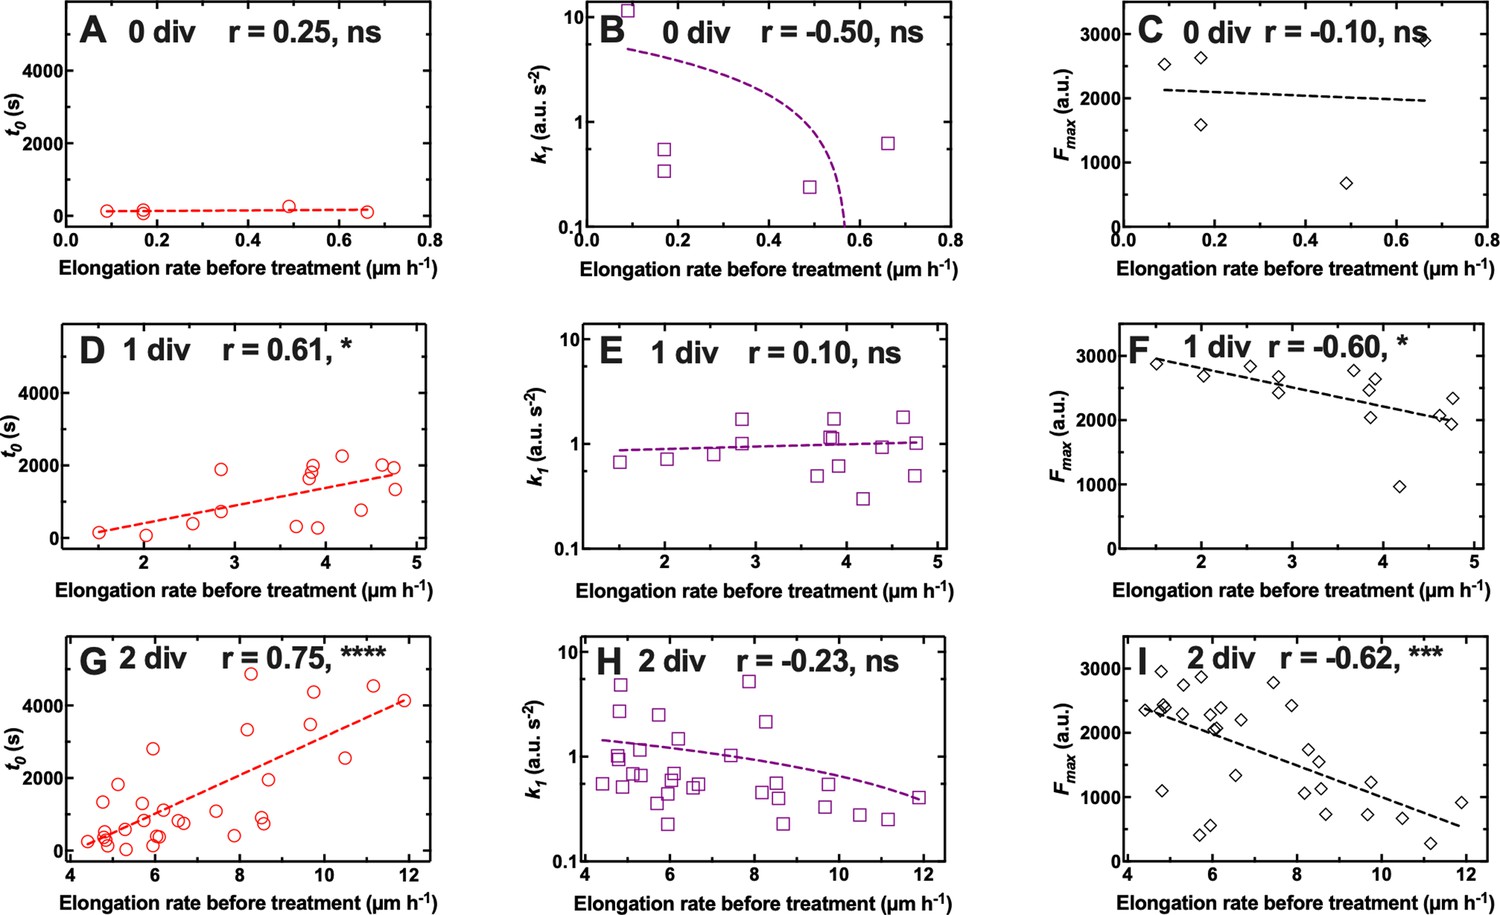
Differential cell growth contributes to heterogeneity in roxithromycin accumulation.
Correlation between the single-cell kinetic parameters t0, k1 and Fmax describing the accumulation of roxithromycin-NBD and the bacterial elongation rate during the 2 hr growth period preceding antibiotic treatment for (A–C) non-dividing bacteria, (D–F) bacteria that divided once, (G–I) bacteria that divided twice during the 2 hr growth period preceding antibiotic treatment. Data are reproduced from Figure 4A–C.
Figure 4—figure supplement 3
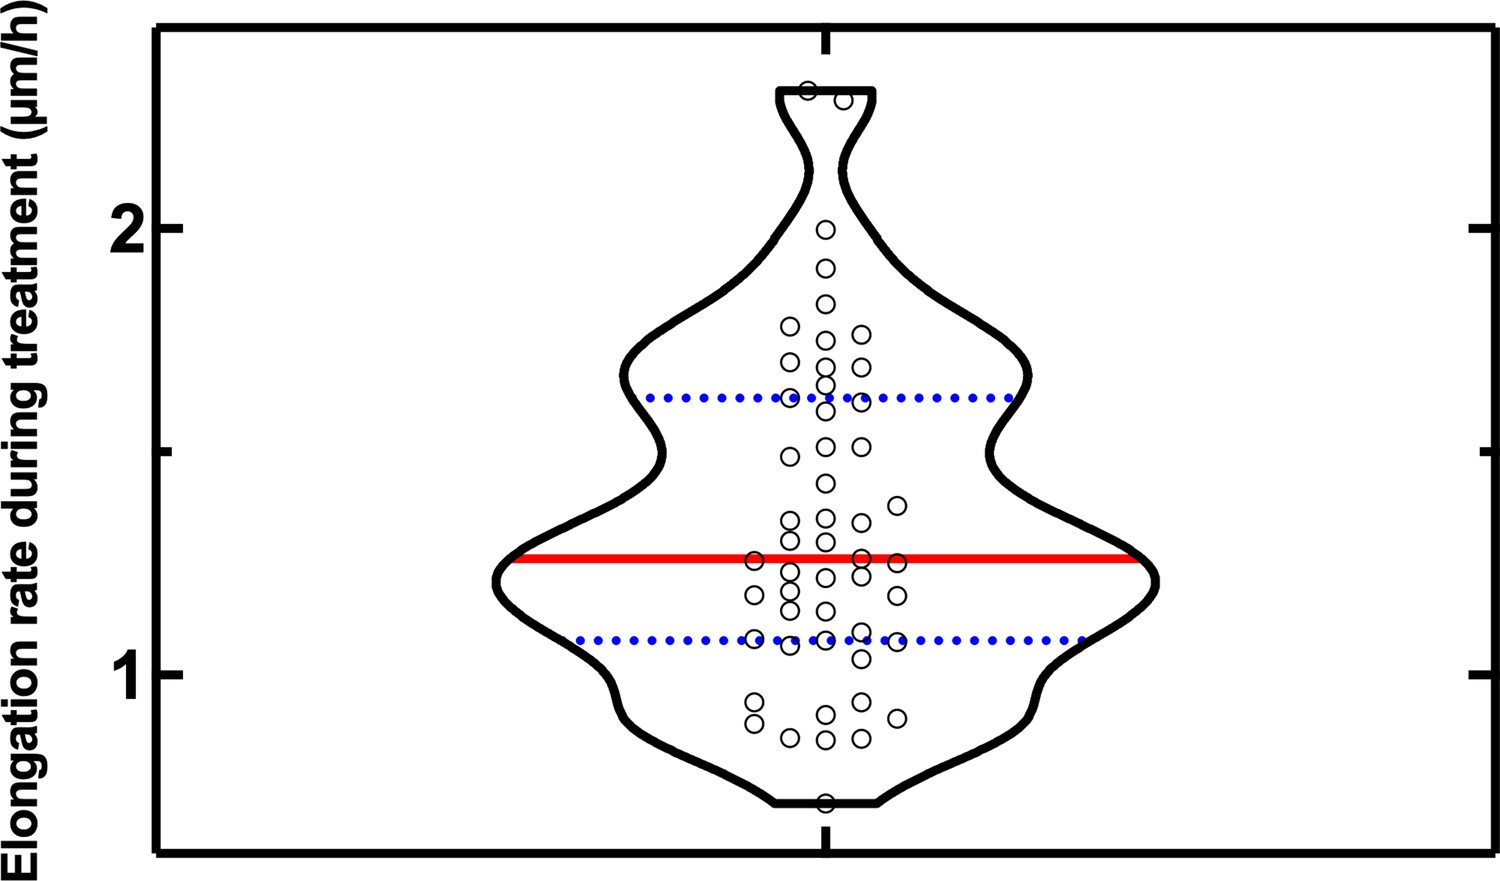
Distribution of single-cell elongation rates during roxithromycin treatment.
Circles are single E. coli cell elongation rates averaged over the duration of treatment with 192 µg mL–1 roxithromycin-NBD dissolved in M9. Measurements were carried out on N=50 individual E. coli, collated from biological triplicate. The red line and blue dotted lines within each violin plot represent the median and quartiles of each data set, respectively.
Figure 4—figure supplement 4

Negative correlation between ribosomal expression and roxithromycin accumulation.
Correlation between the single-cell kinetic parameter Fmax describing the accumulation of roxithromycin-DMACA (at an extracellular concentration of 192 µg mL–1) and the single-cell GFP fluorescence as a proxy for the expression of rrnH promoter. r is the Pearson coefficient, ****: p-value<0.0001. The dashed line is a linear regression to the data. Measurements were carried out on N=35 individual E. coli collated from biological triplicate.
Figure 5 with 1 supplement
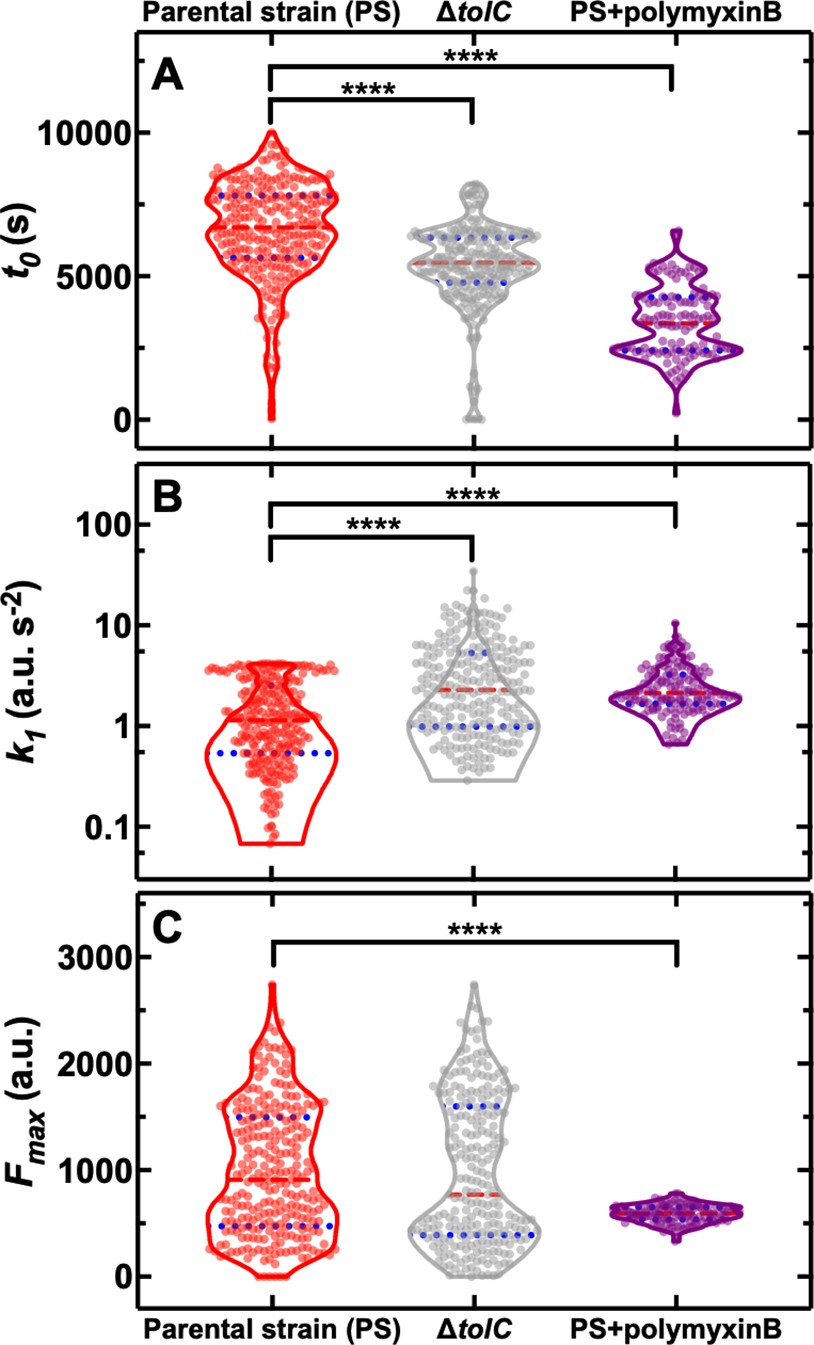
Genetic and chemical manipulation of heterogeneity in drug accumulation.
Distributions of single-cell values for the kinetic parameters (A) t0, (B) k1 and (C) Fmax describing the accumulation of the fluorescent derivative of roxithromycin (at 46 µg mL–1 in M9) in the E. coli BW25113 parental strain (PS), the knockout mutant ΔtolC and the parental strain co-treated with unlabelled polymyxin B at 1 µg mL–1 extracellular concentration. The red dashed and blue dotted lines within each violin plot represent the median and quartiles of each data set, respectively. ****: p-value<0.0001. N=262, 241, and 116 individual parental strain E. coli treated with the roxithromycin probe, ΔtolC E. coli treated with the roxithromycin probe and parental strain E. coli co-treated with the roxithromycin probe and 1 µg mL–1 unlabelled polymyxin B.
-
Figure 5—source data 1
Genetic and chemical manipulation of heterogeneity in drug accumulation.
Distributions of single-cell values for the kinetic parameters t0, k1 and Fmax describing the accumulation of the fluorescent derivative of roxithromycin (at 46 µg mL–1 in M9) in the E. coli BW25113 parental strain (PS), the knockout mutant ΔtolC and the parental strain co-treated with unlabelled polymyxin B at 1 µg mL–1 extracellular concentration.
- https://cdn.elifesciences.org/articles/74062/elife-74062-fig5-data1-v1.csv
-
Figure 5—source data 2
Genetic manipulation of heterogeneity in drug accumulation.
Distributions of single-cell values for the kinetic parameters t0, k1 and Fmax describing the accumulation of the fluorescent derivative of roxithromycin (at 46 µg mL–1 in M9) in the knockout mutant ΔompC.
- https://cdn.elifesciences.org/articles/74062/elife-74062-fig5-data2-v1.csv
Figure 5—figure supplement 1
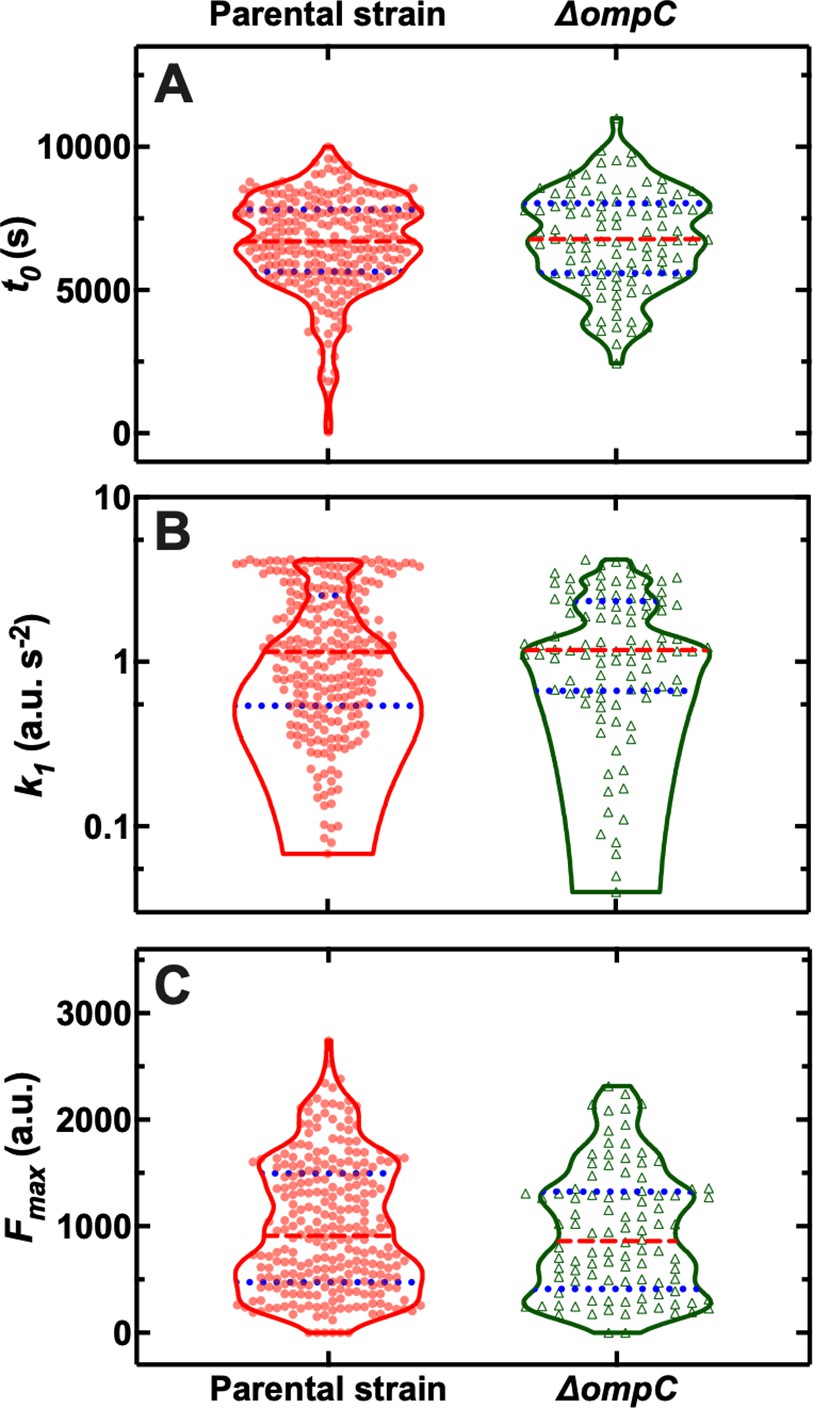
Distributions of single-cell values for the kinetic parameters (A) t0, (B) k1 and (C) Fmax describing the accumulation of the fluorescent derivative of roxithromycin (at 46 µg mL–1 in M9) in the E. coli BW25113 parental strain and the knockout mutant ΔompC. The red dashed and blue dotted lines within each violin plot represent the median and quartiles of each data set, respectively. None of the kinetic parameters was significantly different in the knockout mutant ΔompC compared to the parental strain, p-values of 0.39, 0.69, and 0.41, respectively. N=262 and 100 individual bacteria for the parental and ΔompC strain, respectively.
Videos
Appendix 1—video 1
Comparison of roxithromycin accumulation in gram-negative and gram-positive bacteria.
Time-lapse microscopy displaying the accumulation of roxithromycin-NDB in individual E. coli (top) and S. aureus bacteria (bottom). Roxithromycin-NDB was added to the microfluidic device at t=0 at an extracellular concentration of 46 µg mL–1.
Appendix 1—video 2
Comparison of vancomycin and roxithromycin accumulation in gram-positive bacteria.
Time-lapse microscopy displaying the accumulation of vancomycin-NDB (top) and roxithromycin-NDB (bottom) in individual S. aureus bacteria. Both fluorescent antibiotic derivatives were added to the microfluidic device at t=0 at an extracellular concentration of 46 µg mL–1.
Tables
Appendix 1—table 1
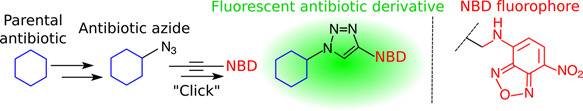
List of fluorescent antibiotic derivatives (obtained by linking the parental antibiotic to nitrobenzoxadiazole, NBD, see Methods), the bacterial compartment where their target is located, their molecular weight (MW) after linkage to NBD, their partition coefficient (logP), their measured minimum inhibitory concentration (MIC) against E. coli BW25113, and the fold-change compared to the MIC measured for each corresponding parental antibiotic (see Methods).
MIC data were collated from biological triplicate.
 | |||||
|---|---|---|---|---|---|
| Antibiotic probe | Compartment | MW (g/mol) | logP | MIC (μg/mL) | Fold change |
| Polymyxin B-NBD | Membrane | 1,449 | –2.5 | 1 | 1 |
| Octapeptin-NBD | Membrane | 1,304 | –0.4 | 4 | 1 |
| Tachyplesin-NBD | Membrane | 2,523 | –2.7 | 1 | 1 |
| Vancomycin-NBD | Cell wall | 1,650 | –2.6 | >192 | 1 |
| Linezolid-NBD | Cytoplasm | 638 | 0.7 | 134 | 1 |
| Roxithromycin-NBD | Cytoplasm | 1,064 | 3.1 | 192 | 3 |
| Ciprofloxacin-NBD | Cytoplasm | 633 | –1.1 | 8 | 256 |
| Trimethoprim-NBD | Cytoplasm | 577 | 0.9 | 64 | 64 |
Appendix 1—table 2
Pearson correlation coefficients and significance of the correlation between t0 and k1, t0 and Fmax and k1 and Fmax for the accumulation in single E. coli of all the fluorescent antibiotic derivatives investigated (apart from vancomycin) in individual E. coli.
Data from Figure 1—figure supplement 13 were used for these statistical comparisons. ****: p-value<0.0001, ***: p-value <0.001, **: p-value<0.01, *: p-value<0.05, ns: not significant, p-value>0.05.
| Pearson correlation coefficients and significance | |||
|---|---|---|---|
| Antibiotics | t0 vs k1 | t0 vs Fmax | k1 vs Fmax |
| Polymyxin B | –0,51, **** | –0,54, **** | 0,56, **** |
| Octapeptin | –0,46, **** | –0,61, **** | 0,20, ns |
| Tachyplesin | –0,13, ns | –0,10, ns | –0,01, ns |
| Linezolid | 0.03, ns | –0,21, ** | 0,05, ns |
| Ciprofloxacin | –0,12, ns | –0,11, ns | 0,29, *** |
| Trimethoprim | 0,06, ns | –0,32, **** | 0,11, ns |
| Roxithromycin | –0,22, *** | –0,10, ns | 0,41, **** |
| All antibiotics | –0,40, **** | –0,27, **** | 0,65, **** |
Appendix 1—table 3
List of genes encoding outer membrane proteins (i.e. porins) and efflux pumps compiled using EcoCyc as previously reported (Kortright et al., 2020), alongside their transcript reads after a 2 hr growth period in lysogeny broth (LB) (i.e. the time point at which antibiotic treatment starts in our microfluidic experiments) measured via RNA-sequencing as previously reported (Smith et al., 2018). Note that it has been reported that permeability of solutes through OmpA (with the most highly expressed transcripts) is a 100-fold lower compared to that through OmpC (Sugawara and Nikaido, 1992) (with the second most highly expressed transcripts), hence we decided to investigate the role played by OmpC in the heterogeneity in the intracellular accumulation of roxithromycin (Figure 4E).
| Membrane genes | Transcript reads | Membrane genes | Transcript reads | Membrane genes | Transcript reads | Membrane genes | Transcript reads |
|---|---|---|---|---|---|---|---|
| ompA | 60,955 | mltA | 398 | acrZ | 47 | yaiO | 6 |
| ompC | 57,458 | yncD | 388 | yfiB | 39 | cusB | 6 |
| ompX | 19,210 | lolB | 345 | cusA | 39 | yehB | 5 |
| lptD | 10,977 | nlpD | 326 | macb | 36 | bglH | 5 |
| tolC | 4722 | mdtK | 312 | yhcD | 33 | wza | 5 |
| fhuA | 4360 | yiaD | 292 | fimD | 31 | blc | 5 |
| bamA | 4237 | nplE | 291 | acrF | 30 | acrE | 5 |
| acrB | 4044 | fepA | 289 | pgaA | 29 | yfgH | 4 |
| bamB | 3796 | yraP | 256 | mdtL | 28 | nanC | 4 |
| ompF | 3650 | emtA | 252 | mdtG | 28 | yqhH | 4 |
| slyB | 3516 | ydiY | 241 | mdtF | 27 | phoE | 4 |
| nlpI | 3367 | tamA | 236 | yfaL | 25 | mdtQ | 3 |
| fadL | 2612 | yjgL | 222 | gfcD | 24 | yliI | 3 |
| ompT | 2601 | mdfA | 220 | gspD | 23 | ompN | 3 |
| mipA | 2289 | ynfB | 220 | yraJ | 22 | mdtO | 3 |
| mltD | 2045 | ypjA | 220 | gfcE | 22 | cusC | 2 |
| fecA | 2009 | pgpB | 193 | flgG | 22 | cusF | 2 |
| tsx | 1971 | mltC | 187 | mdtJ | 21 | mdtP | 2 |
| pal | 1945 | mdtC | 166 | mdtD | 19 | yfeN | 2 |
| skp | 1553 | lpoB | 155 | ydeT | 17 | mdtN | 2 |
| bamD | 1544 | macA | 153 | slp | 16 | csgF | 2 |
| acrA | 1505 | loiP | 137 | yceK | 16 | yjbF | 1 |
| mepS | 1303 | mltF | 134 | mdtI | 13 | csgB | 1 |
| lpp | 1168 | yaiW | 131 | chiP | 12 | envY | 1 |
| borD | 1167 | bhsA | 119 | pagP | 11 | ybgQ | 1 |
| nmpC | 1146 | pqiC | 114 | yedS | 11 | acrS | 1 |
| cirA | 1127 | rsxG | 107 | yjbH | 10 | uidC | 1 |
| bamC | 1123 | rcsF | 105 | rhsD | 9 | csgE | 0 |
| ygiB | 1115 | yfaZ | 101 | elfC | 9 | ompL | 0 |
| flu | 1064 | cusR | 99 | rhsB | 9 | ompG | 0 |
| lptA | 1052 | nfrA | 98 | yfcU | 8 | rzoD | 0 |
| mlaA | 1042 | cusS | 92 | lamB | 8 | rzoR | 0 |
| ybhC | 1021 | acrR | 85 | pgaB | 8 | yddL | 0 |
| lptE | 924 | yghG | 83 | sfmD | 8 | appX | ND |
| bamE | 732 | fhuE | 81 | htrE | 8 | bcsC | ND |
| rlpA | 637 | amiD | 80 | mdtH | 7 | epcC | ND |
| lpoA | 620 | yddB | 76 | yiaT | 7 | qseG | ND |
| fiu | 607 | acrD | 72 | mliC | 7 | ychO | ND |
| btuB | 489 | ecnB | 69 | mdtE | 7 | ypjB | ND |
| tamB | 408 | mdtB | 64 | flgH | 7 | yzcX | ND |
| mltB | 406 | mdtA | 54 | csgG | 6 | ||
| pldA | 404 | ecnA | 51 | hofQ | 6 | ||
| ppk | 404 | mdtM | 49 | ompW | 6 |
Additional files
Download links
A two-part list of links to download the article, or parts of the article, in various formats.
Downloads (link to download the article as PDF)
Open citations (links to open the citations from this article in various online reference manager services)
Cite this article (links to download the citations from this article in formats compatible with various reference manager tools)
Fast bacterial growth reduces antibiotic accumulation and efficacy
eLife 11:e74062.
https://doi.org/10.7554/eLife.74062


