Homeostatic interferon-lambda response to bacterial microbiota stimulates preemptive antiviral defense within discrete pockets of intestinal epithelium
- Department of Molecular Microbiology and Immunology, Oregon Health & Science University, United States
- Department of Medicine, Washington University School of Medicine, United States
- Department of Pathology and Immunology, Washington University School of Medicine, United States
Figures
Figure 1 with 3 supplements

Bacterial microbiota stimulate interferon-lambda (IFN-λ) response genes in the ileum at homeostasis.
(A) Depiction of experimental treatments and comparison groups. Following the indicated treatments, a segment of whole ileum tissue was harvested and analyzed by RNA sequencing for differentially expressed genes between paired conditions. (B–E) Gene set enrichment analysis of INTERFERON_ALPHA_RESPONSE hallmark genes (interferon-stimulated genes [ISGs]) was performed with the following comparisons: wild-type (WT) mice treated with 25 µg of IFN-λ relative to WT mice treated with PBS (B), WT mice treated with antibiotics (ABX) relative to untreated WT mice (C), Ifnlr1-/- mice relative to WT mice (D), and Ifnlr1-/- mice treated with ABX relative to untreated Ifnlr1-/- mice (E). Normalized enrichment score (NES) and false discovery rate (FDR) are overlaid for each comparison with significant FDR’s highlighted (red). (F) A Venn diagram depicting the total number of differentially expressed genes that are (i) increased with IFN-λ stimulation (orange), (ii) decreased with ABX treatment (green), or (iii) decreased in Ifnlr1-/- mice relative to WT (blue). An overlapping subset of 21 genes was shared among all three comparisons (red box). (G) A graph and heatmap of the relative expression of the 21 genes that overlap in all experimental groups in (F) (‘homeostatic ISGs’). Statistical significance in (G) was determined by one-way ANOVA with Tukey’s multiple comparisons where ns = p > 0.05 and **** = p < 0.0001.
-
Figure 1—source data 1
Gene set enrichment analysis, differential gene expression analysis, and counts of homeostatic interferon-stimulated genes (ISGs) from RNA sequencing analysis.
- https://cdn.elifesciences.org/articles/74072/elife-74072-fig1-data1-v2.xlsx
Figure 1—figure supplement 1
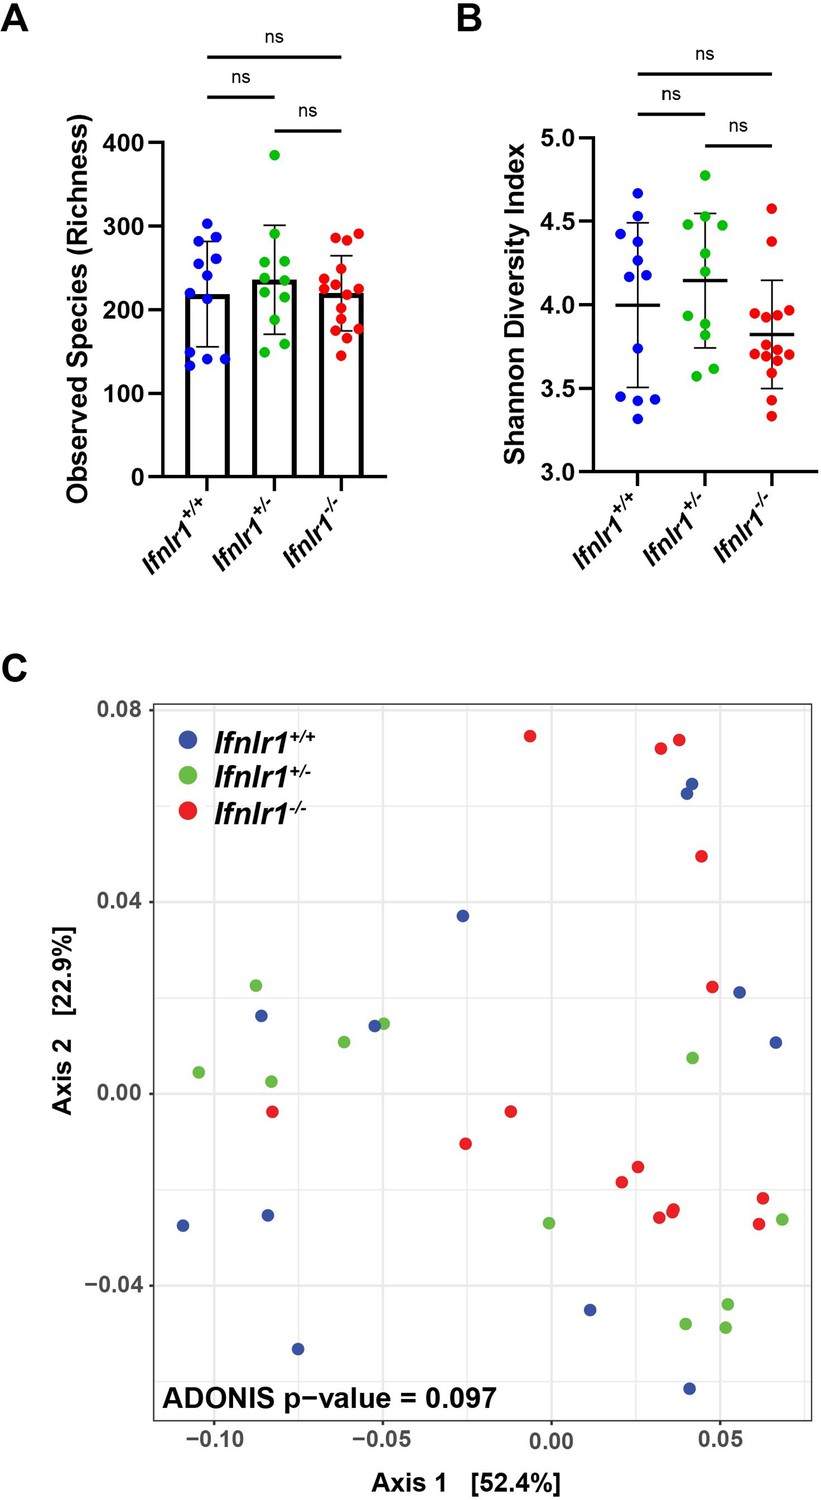
Ifnlr1 deficiency does not alter intestinal bacterial microbiota.
Stool was harvested from Ifnlr1+/+, Ifnlr1+/-, and Ifnlr1-/- mice and 16S rRNA genes were sequenced. Alpha-diversity metrics of observed bacterial species (A) and Shannon Diversity Index (B). (C). Principal component analysis of beta-diversity UniFrac distances. Statistical significance was determined by one-way ANOVA with Tukey’s multiple comparisons, where ns = p > 0.05.
-
Figure 1—figure supplement 1—source data 1
Values and statistical tests of Observed Species and Shannon Diversity Index from 16S rRNA sequencing.
- https://cdn.elifesciences.org/articles/74072/elife-74072-fig1-figsupp1-data1-v2.xlsx
Figure 1—figure supplement 2
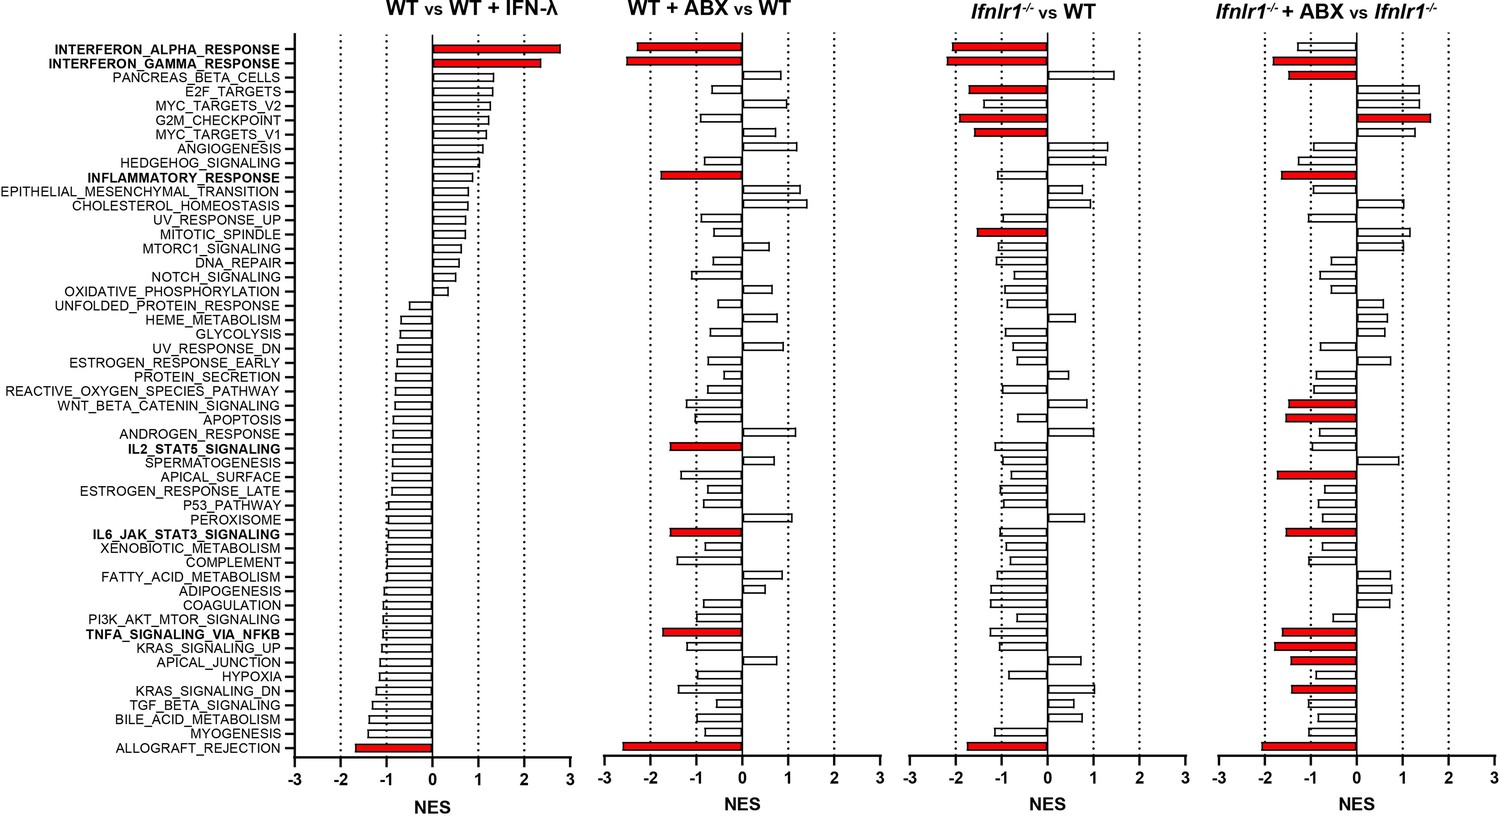
Gene set enrichment analysis of hallmark gene sets.
Log2 counts from RNA sequencing output were assessed for enrichment and depletion of hallmark gene sets by gene set enrichment analysis. Graphs of normalized enrichment score (NES) are displayed for each hallmark gene set and each comparison. Gene sets in red are statistically significantly altered in their given comparison.
-
Figure 1—figure supplement 2—source data 1
Full results of gene set enrichment analysis for HALLMARK genes in Figure 1 RNA sequencing dataset.
- https://cdn.elifesciences.org/articles/74072/elife-74072-fig1-figsupp2-data1-v2.xlsx
Figure 1—figure supplement 3
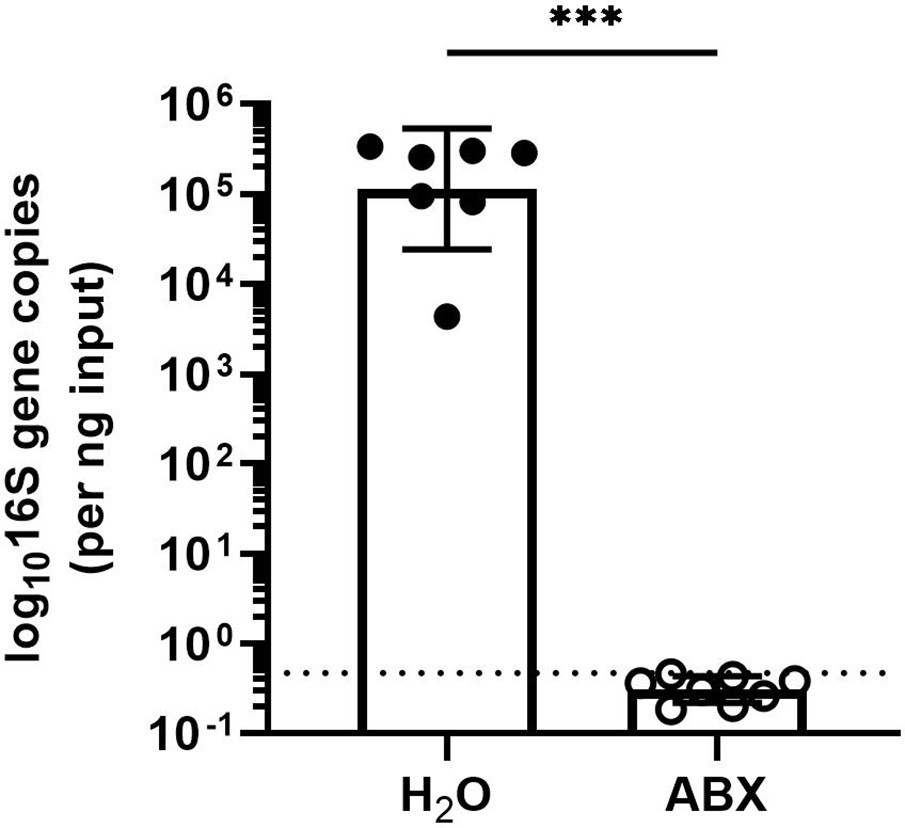
Treatment with antibiotics (ABX) reduces enteric 16S gene copies to below the limit of detection.
rDNA was isolated from luminal contents of mice after 14 days of ABX treatment. 16S gene copies were assessed by quantitative PCR (qPCR) and normalized to input. Limit of detection: dashed line. Data points represent individual mice and are pooled from two independent experiments. Statistical significance was determined by Mann Whitney, where *** = p < 0.001.
-
Figure 1—figure supplement 3—source data 1
Values and statistical test of 16S gene copies with antibiotics (ABX) treatment.
- https://cdn.elifesciences.org/articles/74072/elife-74072-fig1-figsupp3-data1-v2.xlsx
Figure 2 with 2 supplements

Homeostatic, microbiota- and Ifnlr1-dependent interferon-stimulated genes (ISGs) are primarily expressed in intestinal tissues.
A segment of ileum or colon tissue from wild-type (WT) or Ifnlr1-/- mice was harvested following H2O or antibiotics (ABX) treatment and the ISGs Ifit1, Stat1, and Oas1a were analyzed by quantitative PCR (qPCR). Transcripts were quantified in ileum (A), colon (B), or mesenteric lymph node (MLN) and spleen (C) with normalization to untreated WT mice. Data points represent individual mice and data are pooled from 10 to 20 independent experiments in (A–B) and 15 independent experiments in (C). Statistical significance was determined by one-way ANOVA with Tukey’s multiple comparisons in (A–B) and Dunnett’s multiple comparisons in (C). * = p < 0.05, ** = p < 0.01, *** = p < 0.001, **** = p < 0.0001.
-
Figure 2—source data 1
Values and statistical tests of interferon-stimulated genes (ISG) expression in ileum, colon, mesenteric lymph node (MLN), and spleen.
- https://cdn.elifesciences.org/articles/74072/elife-74072-fig2-data1-v2.xlsx
Figure 2—figure supplement 1
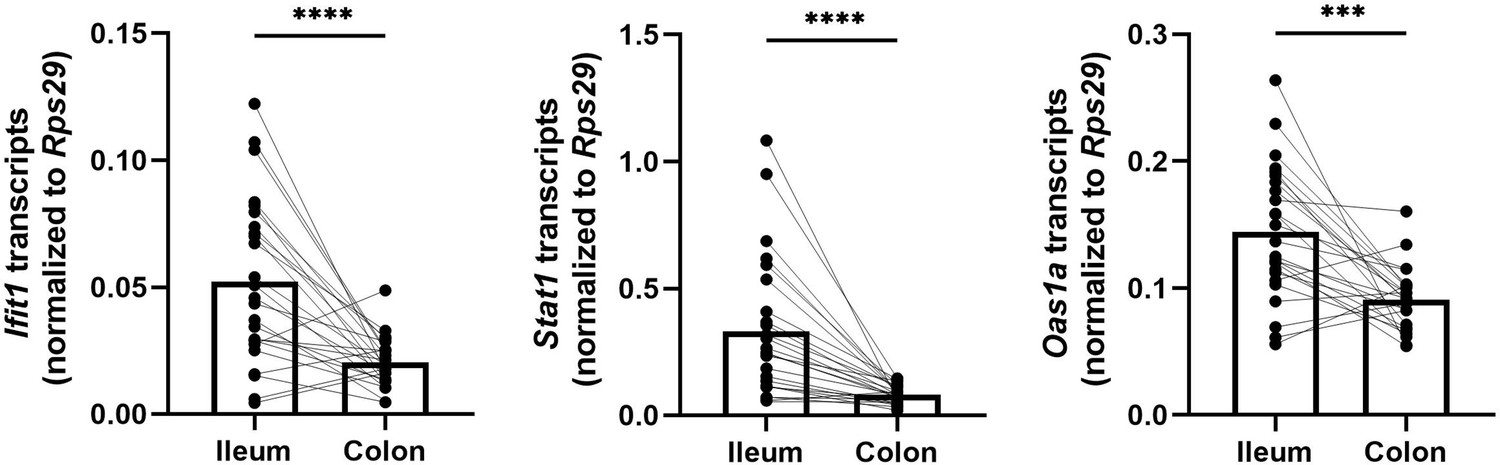
Homeostatic interferon-stimulated genes (ISGs) are more abundantly expressed in the ileum than in the colon.
Ifit1, Stat1, and Oas1a expression was quantified from the ileum and colon tissue of wild-type (WT) mice. Data points represent individual mice and are pooled from five independent experiments. Statistical significance was determined by paired t-test where *** = p < 0.001 and **** = p < 0.0001.
-
Figure 2—figure supplement 1—source data 1
Values and statistical tests of interferon-stimulated gene (ISG) expression between the ileum and colon.
- https://cdn.elifesciences.org/articles/74072/elife-74072-fig2-figsupp1-data1-v2.xlsx
Figure 2—figure supplement 2
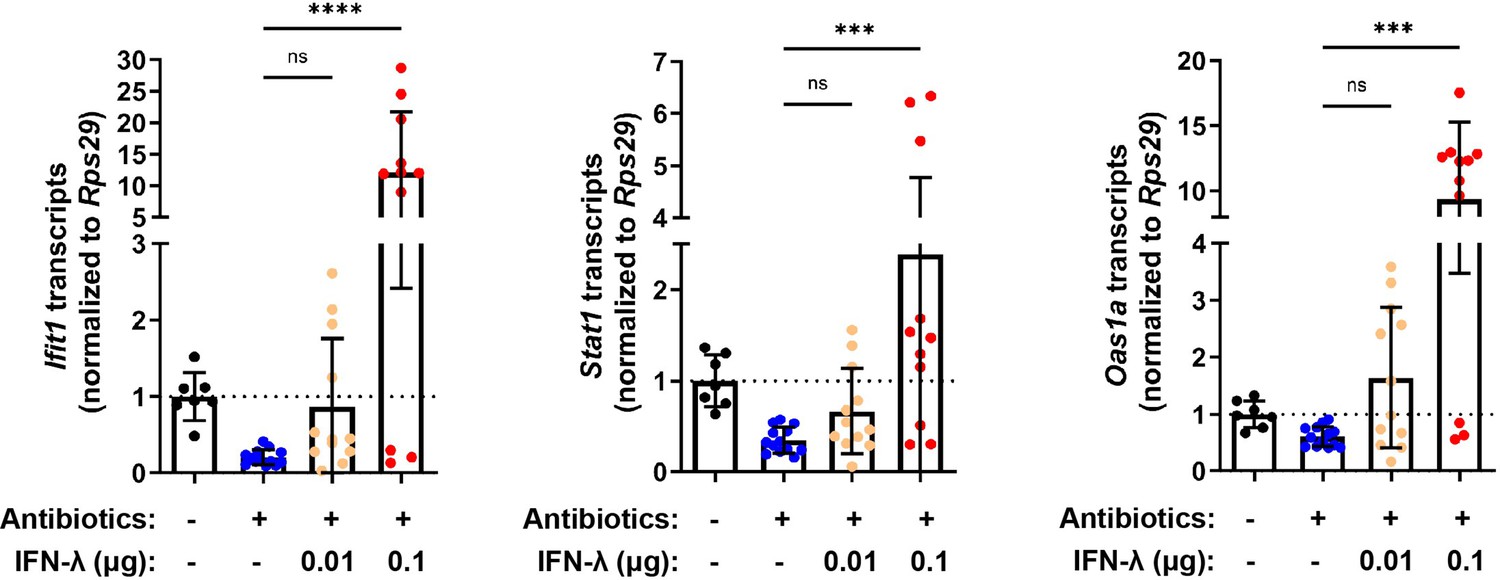
Treatment with antibiotics (ABX) does not ablate responsiveness to interferon-lambda (IFN-λ).
Ifit1, Stat1, and Oas1a expression was quantified in the ileum of wild-type (WT) mice treated with or without ABX and was normalized to untreated mice. Increasing quantities of IFN-λ were intraperitoneally injected into ABX-treated mice to rescue basal interferon-stimulated gene (ISG) expression. Data points represent individual mice and are pooled from three independent experiments. Statistical significance was determined by Kruskal-Wallis test with Dunn’s multiple comparisons with *** = p < 0.001 and **** = p < 0.0001.
-
Figure 2—figure supplement 2—source data 1
Values and statistical tests of interferon-stimulated gene (ISG) expression in antibiotics (ABX)-treated mice stimulated with interferon-lambda (IFN-λ).
- https://cdn.elifesciences.org/articles/74072/elife-74072-fig2-figsupp2-data1-v2.xlsx
Figure 3
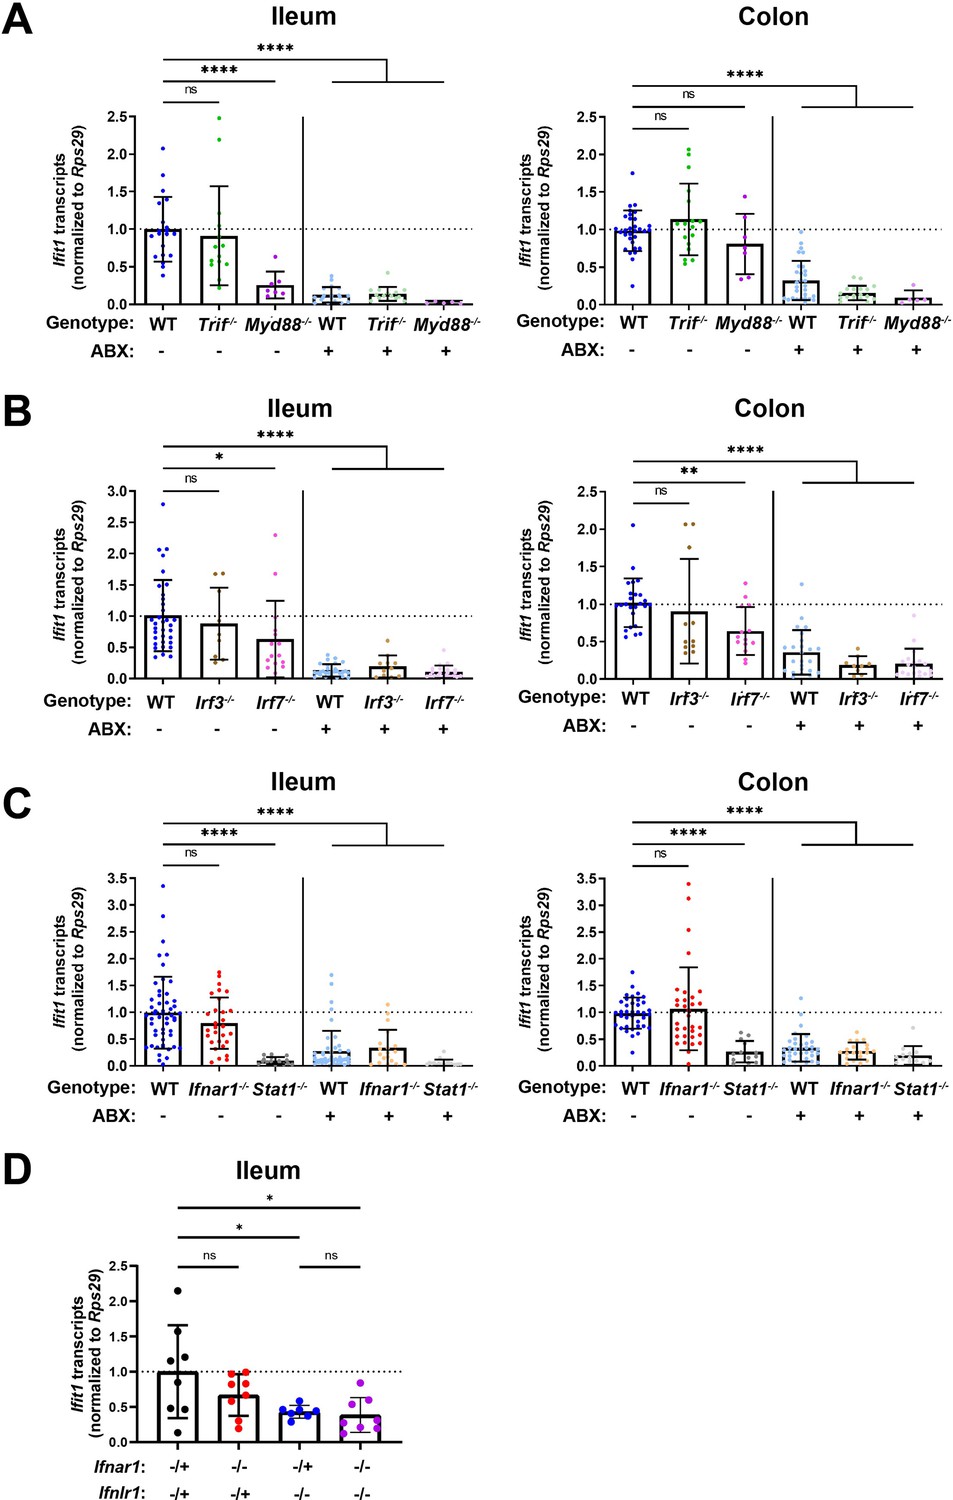
Homeostatic interferon-stimulated gene (ISG) expression is independent of type I interferon (IFN).
Ifit1 expression levels were assessed by quantitative PCR (qPCR) from the ileum or colon of (A) Trif-/- and Myd88-/-, (B) Irf3-/- and Irf7-/-, or (C) Ifnar1-/- and Stat1-/- mice treated with or without antibiotics (ABX) normalized to untreated, wild-type (WT) mice. Some WT controls are shared across experiments in (A–C). (D) Ifit1 expression was measured by qPCR in ileum tissue of indicated genotypes. Data points represent individual mice and are pooled from at least six independent experiments in (A–C) and two independent experiments in (D). Statistical significance was determined by one-way ANOVA with Dunnett’s multiple comparisons in (A–C) and one-way ANOVA with Tukey’s multiple comparisons in D, where * = p < 0.05, ** = p < 0.01, *** = p < 0.001, **** = p < 0.0001.
-
Figure 3—source data 1
Values and statistical tests of interferon-stimulated gene (ISG) expression in the ileum and colon of genetic knockout mice.
- https://cdn.elifesciences.org/articles/74072/elife-74072-fig3-data1-v2.xlsx
Figure 4
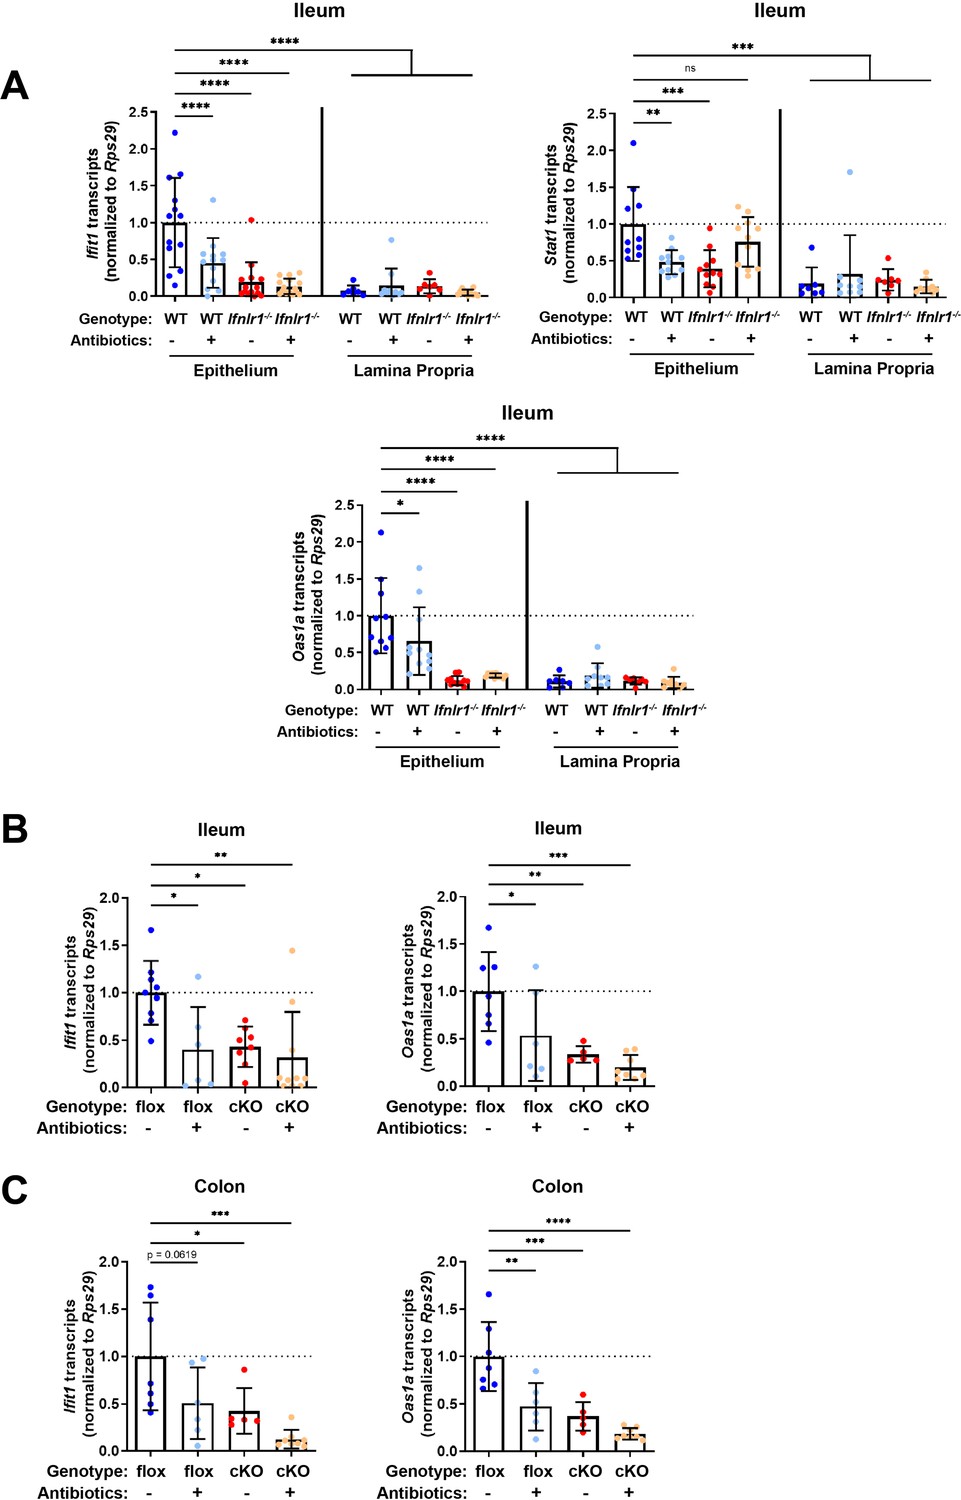
Homeostatic interferon-stimulated gene (ISG) expression in the intestine is restricted to epithelial cells.
(A) Ifit1, Stat1, and Oas1a expression was quantified in stripped epithelial cells or in the lamina propria cells of the ileum. Comparisons were performed between wild-type (WT) and Ifnlr1-/- mice with or without antibiotics (ABX) treatment, and ISG expression was normalized to WT values. (B–C) Ifit1 and Oas1a expression from the (B) ileum or (C) colon of mice with conditional presence (flox) or absence (cKO) of Ifnlr1 in intestinal epithelial cells. Data points represent individual mice and are pooled from three independent experiments in (A) and two independent experiments in (B–C). Statistical significance was determined by one-way ANOVA with Dunnett’s multiple comparisons. * = p < 0.05, ** = p < 0.01, *** = p < 0.001.
-
Figure 4—source data 1
Values and statistical tests of interferon-stimulated gene (ISG) expression in the ileum and colon of genetic knockout mice.
- https://cdn.elifesciences.org/articles/74072/elife-74072-fig4-data1-v2.xlsx
Figure 5 with 1 supplement
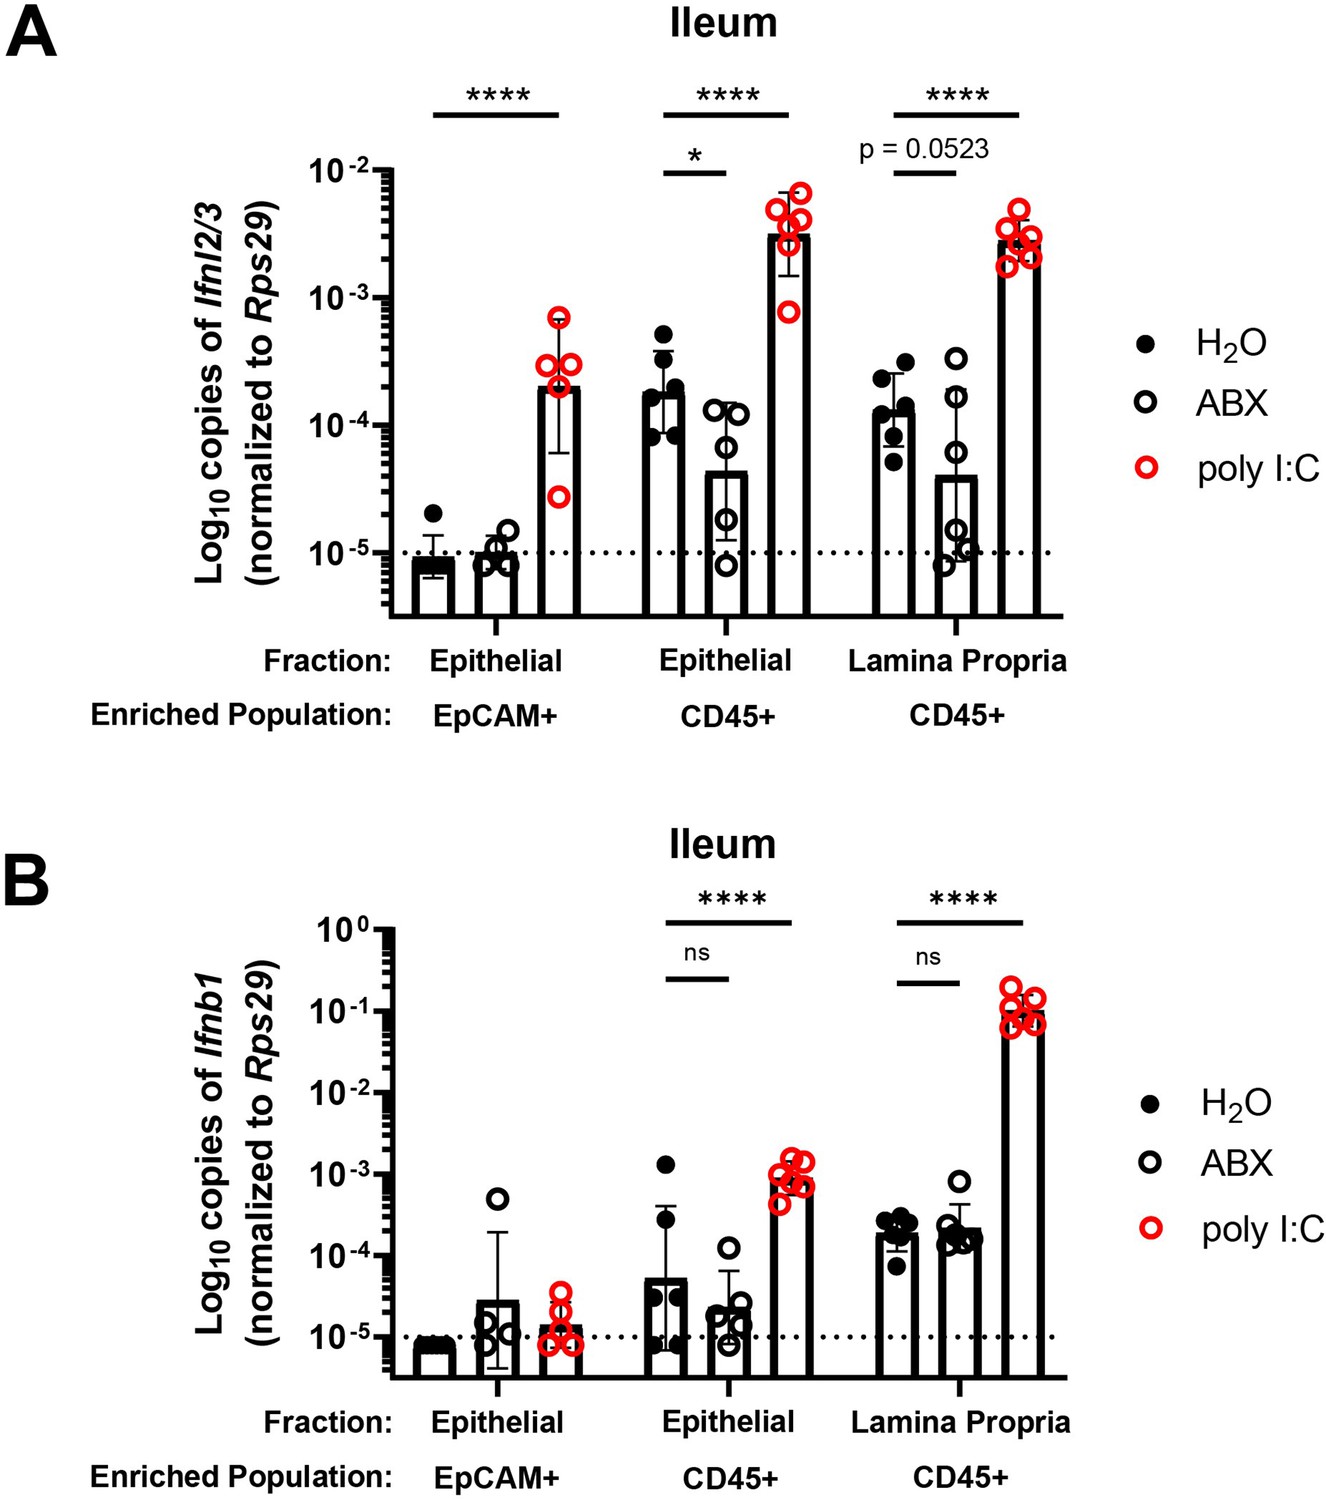
Bacterial microbiota stimulate expression of Ifnl2/3 by CD45+ cells.
(A–B) Cellular suspensions from the ileal epithelium and lamina propria were harvested from wild-type (WT) mice treated with H2O, ABX, or stimulated with poly I:C. Resulting cells were enriched for EpCAM-positive and CD45+ cells by magnetic separation. Ifnl2/3 expression (A) and Ifnb1 expression (B) were quantified from each enriched cellular fraction by quantitative PCR (qPCR). Data points represent individual mice and are pooled from two independent experiments. Statistical significance was determined by two-way ANOVA with Dunnett’s multiple comparisons, where * = p < 0.05 and **** = p < 0.0001.
-
Figure 5—source data 1
Values and statistical tests of interferon expression by CD45+ cells in the ileum.
- https://cdn.elifesciences.org/articles/74072/elife-74072-fig5-data1-v2.xlsx
Figure 5—figure supplement 1
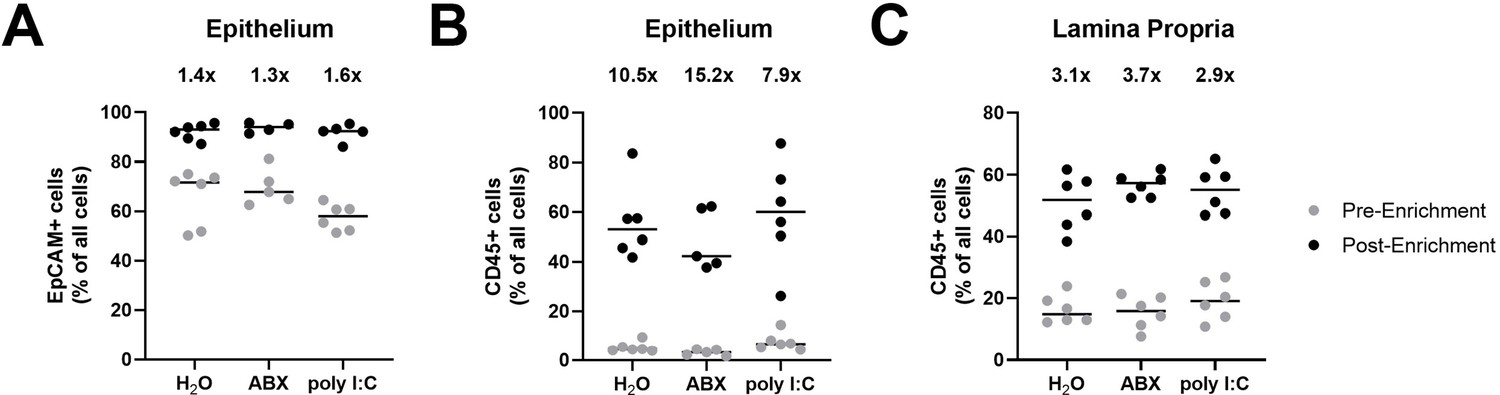
Enrichment of EpCAM+ and CD45+ cells from the intestinal epithelium and lamina propria.
(A–C) The ileal epithelium and lamina propria were harvested from wild-type (WT) mice treated with H2O, antibiotics (ABX), or stimulated with poly I:C. Resulting cell suspensions were enriched for EpCAM-positive and CD45+ cells, and the purity of all live and dead cells pre- and post-enrichment was quantified by flow cytometry. The percentage of live and dead cell events with surface expression of (A) EpCAM or (B) CD45 prior to and following enrichment from stripped intestinal epithelium. (C) The percentage of live and dead cell events with surface expression of CD45 prior to and following CD45 enrichment from isolated lamina propria. Mean fold enrichment for each condition is noted above each column. Data points represent individual mice and are pooled from two independent experiments.
-
Figure 5—figure supplement 1—source data 1
Values and statistical tests for the enrichment of cells isolated from the ileum.
- https://cdn.elifesciences.org/articles/74072/elife-74072-fig5-figsupp1-data1-v2.xlsx
Figure 6 with 2 supplements

Homeostatic interferon-stimulated gene (ISG) expression in the small intestine is highly localized.
The ilea of wild-type (WT), Ifnlr1flox/flox, or Ifnlr1 intestinal epithelial cell (IEC)-cKO mice were harvested, processed into a Swiss rolls, and stained by in situ hybridization for the ISGs, Ifit1 (red), and Usp18 (green), with a DAPI (blue) counterstain.(A) Representative high-magnification images of co-localized Ifit1 (red) and Usp18 (green) expression in the ileum of WT mice, see arrows. (B–D) WT mice treated with H2O control or antibiotics (ABX) with quantification of Ifit1 area relative to the total area of the section across replicate mice. (E–G) Ifnlr1flox/flox or Ifnlr1 IEC-cKO mice at homeostasis with quantification of Ifit1 area relative to the total area of the section across replicate mice. Scale bar = 100 µm in (A) and 500 µm in (B–G). Statistical significance was calculated by unpaired t-test where ** = p < 0.01. Each data point in (D) and (G) represents an individual mouse from two independent experiments.
-
Figure 6—source data 1
Values and statistical tests of Ifit1 area in the ileum of treated and genetic knockout mice.
- https://cdn.elifesciences.org/articles/74072/elife-74072-fig6-data1-v2.xlsx
Figure 6—figure supplement 1
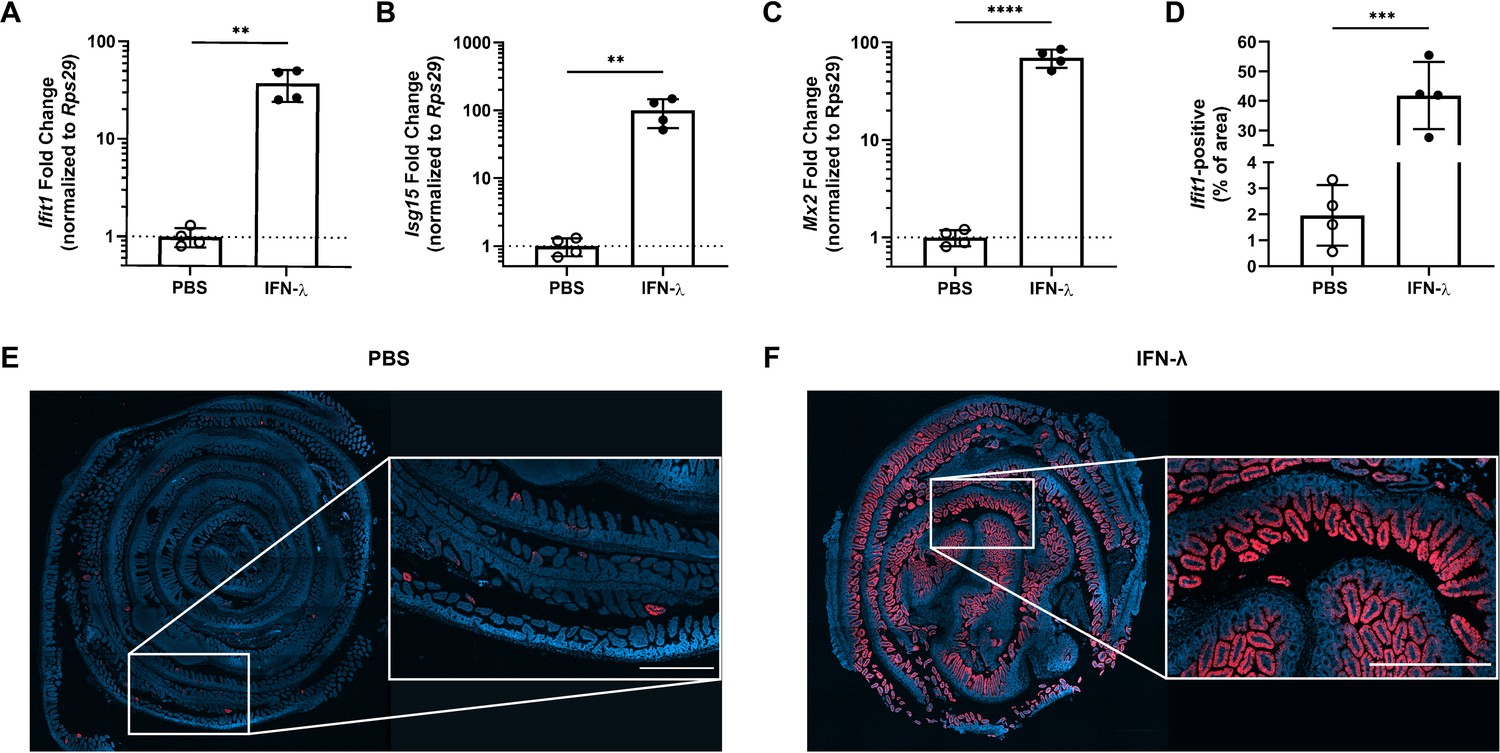
The entire intestinal epithelium is responsive to interferon-lambda (IFN-λ).
Wild-type mice were injected with PBS or 3 µg of pegylated IFN-λ3. The ileum was harvested after 4 hr and a small section was assessed for expression of the interferon-stimulated genes (ISGs): Ifit1 (A), Isg15 (B), and Mx2 (C) by quantitative PCR (qPCR). The remaining tissue was stained by RNAscope for the ISG, Ifit1 (red), with a DAPI (blue) counterstain. (D) Quantification of Ifit1 area relative to the total area of the section across replicate mice. (E–F) Representative images from the ileum of mice injected with PBS (E) or IFN-λ (F). Scale bar = 500 µm in insets. Data points represent individual mice from a single experiment. Statistical significance was determined by unpaired t-test with ** = p < 0.01, *** = p < 0.001, and **** = p < 0.0001.
-
Figure 6—figure supplement 1—source data 1
Values and statistical tests of interferon-stimulated gene (ISG) expression in the ileum of interferon-lambda (IFN-λ)-treated mice.
- https://cdn.elifesciences.org/articles/74072/elife-74072-fig6-figsupp1-data1-v2.xlsx
Figure 6—figure supplement 2
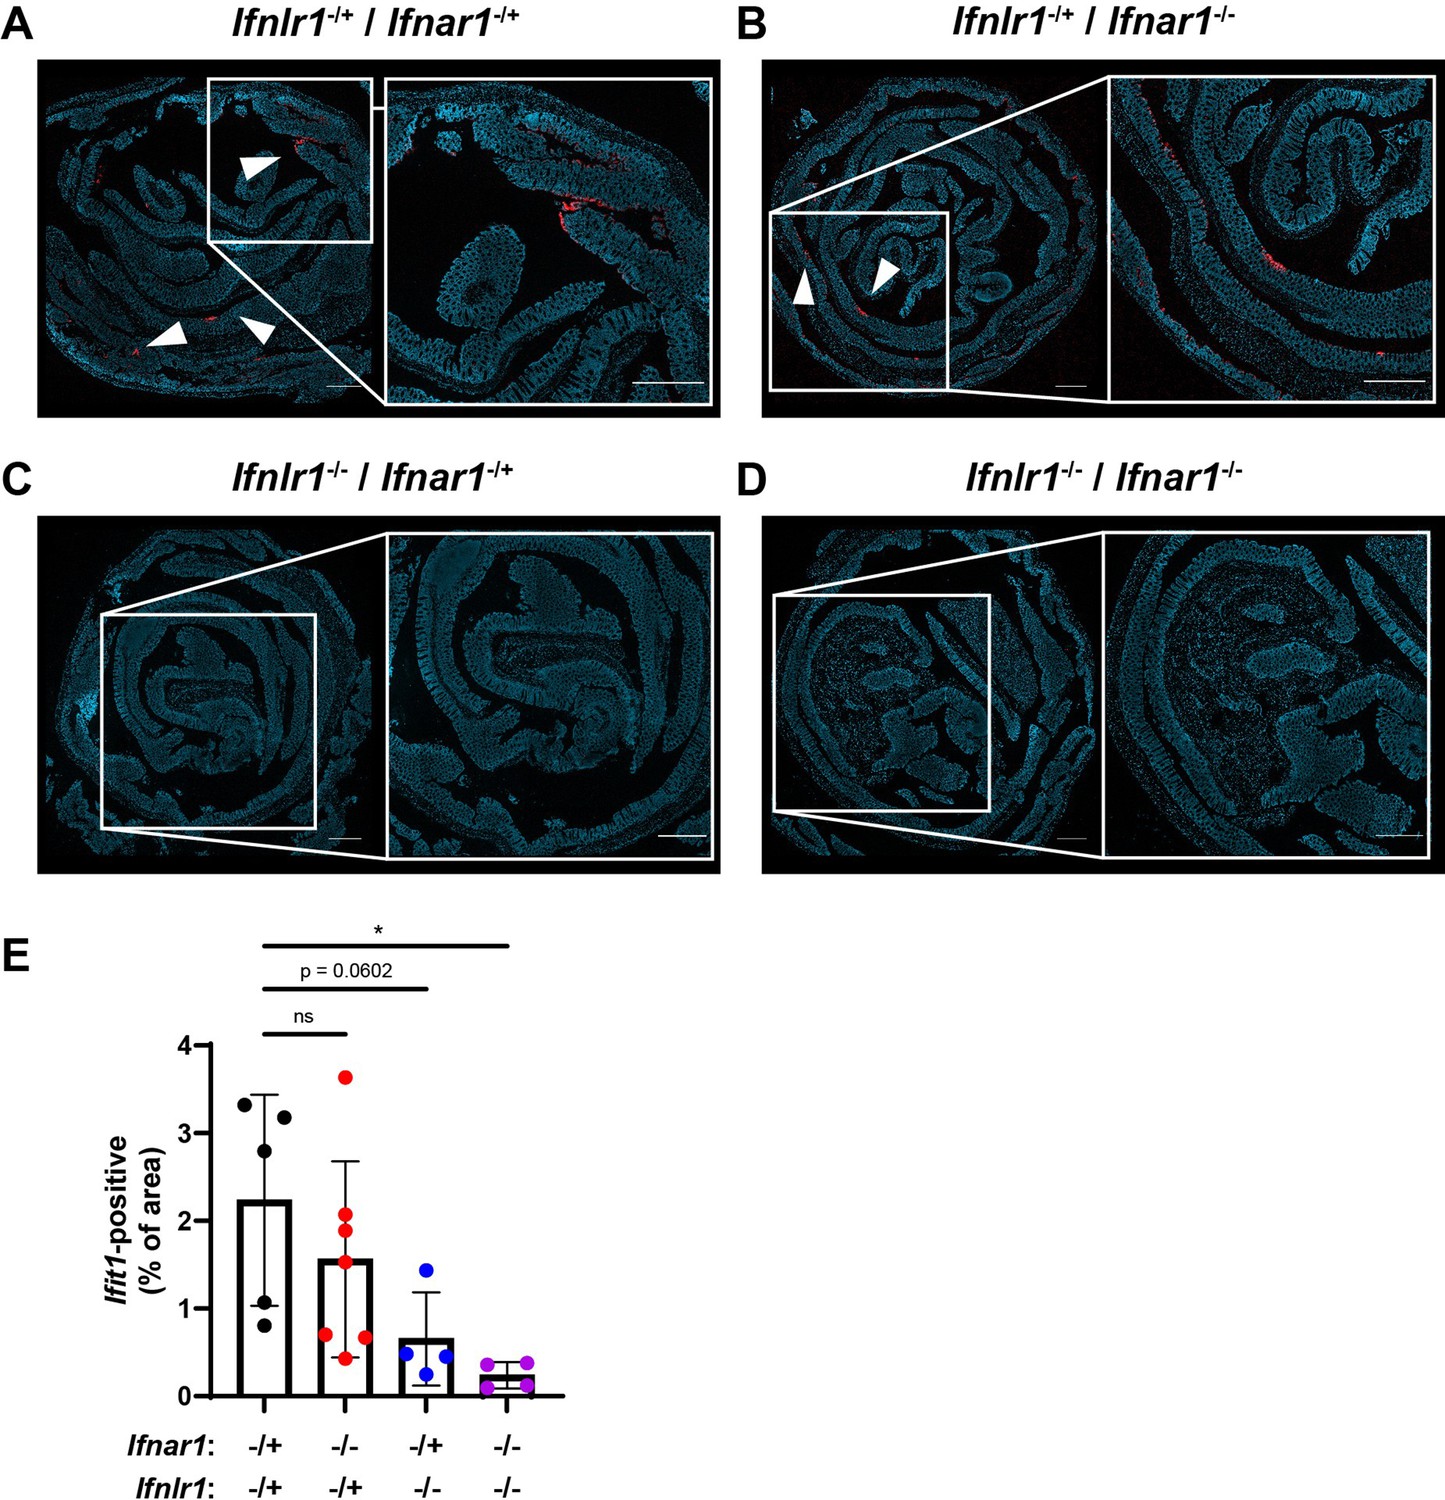
Homeostatic interferon-stimulated gene (ISG) expression is also highly localized in the colon.
The colon of Ifnlr1-/+/Ifnar1-/+, Ifnlr1-/+/Ifnar1-/-, Ifnlr1-/-/Ifnar1-/+, and Ifnlr1-/-/Ifnar1-/- mice was harvested and stained by RNAscope for the ISG, Ifit1 (red), with a DAPI (blue) counterstain. Representative images from (A) Ifnlr1-/+/Ifnar1-/+, (B) Ifnlr1-/+/Ifnar1-/-, (C) Ifnlr1-/-/Ifnar1-/+, and (D) Ifnlr1-/-/Ifnar1-/- mice with (E) quantification of Ifit1 area from individual mice. Data are representative of two independent experiments. Scale bar = 500 µm.
-
Figure 6—figure supplement 2—source data 1
Values and statistical tests of Ifit1 area in the ileum of genetic knockout mice.
- https://cdn.elifesciences.org/articles/74072/elife-74072-fig6-figsupp2-data1-v2.xlsx
Figure 7

Mature enterocytes express homeostatic interferon-stimulated genes (ISGs) in public single-cell datasets from mouse and human.
(A–B) A mouse intestinal epithelial cell (IEC) single-cell transcriptional dataset (Haber et al., 2017) (GSE92332) was analyzed to determine the percentage of each epithelial cell subtypes that express homeostatic ISGs. (A) Heatmap depicting the proportion of each epithelial cell type expressing 19 of the 21 homeostatic ISGs identified in Figure 1. (B) Enterocyte subtypes (blue text) and crypt-resident progenitor subtypes (green text) cells were grouped and the percentage of cells that express each homeostatic ISG was compared. (C–D) A human IEC single-cell transcriptional dataset (Elmentaite et al., 2020) (E-MTAB-8901) was analyzed for the percentage of epithelial cell subtypes that express homeostatic ISGs. (C) A heatmap depicting the percentage of IEC subtypes that express human orthologs of murine homeostatic ISGs identified in Figure 1. (D) The mature enterocyte subtype (blue text) and crypt-resident progenitor subtypes (green text) were grouped and the percentage of cells that express each homeostatic ISG was compared. Lines in (B) and (D) link paired ISGs in each IEC subset. Statistical significance in (B) and (D) was calculated by Wilcoxon test where * = p < 0.05, and *** = p < 0.001.
-
Figure 7—source data 1
Values and statistical tests of the percentage of cells expressing individual interferon-stimulated genes (ISGs) in single-cell RNA sequencing datasets.
- https://cdn.elifesciences.org/articles/74072/elife-74072-fig7-data1-v2.xlsx
Figure 8 with 1 supplement

Assessing the effect of peroral bacterial products on localized homeostatic interferon-stimulated genes (ISGs) in antibiotics (ABX)-treated mice.
The ilea of treated wild-type (WT), Ifnlr1flox/flox, and Ifnlr1 intestinal epithelial cell (IEC)-cKO mice were harvested, processed into Swiss rolls, and stained by in situ hybridization for the ISG, Ifit1 (red), with a DAPI (blue) counterstain. (A–C) Representative images from Ifnlr1flox/flox mice treated with H2O control followed by PBS stimulation (A), ABX followed by PBS stimulation (B), or from Ifnlr1 IEC-cKO mice (B). (D) Representative images of Ifnlr1flox/flox mice treated with H2O control followed by lipopolysaccharide (LPS) stimulation. (E–F) Two representative images of Ifnlr1flox/flox mice treated with ABX followed by LPS stimulation (E) or ABX followed by fecal transplantation (F). (G) A representative image of Ifnlr1 IEC-cKO mice treated with ABX followed by LPS stimulation. (H) Quantification of Ifit1 area relative to the total area of each tissue section with a dashed line at the highest Ifnlr1 IEC-cKO value. The proportion of Ifit1-positive mice (above dashed line) and Ifit1-negative mice (below dashed line) are tabulated (I) and graphed (J) for Ifnlr1flox/flox mice of each condition. (K) rDNA was isolated from the luminal contents of mice at endpoint harvest. 16S gene copies were assessed by quantitative PCR (qPCR) and normalized to input. Limit of detection: dashed line. Where depicted, scale bar = 500 µm. Data points represent individual mice and are pooled from four independent experiments in (A–J) and from two independent experiments in (K). Statistical significance was determined by Kruskal-Wallis with Dunn’s multiple comparisons in (H), by one-way ANOVA with Dunnett’s multiple comparisons in (K), and by Fisher’s exact tests in (J) where * = p < 0.05, ** = p < 0.01, and **** = p < 0.0001.
-
Figure 8—source data 1
Values and statistical tests of Ifit1 area, the proportion of Ifit1-positive cells, and 16S gene copies.
- https://cdn.elifesciences.org/articles/74072/elife-74072-fig8-data1-v2.xlsx
Figure 8—figure supplement 1
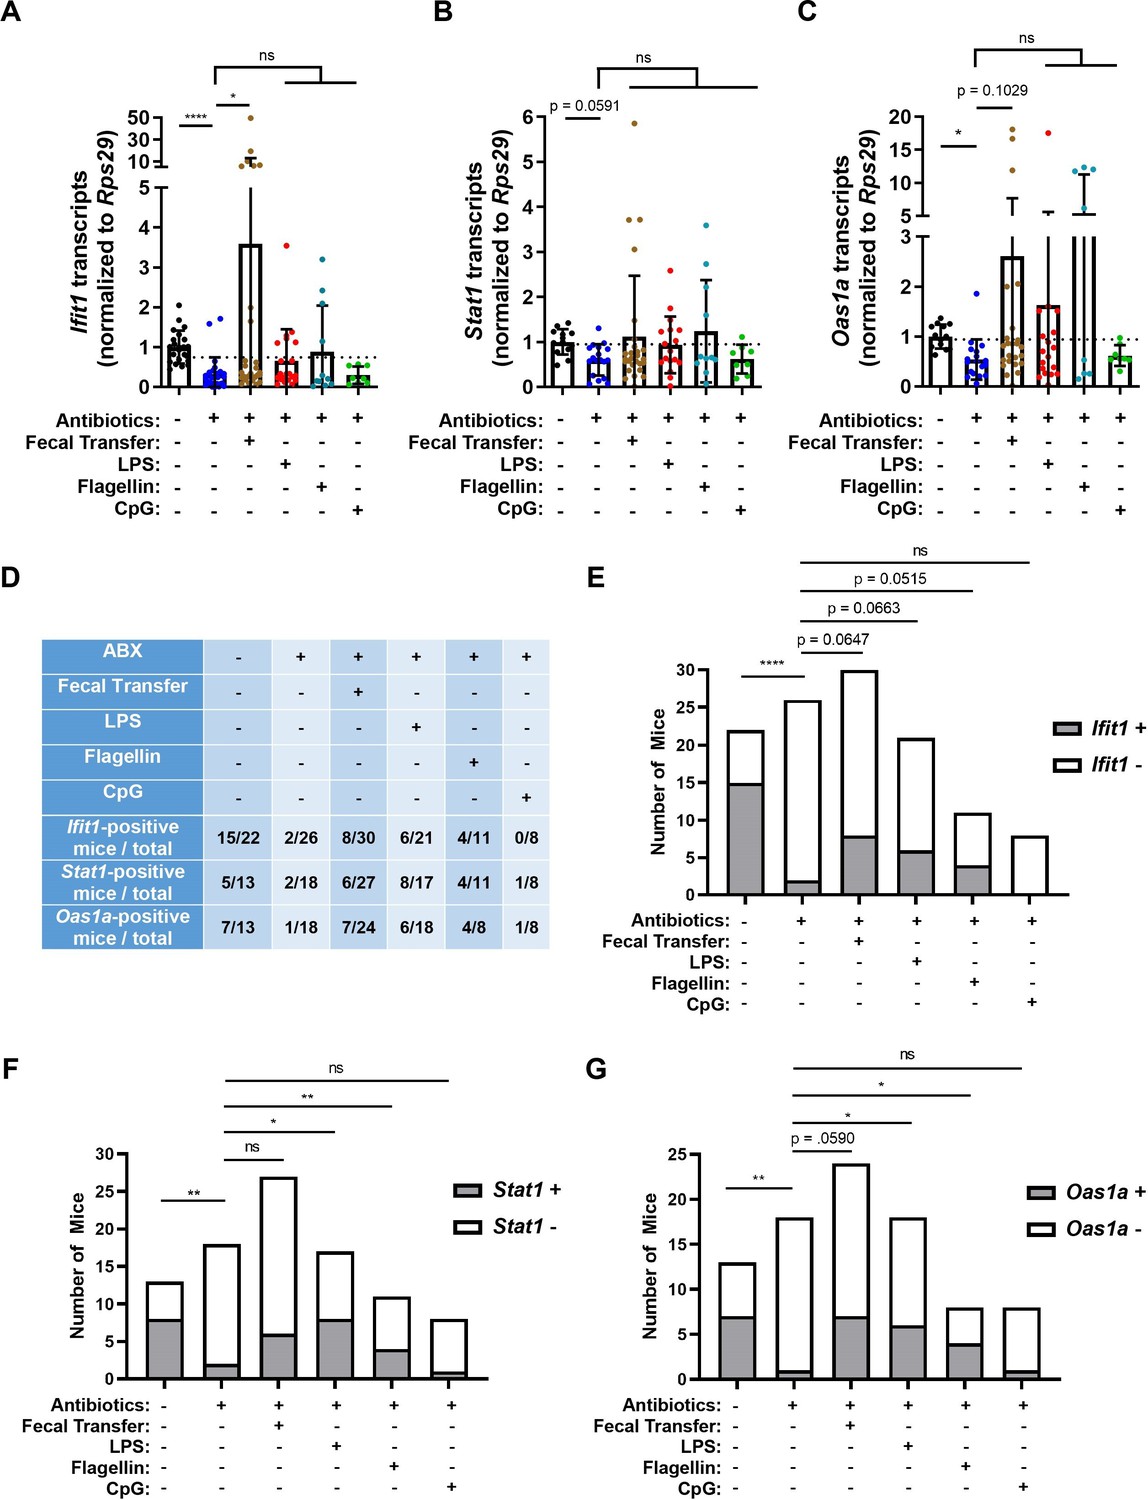
Assessing the effect of peroral bacterial products on homeostatic interferon-stimulated genes (ISGs) in antibiotics (ABX)-treated mice.
The ileum of treated wild-type (WT), Ifnlr1flox/flox, and Ifnlr1 intestinal epithelial cell (IEC)-cKO mice was harvested and Ifit1 (A), Stat1 (B), and Oas1a (C) was quantified by quantitative PCR (qPCR). Delineation of positive ISG expression was conservatively selected as one standard deviation above the mean of ABX-treated mice (dashed line). Mice were binned into ISG-positive (above dashed line) or ISG-negative (below dashed line) groups and are tabulated for each condition in (D). The proportion of mice with expression of Ifit1 (E), Stat1 (F), and Oas1a (G) are graphed for each condition. Data points represent individual mice and are pooled from three to nine independent experiments. Statistical significance was determined by Kruskal-Wallis with Dunn’s multiple comparisons (A–C) and by Fisher’s exact test (E–G) where * = p < 0.05, ** = p < 0.01, and **** = p < 0.0001.
-
Figure 8—figure supplement 1—source data 1
Values and statistical tests of interferon-stimulated gene (ISG) expression and the proportion of Ifit1-positive cells.
- https://cdn.elifesciences.org/articles/74072/elife-74072-fig8-figsupp1-data1-v2.xlsx
Figure 9 with 3 supplements
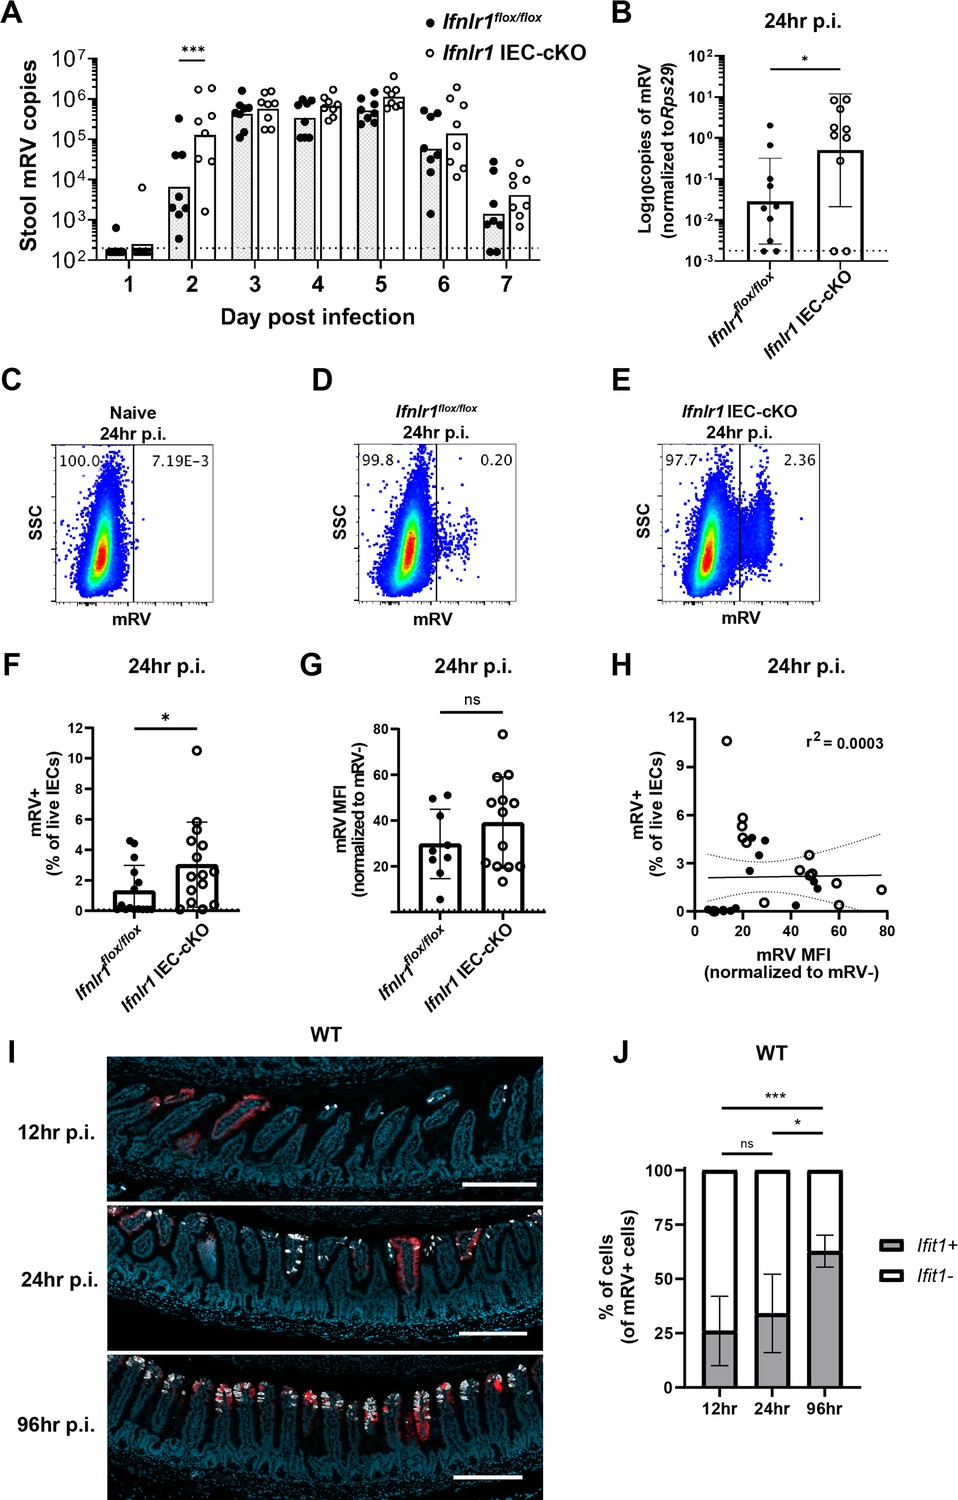
The homeostatic interferon-lambda (IFN-λ) response preemptively protects intestinal epithelial cells (IECs) from murine rotavirus (mRV) infection.
Ifnlr1flox/flox and Ifnlr1 IEC-cKO mice were infected with 100 SD50 (A) or 5000 SD50 (B–H) of mRV and stool (A) or stripped ileal IECs (B–G) were assessed for mRV infection. (A) Timecourse of mRV genome copies detected in the stool of Ifnlr1flox/flox and Ifnlr1 IEC-cKO mice by quantitative PCR (qPCR). (B–G) Mechanically stripped IEC fractions were analyzed by qPCR for mRV genome copies (B) or flow cytometry for mRV antigen-positive IECs (C–G). Representative flow cytometry plots of naïve (C), Ifnlr1flox/flox (D), and Ifnlr1 IEC-cKO (E) mice infected with mRV with quantification in (F). (G) The median fluorescence intensity (MFI) of mRV antigen in infected cells relative to uninfected cells. (H) A linear correlation plot of mRV+ cells and mRV MFI with 95% confidence intervals (dashed lines). (I–J) Wild-type (WT) mice were infected with 5000 SD50 of mRV and the ilea were processed into Swiss rolls and stained by in situ hybridization for the interferon-stimulated gene (ISG), Ifit1, or mRV. The percentage of mRV-infected cells that were Ifit1-positive and Ifit1-negative were determined. Additional representative images for (I–J) are depicted in Figure 9—figure supplement 2. Where designated in (A–G), dashed lines = limit of detection (LOD) as set by naïve mice. Data points represent individual mice and are pooled from two to three independent experiments. Statistical significance was determined by two-way ANOVA with Sidak’s multiple comparisons (A), by Mann Whitney (B, F), unpaired t-test (G), or Kruskal-Wallis with Dunn’s multiple comparisons (J), where * = p < 0.05 and *** = p < 0.001.
-
Figure 9—source data 1
Values and statistical tests of murine rotavirus (mRV) genomes, percentages of cells infected, median fluorescence intensity (MFI), and % of cells mRV+ cells co-staining with Ifit1 expression.
- https://cdn.elifesciences.org/articles/74072/elife-74072-fig9-data1-v2.xlsx
Figure 9—figure supplement 1
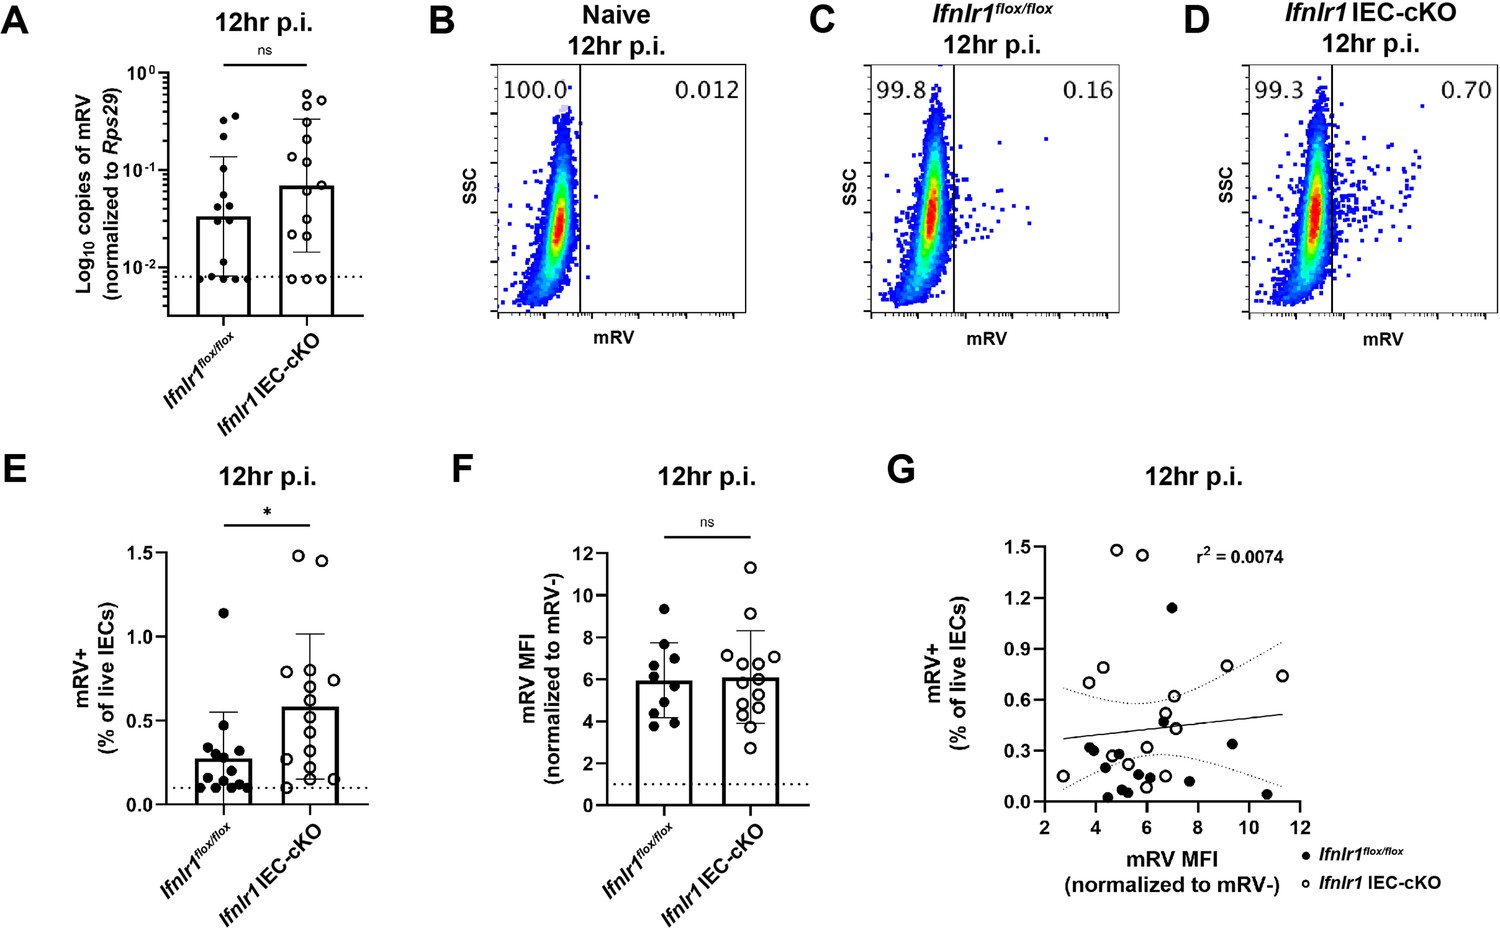
The homeostatic interferon-lambda (IFN-λ) response preemptively protects intestinal epithelial cells (IECs) from murine rotavirus (mRV) infection.
Ifnlr1flox/flox and Ifnlr1 IEC-cKO mice were infected with 5000 SD50 of mRV by oral gavage and stripped ileal IEC fractions were analyzed by quantitative PCR (qPCR) for mRV genome copies (A) or flow cytometry for mRV antigen-positive IECs (B–F). Representative flow cytometry plots of naïve (B), Ifnlr1flox/flox (C), and Ifnlr1 IEC-cKO (D) mice infected with mRV. (E) The percentage of mRV+ live IECs for each genotype. (F) The median fluorescence intensity (MFI) of mRV antigen in infected cells relative to uninfected cells. (G) A linear correlation plot of mRV+ cells and mRV MFI with 95% confidence intervals (dashed lines). Where designated in (A, E–F), dashed lines = limit of detection (LOD) as set by naïve mice. Data points represent individual mice and are pooled from three independent experiments. Statistical significance was calculated by Mann Whitney (A, E), or unpaired t-test (F) where * = p < 0.05.
-
Figure 9—figure supplement 1—source data 1
Values and statistical tests of murine rotavirus (mRV) genomes, percentages of cells infected, and median fluorescence intensity (MFI).
- https://cdn.elifesciences.org/articles/74072/elife-74072-fig9-figsupp1-data1-v2.xlsx
Figure 9—figure supplement 2
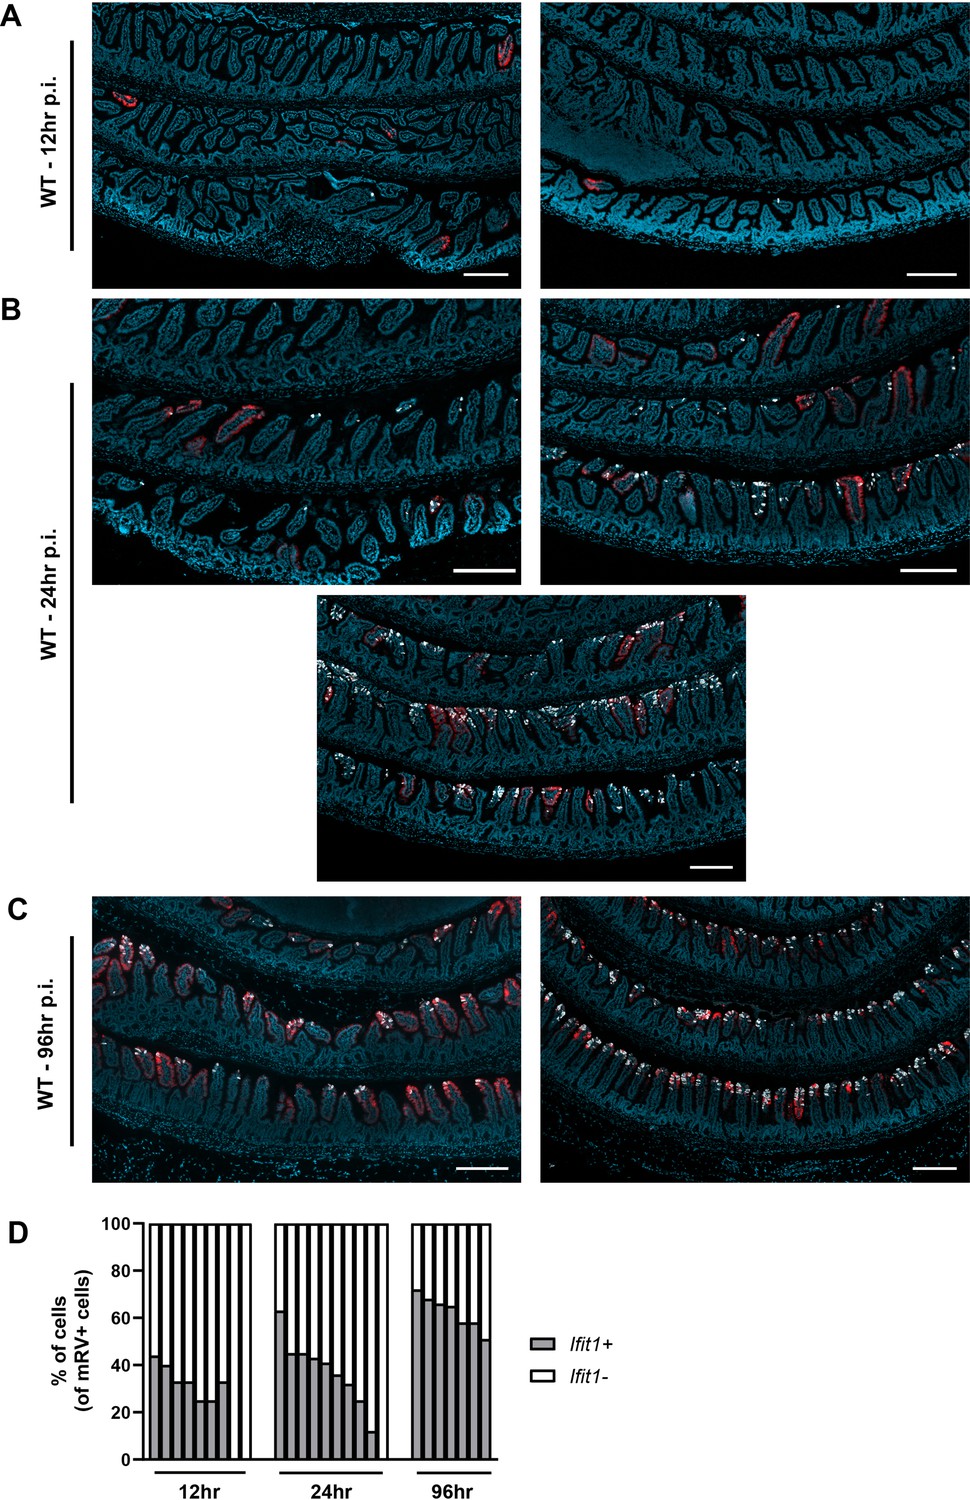
Murine rotavirus (mRV) and Ifit1 co-incidence.
Wild-type (WT) mice were infected with 5000 SD50 of mRV by oral gavage and the ilea were processed into Swiss rolls and stained by in situ hybridization for the interferon-stimulated gene (ISG), Ifit1 (red), and mRV RNA (white), with a DAPI (blue) counterstain. Representative images of ileum from (A) 12 hr post-inoculation, (B) 24 hr post-inoculation, and (C) 96 hr post-inoculation, where each image represents an individual mouse. (D) The percentage of mRV-infected cells that are Ifit1-positive and -negative for each individual mouse. Where displayed, scale bar = 200 µm.
-
Figure 9—figure supplement 2—source data 1
Percentage values of murine rotavirus (mRV)+ cells co-staining with Ifit1 expression.
- https://cdn.elifesciences.org/articles/74072/elife-74072-fig9-figsupp2-data1-v2.xlsx
Figure 9—figure supplement 3
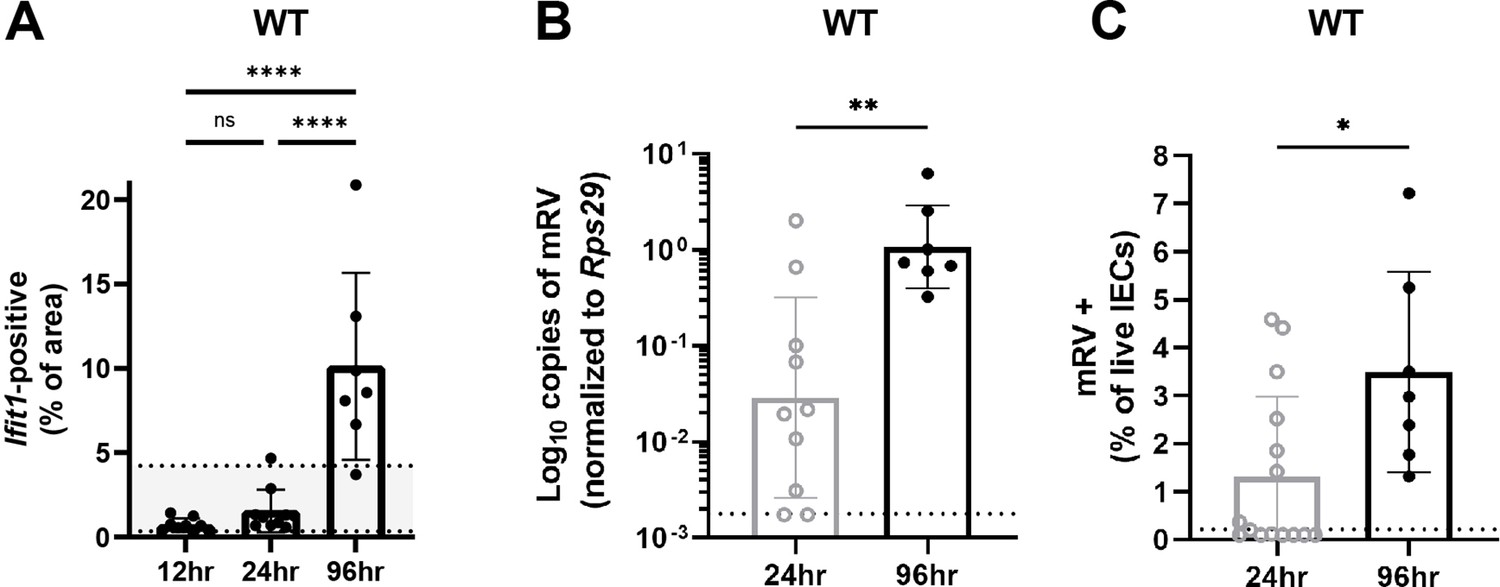
Murine rotavirus (mRV) infection increases the distribution of Ifit1 expression at late times post-inoculation.
Wild-type (WT) mice were infected with 5000 SD50 of mRV and the ilea were processed into Swiss rolls and stained by in situ hybridization for the interferon-stimulated gene (ISG), Ifit1 (red) with a DAPI (blue) counterstain. (A) Quantification of Ifit1 area relative to the total area of each tissue section with highlighted area representing historical range of Ifit1 area in naive WT mice. In parallel, stripped ileal intestinal epithelial cell (IEC) fractions were analyzed by quantitative PCR (qPCR) for mRV genome copies (B) or flow cytometry for mRV antigen-positive IECs (C). For comparison in (B–C), 24 hr data is historical and duplicated from Ifnlr1flox/flox samples presented in Figure 9. Where displayed, scale bar = 500 µm, and where designated, dashed lines = limit of detection (LOD) as set by naïve mice. Data points represent individual mice and are pooled from two independent experiments. Statistical significance was calculated by one-way ANOVA with Tukey’s multiple comparisons (A) and Mann Whitney (B–C), where ** = p < 0.005 and **** = p < 0.0001.
-
Figure 9—figure supplement 3—source data 1
Values and statistical tests of Ifit1 area, murine rotavirus (mRV) genomes, and percentage of mRV-infected cells.
- https://cdn.elifesciences.org/articles/74072/elife-74072-fig9-figsupp3-data1-v2.xlsx
Author response image 1
Additional files
Download links
A two-part list of links to download the article, or parts of the article, in various formats.
Downloads (link to download the article as PDF)
Open citations (links to open the citations from this article in various online reference manager services)
Cite this article (links to download the citations from this article in formats compatible with various reference manager tools)
Homeostatic interferon-lambda response to bacterial microbiota stimulates preemptive antiviral defense within discrete pockets of intestinal epithelium
eLife 11:e74072.
https://doi.org/10.7554/eLife.74072


