Effector membrane translocation biosensors reveal G protein and βarrestin coupling profiles of 100 therapeutically relevant GPCRs
- Institute for Research in Immunology and Cancer (IRIC), and Department of Biochemistry and Molecular Medicine, Université de Montréal, Canada
- Domain Therapeutics North America, Canada
- Department of Drug Design and Pharmacology, University of Copenhagen, Denmark
- Internal Medicine Research Unit, Pfizer Worldwide Research, Development and Medical, United States
- Pfizer Global R&D, United States
- Domain Therapeutics, France
Figures
Figure 1
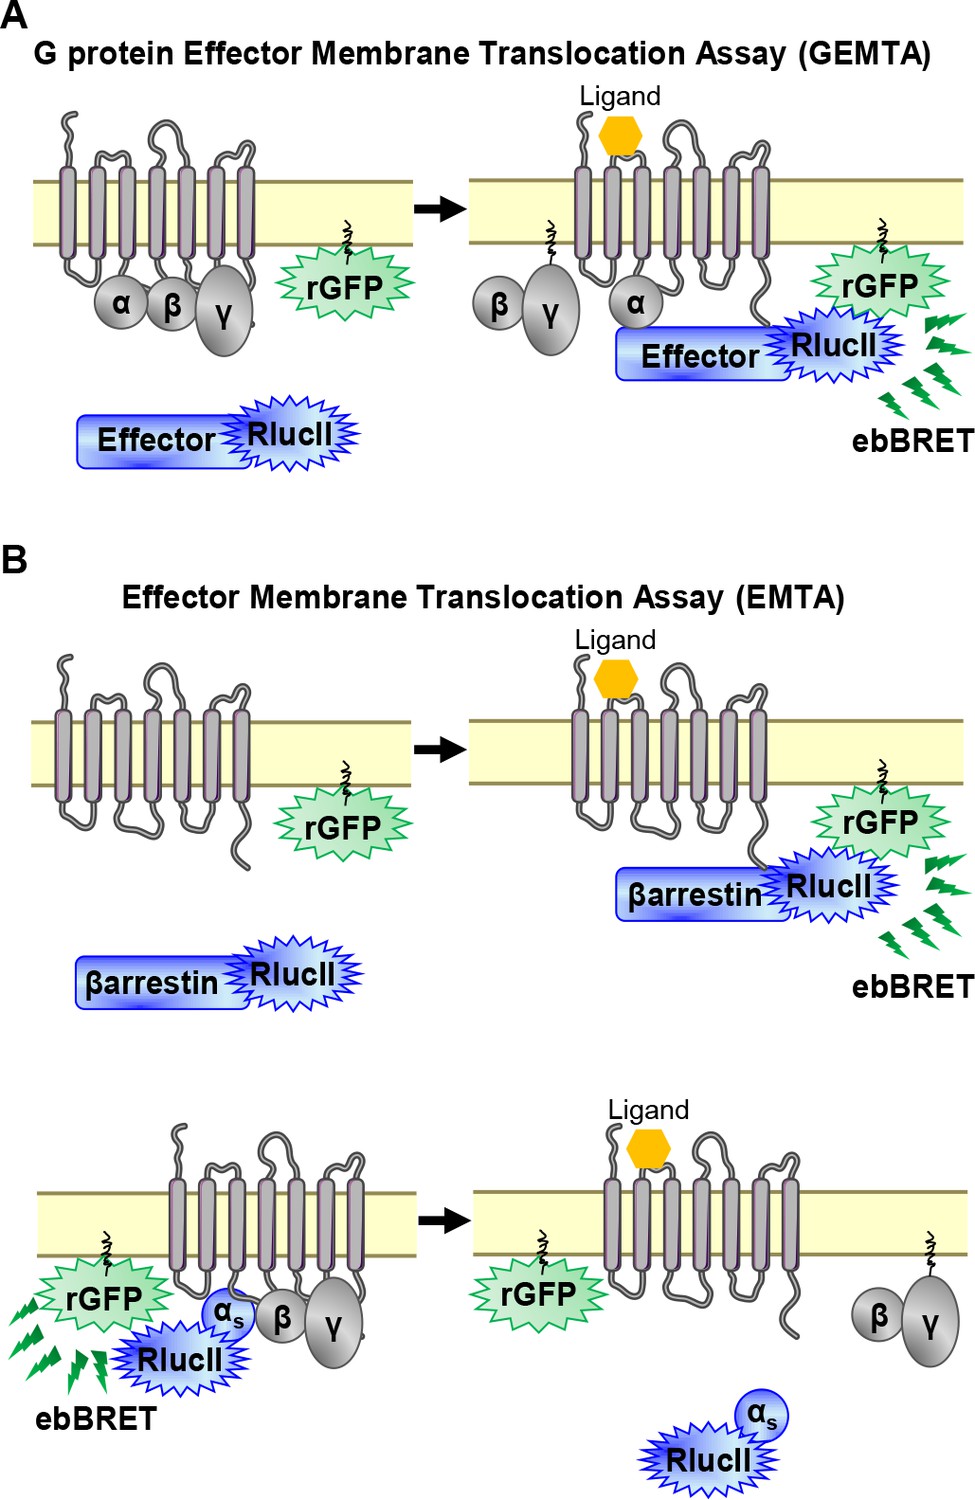
EMTA ebBRET platform to monitor G protein activation and βarrestin recruitment.
(A) Schematic of the G protein Effector Membrane Translocation Assay (GEMTA) to monitor Gα protein activation. Upon receptor activation, RlucII-tagged effector proteins (Effector-RlucII) translocate towards and interact with active Gα subunits from each G protein family, leading to increased ebBRET. (B) Principle of the Effector Membrane Translocation Assay (EMTA) monitoring βarrestin recruitment to the plasma membrane (top) and Gαs activation (bottom). Top; upon receptor activation, RlucII-tagged βarrestins (βarrestin-RlucII) translocate to the plasma membrane, thus increasing ebBRET with rGFP-CAAX. Bottom; Internalization of activated RlucII-tagged Gαs (Gαs-RlucII) following receptor stimulation decreases ebBRET with the membrane-anchored rGFP-CAAX.
Figure 2 with 6 supplements
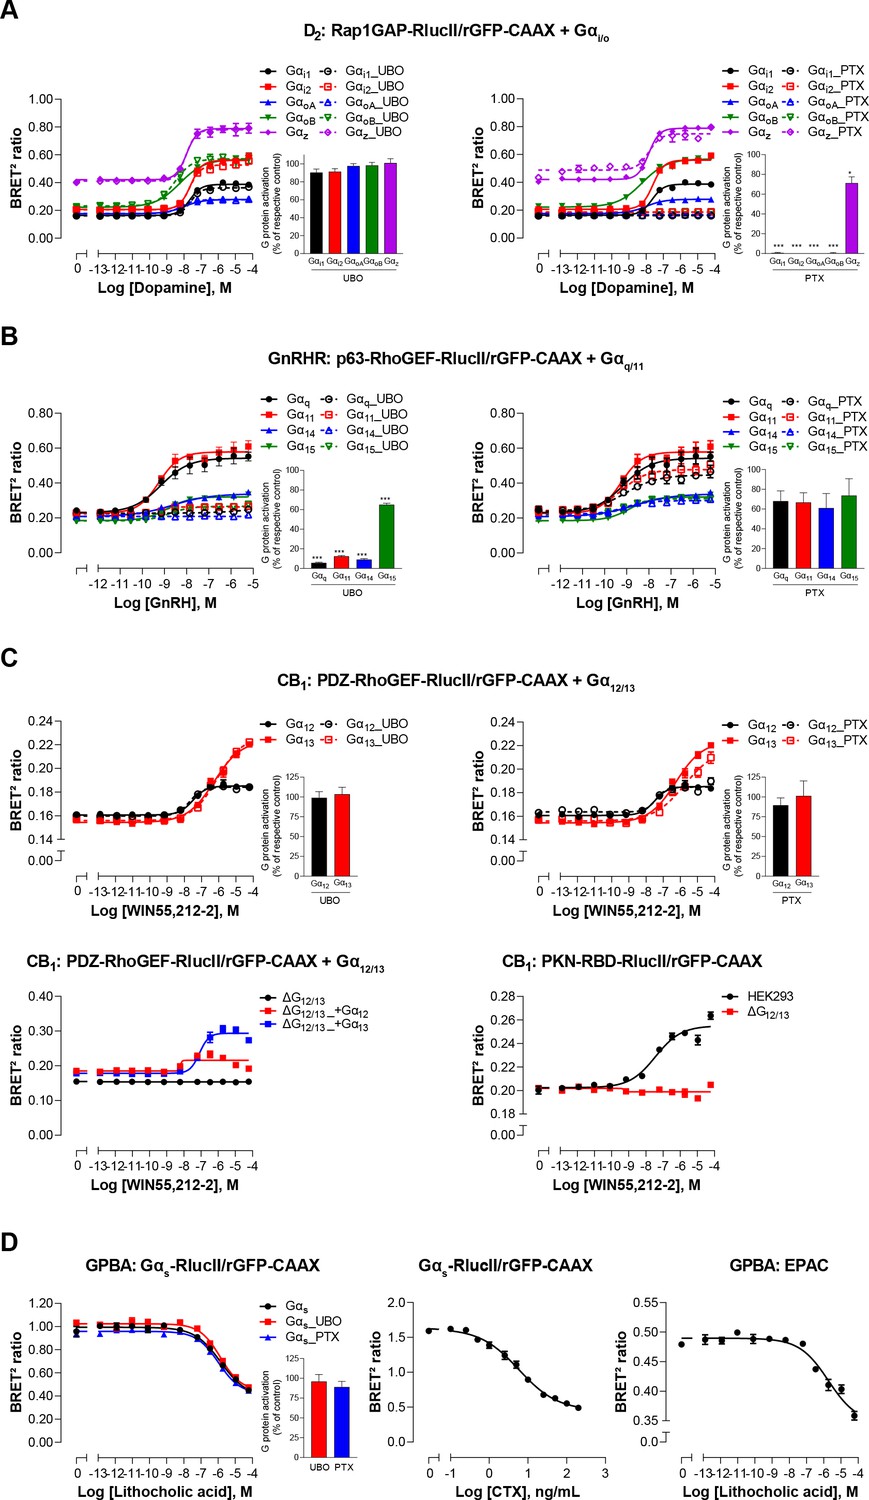
Validation of EMTA ebBRET-based platform to monitor Gα protein activation.
(A) Pharmacological validation of the Gαi/o activation sensor. HEK293 cells were transfected with the D2 receptor and the Gαi/o family-specific sensor, along with each Gαi/o subunit. Concentration-response curve using the Gαi/o activation sensor, in the presence or absence of UBO-QIC (left) or PTX (right) inhibitors. Insets; Emax values determined from concentration-response curves of inhibitor-pretreated cells. (B) Pharmacological validation of the Gαq/11 activation sensor. HEK293 cells were transfected with the GnRH receptor and the Gαq/11 family-specific sensor, along with each Gαq/11 subunit. Concentration-response curve using Gαq/11 activation sensor, in the presence or absence of UBO-QIC (left) or PTX (right) inhibitors. Insets; Emax values determined from dose-response curves of inhibitor-pretreated cells. (C) Validation of the Gα12/13 activation sensor. Cells were transfected with the CB1 receptor and one of the Gα12/13 activation sensors, along with the Gα12 or Gα13 subunits. Concentration-response curves of HEK293 cells (top) or the parental and devoid of G12/13 (ΔG12/13) HEK293 cells (bottom) using the PDZ-RhoGEF-RlucII/rGFP-CAAX (top and bottom left) or PKN-RBD-RlucII/rGFP-CAAX (bottom right) sensors, pretreated or not with UBO-QIC or PTX (top). (D) Pharmacological validation of the Gαs activation sensor. HEK293 cells were transfected with the GPBA receptor and the Gαs activation (left and central) or the EPAC (right) sensors. Left: Concentration-response curves using the Gαs activation sensor in the presence or absence of UBO-QIC or PTX, inhibitors of Gαq or Gαi/o, respectively. Central: Concentration-response activation of the Gαs sensor using CTX, a Gαs activator. Right: Concentration-response curve using the EPAC sensor. Inset; Emax values determined from dose-response curves of inhibitors-pretreated cells. Data are expressed as BRET ratio for the concentration-response curves or expressed in % of respective control cells (Emax graphs) and are the mean ± SEM of 3 (A–C) or 4 (D) independent experiments performed in one replicate. Unpaired t-test (A–D): *p < 0.05 and ***p < 0.001 compared to control cells.
-
Figure 2—source data 1
Raw data of Figure 2.
- https://cdn.elifesciences.org/articles/74101/elife-74101-fig2-data1-v2.xlsx
Figure 2—figure supplement 1
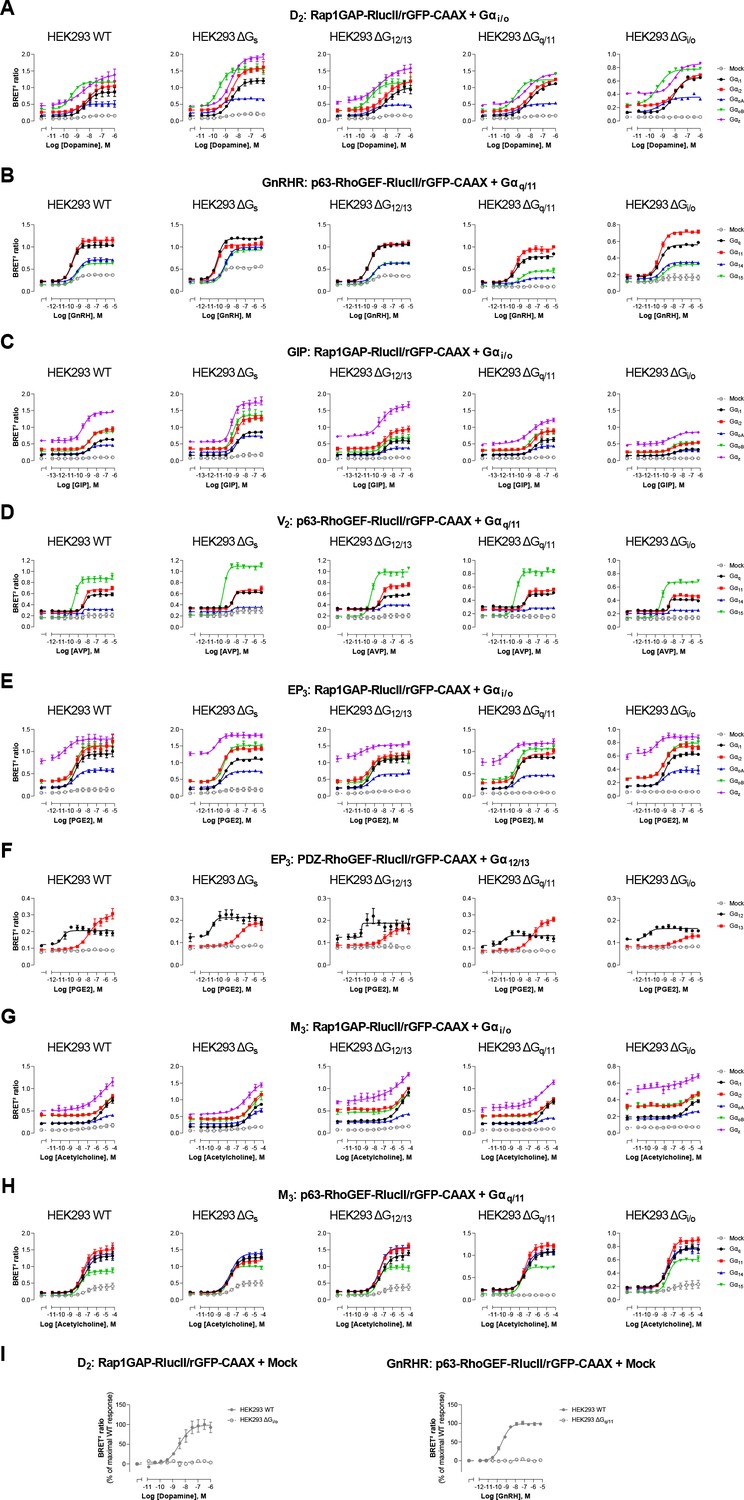
Influence of endogenous G proteins.
Concentration-response curves elicited in parental (WT) HEK293 cells or devoid of Gs (ΔGs), G12/13 (ΔG12/13), Gq/11 (ΔGq/11), or Gi/o (ΔGi/o) proteins, transfected with the indicated receptor (D2, GnRHR, GIP, V2, EP3, or M3) and one of the Gαi/o, Gαq/11, or Gα12/13 activation sensors, along with the indicated Gα subunits. Mock condition corresponded to the response elicited in absence of heterologously expressed Gα subunits (i.e. endogenous G proteins effect). Data are the mean ± SEM of 3 -5 independent experiments performed in one replicate and are expressed as BRET2 ratio. Data presented in (I) are the same as in (A–B), but with results expressed as % of maximal response elicited by endogenous G proteins (mock) in WT cells.
-
Figure 2—figure supplement 1—source data 1
Raw date of Figure 2—figure supplement 1.
- https://cdn.elifesciences.org/articles/74101/elife-74101-fig2-figsupp1-data1-v2.xlsx
Figure 2—figure supplement 2
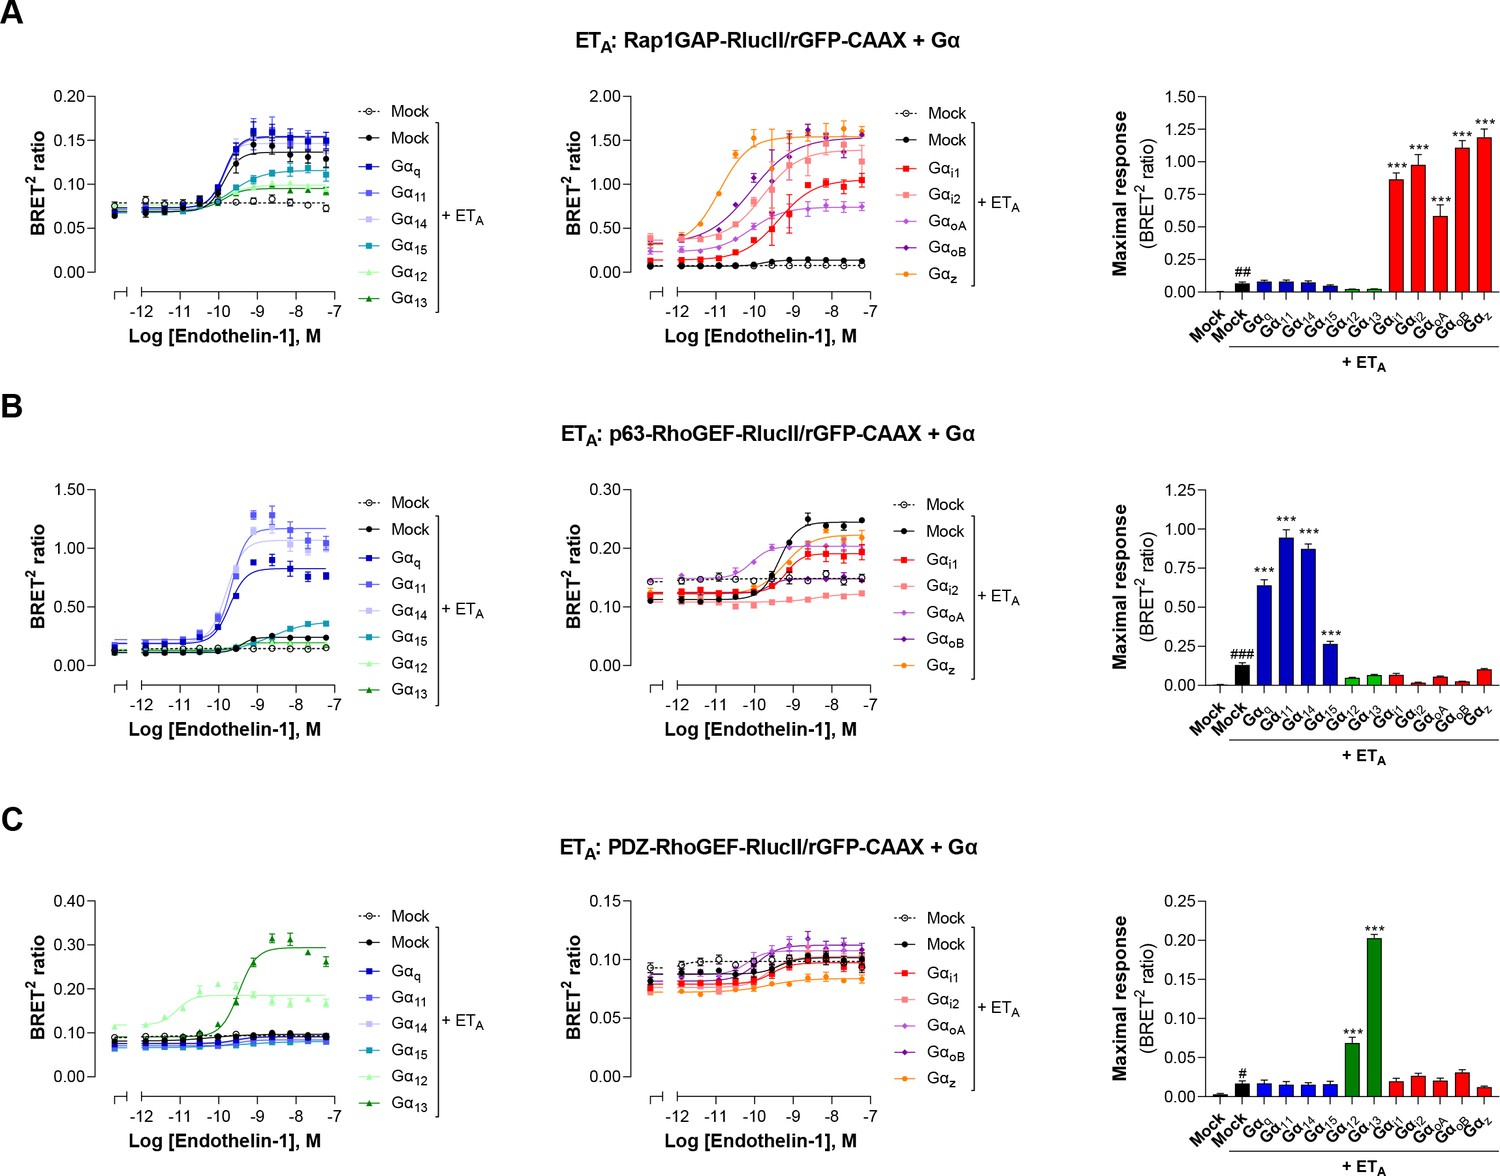
Validation of EMTA ebBRET-based sensors selectivity for each Gα subunit families.
HEK293 cells were transfected with the ETA receptor and Gαi/o (A), Gαq/11 (B), or Gα12/13 (C) activation sensors along with each Gα subunit or control DNA (Mock) as control for response obtained with endogenous Gα proteins. Concentration-response curves in response to endothelin-1 are shown (left and central), as well as maximal responses obtained with each Gα subunit. Data are the mean ± SEM of 3 independent experiments performed in one replicate and are expressed as BRET2 ratio. Unpaired t-test: #p < 0.05, ##p < 0.01 and ###p < 0.001 compared to Mock (without receptor) and one-way ANOVA test: *p < 0.05, **p < 0.01 and ***p < 0.001 compared to Mock + ETA.
-
Figure 2—figure supplement 2—source data 1
Raw date of Figure 2—figure supplement 2.
- https://cdn.elifesciences.org/articles/74101/elife-74101-fig2-figsupp2-data1-v2.xlsx
Figure 2—figure supplement 3
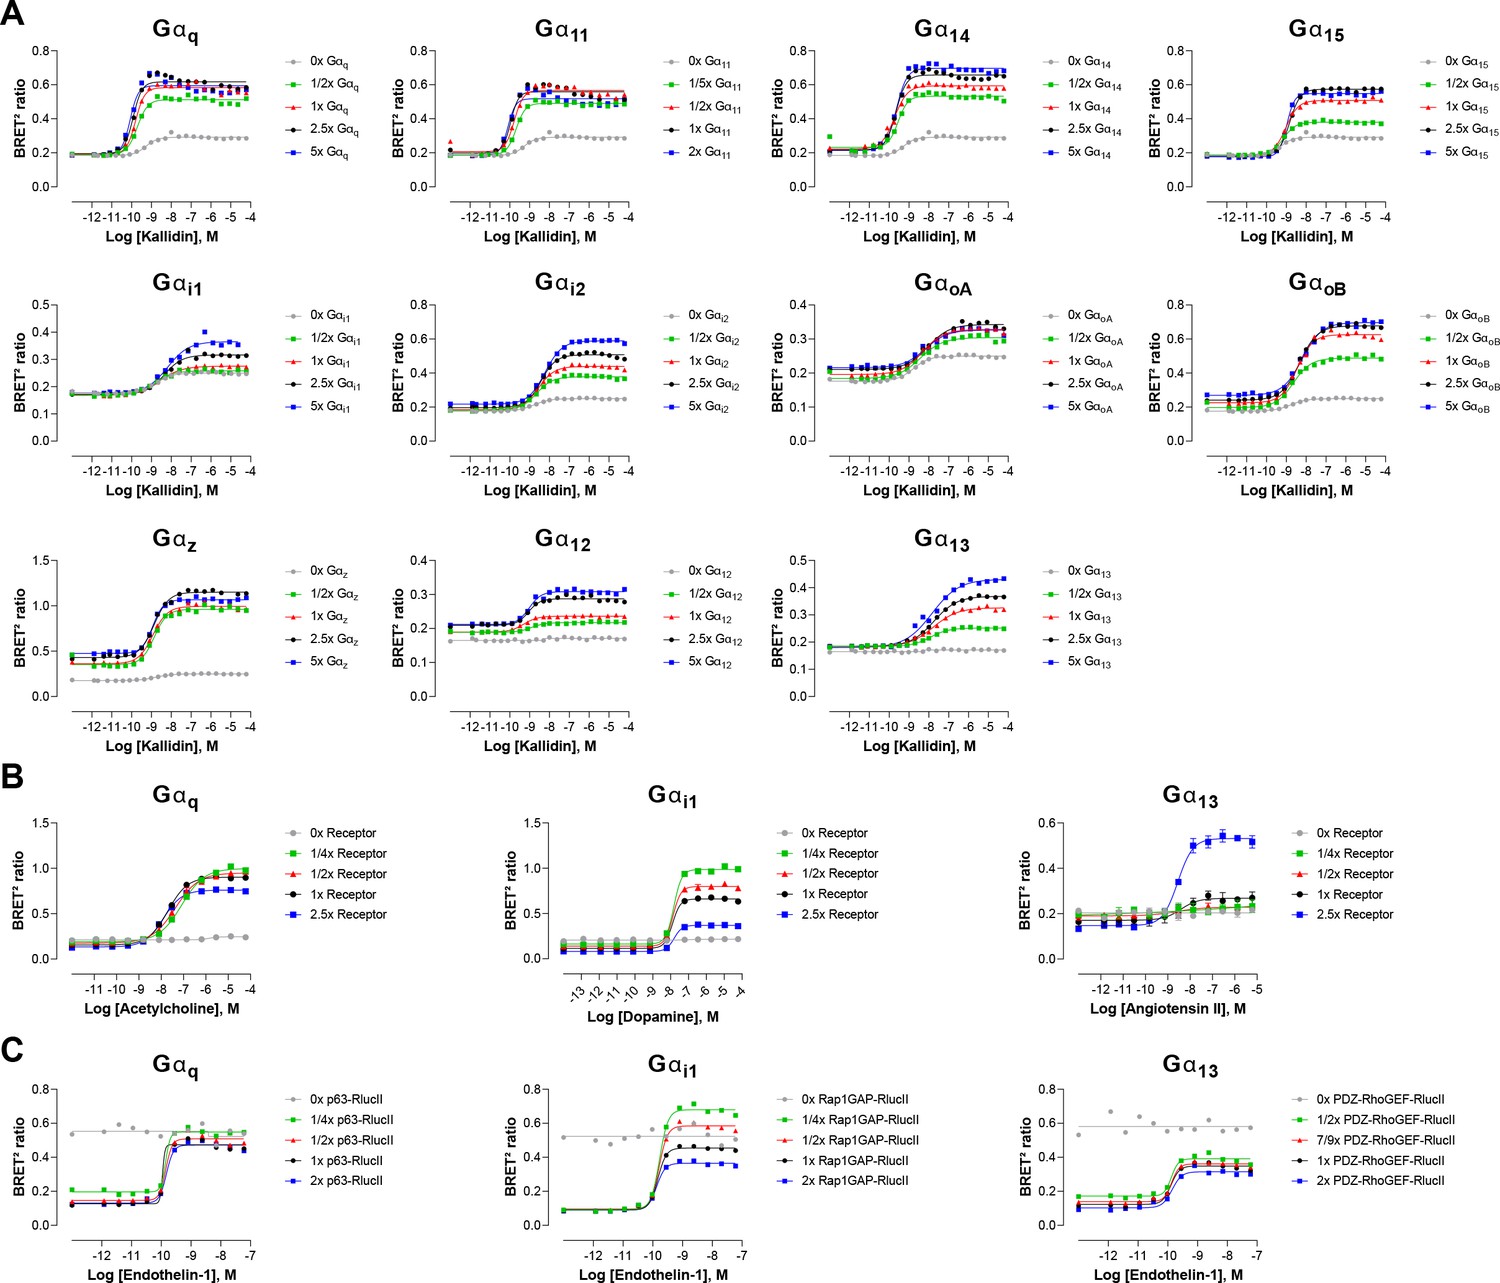
Influence of G protein, GPCR or effector-RlucII level expression.
(A) Concentration-response curves elicited in HEK293 cells transfected with the B2 receptor and one of the Gαq/11, Gαi/o, or Gα12/13 activation sensors, along with increasing quantity of the indicated Gα subunits. Data represent a representative experiment (B) Concentration-response curves elicited in HEK293 cells transfected with increasing quantity of the M3, D2, or AT1 receptors and the Gαq/11, Gαi/o, or Gα12/13 activation sensors, along with the indicated Gα subunits. (C) Concentration-response curves elicited in HEK293 cells transfected with the ETA receptor and increasing quantity of effector-RlucII (p63-RhoGEF for Gαq/11, Rap1GAP for Gαi/o or PDZ-RhoGEF for Gα12/13), along with rGFP-CAAX and the indicated Gα subunits. Data are the mean ± SEM of 3 independent experiments performed in one replicate and are expressed in BRET2 ratio.
-
Figure 2—figure supplement 3—source data 1
Raw date of Figure 2—figure supplement 3.
- https://cdn.elifesciences.org/articles/74101/elife-74101-fig2-figsupp3-data1-v2.xlsx
Figure 2—figure supplement 4
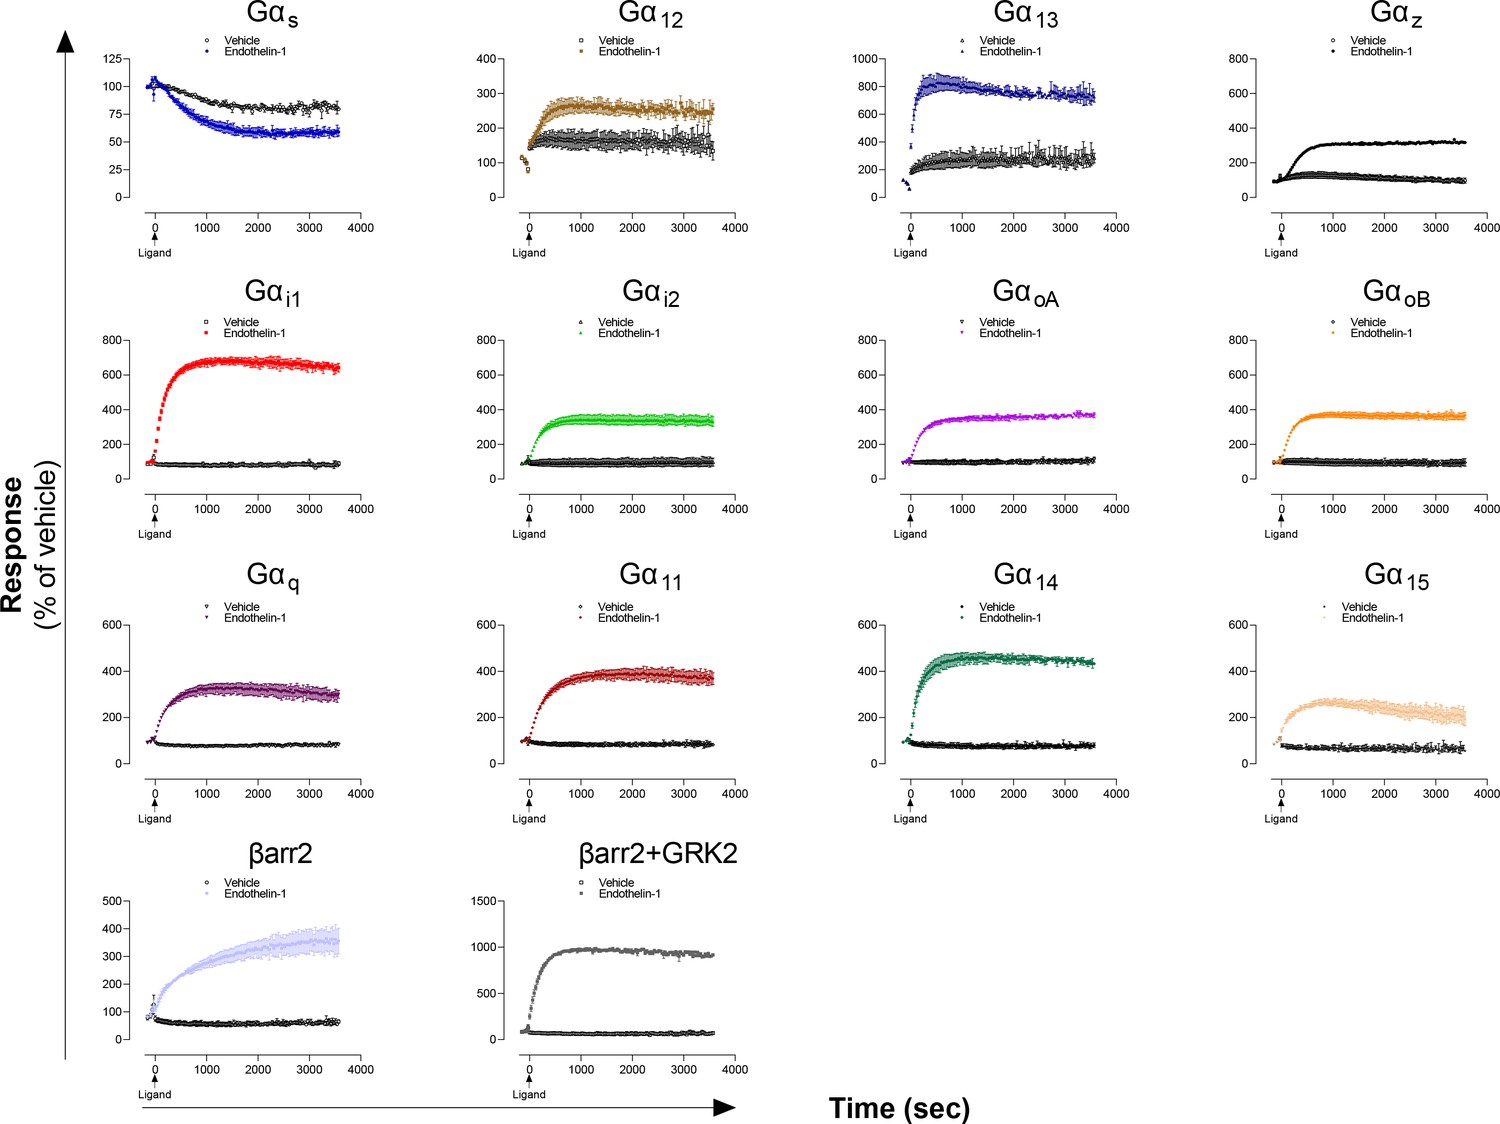
Kinetics of Gα proteins and βarrestins recruitment promoted by the ETA receptor.
Kinetics of activation of the indicated pathways following stimulation with vehicle or Endothelin-1 in HEK293 cells expressing the ETA receptor. Data are the mean ± SD of two replicates of a representative experiment from 3 independent experiments and are expressed in % of the respective basal response (determined before ligand addition at t = 0 sec).
-
Figure 2—figure supplement 4—source data 1
Raw date of Figure 2—figure supplement 4.
- https://cdn.elifesciences.org/articles/74101/elife-74101-fig2-figsupp4-data1-v2.xlsx
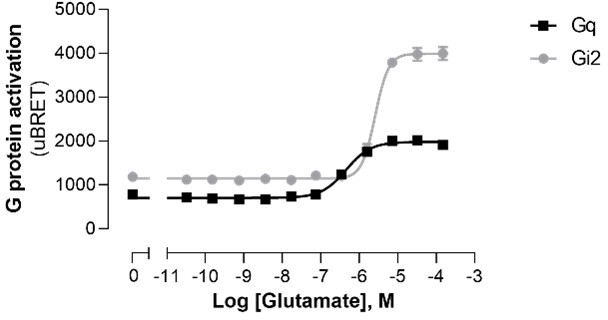
Figure 2—figure supplement 5
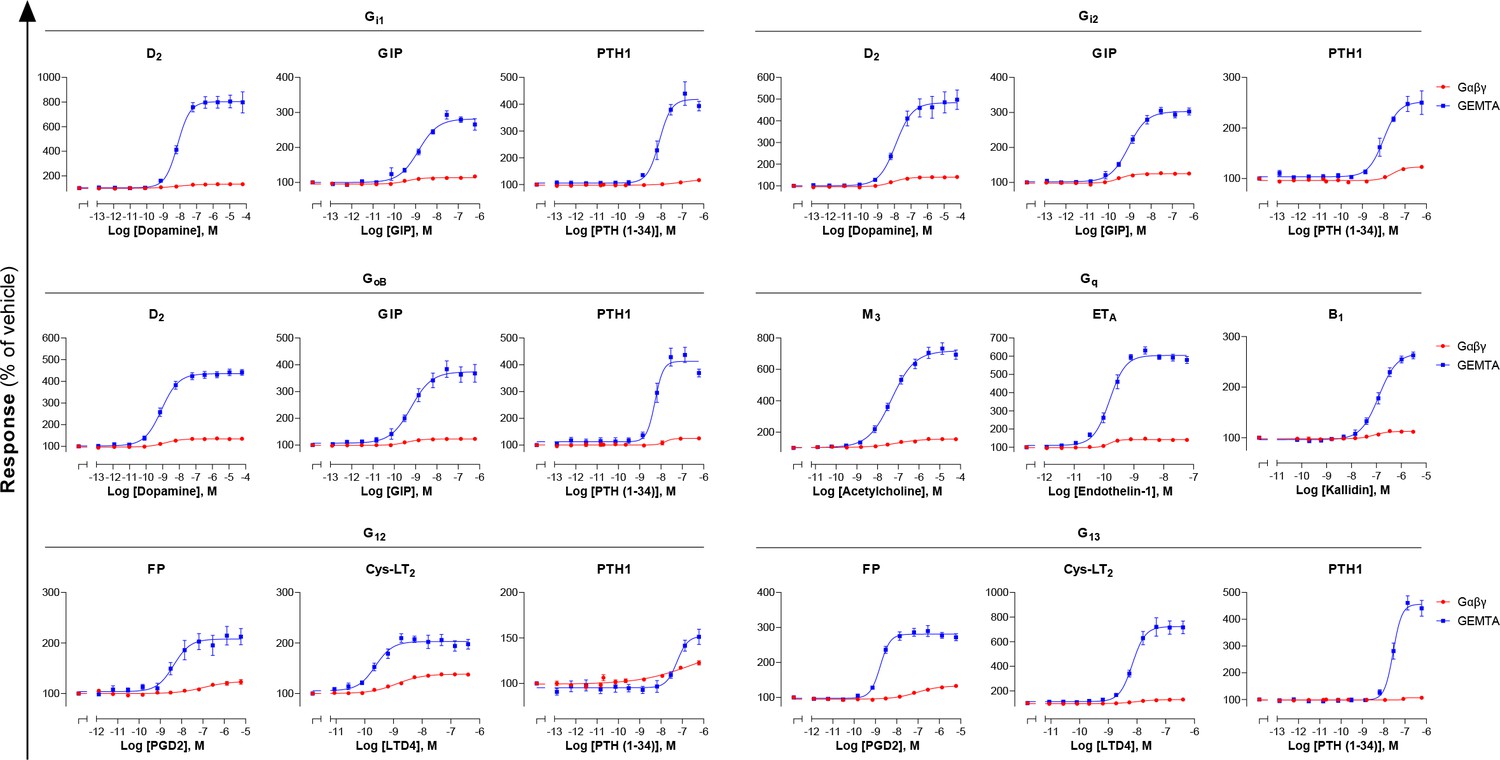
Comparison of EMTA platform and G protein activation BRET assay based on Gαβγ dissociation.
Concentration-response curves elicited in HEK293 cells transfected with the indicated receptor (D2, GIP, PTH1, M3, ETA, B1, FP, or Cys-LT2) and one of the Gαi/o, Gαq/11, or Gα12/13 EMTA activation sensors, along with the indicated Gα subunits, or the BRET-based Gαβγ dissociation sensors (Gα-RlucII and GFP10-Gγ1 for Gαq, Gα12, and Gα13 or GFP10-Gγ2 for Gαi1, Gαi2, and GαoB, with untagged Gβ1). Data are the mean ± SEM from 3-7 independent experiments performed in one replicate and results are expressed in % of the response obtained for cells treated with vehicle.
-
Figure 2—figure supplement 5—source data 1
Raw date of Figure 2—figure supplement 5.
- https://cdn.elifesciences.org/articles/74101/elife-74101-fig2-figsupp5-data1-v2.xlsx
Figure 2—figure supplement 6
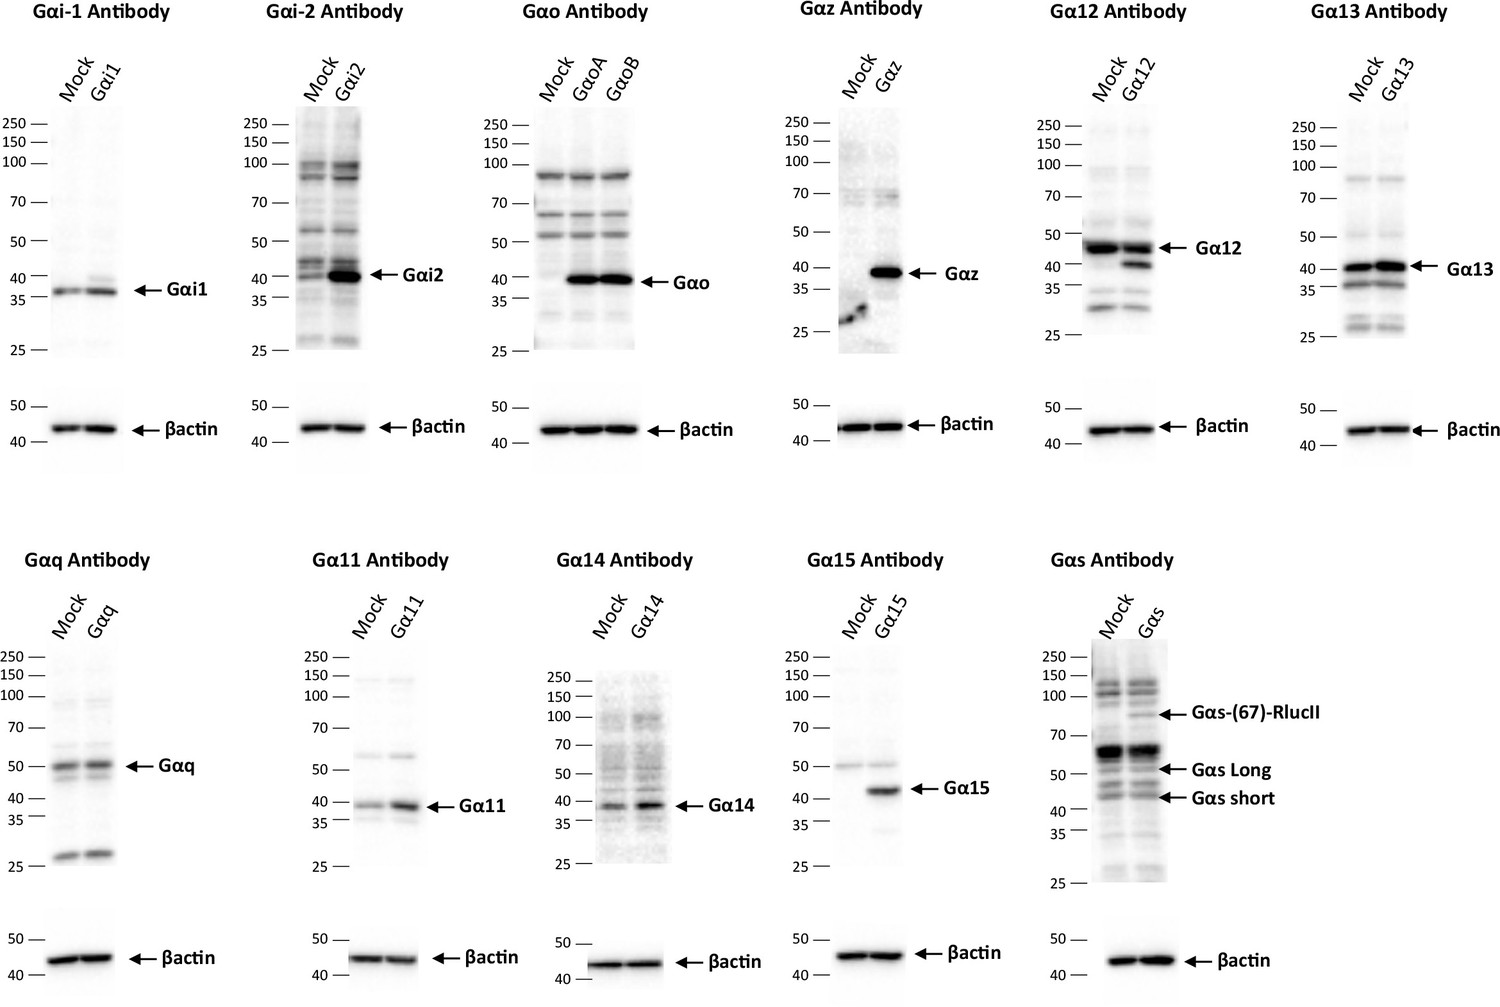
Western blots of G protein level expression in cells transfected with the EMTA ebBRET platform.
G protein expression level detection in HEK293 cells transfected with the Gαi/o, Gα12/13, Gαq/11, or Gαs activation sensors along with the indicated Gα protein or control DNA (Mock). Representative immunoblots of 3 independent experiments are shown.
-
Figure 2—figure supplement 6—source data 1
Original Western blot of Figure 2—figure supplement 6.
- https://cdn.elifesciences.org/articles/74101/elife-74101-fig2-figsupp6-data1-v2.zip
Figure 3 with 3 supplements

Heatmaps illustrating the diversity of receptor-specific signaling signatures detected with the EMTA ebBRET platform.
(A) First, values within each pathway were normalized relative to the maximal response observed across all receptors (max = 1; left). These values were then normalized across pathways for the same receptor, with the highest-ranking pathway serving as the reference (max = 1; right). (B) Heatmap representation of double normalized Emax (left) and pEC50 (right) data. Empty cells (grey) indicate no detected coupling. IUPHAR receptor names are displayed.
Figure 3—figure supplement 1
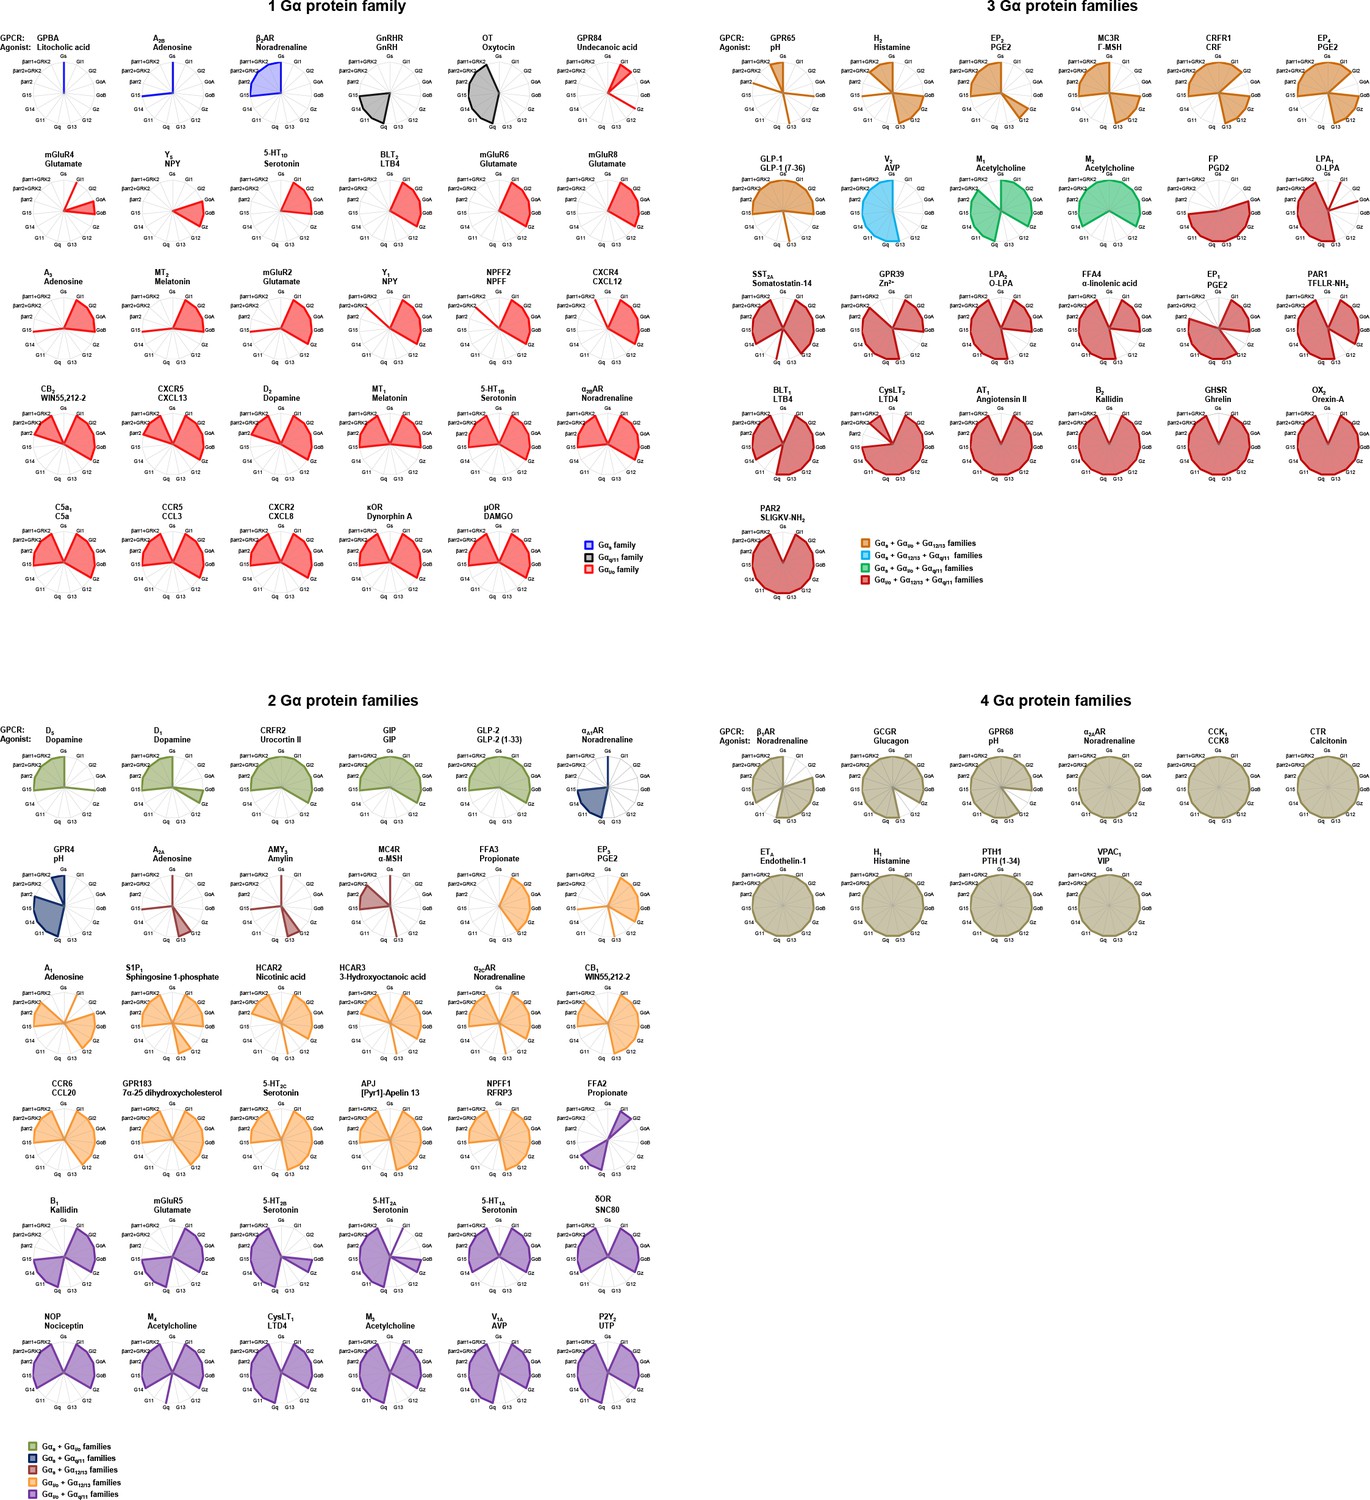
Receptor-specific signaling signatures.
Emax values derived from concentration-response curves generated on 100 receptors using the 15 ebBRET-based assay are represented as radial graphs. A score of 0 indicates no coupling to a given pathway, whereas a score of 1 indicates a coupling. Receptors are rearranged according to the number of G protein families activated. Gα15 has been considered apart from the Gq/11 family due to its promiscuous nature. See Supplementary file 3 that shows the concentration-response curves of the 100 receptors for the 15 different pathways.
Figure 3—figure supplement 2
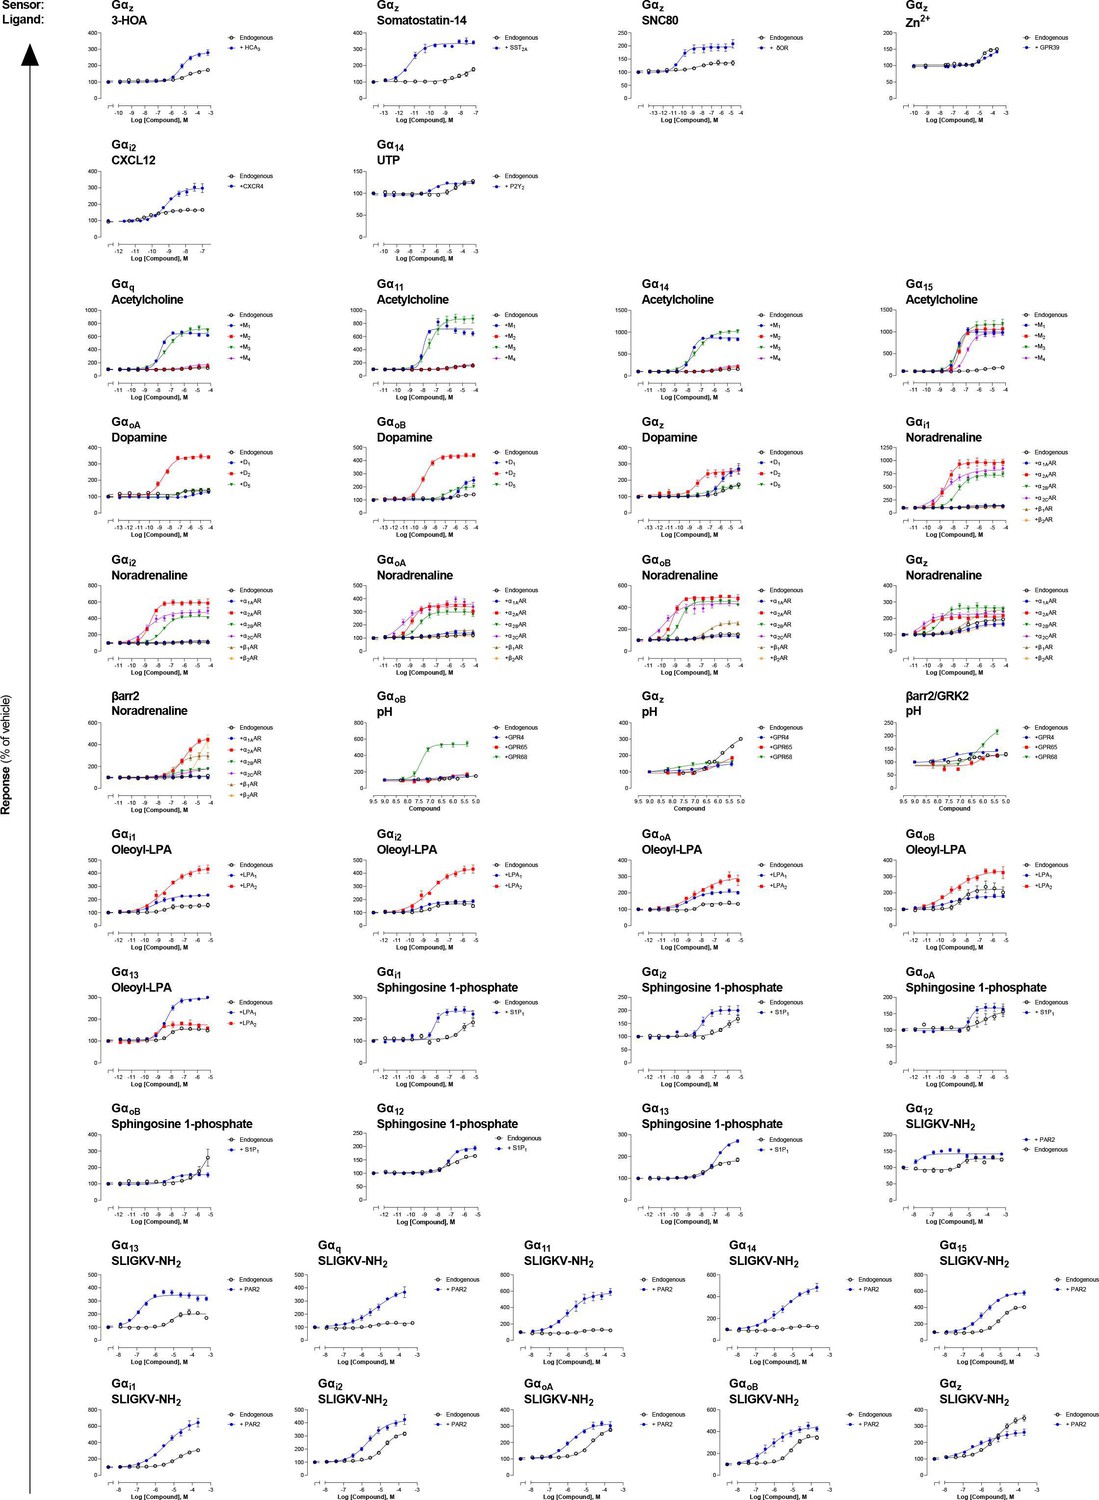
Detection of endogenous receptor-mediated responses with the EMTA ebBRET platform in HEK293 cells.
Comparison of concentration-response curves elicited by the indicated ligand for a specific pathway, following the stimulation of HEK293 cells expressing endogenous or heterologously expressed receptors. The data presented refer to the ligands where a signal was detected on non-transfected cells (endogenous expression) (See Supplementary file 3 for the curves on light gray and yellow background). Data are the mean ± SEM of at least 3 independent experiments performed in one replicate and expressed in % of the response obtained for cells treated with vehicle.
-
Figure 3—figure supplement 2—source data 1
Raw data of Figure 3—figure supplement 2.
- https://cdn.elifesciences.org/articles/74101/elife-74101-fig3-figsupp2-data1-v2.xlsx
Figure 3—figure supplement 3
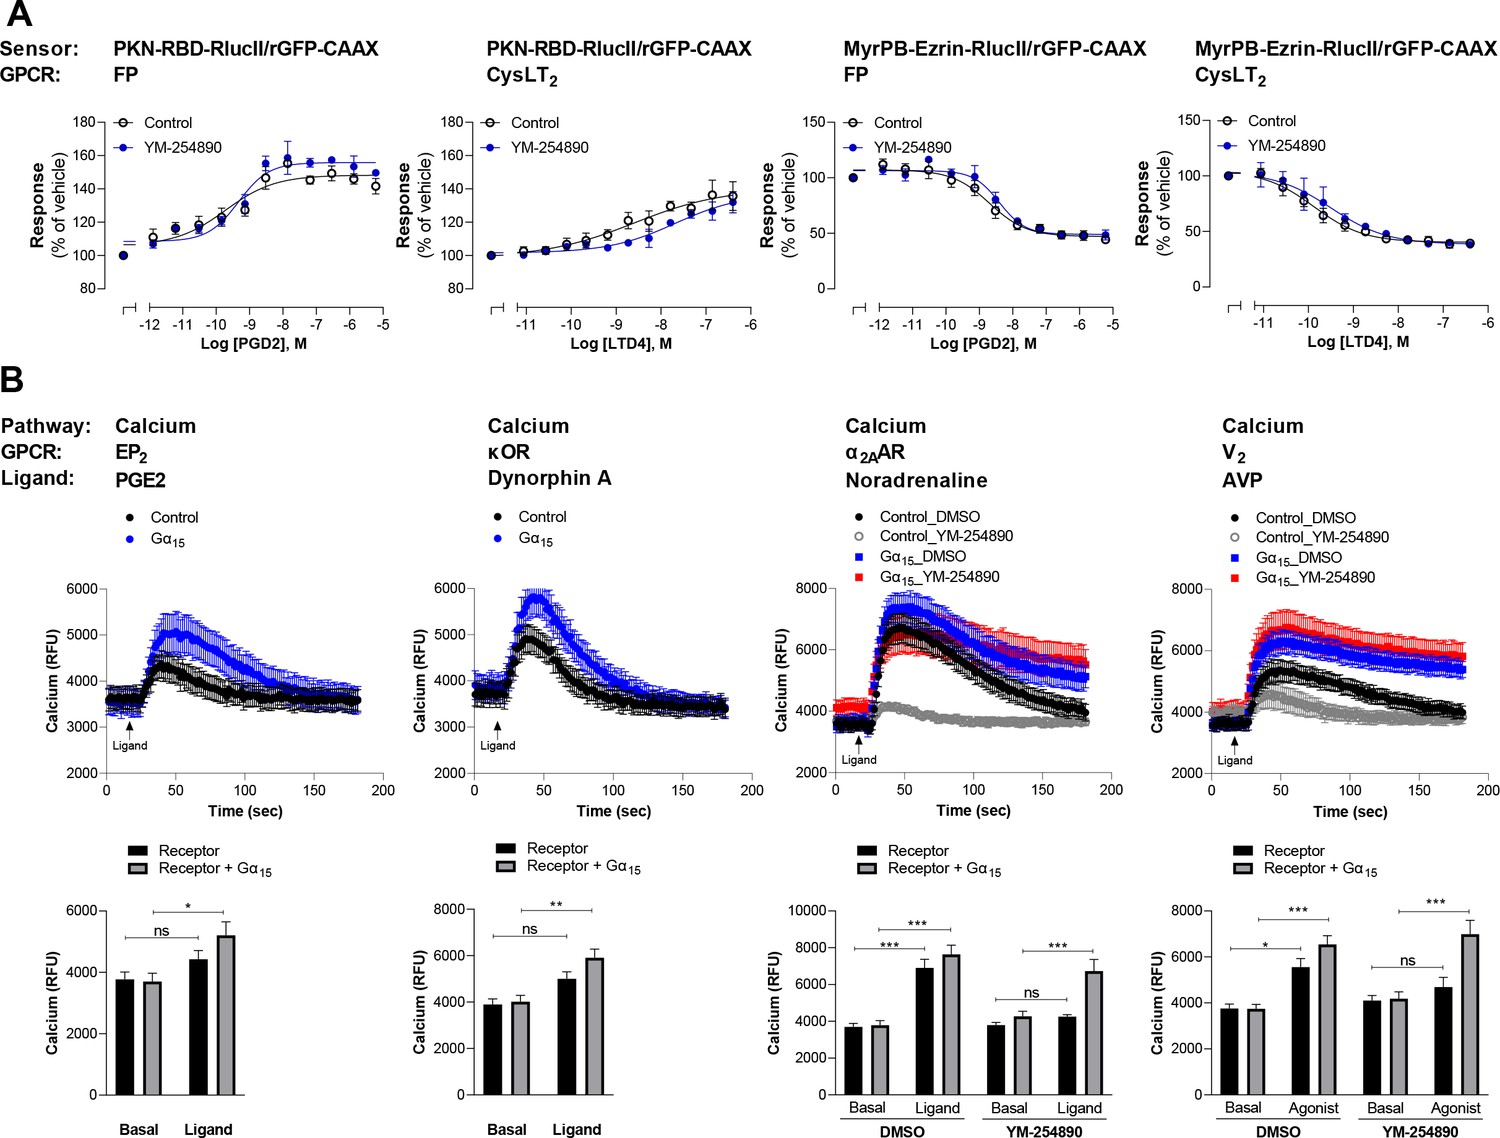
Validation of G12/13 and G15 signaling for the newly characterized GPCRs.
(A) Validation of G12/13-mediated signal using Rho and Ezrin activation sensors. HEK293 cells expressing FP or CysLT2 receptors and the PKN-RBD-RlucII or MyrPB-Ezrin-RlucII/rGFP-CAAX sensors were pretreated or not with the Gαq inhibitor YM-254890 and then stimulated with increasing concentrations of respective ligand. Data are the mean ± SEM from 3-5 independent experiments performed in one replicate and expressed in % of vehicle-treated cells. (B) Validation of Gα15-mediated signal by measuring calcium production. Top: Kinetics of calcium release induced by the indicated ligand in HEK293 cells expressing the indicated receptor, alone or with Gα15 subunit. For receptors that also couple to other Gq/11 family members, cells were pretreated with DMSO or the Gαq inhibitor YM-254890. Bottom: The peak of calcium production obtained from kinetics were compared to the basal level of calcium (determined between 0 and 17 s). Data are the mean ± SEM from 5-7 independent experiments performed in one replicate and expressed in relative fluorescence unit (RFU). Two Way ANOVA test: *p < 0.05, **p < 0.01 and ***p < 0.001 compared to respective basal calcium level. ns: not significant.
-
Figure 3—figure supplement 3—source data 1
Raw data of Figure 3—figure supplement 3.
- https://cdn.elifesciences.org/articles/74101/elife-74101-fig3-figsupp3-data1-v2.xlsx
Figure 4 with 1 supplement
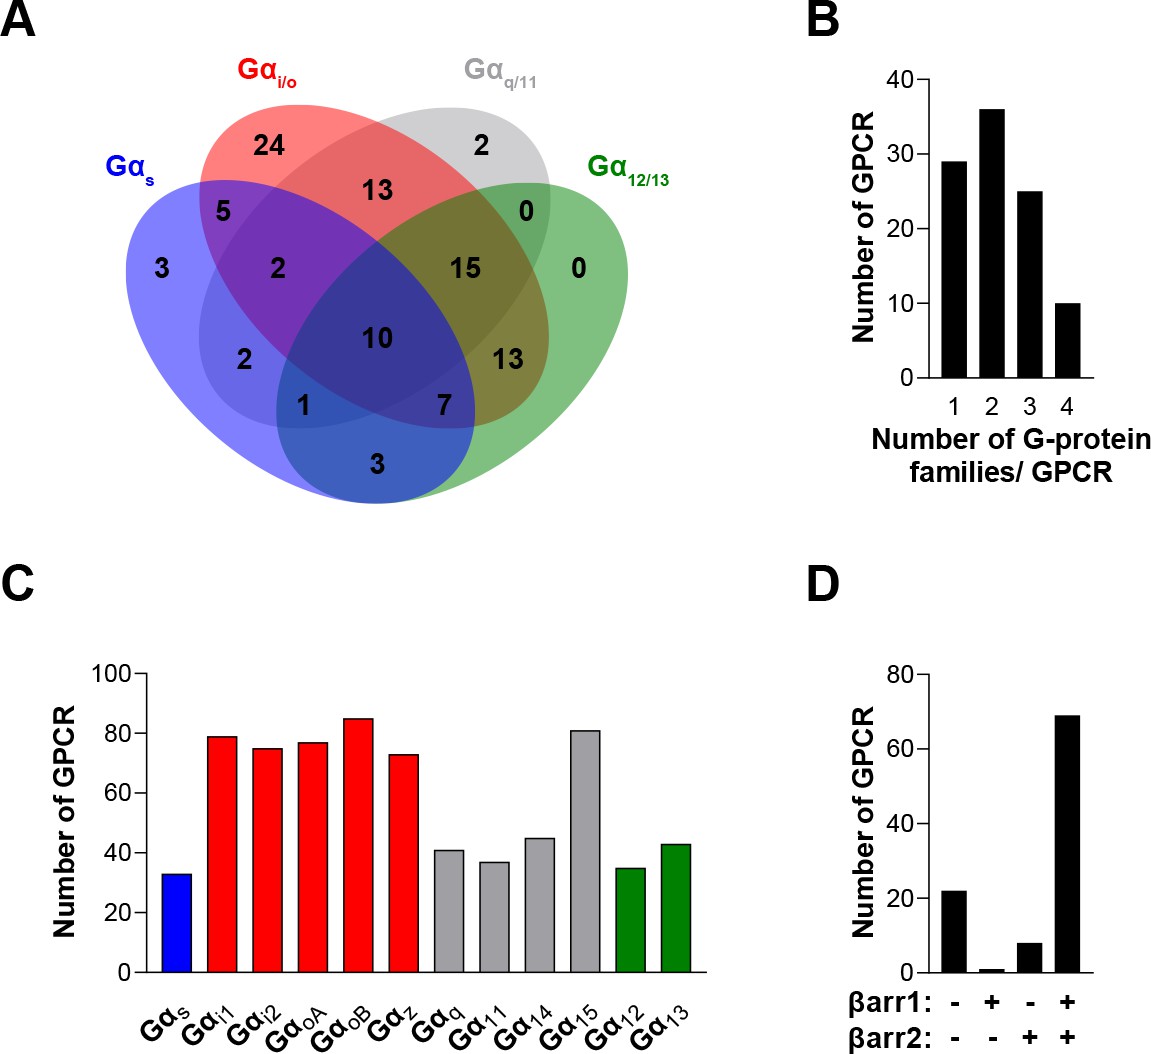
The EMTA ebBRET platform has a unique ability to uncover coupling selectivity between G protein families.
(A) Venn diagram showing the numbers of receptors coupled to each G protein family in the EMTA ebBRET biosensor assay. (B) Evaluation of receptors coupling promiscuity: number of receptors that couple to members of 1, 2, 3, or 4 G protein families. (C) Determination of G protein subunit coupling frequency: number of receptors that activate each Gα subunit. (D) Proportion of receptors recruiting βarrestins: number of receptors that do not recruit (-/-) or that recruit either (+/- or -/+) or both (+/+) βarrestin isotypes. All data are based on double normalized Emax values from Figure 3.
-
Figure 4—source data 1
Raw data of Figure 4.
- https://cdn.elifesciences.org/articles/74101/elife-74101-fig4-data1-v2.xlsx
Figure 4—figure supplement 1
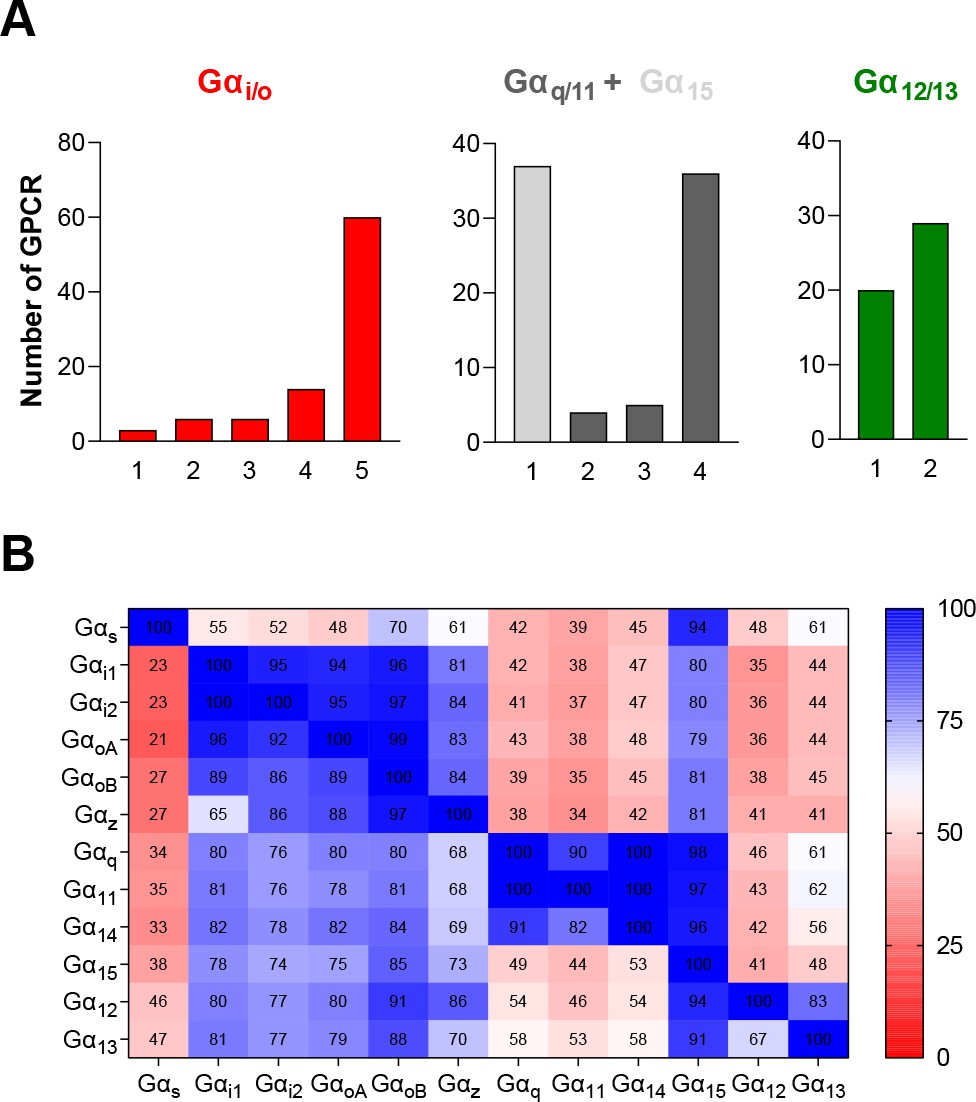
G protein subtypes distribution across the 100 GPCRs profiled with the EMTA ebBRET-based platform.
(A) Number of receptors that can couple to 1–5 of the different subtypes from each G protein family. (B) % of receptors activating a specific G protein subtype (Y axis) that also activate another G protein subtype (X axis).
-
Figure 4—figure supplement 1—source data 1
Raw data of Figure 4—figure supplement 1.
- https://cdn.elifesciences.org/articles/74101/elife-74101-fig4-figsupp1-data1-v2.xlsx
Figure 5 with 1 supplement
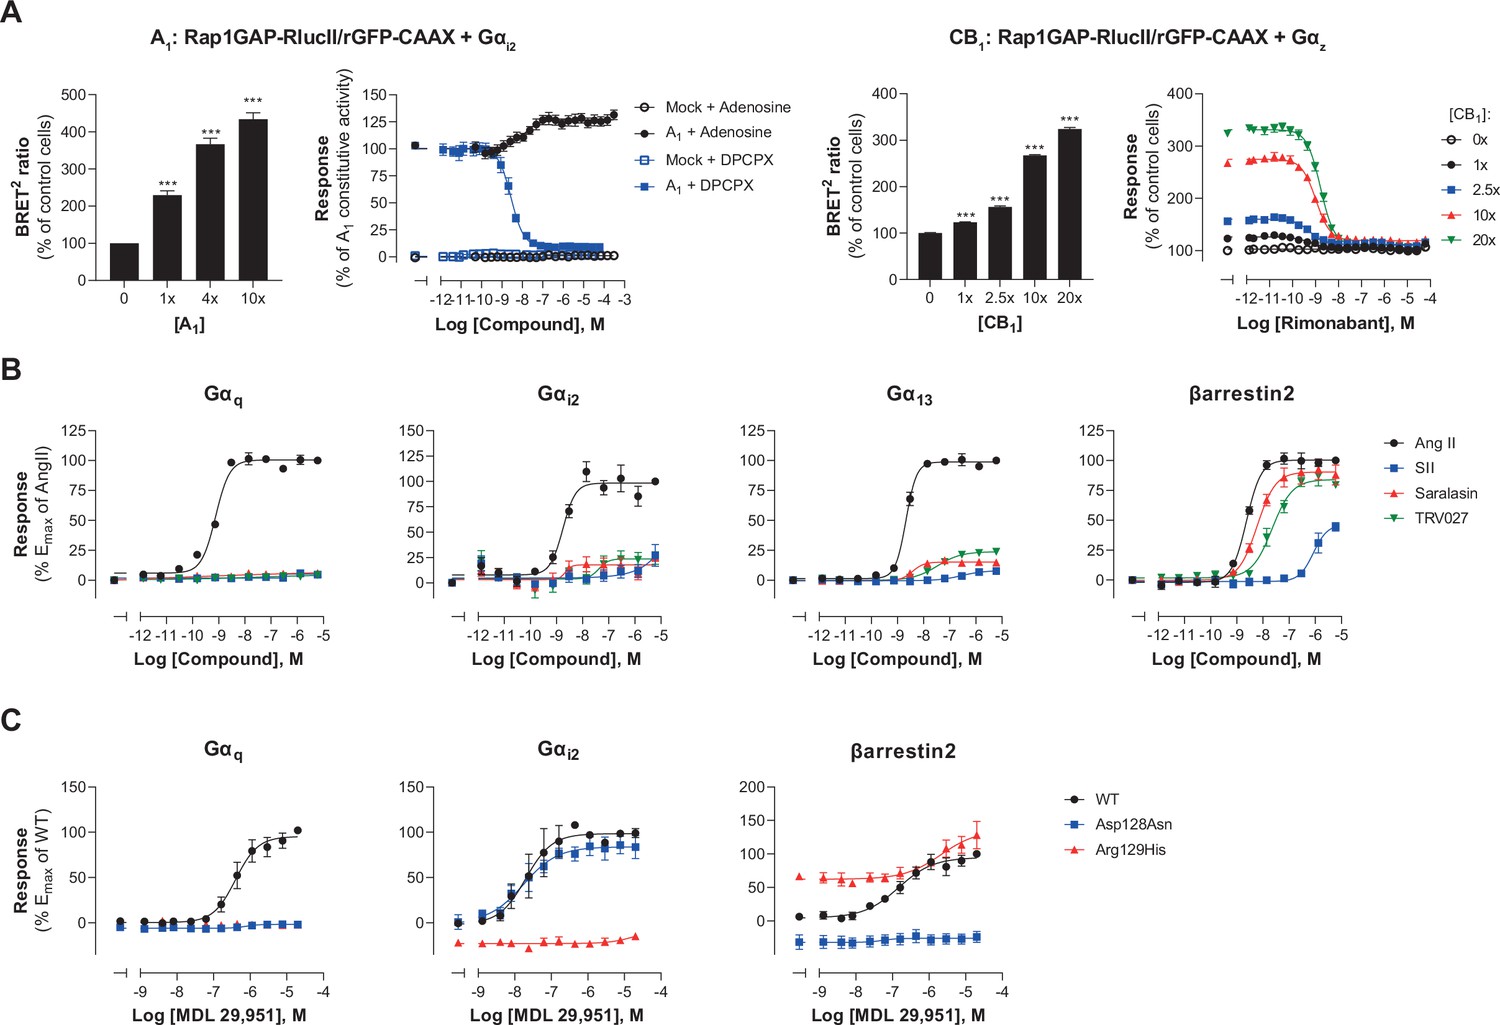
Multiple applications using the EMTA ebBRET platform.
(A) Inverse agonist activity detection. Left: Gαi2 activation in HEK293 cells transfected with the Rap1GAP-RlucII/rGFP-CAAX sensors with untagged Gαi2 and increasing amount of A1 receptor plasmid. Data are expressed in % of response obtained in control cells (0 ng of A1) and are the mean ± SEM of 4–6 independent experiments performed in two replicates. One Way ANOVA test: ***p < 0.001 compared to control cells. HEK293 cells expressing the Gαi2 activation sensor and control (Mock) or A1 receptor plasmid were stimulated (10 min) with increasing concentrations of the indicated compound. Data are expressed in % of constitutive response obtained in vehicle-treated A1 transfected cells and are the mean ± SEM of 4-6 independent experiments performed in one replicate. Right: Gαz activation in HEK293 cells transfected with the Rap1GAP-RlucII/rGFP-CAAX sensors with untagged Gαz and increasing amount of CB1 receptor plasmid. Data are expressed in % of response obtained in control cells (0 ng of CB1) and are the mean ± SEM of 4 independent experiments performed in one replicate. One Way ANOVA test: ***p < 0.001 compared to control cells. HEK293 cells expressing the Gαz activation sensor and increasing amount of CB1 receptor plasmid were directly stimulated (10 min) with increasing concentrations of the CB1 inverse agonist rimonabant. Data are expressed as % of the response obtained in control cells (0 ng of CB1) treated with vehicle and are the mean ± SEM of 4 independent experiments performed in one replicate. (B) Ligand-biased detection. Concentration-response curves of AT1 for the endogenous ligand (Angiotensin II, AngII) and biased agonists [Sar1-Ile4-Ile8] AngII (SII), saralasin or TRV027. G protein and βarrestin2 signaling activity were assessed by EMTA platform. Data are expressed in % of maximal response elicited by AngII and are the mean ± SEM of 3–6 independent experiments performed in one replicate. (C) Functional selectivity of naturally occurring receptor variants. Concentration-response curves for WT or E/DRY motif Asp128Asn and Arg129His variants of GPR17 upon agonist stimulation in HEK293 cells co-expressing the indicated EMTA biosensor. Data are expressed in % of maximal response elicited by WT receptor and are the mean ± SEM of 3 independent experiments performed in one replicate.
-
Figure 5—source data 1
Raw data of Figure 5.
- https://cdn.elifesciences.org/articles/74101/elife-74101-fig5-data1-v2.xlsx
Figure 5—figure supplement 1
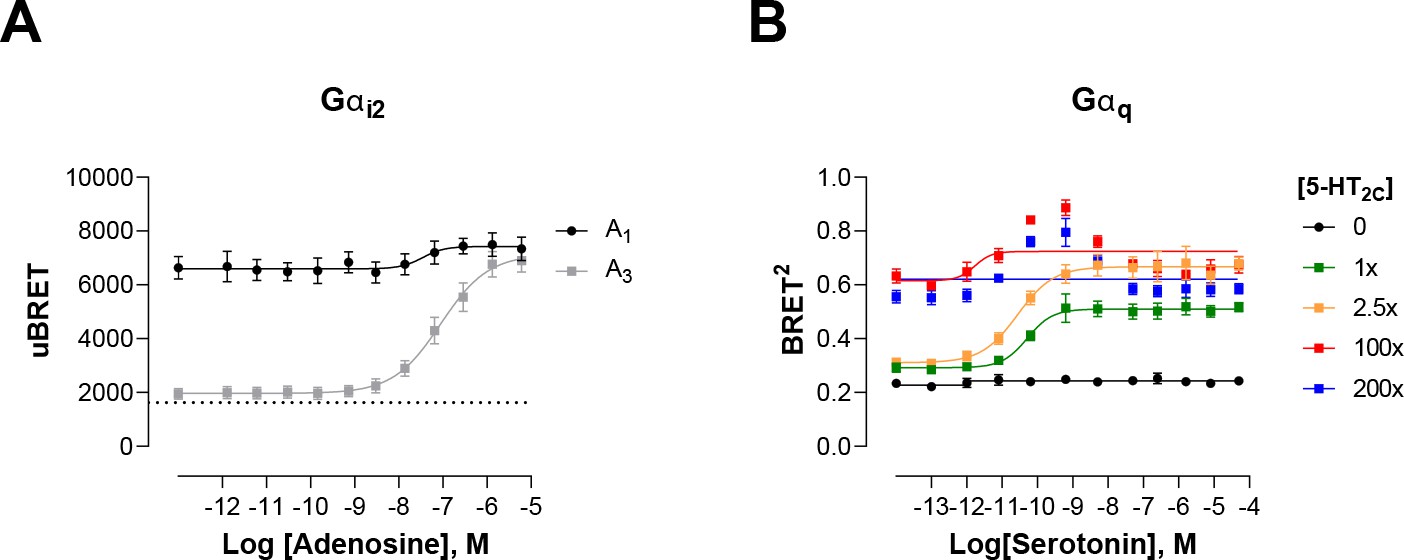
Modulation of ligand-promoted response detected by EMTA ebBRET platform by receptor constitutive activity.
(A) Concentration-response curves of Gαi2 activation elicited by adenosine in HEK293 cells transfected with the Rap1GAP-RlucII/rGFP-CAAX sensors with untagged Gαi2 and A1 or A3 receptors. Basal level of Gi2 activation detected by the GEMTA sensor in absence of heterologous receptor expression is represented by the interrupted line. Data are expressed as uBRET ratio and are the mean ± SEM of 4 independent experiments performed in one replicate. (B) Concentration-response curves of Gαq activation elicited by serotonin in HEK293 cells transfected with the p63-RlucII/rGFP-CAAX sensors with untagged Gαq and increasing amount of 5-HT2C receptor plasmid. Data are expressed as BRET ratio and are the mean ± SEM of 4 independent experiments performed in one replicate.
-
Figure 5—figure supplement 1—source data 1
Raw data of Figure 5—figure supplement 1.
- https://cdn.elifesciences.org/articles/74101/elife-74101-fig5-figsupp1-data1-v2.xlsx
Figure 6 with 2 supplements
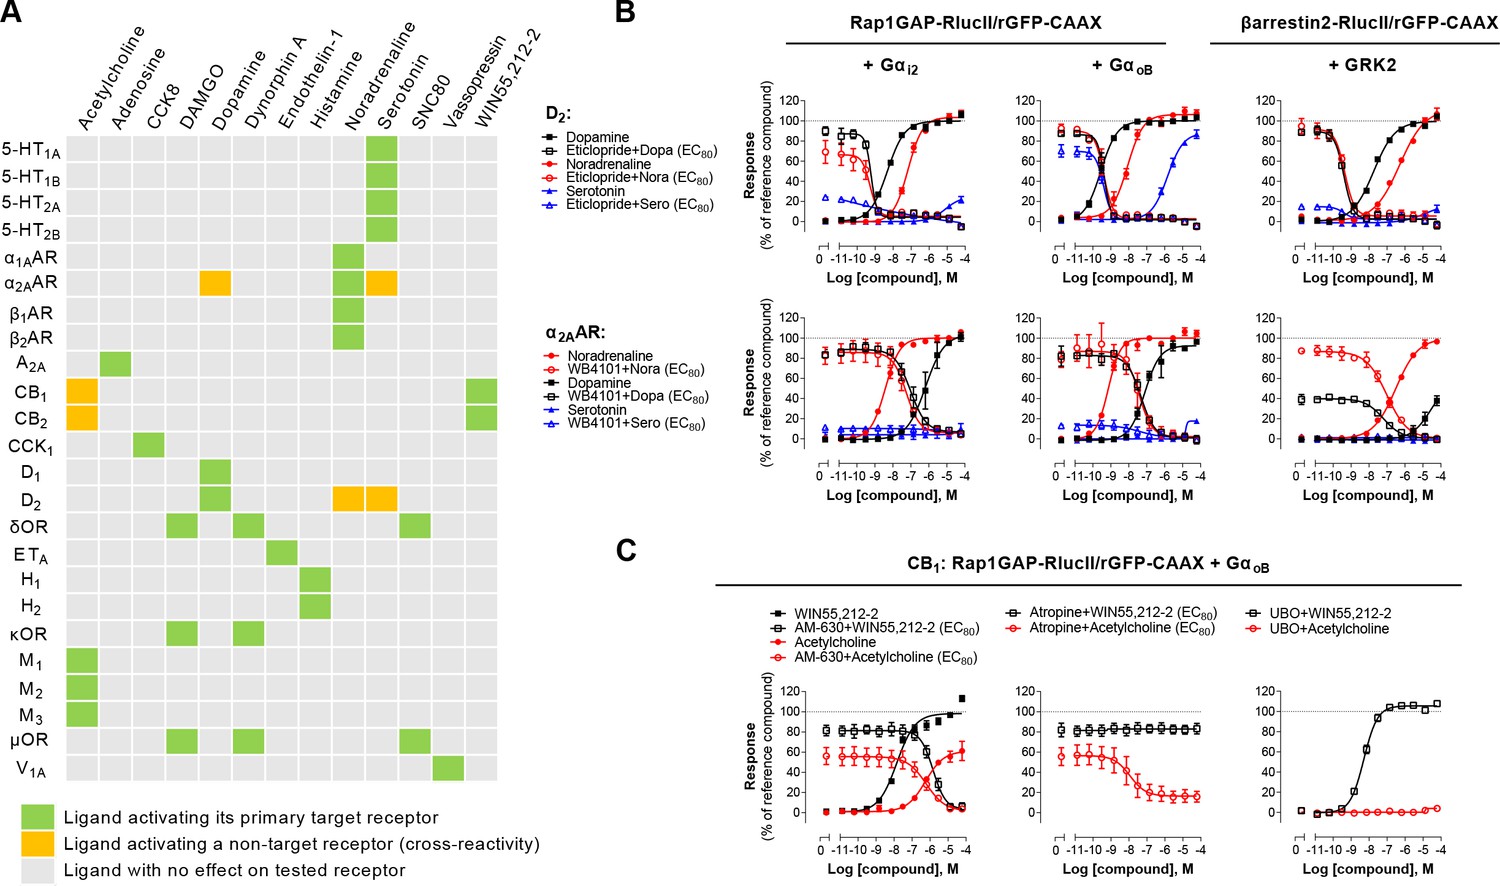
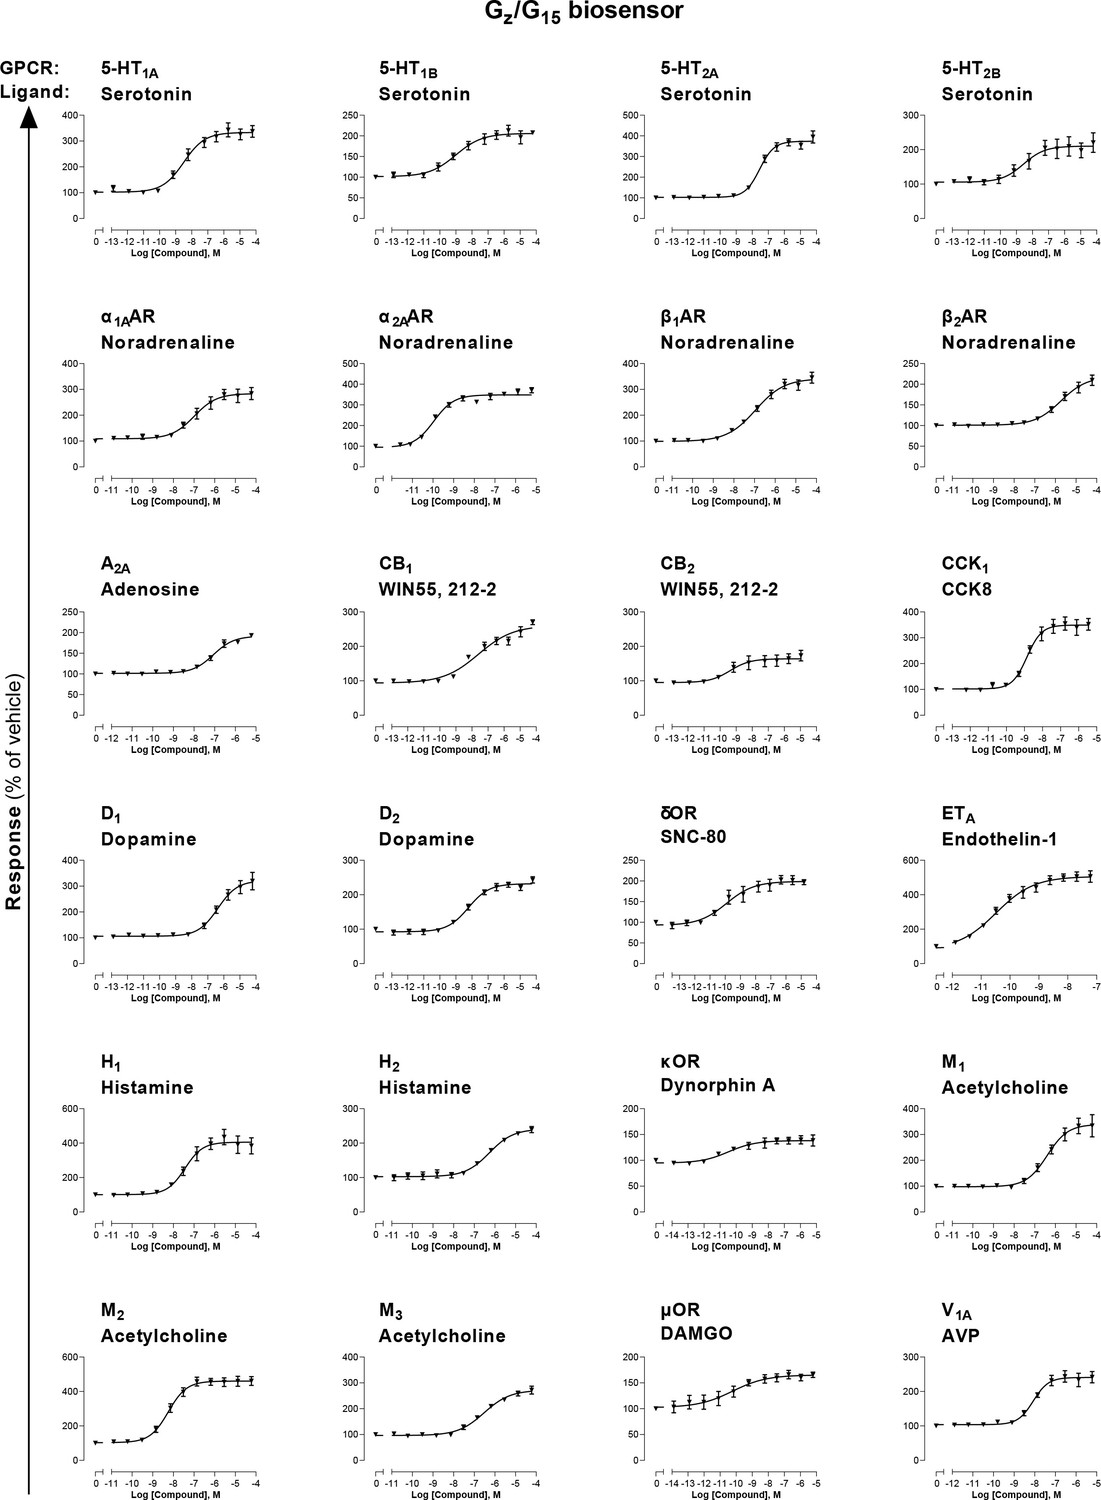
Detection of direct and indirect (trans) mechanisms of ligand polypharmacology using the Gz/G15 biosensor.
(A) Test of the Gz/G15 biosensor on a safety target panel. ebBRET signal was measured before and after stimulation with the indicated ligand in HEK293 cells transfected with the combined Gz/G15 biosensor and one of the 24 receptors listed. (B) Cross-activation of D2 and α2AAR by other natural ligands. For the agonist mode read, HEK293 cells expressing D2 or α2AAR and either the Gαi2, GαoB, or the βarrestin2 + GRK2 sensors were stimulated with increasing concentrations of the indicated ligand. For the antagonist mode read, cells were pretreated with increasing concentrations of the selective D2 antagonist eticlopride or the selective α2AAR antagonist WB4101 before stimulation with an EC80 of the indicated ligand. Data are the mean ± SEM from 3-4 independent experiments performed in one replicate and expressed in % of the response elicited by dopamine or noradrenaline for D2 and α2AAR expressing cells, respectively. (C) Indirect (trans) activation of CB1 by acetylcholine. For the agonist mode read, HEK293 cells expressing CB1 and the Rap1GAP-RlucII/rGFP-CAAX sensors with untagged GαoB were stimulated with increasing concentrations of the indicated ligand. For the antagonist mode read, same cells were pretreated or not with increasing concentrations of the CB inverse agonist AM-630 (left) or the cholinergic antagonist atropine (central) before stimulation with an EC80 of the indicated ligand. To evaluate the contribution of Gq/11-coupled receptor, cells were pretreated with the Gαq inhibitor UBO-QIC and then stimulated with increasing concentrations of the indicated ligand (right). Data are the mean ± SEM from 3-5 independent experiments performed in one replicate and expressed in % of the response elicited by WIN55,212–2.
-
Figure 6—source data 1
Raw data of Figure 6.
- https://cdn.elifesciences.org/articles/74101/elife-74101-fig6-data1-v2.xlsx
Figure 6—figure supplement 1
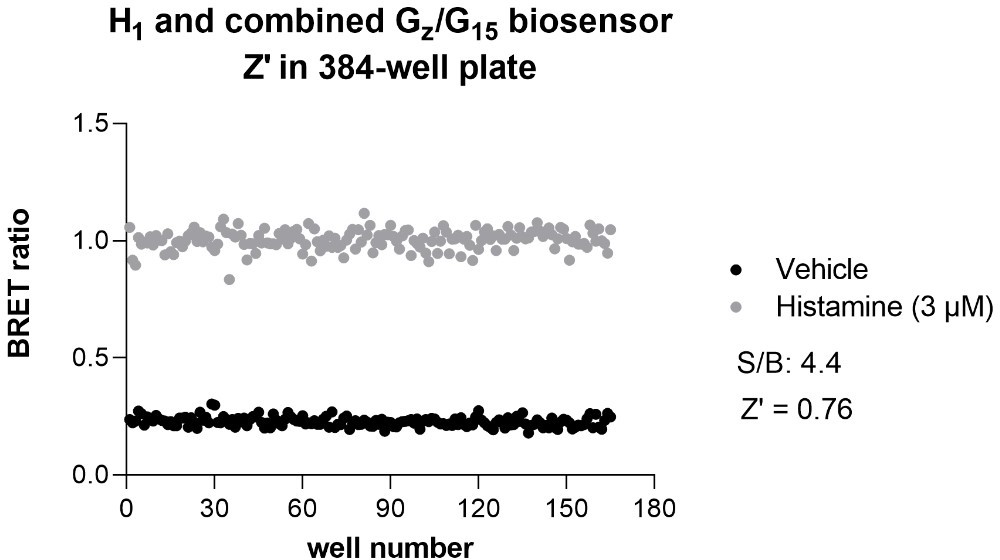
Combined Gz/G15 biosensor.
HEK293 cells transfected with the Rap1GAP-RlucII/p63-RhoGEF-RlucII/rGFP-CAAX sensors along with Gαz and Gα15 subunits and the indicated untagged receptor were stimulated with increasing concentrations of the indicated ligand. Data are the mean ± SEM from 3-5 independent experiments performed in one replicate and results are expressed in % of vehicle-treated cells.
-
Figure 6—figure supplement 1—source data 1
Raw data of Figure 6—figure supplement 1.
- https://cdn.elifesciences.org/articles/74101/elife-74101-fig6-figsupp1-data1-v2.xlsx
Figure 6—figure supplement 2
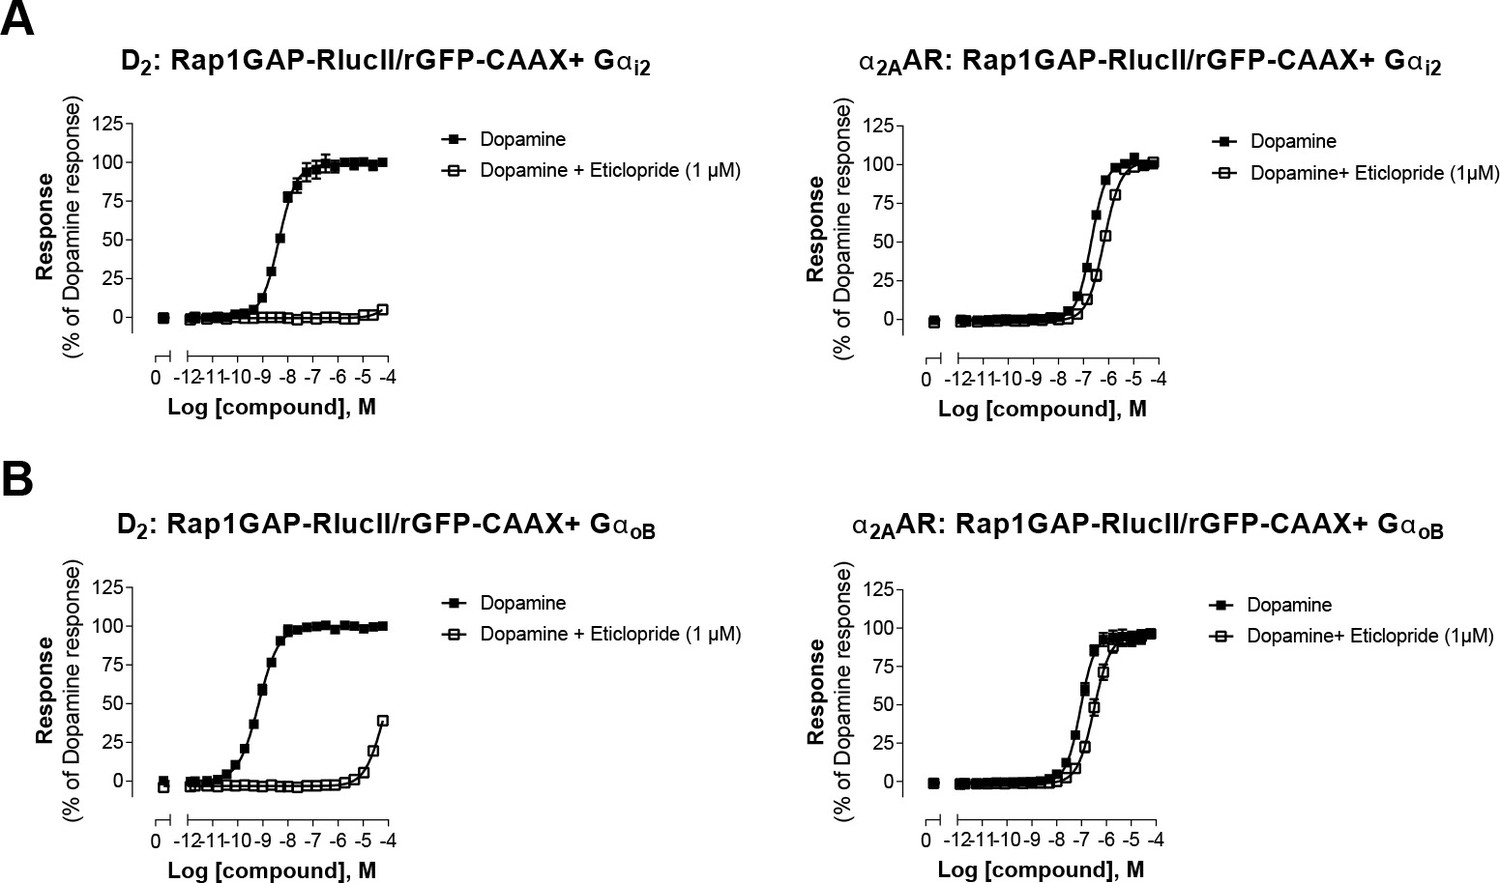
Validation of direct activation of α2AAR by dopamine.
HEK293 cells expressing D2 or α2AAR and the Gαi2 (A) or the GαoB (B) sensors were pretreated or not with the selective D2-family antagonist eticlopride, before stimulation with increasing concentrations of dopamine. Data are the mean ± SEM from 2-4 independent experiments performed in one replicate and expressed in % of the response elicited by dopamine.
-
Figure 6—figure supplement 2—source data 1
Raw data of Figure 6—figure supplement 2.
- https://cdn.elifesciences.org/articles/74101/elife-74101-fig6-figsupp2-data1-v2.xlsx
Figure 7
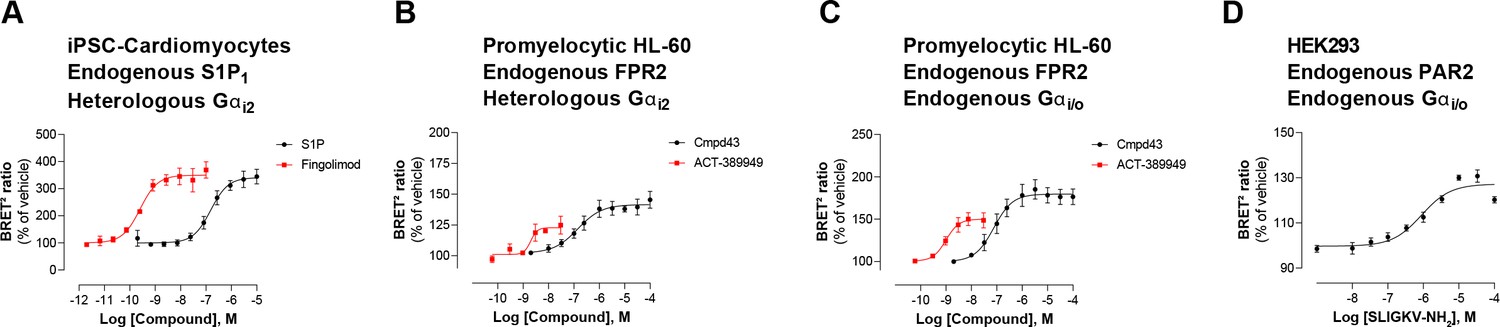
Detection of endogenous receptor- and/or G protein-mediated responses in cells with the EMTA ebBRET platform.
Concentration-dependent activation of Gαi2 protein by (A) endogenous S1P1 receptor in iPSC-derived cardiomyocytes transfected with heterologous Gαi2, (B) endogenous FPR2 in promyelocytic HL-60 cells transfected with heterologous Gαi2, (C) endogenous FPR2 in promyelocytic HL-60 cells with endogenous Gi/o proteins and (D) endogenous PAR2 receptor in HEK293 cells with endogenous Gi/o proteins. In all cases, cells were co-transfected with the Rap1GAP-RlucII/rGFP-CAAX biosensor. Data are the mean ± SEM of 3-4 independent experiments performed in one replicate and are expressed as BRET2 ratio in percentage of response induced by vehicle.
-
Figure 7—source data 1
Raw data of Figure 7.
- https://cdn.elifesciences.org/articles/74101/elife-74101-fig7-data1-v2.xlsx
Author response image 1
Author response image 2
Videos
Video 1
BRET-based imagery of p63-RhoGEF-RlucII recruitment to the plasma membrane upon AT1 activation.
HEK293 cells expressing the p63-RhoGEF-RlucII/rGFP-CAAX sensors with Gαq and AT1 were stimulated with Angiotensin II. BRET levels (the ratio of the acceptor photon count to the total photon count) are expressed as a color code (lowest being black and purple, and highest being red and white).
Video 2
BRET-based imagery of Rap1GAP-RlucII recruitment to the plasma membrane upon D2 activation.
HEK293 cells expressing the Rap1GAP-RlucII/rGFP-CAAX sensors with Gαi2 and D2 were stimulated with dopamine. BRET levels (the ratio of the acceptor photon count to the total photon count) are expressed as a color code (lowest being black and purple, and highest being red and white).
Video 3
BRET-based imagery of PDZ-RhoGEF-RlucII recruitment to the plasma membrane upon TPαR activation.
HEK293 cells expressing the PDZ-RhoGEF-RlucII/rGFP-CAAX + Gα13 and TPαR were stimulated with U46619. BRET levels (the ratio of the acceptor photon count to the total photon count) are expressed as a color code (lowest being black and purple, and highest being red and white).
Tables
Appendix 1—key resources table
| Reagent type (species) or resource | Designation | Source or reference | Identifiers | Additional information |
|---|---|---|---|---|
| Cell line (Homo-sapiens) | HEK293 | 10.1038/ncomms12178 (Namkung et al., 2016) | HEK293 clonal cell line (HEK293SL cells) | |
| Cell line (Homo-sapiens) | ΔGs HEK293 cells | Dr. A. Inoue (Tohoku University, Sendai, Miyagi, Japan) 10.1124 /mol.116.106419 (Stallaert et al., 2017) | HEK293 cells devoid of functional Gαs | |
| Cell line (Homo-sapiens) | ΔG12/13 HEK293 cells | Dr. A. Inoue (Tohoku University, Sendai, Miyagi, Japan) 10.1074/jbc.M116.763854 (Devost et al., 2017) | HEK293 cells devoid of functional Gα12 and Gα13 | |
| Cell line (Homo-sapiens) | ΔGq/11 HEK293 cells | Dr. A. Inoue (Tohoku University, Sendai, Miyagi, Japan) 10.1038/ncomms10156 (Schrage et al., 2015) | HEK293 cells devoid of functional Gαq, Gα11, Gα14 and Gα15 | |
| Cell line (Homo-sapiens) | ΔGi/o HEK293 cells | Dr. A. Inoue (Tohoku University, Sendai, Miyagi, Japan) | HEK293 cells devoid of functional Gαi and Gαo | |
| Cell line (Homo-sapiens) | HL-60 | ATCC | Cat. #: CCL-240 | |
| Cell line (Homo-sapiens) | iCell Cardiomyocytes, 01434 | FUJIFILM Cellular Dynamics | Cat. #: R1057 | |
| Transfected construct (Homo sapiens) | Human Gα subunits-encoding plasmid library | Missouri S&T cDNA Resource Center (https://www.cdna.org/) | Cat. #: GNAI100000; GNAI200000; GNA0OA0000; GNA0OB0000; GNA0Z00000; GNA1200000; GNA1300001; GNA0Q00000; GNA1100000; GNA1400000; GNA1500000; GNA0SL0000 | |
| Transfected construct (Homo sapiens) | Gβ1 | Missouri S&T cDNA Resource Center (https://www.cdna.org/) | Cat. #: GNB0100000 | |
| Transfected construct (Homo sapiens) | Gγ9 | Missouri S&T cDNA Resource Center (https://www.cdna.org/) | Cat. #: GNG0900000 | |
| Transfected construct (Homo sapiens) | Gαs-67-RlucII | 10.1074/jbc.M114.618819(Carr et al., 2014) | ||
| Transfected construct (Homo sapiens) | Gαi1-loop-RlucII | 10.1096/fj.13–242446 (Armando et al., 2014) | ||
| Transfected construct (Homo sapiens) | Gαi2-loop-RlucII | 10.1073/pnas.1312515110 (Quoyer et al., 2013) | ||
| Transfected construct (Homo sapiens) | GαoB-99-RlucII | 10.1073/pnas.1804003115(Mende et al., 2018) | ||
| Transfected construct (Homo sapiens) | Gαq-118-RlucII | 10.1016 /j.bpj.2010.10.025 (Breton et al., 2010) | ||
| Transfected construct (Homo sapiens) | Gα12–136-RlucII | 10.1126/scisignal.aat1631(Namkung et al., 2018) | ||
| Transfected construct (Homo sapiens) | Gα13–130-RlucII | 10.1038 /s42003-020-01453-8 (Avet et al., 2020) | ||
| Transfected construct (Homo sapiens) | GFP10-Gγ1 | 10.1096/fj.13–242446 (Armando et al., 2014) | ||
| Transfected construct (Homo sapiens) | GFP10-Gγ2 | 10.1038/nsmb1134(Galés et al., 2006) | ||
| Transfected construct (Homo sapiens) | EPAC | 10.1124/jpet.109.156398(Leduc et al., 2009) | ||
| Transfected construct (Homo sapiens) | rGFP-CAAX | 10.1038/ncomms12178(Namkung et al., 2016) | ||
| Transfected construct (Homo sapiens) | Rap1GAP-RlucII | This paper | See Materials and Methods | |
| Transfected construct (Homo sapiens) | p63-RhoGEF-RlucII | This paper | See Materials and Methods | |
| Transfected construct (Homo sapiens) | PDZ-RhoGEF-RlucII | This paper | See Materials and Methods | |
| Transfected construct (Homo sapiens) | PKN-RBD-RlucII | 10.1126/scisignal.aat1631(Namkung et al., 2018) | ||
| Transfected construct (Homo sapiens) | MyrPB-Ezrin-RlucII | 10.1242/jcs.255307(Leguay et al., 2021) | ||
| Transfected construct (Homo sapiens) | βarrestin1-RlucII | 10.1126/scisignal.2002522(Zimmerman et al., 2012) | ||
| Transfected construct (Homo sapiens) | βarrestin2-RlucII | 10.1073/pnas.1312515110 (Quoyer et al., 2013) | ||
| Transfected construct (Homo sapiens) | GRK2 | This paper | See Materials and Methods | |
| Transfected construct (Homo sapiens) | RAMP3 | Domain Therapeutics North America | N/A | |
| Transfected construct (Homo sapiens) | EAAC-1 | 10.1016/s0028-3908(98)00091-4 (Brabet et al., 1998) | ||
| Transfected construct (Homo sapiens) | EAAT-1 | Domain Therapeutics North America | N/A | |
| Transfected construct (Homo sapiens) | signal peptide-Flag-AT1 | 10.1074/jbc.M114.631119(Goupil et al., 2015) | ||
| Transfected construct (Homo sapiens) | FLAG-α2BAR | Domain Therapeutics North America | N/A | |
| Transfected construct (Homo sapiens) | HA-β2AR | 10.1074/jbc.M204163200(Lavoie et al., 2002) | ||
| Antibody | Gαi1 (I-20) (Rabbit polyclonal) | Santa Cruz | Cat. #: sc-391 RRID: AB_2247692 | WB (1:500) |
| Antibody | Gαi2 (T-19) (Rabbit polyclonal) | Santa Cruz | Cat. #: sc-7276 RRID:AB_2111472 | WB (1:500) |
| Antibody | Gαo (K-20) (Rabbit polyclonal) | Santa Cruz | Cat. #: sc-387 RRID:AB_2111641 | WB (1:500) |
| Antibody | Gαz (Rabbit monoclonal) | Abcam | Cat. #: ab154846 | WB (1:1000) |
| Antibody | Gαs (K-20) (Rabbit polyclonal) | Santa Cruz | Cat. #: sc-823 RRID:AB_631538 | WB (1:500) |
| Antibody | Gα12 (S-20) (Rabbit polyclonal) | Santa Cruz | Cat. #: sc-409 RRID:AB_2263416 | WB (1:500) |
| Antibody | Gα13 (A-20) (Rabbit polyclonal) | Santa Cruz | Cat. #: sc-410 RRID:AB_2279044 | WB (1:500) |
| Antibody | Gαq (E-17) (Rabbit polyclonal) | Santa Cruz | Cat. #: sc-393 RRID:AB_631536 | WB (1:500) |
| Antibody | Gα11 (C-terminal) (Rabbit polyclonal) | Sigma-Aldrich | Cat. #: SAB2109181 | WB (1:500) |
| Antibody | Gα14 (Rabbit polyclonal) | Sigma-Aldrich | Cat. #: SAB4300771 | WB (1:500) |
| Antibody | Gα15 (Rabbit polyclonal) | ThermoFisher scientific (Pierce) | Cat. #: PA1-29022 RRID:AB_1958024 | WB (1:5,000) |
| Antibody | βactin (Mouse monoclonal) | Sigma-Aldrich | Cat. #: A5441 RRID:AB_476744 | WB (1:5,000) |
| Antibody | Anti-rabbit HRP-coupled (Donkey polyclonal) | GE Healthcare | Cat. #: NA934 RRID:AB_772206 | WB (1:5,000) |
| Antibody | Anti-mouse HRP-coupled (Sheep polyclonal) | GE Healthcare | Cat. #: NA931 RRID:AB_772210 | WB (1:10,000) |
| Commercial assay or kit | FLIPR Calcium 5 Assay Kit | Molecular Devices | Cat. #: R8185 | |
| Chemical compound, drug | α-linolenic acid | Cayman Chemical | Cat. #: 21,910 | |
| Chemical compound, drug | α-MSH | Sigma-Aldrich | Cat. #: M4135 | |
| Chemical compound, drug | γ-MSH | Tocris | Cat. #: 4,272 | |
| Chemical compound, drug | [Pyr1]-Apelin 13 | Tocris | Cat. #: 2,420 | |
| Chemical compound, drug | [Sar1, Ile4,8]-Angiotensin II | Peptides International | Cat. #: PAN-4476-V-1EA | |
| Chemical compound, drug | 3-hydroxyoctanoic acid (3-HOA) | Sigma-Aldrich | Cat. #: H3898 | |
| Chemical compound, drug | 7α–25 dihydroxycholesterol | Sigma-Aldrich | Cat. #: SML0541 | |
| Chemical compound, drug | Acetylcholine chloride | Tocris | Cat. #: 2,809 | |
| Chemical compound, drug | ACT-389949 | Provided by Bristol-Myers Squibb | N/A | |
| Chemical compound, drug | Adenosine | Sigma-Aldrich | Cat. #: A9251 | |
| Chemical compound, drug | AM-630 | Tocris | Cat. #: 1,120 | |
| Chemical compound, drug | Amylin | Tocris | Cat. #: 3,418 | |
| Chemical compound, drug | Angiotensin II (Ang II) | Sigma-Aldrich | Cat. #: A9525 | |
| Chemical compound, drug | Arginine vasopressin (AVP) | Sigma-Aldrich | Cat. #: V9879 | |
| Chemical compound, drug | Atropine | Sigma-Aldrich | Cat. #: A0132 | |
| Chemical compound, drug | Bovine serum albumin | Sigma-Aldrich | Cat. #: A7030 | |
| Chemical compound, drug | C5a | Complement Technology | Cat. #: A144(300) | |
| Chemical compound, drug | Calcitonin | Bachem | Cat. #: H-2250 | |
| Chemical compound, drug | CCK Octapeptide, sulfated (CCK8) | Tocris | Cat. #: 1,166 | |
| Chemical compound, drug | CCL20 | R&D Systems | Cat. #: 360-MP/CF | |
| Chemical compound, drug | CCL3 (MIP-1a) | R&D Systems | Cat. #: 270-LD/CF | |
| Chemical compound, drug | Cholera Toxin (CTX) from Vibrio cholerae | Sigma-Aldrich | Cat. #: C8052 | |
| Chemical compound, drug | Cmpd43 | Provided by Bristol-Myers Squibb | N/A | |
| Chemical compound, drug | Corticotropin-Releasing Factor (CRF) | Bachem | Cat. #: H-2435 | |
| Chemical compound, drug | CXCL12 | R&D Systems | Cat. #: 350-NS | |
| Chemical compound, drug | CXCL13 | R&D Systems | Cat. #: 801 CX/CF | |
| Chemical compound, drug | CXCL8 | R&D Systems | Cat. #: 208-IL/CF | |
| Chemical compound, drug | DAMGO | Tocris | Cat. #: 1,171 | |
| Chemical compound, drug | Dopamine | Sigma-Aldrich | Cat. #: H8502 | |
| Chemical compound, drug | DPCPX | Tocris | Cat. #: 0439 | |
| Chemical compound, drug | Dynorphin A | Tocris | Cat. #: 3,195 | |
| Chemical compound, drug | Endothelin-1 | Tocris | Cat. #: 1,160 | |
| Chemical compound, drug | Eticlopride | Tocris | Cat. #: 1,847 | |
| Chemical compound, drug | Fingolimod | Provided by Bristol-Myers Squibb | N/A | |
| Chemical compound, drug | Gastric Inhibitory Peptide (GIP) | Bachem | Cat. #: H-5645 | |
| Chemical compound, drug | Ghrelin | Tocris | Cat. #: 1,463 | |
| Chemical compound, drug | Glucagon (Aittaleb et al., 2010; Aittaleb et al., 2011; Armando et al., 2014; Atwood et al., 2011; Avet et al., 2020; Azzi et al., 2003; Bowes et al., 2012; Brabet et al., 1998; Breton et al., 2010; Bünemann et al., 2003; Carr et al., 2014; Casey et al., 1990; Chandan et al., 2021; De Haan and Hirst, 2004; Devost et al., 2017; Fukuhara et al., 2001; Galandrin et al., 2007; Galés et al., 2005; Galés et al., 2006; Goupil et al., 2015; Hauser et al., 2017; Hauser et al., 2022; Hoffmann et al., 2005; Inoue et al., 2019; Jordan et al., 1999; Kawamata et al., 2003; Kenakin, 2019; Kim et al., 2002) | Bachem | Cat. #: H-6790 | |
| Chemical compound, drug | Glucagon-like peptide-1 GLP-1 (Bowes et al., 2012; Brabet et al., 1998; Breton et al., 2010; Bünemann et al., 2003; Carr et al., 2014; Casey et al., 1990; Chandan et al., 2021; De Haan and Hirst, 2004; Devost et al., 2017; Fukuhara et al., 2001; Galandrin et al., 2007; Galés et al., 2005; Galés et al., 2006; Goupil et al., 2015; Hauser et al., 2017; Hauser et al., 2022; Hoffmann et al., 2005; Inoue et al., 2019; Jordan et al., 1999; Kawamata et al., 2003; Kenakin, 2019; Kim et al., 2002; Kobayashi et al., 2019; Laschet et al., 2019; Lavoie et al., 2002; Leduc et al., 2009; Leguay et al., 2021; Lu et al., 2014; Lutz et al., 2007) | Bachem | Cat. #: H-6795 | |
| Chemical compound, drug | Glucagon-like peptide-2 GLP-2 (Aittaleb et al., 2010; Aittaleb et al., 2011; Armando et al., 2014; Atwood et al., 2011; Avet et al., 2020; Azzi et al., 2003; Bowes et al., 2012; Brabet et al., 1998; Breton et al., 2010; Bünemann et al., 2003; Carr et al., 2014; Casey et al., 1990; Chandan et al., 2021; De Haan and Hirst, 2004; Devost et al., 2017; Fukuhara et al., 2001; Galandrin et al., 2007; Galés et al., 2005; Galés et al., 2006; Goupil et al., 2015; Hauser et al., 2017; Hauser et al., 2022; Hoffmann et al., 2005; Inoue et al., 2019; Jordan et al., 1999; Kawamata et al., 2003; Kenakin, 2019; Kim et al., 2002; Kobayashi et al., 2019; Laschet et al., 2019; Lavoie et al., 2002; Leduc et al., 2009) | Bachem | Cat. #: H-7742 | |
| Chemical compound, drug | Glutamate | Sigma-Aldrich | Cat. #: 49,621 | |
| Chemical compound, drug | GnRH (LH-RH) | Peptides International | Cat. #: PLR-4013 | |
| Chemical compound, drug | Histamine | Tocris | Cat. #: 3,545 | |
| Chemical compound, drug | Kallidin | Anaspec | Cat. #: 22,853(AN) | |
| Chemical compound, drug | Leukotriene B4 (LTB4) | Cayman Chemical | Cat. #: 20,110 | |
| Chemical compound, drug | Leukotriene D4 (LTD4) | Cayman Chemical | Cat. #: 20,310 | |
| Chemical compound, drug | Litocholic acid | Sigma-Aldrich | Cat. #: L6250 | |
| Chemical compound, drug | Melatonin | Bachem | Cat. #: Q-1300 | |
| Chemical compound, drug | MDL 29,951 | Cayman Chemical | Cat. #: 16,266 | |
| Chemical compound, drug | Neuropeptide FF (NPFF) | Tocris | Cat. #: 3,137 | |
| Chemical compound, drug | Neuropeptide Y (NPY) | Bachem | Cat. #: H-6375 | |
| Chemical compound, drug | Nicotinic acid | Abcam | Cat. #: ab120145 | |
| Chemical compound, drug | Nociceptin | Tocris | Cat. #: 910 | |
| Chemical compound, drug | Noradrenaline | Tocris | Cat. #: 5,169 | |
| Chemical compound, drug | Oleoyl-Lysophosphatidic acid (O-LPA) | Sigma-Aldrich | Cat. #: L7260 | |
| Chemical compound, drug | Orexin-A | Bachem | Cat. #: H-4172 | |
| Chemical compound, drug | Oxytocin | Tocris | Cat. #: 1910 | |
| Chemical compound, drug | Parathyroid Hormone (Aittaleb et al., 2010; Aittaleb et al., 2011; Armando et al., 2014; Atwood et al., 2011; Avet et al., 2020; Azzi et al., 2003; Bowes et al., 2012; Brabet et al., 1998; Breton et al., 2010; Bünemann et al., 2003; Carr et al., 2014; Casey et al., 1990; Chandan et al., 2021; De Haan and Hirst, 2004; Devost et al., 2017; Fukuhara et al., 2001; Galandrin et al., 2007; Galés et al., 2005; Galés et al., 2006; Goupil et al., 2015; Hauser et al., 2017; Hauser et al., 2022; Hoffmann et al., 2005; Inoue et al., 2019; Jordan et al., 1999; Kawamata et al., 2003; Kenakin, 2019; Kim et al., 2002; Kobayashi et al., 2019; Laschet et al., 2019; Lavoie et al., 2002; Leduc et al., 2009; Leguay et al., 2021) | Sigma-Aldrich | Cat. #: P3796 | |
| Chemical compound, drug | Pertussis toxin (PTX) from Bordetella pertussis | List Biological Laboratories | Cat. #: 179 A(LB) | |
| Chemical compound, drug | pH (proton) (Hydrochloric acid) | Sigma-Aldrich | Cat. #: 320,331 | |
| Chemical compound, drug | Probenecid | Sigma-Aldrich | Cat. #: P8761 | |
| Chemical compound, drug | Prolume Purple (methoxy e-Coelenterazine; Me-O-e-CTZ) | Nanolight | Cat. #: 369 | |
| Chemical compound, drug | Propionate (sodium salt) | Sigma-Aldrich | Cat. #: P1880 | |
| Chemical compound, drug | Prostaglandin D2 (PGD2) | Cayman Chemical | Cat. #: 12,010 | |
| Chemical compound, drug | Prostaglandin E2 (PGE2) | Sigma-Aldrich | Cat. #: P0409 | |
| Chemical compound, drug | RFamide-related peptide 3 (RFRP3) | Tocris | Cat. #: 4,683 | |
| Chemical compound, drug | Rimonabant | Cayman Chemical | Cat. #: 9000484 | |
| Chemical compound, drug | Saralasin | ApexBio | Cat. #: B5063 | |
| Chemical compound, drug | Serotonin | Cayman Chemical | Cat. #: 14,332 | |
| Chemical compound, drug | SLIGKV-NH2 (PAR2 AP) | Tocris | Cat. #: 3,010 | |
| Chemical compound, drug | SNC80 | Sigma-Aldrich | Cat. #: S2812 | |
| Chemical compound, drug | Somatostatin-14 | Bachem | Cat. #: H-6276 | |
| Chemical compound, drug | Sphingosine 1-phosphate | Cayman | Cat. #: 62,570 | |
| Chemical compound, drug | TFLLR-NH2 (PAR1 AP) | Tocris | Cat. #: 1,464 | |
| Chemical compound, drug | TRV027 | Provided by Bristol-Myers Squibb | N/A | |
| Chemical compound, drug | UBO-QIC (FR900359) | Institute for Pharmaceutical Biology of the University of Bonn | N/A | |
| Chemical compound, drug | Undecanoic acid | Sigma-Aldrich | Cat. #: 171,476 | |
| Chemical compound, drug | Urocortin II | Phoenix Pharmaceutical | Cat. #: 019–30 | |
| Chemical compound, drug | UTP | Sigma-Aldrich | Cat. #: U1006 | |
| Chemical compound, drug | Vasoactive Intestinal Peptide (VIP) | Tocris | Cat. #: 1911 | |
| Chemical compound, drug | WB4101 | Tocris | Cat. #: 946 | |
| Chemical compound, drug | WIN55,212–2 | Enzo Life Sciences | Cat. #: BMLCR105 | |
| Chemical compound, drug | YM-254890 | Wako Pure Chemical Industries (Fujifilm) | Cat. #: 257–00631 | |
| Chemical compound, drug | Zinc chloride (Zn2+) | Sigma-Aldrich | Cat. #: 229,997 | |
| Software, algorithm | Prism, Version 8.3 | GraphPad | ||
| Software, algorithm | MATLAB, Version R2019b | MathWorks | ||
| Software, algorithm | ImageJ, Version 1.52 a | NIH https://imagej.nih.gov/ij/ | ||
| Software, algorithm | Scipy, Version 1.4.1 | https://www.scipy.org | ||
| Other | 96 W white plate | Greiner Bio-one | Cat. #: 655,083 | |
| Other | 96 W black plate, clear-bottom | Greiner Bio-one | Cat. #: 655,090 | |
| Other | OptiPlate-384, White Opaque 384-well Microplate | Perkin Elmer | Cat. #: 6007290 | |
| Other | 35 mm poly-d-lysine-coated glass-bottom culture dishes | Mattek | Cat. #: P35GC-1.5–14 C | |
| Other | Microplate washer | BioTek Instruments | Cat. #: 405TSUS | |
| Other | D300e Digital Dispenser | Tecan | ||
| Other | T8 + Dispensehead Cassettes | Hp (Tecan) | Cat. #: 30097370 | |
| Other | Synergy NEO Luminescence microplate reader | BioTek Instruments | ||
| Other | FlexStation 2 Multi-mode, auto-pipetting microplate reader | Molecular Devices | ||
| Other | Inverted microscope | Nikon Eclipse Ti-U | ||
| Other | x60 objective lens | Nikon CFI Apochromat TIRF | ||
| Other | EMCCD camera | Nuvu HNu 512 |
Additional files
-
Supplementary file 1
Impact of G proteins, receptor or effector-RlucII titration on absolute pEC50 values.
(A) Absolute pEC50 values of responses elicited in WT vs. Knockout Gα protein background cells. pEC50 values deduced from dose-response curves for various receptor tested in parental (WT) HEK293 cells or devoid of Gs, G12/13, Gq/11 or Gi/o proteins are related to Figure 2—figure supplement 1. (B) Absolute pEC50 values of responses elicited in cells transfected with different amounts of Gα proteins. pEC50 values deduced from dose-response curves obtained following Gα subunit titration in HEK293 cells transfected with GEMTA sensors and related to Figure 2—figure supplement 3A. (C) Absolute pEC50 values of responses elicited in cells transfected with different amounts of receptors. pEC50 values deduced from dose-response curves obtained following ETA titration in HEK293 cells transfected with GEMTA sensors and related to Figure 2—figure supplement 3B. (D) Absolute pEC50 values of responses elicited in cells transfected with different amounts of Effector-RlucII. pEC50 values deduced from dose-response curves obtained following Effector-RlucII titration in HEK293 cells transfected with GEMTA sensors and related to Figure 2—figure supplement 3C.
- https://cdn.elifesciences.org/articles/74101/elife-74101-supp1-v2.xlsx
-
Supplementary file 2
List of tested receptors and ligands, along with the raw Emax, absolute pEC50 and their corresponding double normalized (dnor) values.
The Emax (in % of vehicle response) and absolute pEC50 values deduced from concentration-response curves for the 100 GPCRs tested as well as the double normalized Emax and pEC50 values calculated are related to Supplementary file 3 and Figure 3, respectively.
- https://cdn.elifesciences.org/articles/74101/elife-74101-supp2-v2.xlsx
-
Supplementary file 3
Signaling profiles of 100 therapeutically-relevant human GPCRs using the EMTA ebBRET platform.
Concentration-response curves in HEK293 cells expressing the indicated biosensor after stimulation of heterologously expressed receptor with the indicated ligand. Data are the mean ± SEM from at least 3 independent experiments and expressed in % of the response obtained for cells treated with vehicle. For ligands that elicited endogenous receptor-mediated responses (curves with light gray and yellow background for responses similar to and better responses than those obtained with the endogenous receptors, respectively), curves from cells expressing endogenous or heterologously expressed receptors are shown in Figure 3—figure supplement 2.
- https://cdn.elifesciences.org/articles/74101/elife-74101-supp3-v2.pdf
-
Supplementary file 4
Comparison of G protein couplings identified with EMTA platform and other datasets.
Comparison of G protein couplings identified with EMTA platform and TGF-α shedding assay in Inoue et al., 2019 (A) or reported in GtP database (B).
- https://cdn.elifesciences.org/articles/74101/elife-74101-supp4-v2.xlsx
-
Supplementary file 5
EMTA biosensor amino acid sequences.
- https://cdn.elifesciences.org/articles/74101/elife-74101-supp5-v2.docx
-
Transparent reporting form
- https://cdn.elifesciences.org/articles/74101/elife-74101-transrepform1-v2.docx
Download links
A two-part list of links to download the article, or parts of the article, in various formats.
Downloads (link to download the article as PDF)
Open citations (links to open the citations from this article in various online reference manager services)
Cite this article (links to download the citations from this article in formats compatible with various reference manager tools)
Effector membrane translocation biosensors reveal G protein and βarrestin coupling profiles of 100 therapeutically relevant GPCRs
eLife 11:e74101.
https://doi.org/10.7554/eLife.74101


