Ligand binding remodels protein side-chain conformational heterogeneity
- Department of Bioengineering and Therapeutic Sciences, University of California, San Francisco, United States
- Biophysics Graduate Program, University of California San Francisco, United States
- Atomwise Inc., United States
Figures
Figure 1 with 6 supplements
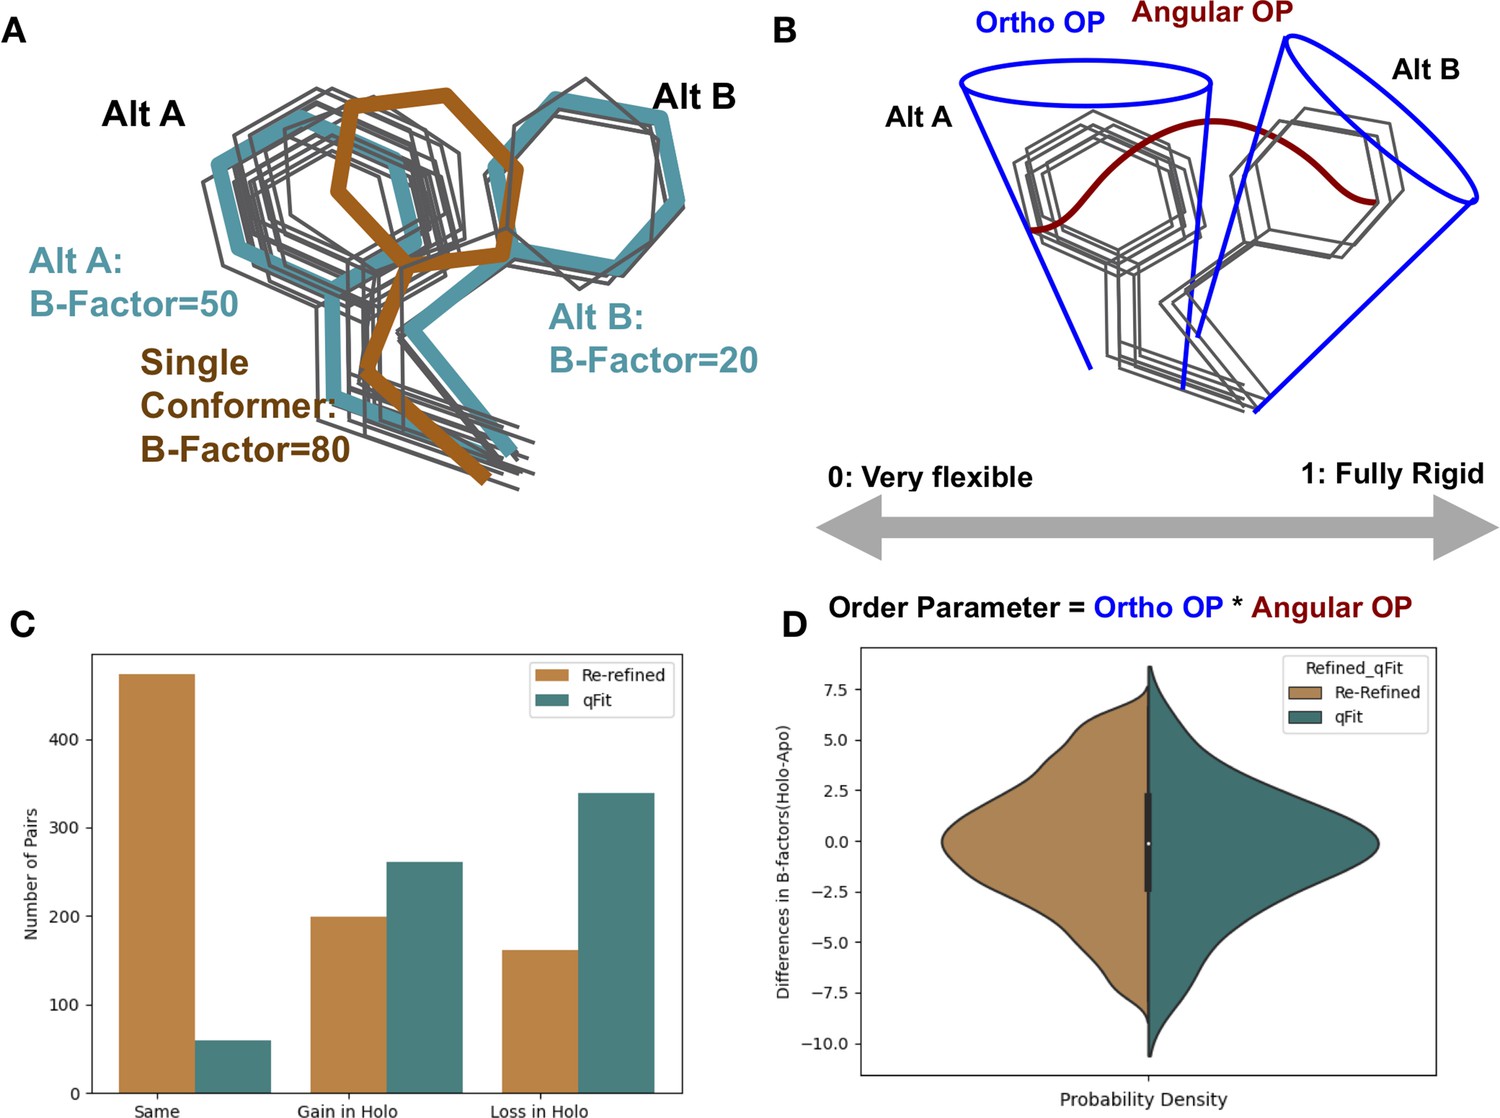
Representing structural data as multiconformer models.
(A) The gray outlines represent snapshots of the true underlying ensemble of the phenylalanine residue. The orange stick represents the residue modeled as a single conformer. The teal sticks represent the residue modeled as alternative conformers. The single conformer accounts for all heterogeneity in the B-factor, increasing the B-factor and reducing our ability to determine harmonic versus anharmonic motion. When a residue is modeled using alternative conformers, this heterogeneity is divided between harmonic heterogeneity, captured by the B-factors of each alternative conformation and the anharmonic heterogeneity, captured by spread in coordinates between the alternative conformations. (B) To quantify the conformational heterogeneity of each residue, we used multi-conformer order parameters (Fenwick et al., 2014), which are the products of the ortho order parameter that captures the harmonic or B-factor portion of each conformation and the angular order parameter that captures the anharmonic portion or the displacement between alternative conformers. These are multiplied to produce the final order parameter (Materials and methods). (C) The change in the number of alternative conformers (holo-apo) in binding site residues. In the re-refined dataset (orange), the majority of structures have the same number of alternative conformers in the binding site, with the second most popular category gaining alternative conformers in the holo structure. In the qFit dataset (teal), the majority of structures lose an alternative conformer in the holo structure, with the second most common category being gaining an alternative conformer. (D) The differences in B-factors (holo-apo) in the re-refined (orange) and qFit (teal) datasets. Overall, there was no significant difference in B-factors between holo and apo structures in both the re-refined and qFit datasets.
Figure 1—figure supplement 1
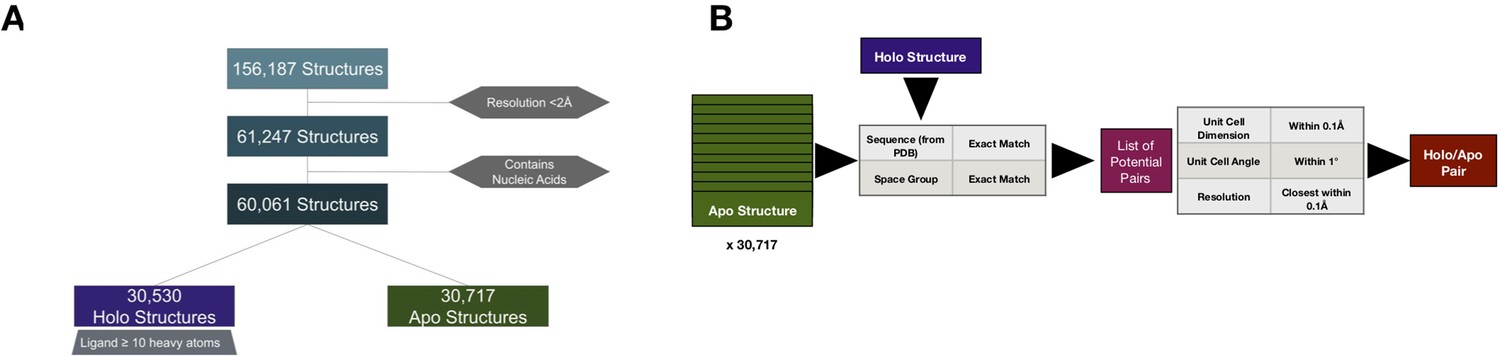
Pipeline to create apo/holo pairs.
(A) To select apo/holo matched pairs, we first categorized the PDB structures into holo or apo structures, removing structures with a resolution worse than 2 Å, not resolved using X-ray crystallography, and those that include nucleic acids. Holo structures (n = 30,530) were required to have a ligand, not including common crystallographic additives, with 10 or more heavy atoms. All others were classified as apo (n = 30,171). (B) For every holo structure, we compared it to the 30,717 apo structures first matching for exact sequence and space group and controlling for similar unit cell dimensions (within 0.1 Å) and angles (within 1°). Finally, we selected the structures paired for resolution within 0.1 Å.
Figure 1—figure supplement 2
Quality control of apo/holo pairs.
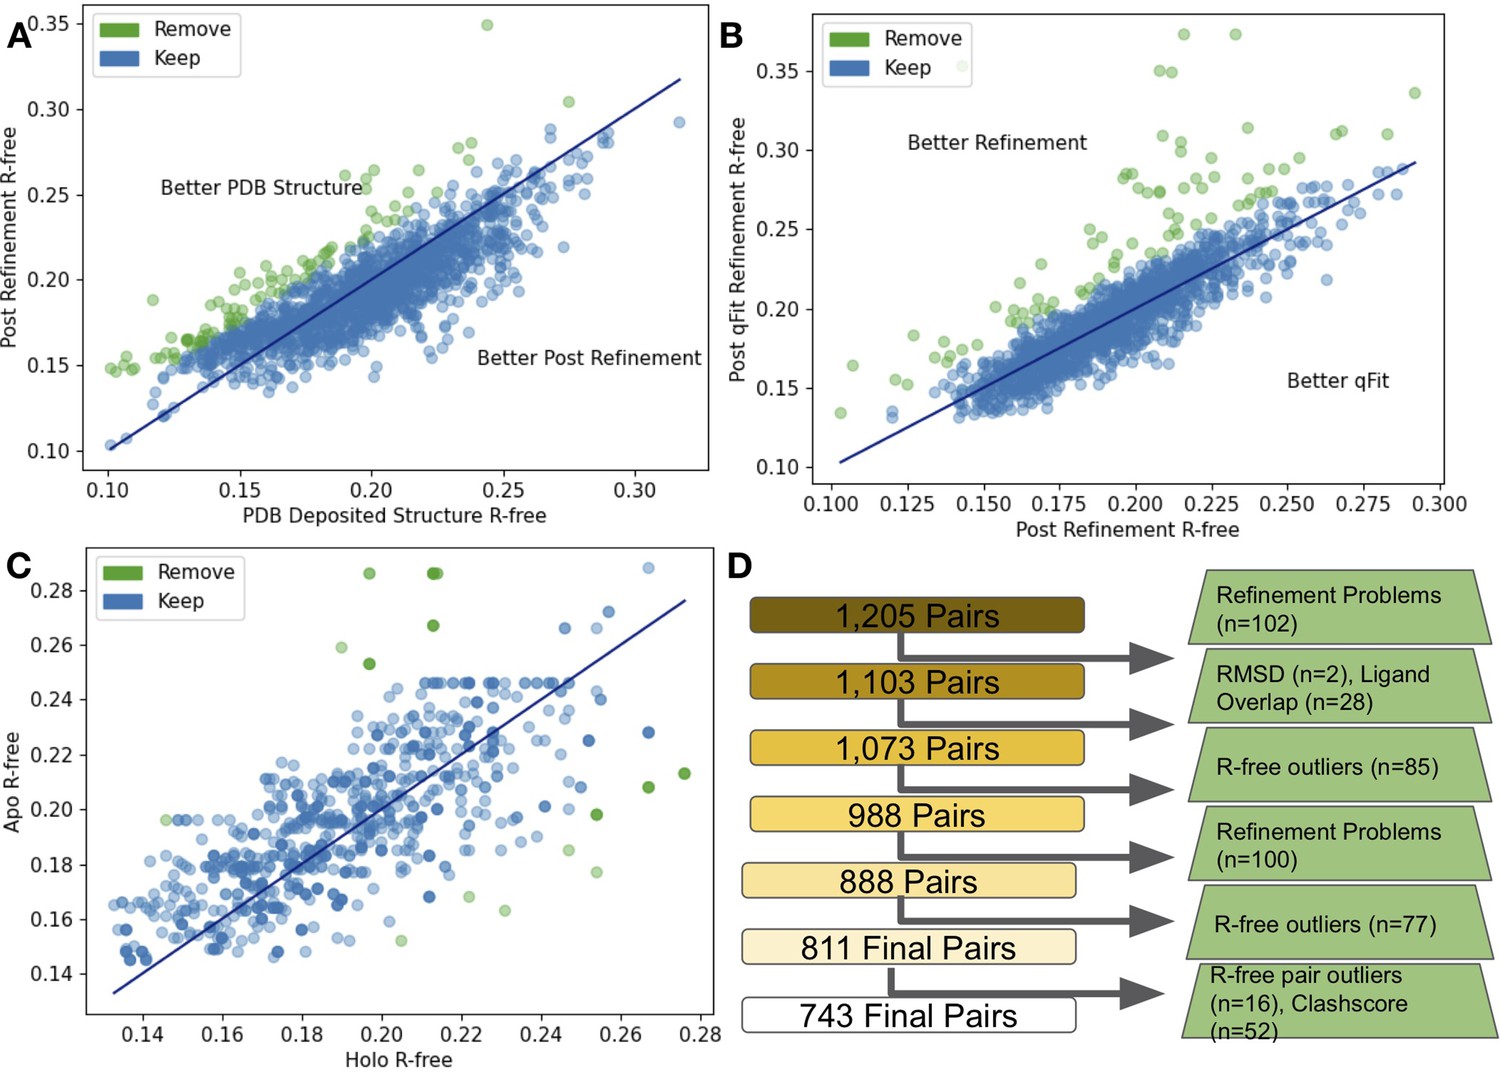
(A) The differences in R-free values between the PDB deposited structures and after re-refinement. 85 structures were removed (green) as their R-free increased by more than 2.5%. (B) The difference in R-free statistics between the re-refined structures and the qFit structures. 77 structures were removed (green) as their R-free increased by more than 2.5%. (C) The difference in R-free statistics in qFit structures between the holo and apo structure. 16 pairs were removed (green) as their R-free statistics differed by 5% or more between the pairs. (D) Flowchart representing our quality control process, with removed structures in green boxes.
Figure 1—figure supplement 3
Resolution distributions in apo/holo pairs.
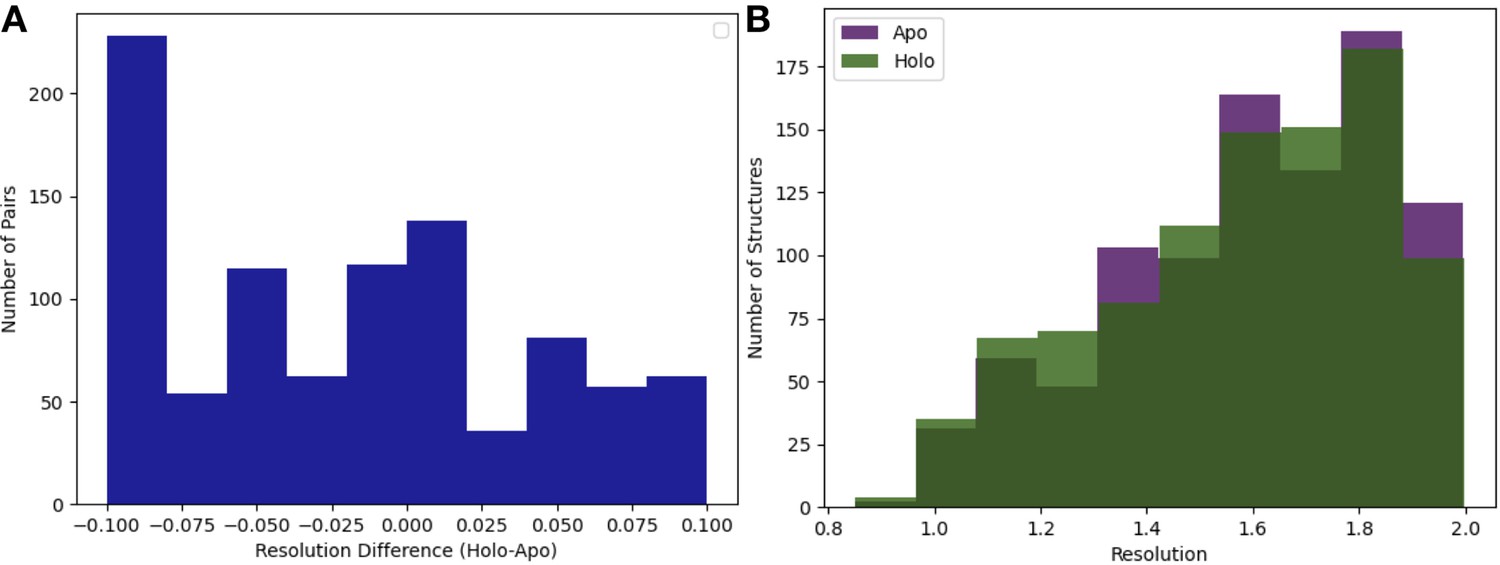
(A) Resolution difference between pairs (holo-apo). The median pairwise difference was 0.01 Å, with slightly better resolution in the apo structures, and the standard deviation was 0.06 Å. (B) The distribution of resolution (median = 1.6 Å) of the apo (n = 432) and holo (n = 743) dataset. The median apo resolution was 1.58 Å, and the median holo resolution was 1.58 Å.
Figure 1—figure supplement 4

Ligand and protein type distributions in apo/holo pairs.
(A) The top 30 ligands in our dataset by PDB chemical ID. NAG (2-acetamido-2-deoxy-beta-d-glucopyranose) and H06 ((E)–4-((2-nicotinoylhydrazono)methyl) benzimidamide) were the most frequent ligands in our dataset. (B) The distribution of the number of heavy atoms of a ligand of interest. The median number of heavy atoms was 19. There were only 10 very large ligands (>50 heavy atoms, e.g., atazanavir). (C) The most common proteins in our dataset. Eleven proteins in our dataset were included in six or more pairs. This included our most common proteins including: endothiopepsin (n = 73 pairs), lysozyme (n = 62 pairs), trypsin (n = 48 pairs), and carbonic anhydrase 2 (n = 46 pairs). (D) The distribution of enzymes (n = 95) based on their Enzyme Commission Number.
Figure 1—figure supplement 5

Changes in the number of alternative conformations and B-factors in apo/holo pairs.
(A) The change in the number of alternative conformers (holo-apo) across all residues. In the re-refined dataset (orange), the majority models have a gain of the number of alternative conformers in the holo, with the second most common category being a loss of alternative conformers. In the qFit dataset (teal), the majority of structures lose an alternative conformer in the holo model, with the second most common category being gaining an alternative conformer. (B) The difference in B-factors across all residues. There was a slight increase in B-factors in holo models in both the re-refined and the qFit datasets.
Figure 1—figure supplement 6

Differences in B-factors between apo/holo pairs.
(A) The difference in B-factors between holo and apo pairs. The range of the difference in B-factors was –199.8 Å2 to 197.0 Å2; here, we remove the most 10% extreme values, which are due to poor density in loop regions leading to high B-factors for those individual residues. Across all residues, on average B-factors were higher in holo structures compared to apo (0.34 Å2, median difference [holo-apo]; p=4.4 × 10–208, Wilcoxon signed-rank test). (B) In binding site residues, B-factors were on average the same between holo and apo residues (0.06 Å2, median difference in B-factors; p=0.7, Wilcoxon signed-rank test).
Figure 2 with 1 supplement
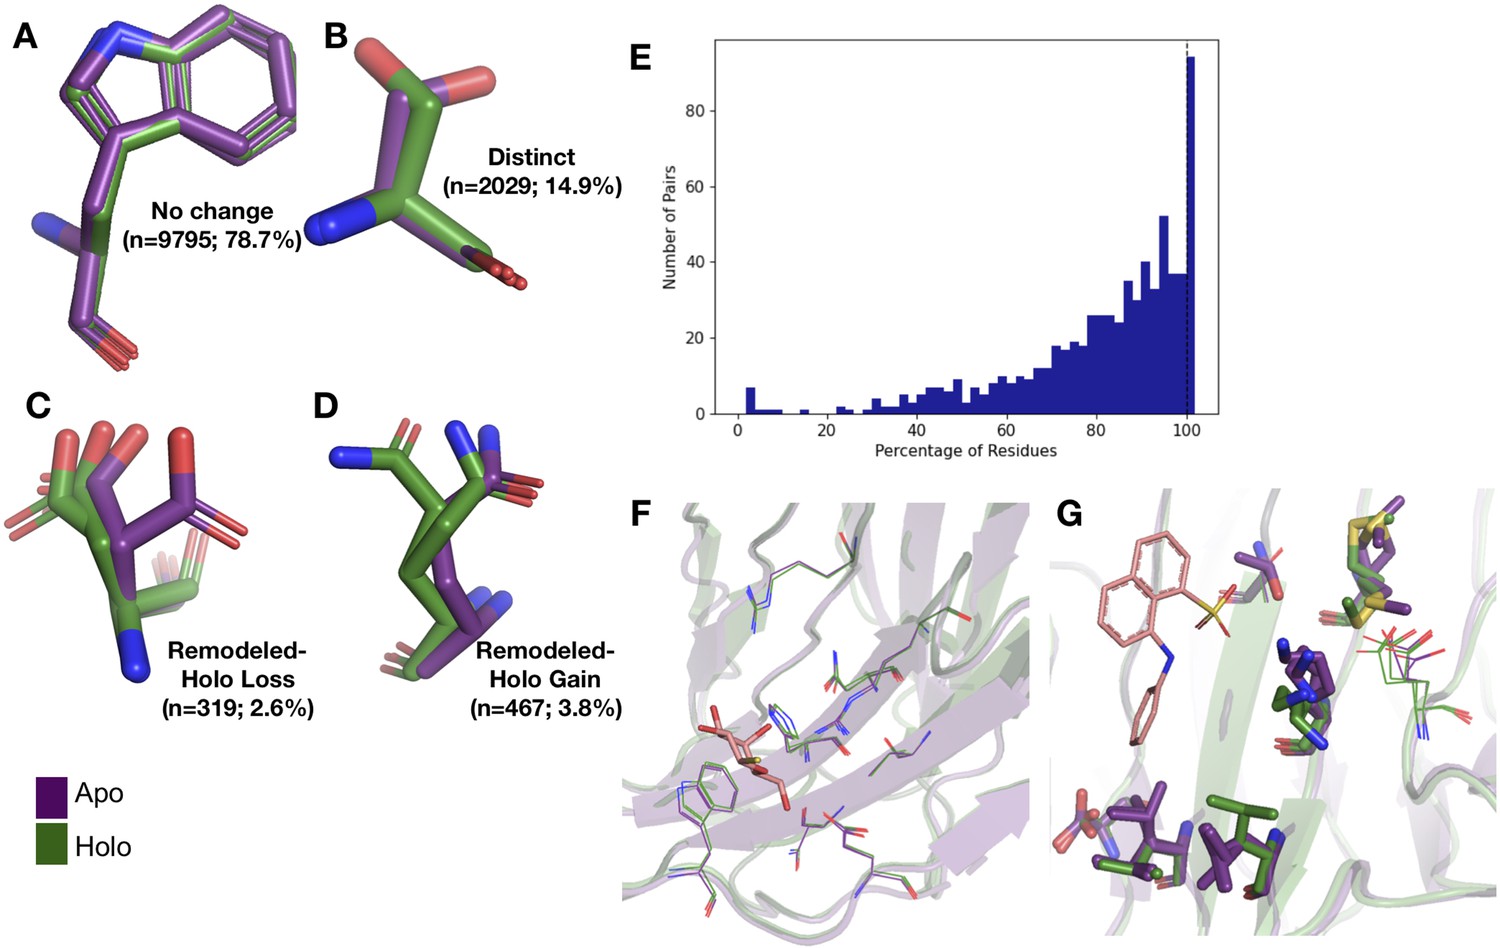
Examples of rotamer changes between apo (purple) and holo (green) binding site residues.
(A) Example residues for: ‘no change’ in rotamer status, accounting for 78.7% of binding site residues; (B) ‘distinct’ rotamers, accounting for 14.9% of binding site residues; (C) ‘remodeled-holo loss,’ accounting for 2.6% of binding site residues; and (D) ‘remodeled-holo gain,’ accounting for 3.8% of binding site residues. (E) The percentage of residues in the binding site that have the same rotamer status in the holo and apo structures. The black line highlights the 11% of pairs that had the same rotamer status for all binding site residues. (F) Paired galectin-3 apo (purple; PDB: 5NFC) and holo (green; PDB: 4JC1, ligand: thiodigalactoside) multiconformer models with no changes in rotamer status in any binding site residues. (G) Paired transthyretin apo (purple; PDB: 1ZCR) and holo (green; PDB: 3CFN, ligand: 1-anilino-8-naphthalene) multiconformer models with six out of nine residues with remodeled or different rotamer status in the binding site residues. Residues with rotamer changes are shown as sticks. Residues with no change in rotamer status are shown as lines.
Figure 2—figure supplement 1
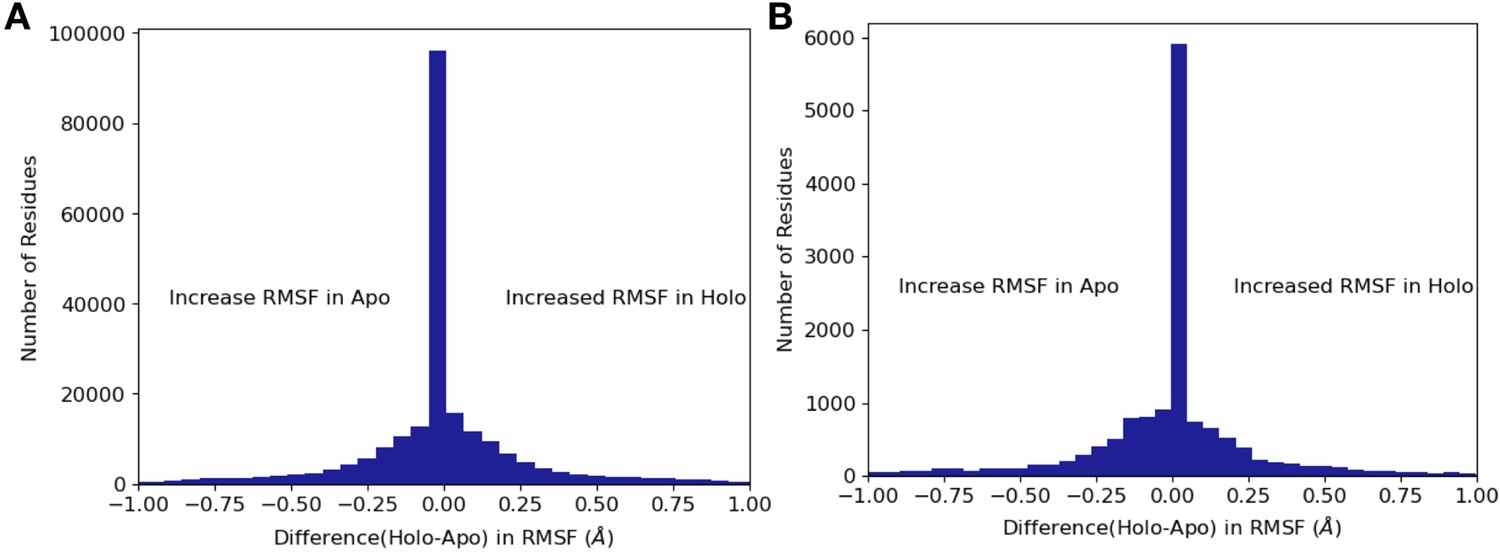
Differences in RMSF between apo/holo pairs.
(A) Across all residues, apo residues had a higher root mean square fluctuation (RMSF) compared to holo residues (0.17 Å vs. 0.16 Å, mean RMSF; –0.006, mean difference: p=4.5 × 10⁻²⁹, Wilcoxon signed-rank test). (B) Within binding site residues, apo residues also had a higher RMSF compared to holo residues (0.17 Å vs. 0.15 Å, mean RMSF; –0.02, mean difference; p=3.7 × 10⁻⁸, Wilcoxon signed-rank test).
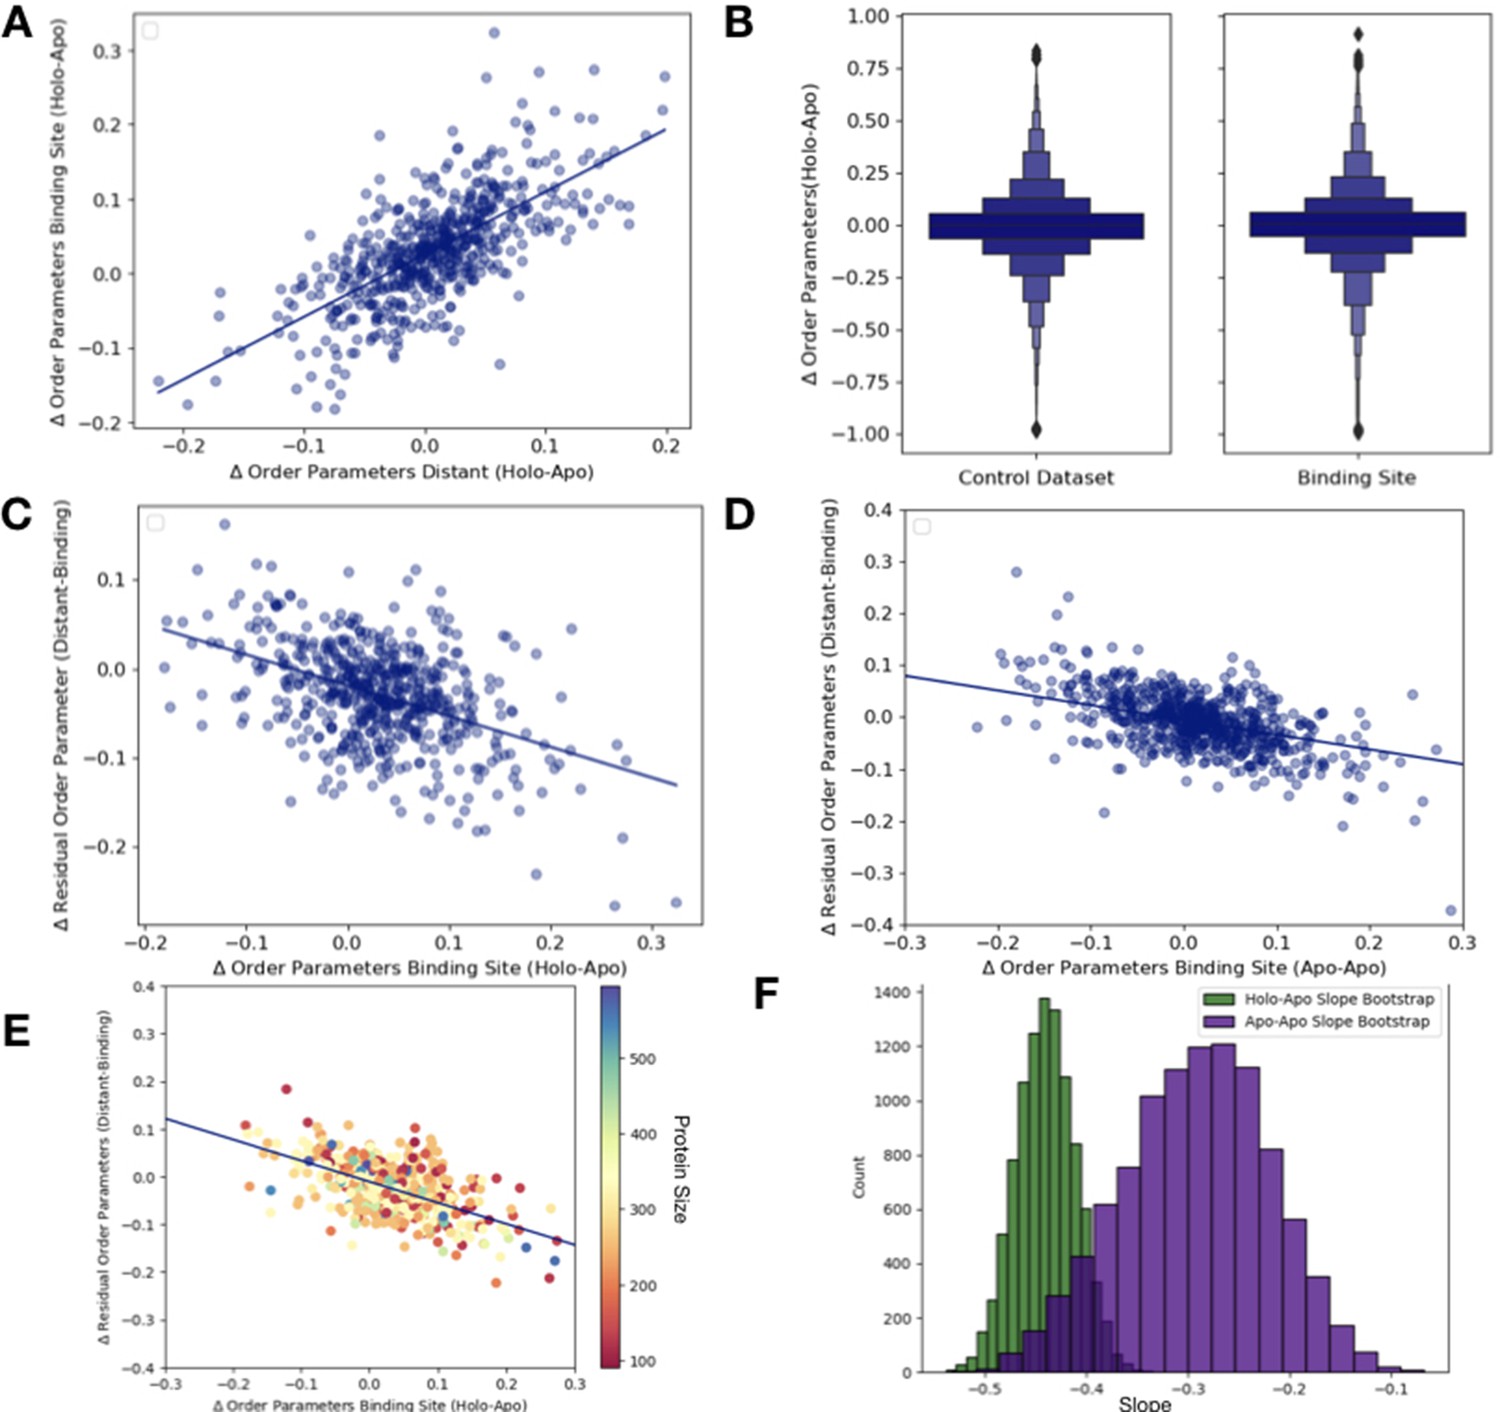
Figure 3 with 5 supplements
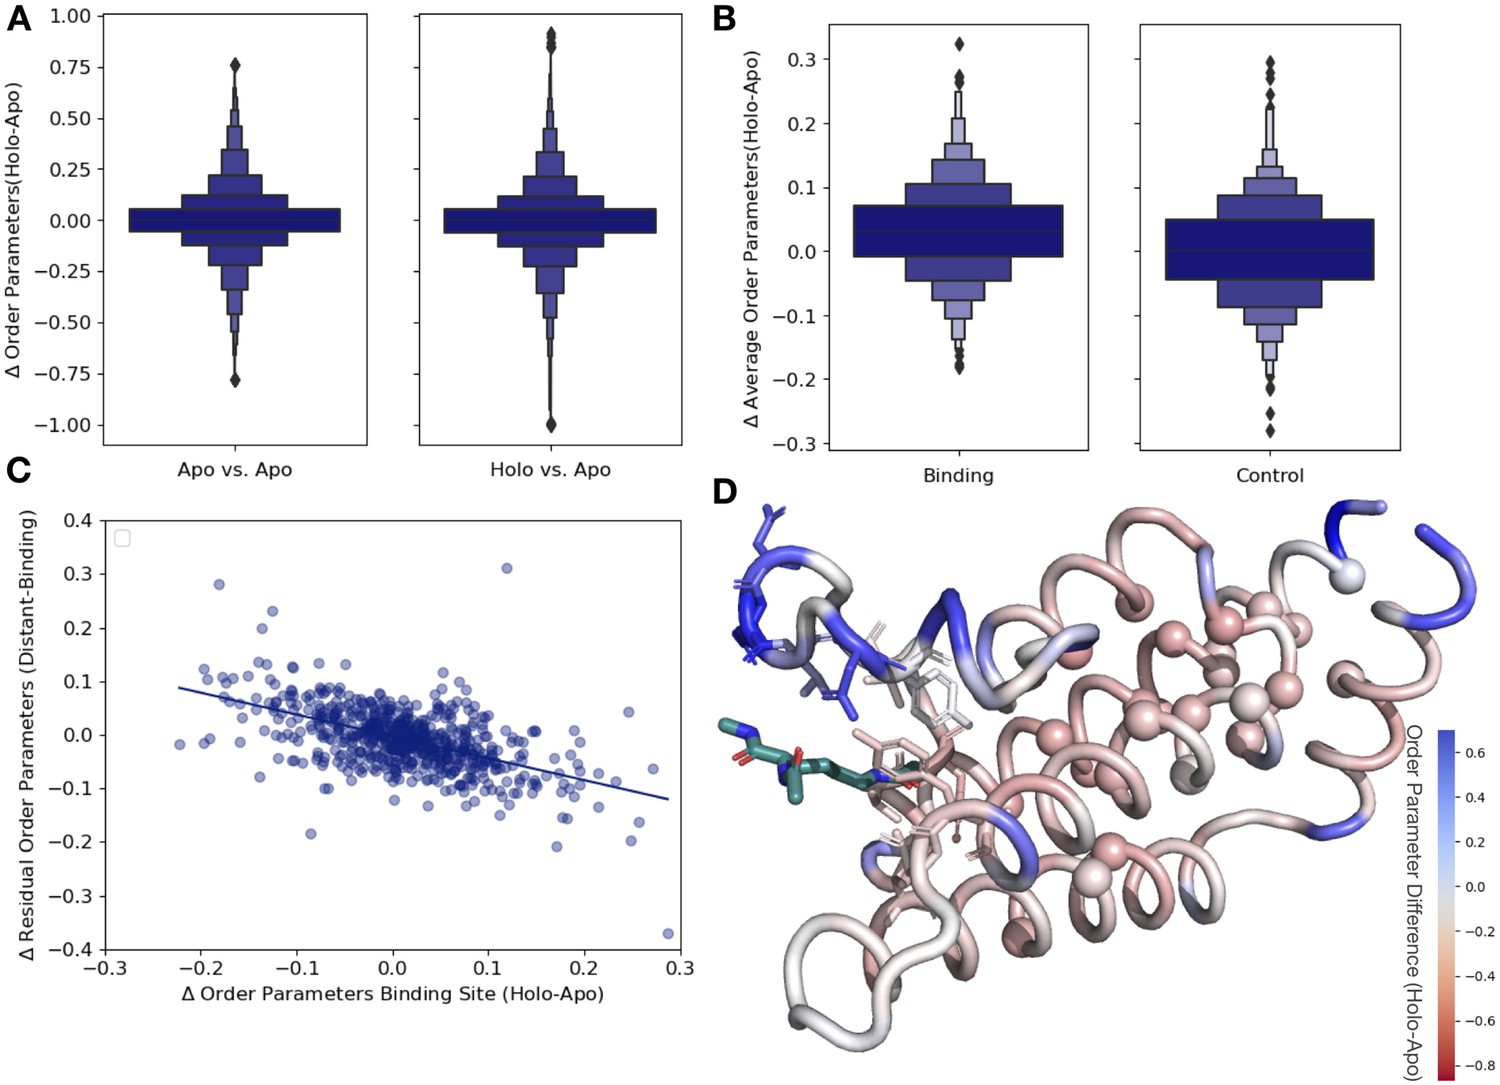
Ligand binding alters conformational heterogeneity patterns.
(A) Across all residues, the distribution of order parameter changes is much wider in holo-apo pairs compared to apo-apo pairs (p=3.4 × 10⁻¹⁷, individual Mann–Whitney U test); however, there is no median difference in order parameters upon ligand binding (median difference: 0 for both), indicating that ligands have varying impacts across different proteins. (B) The distribution of the average differences of order parameters in binding site residues compared to the average differences in a control dataset made up of the same number, type, and solvent exposure of amino acids. Comparing the apo/holo structures, on average binding site residues got more rigid upon binding. The median difference in order parameters was 0.03 for the binding site residues compared to 0 for the control dataset (p=3.4 × 10⁻⁷, individual Mann–Whitney U test). (C) The relationship of the difference in order parameters between the holo and apo residues in binding site residues versus the residual order parameter in distant, non-solvent-exposed residues. We observed a negative trend (slope = −0.44), indicating that structures that had a loss of heterogeneity in the binding site (right on the x-axis) had a relative gain in heterogeneity in residues distant from the binding site that were not solvent exposed (top on the y-axis). (D) We explore this trend in a structure of human ATAD2 bromodomain (PDB: 5A5N). Residues are colored by the differences between the average binding site order parameter minus the order parameter for each residue. Blue residues are less dynamic than the average binding site residue, and red residues are more dynamic than the average binding site residue. Binding site residues are represented by sticks, and distant, non-solvent-exposed alpha carbons are represented by spheres. The ligand ((2S)-2,6-diacetamido-N-methylhexanamide) is colored in teal.
Figure 3—figure supplement 1
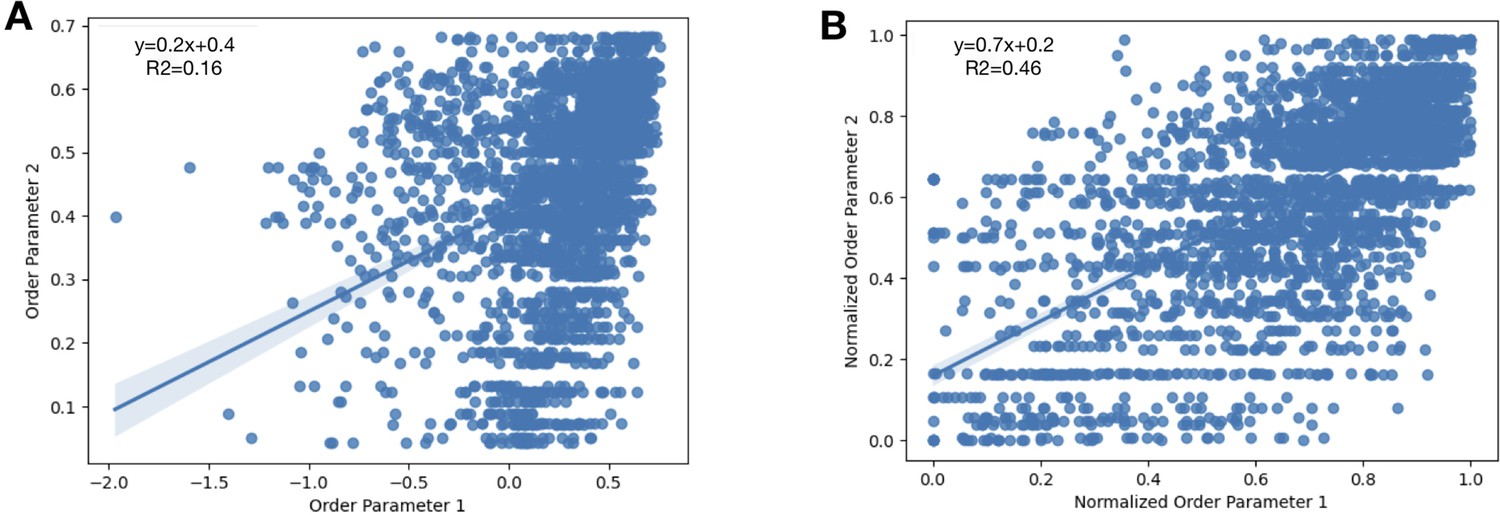
To normalize the order parameters across all structures, we looked at 31 lysozyme structures and compared their order parameters.
We randomly selected three PDBs as our ‘control’ order parameters (PDBs: 1VAT, 4NHS, 5LIO). (A) For every residue, we plotted the initial order parameters of our control PDBs compared to all of the other PDBs in our dataset. We obtained a slope of 0.2 with an R2 of 0.16. (B) After applying our equation that accounts for average B-factor and resolution (Materials and methods), we re-plotted the normalized order parameters. Here, we obtained a slope of 0.7 and an R2 of 0.46.
Figure 3—figure supplement 2

Distribution of order parameters differences at different binding site cut-offs.
(A) The relationship between different binding site residue cutoffs, the difference in order parameters (holo-apo) in binding site residues. We varied the cutoff values between 2 and 10 Å, observing that the tighter the binding site definition, the more drastic the difference in order parameters between holo and apo pairs.
Figure 3—figure supplement 3
Order parameter relationships.
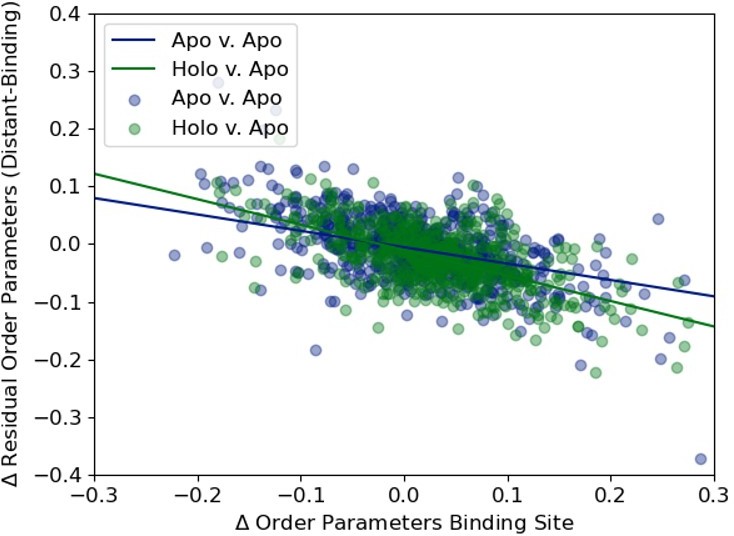
(A) The relationship between the average order parameter in distant, non-solvent-exposed residues versus the average order parameters in binding site residues (n = 743, slope = 0.79, r2 = 0.65; p=6.5 × 10–89, two-sided t-test). (B) We compare the difference in order parameters in each binding site residues of holo-apo pairs compared to a control dataset made up of the same number, type, and solvent exposure of amino acids. Comparing the apo/holo structures, on average binding site residues got more rigid upon binding. The median difference in order parameters was 0.03 for the binding site residues compared to 0 for the control dataset (p=3.4 × 10⁻⁷, individual Mann–Whitney U test). (C) The relationship between the residual order parameters in all distant residues versus binding site residue order parameters (n = 743, slope = −0.34, r2 = 0.17; p=4.6 × 10⁻²⁸, two-sided t-test). (D) The relationship between the residual order parameters in distant, non-solvent-exposed residues versus binding site residues in the apo and apo control dataset residues (n = 283, slope = −0.28, r2 = 0.20; p=1.8 × 10⁻³⁴, two-sided t-test). (E) To analyze the impact that protein size has on the relationship between the difference in order parameters in binding site residues versus the residual order parameters in distant residues, we binned proteins based on the number of residues. We colored each point on our original binding site residues versus the residual order parameters in distant residues based on the protein size and did not observe any clustering. (F) The bootstrap analysis of the overlap of the slope of distant, average order parameters of non-solvent-exposed residue versus average order parameters of binding site residue between holo-apo (green) and apo-apo (purple). While there was some overlap, the mean slope of holo-apo (–0.44) was more than 2 standard deviations away from the mean slope of the apo-apo (–0.28). Comparing the two bootstrap distributions using a z-test, the z-value was –191.26 with a p-value of 0.0.
Figure 3—figure supplement 4
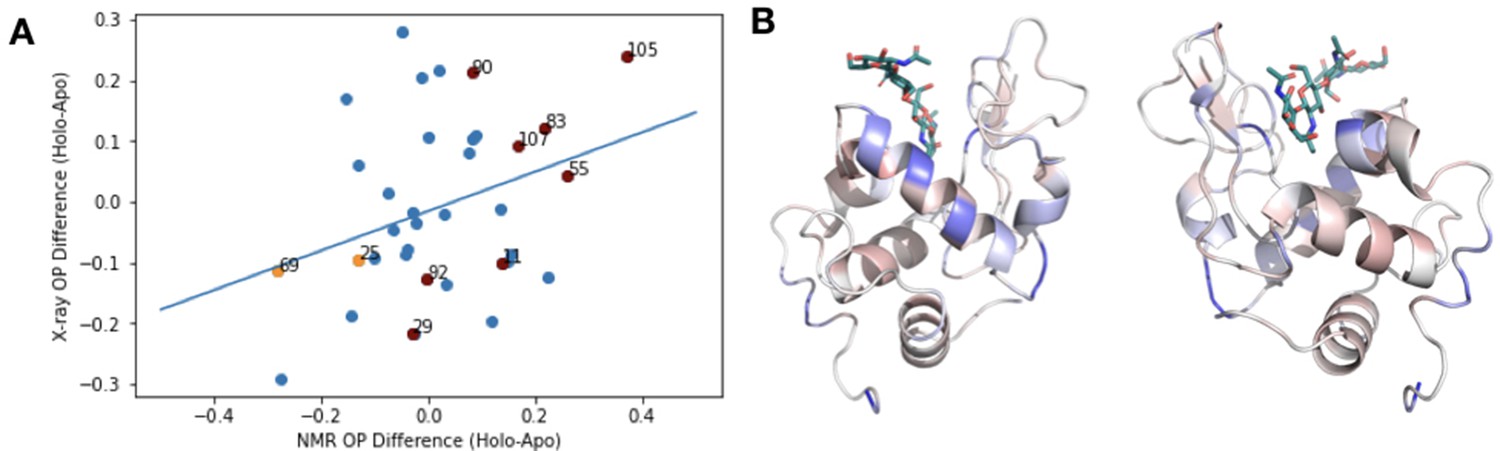
X-ray versus NMR order parameters in HEWL.
(A) To compare our results with previous studies using order parameters from nuclear magnetic resonance (NMR) data, we examined the correlation between the difference in order parameters (holo-apo) in NMR structure of wild-type hen egg white lysozyme (HEWL) with or without chitotriose and the X-ray mulitconformer model of wildtype HEWL versus HEWL bound with tetra-N-acetylchitotetraose (PDB 4EXN, 4WM2). We observed a weak correlation between these two datasets (slope = 0.39), indicating general trends, but differences in techniques and timescales of motion make this comparison difficult. The raw values from this analysis are given in Supplementary file 5. (B) Two views of the rigidification of lysozyme (PDB ID: 4XEN) core residues (blue) upon binding acetylchitotetraose are similar to the pattern observed by NMR upon binding chitotriose as observed in Figure 5 of Moorman et al., 2012.
Figure 3—figure supplement 5
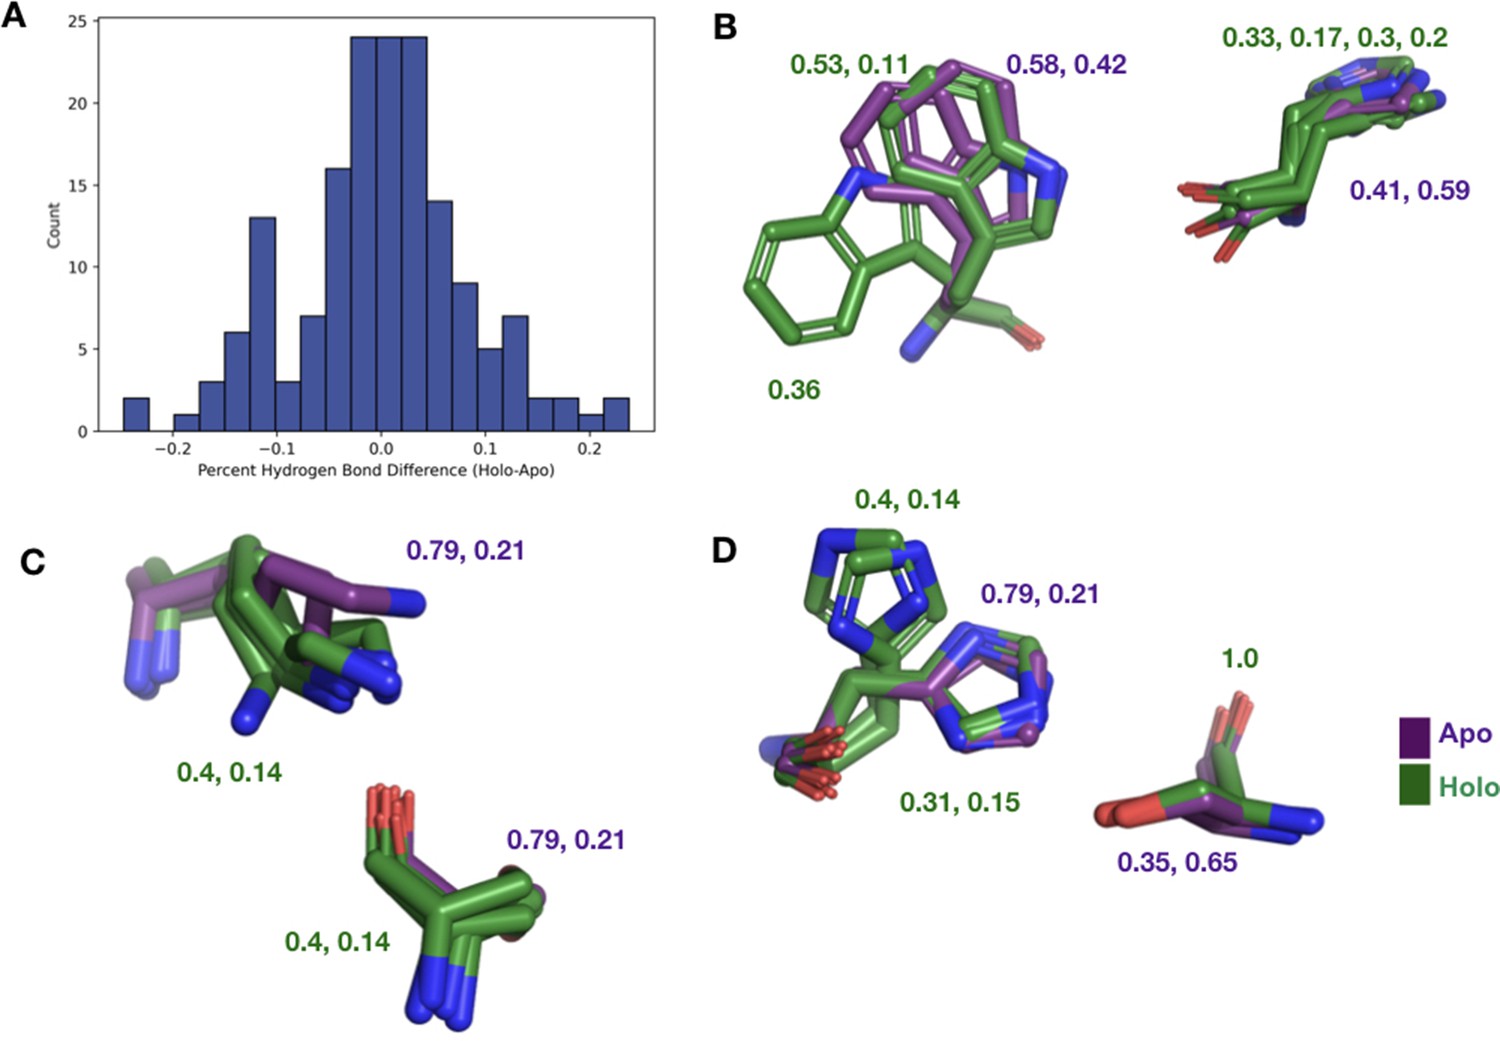
The differences in hydrogen bonds across all binding site residues.
(A) The percentage difference in hydrogen bonds between holo and apo structures in binding site residues. (B) We observe W118 having a much different conformation in altB in apo structure breaking the hydrogen bond with H122. (C) K64 in the apo structure is unable to make any hydrogen bonds with S133 due to wandering nitrogen in the last chi angle of K64. (D) Alt A and B in H97 of the apo structure have a much different conformation from H97 in the holo structure.
Figure 4 with 1 supplement
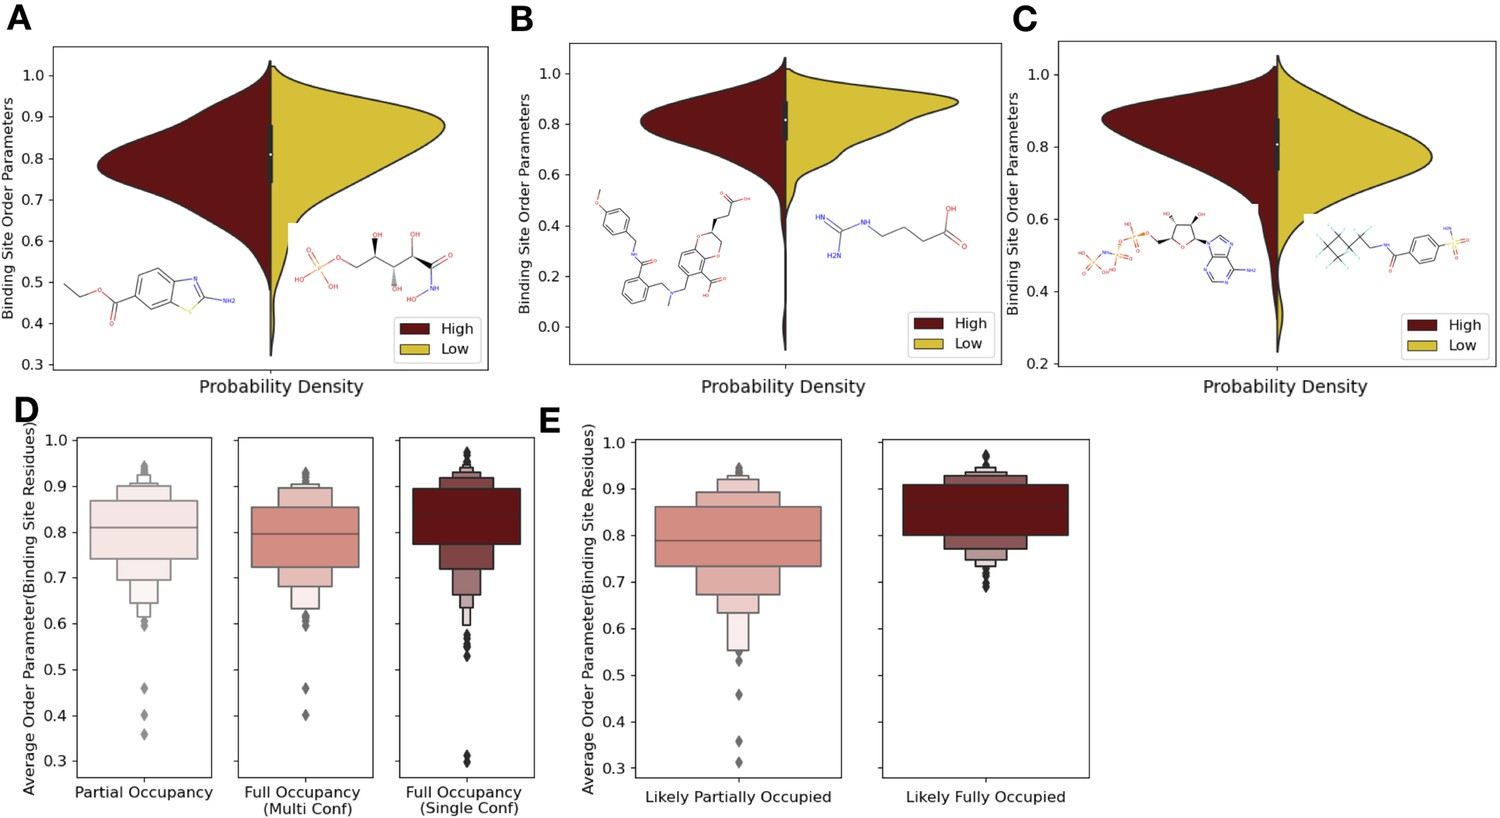
Ligand properties impact binding site order parameters.
(A) Ligands with higher logP value (maroon), indicative of more greasy or hydrophobic ligands, versus ligands with a lower logP value (gold), had lower in order parameters in the binding site residues (0.78 vs. 0.84, median order parameter; p=7.5 × 10⁻⁶, independent Mann–Whitney U test) (example ligands: low logP: 5-phospho-d-arabinohyroamic acid; high logP: ethyl 2-amino-1,3-benzothiazole-6-carboxylate). (B) Ligands with relatively higher molecular weight (maroon) had higher-order parameters compared to those with lower molecular weight (gold; 0.79 vs. 0.83, median order parameter; p=0.0001, independent Mann–Whitney U test) (example ligands: high number of heavy atoms: (2S)-2-(3-hydroxy-3-oxopropyl)–6-[[[2-[(4-methoxyphenyl)methylcarbamoyl]phenyl]methyl-methyl-amino]methyl]-2,3-dihydro-1,4-benzodioxine-5-carboxylic acid; low number of heavy atoms: 4-carbamimidamidobutanoic acid). (C) Ligands with relatively higher hydrogen bonds per heavy atom (maroon) had higher-order parameters compared to those with lower molecular weight (gold; 0.84 vs. 0.79, median order parameter; p=5.9 × 10⁻⁵, independent Mann–Whitney U test) (example ligands: low hydrogen bond: 4-sulfamoyl-N-(2,2,3,3,4,4,5,5,6,6,6-undecafluorohexyl) benzamide; high hydrogen bond: phosphoaminophosphonic acid-adenylate ester). (D) Binding site order parameters were lower in ligands with partial occupancy (light pink; 0.79, median order parameter) and multiconformer ligands adding to full occupancy (salmon; 0.80, median order parameter) compared to single-conformer ligands with full occupancy (dark red; 0.83, median order parameter; p=4.9 × 10⁻⁸, independent Mann–Whitney U test). (E) In fully occupied ligands, ligands in the top quartile of ligand B-factors, controlled for by the mean alpha carbon B-factor, had lower binding site order parameters (salmon; 0.79, median order parameter) compared to ligands in the bottom quartile (dark red; 0.85, median order parameter; p=1.6 × 10⁻¹¹, independent Mann–Whitney U test).
Figure 4—figure supplement 1
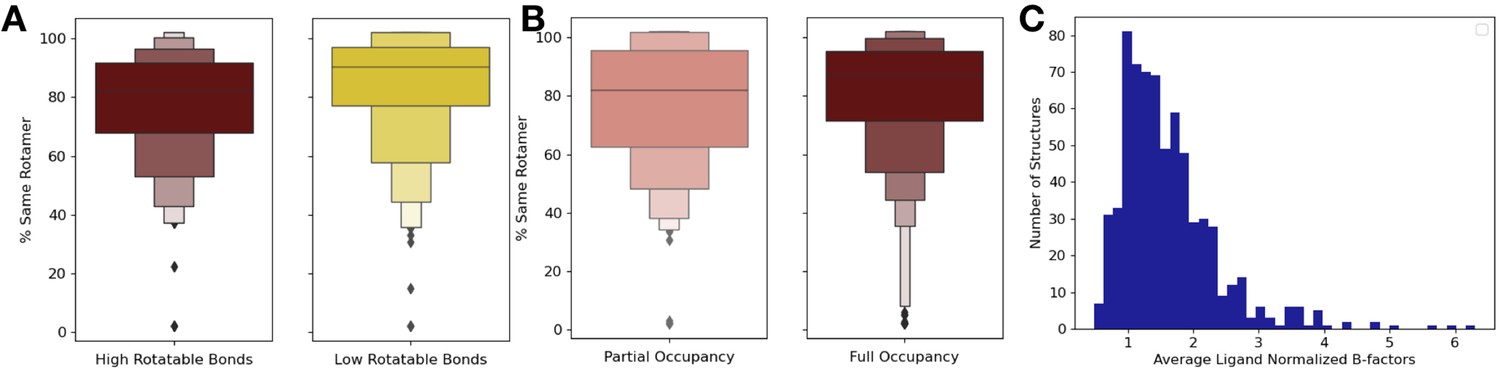
Ligand properties relationship with order parameters.
(A) We explored if the top and bottom quartiles of rotatable bond ligands were associated with an increase or decrease of rotamer changes, as defined as the percentage of close residues with the same rotamer in the holo and apo structure. The ligands in the top quartile of rotatable bonds had less rotamers that were the same between holo and apo structures versus ligands in the bottom quartile of rotatable bonds (80% vs. 88%, median same percentage of rotamers, p=0.001, independent Mann–Whitney U test). (B) There was no significant difference in the percentage of the same rotamers between partially occupied and fully occupied ligands (80% vs. 85%, median percentage of the same rotamer; p=0.11, independent Mann–Whitney U test). (C) In fully occupied ligands, the median B-factor was 24.8, with a range of 5.5–99.3.
Figure 5 with 2 supplements
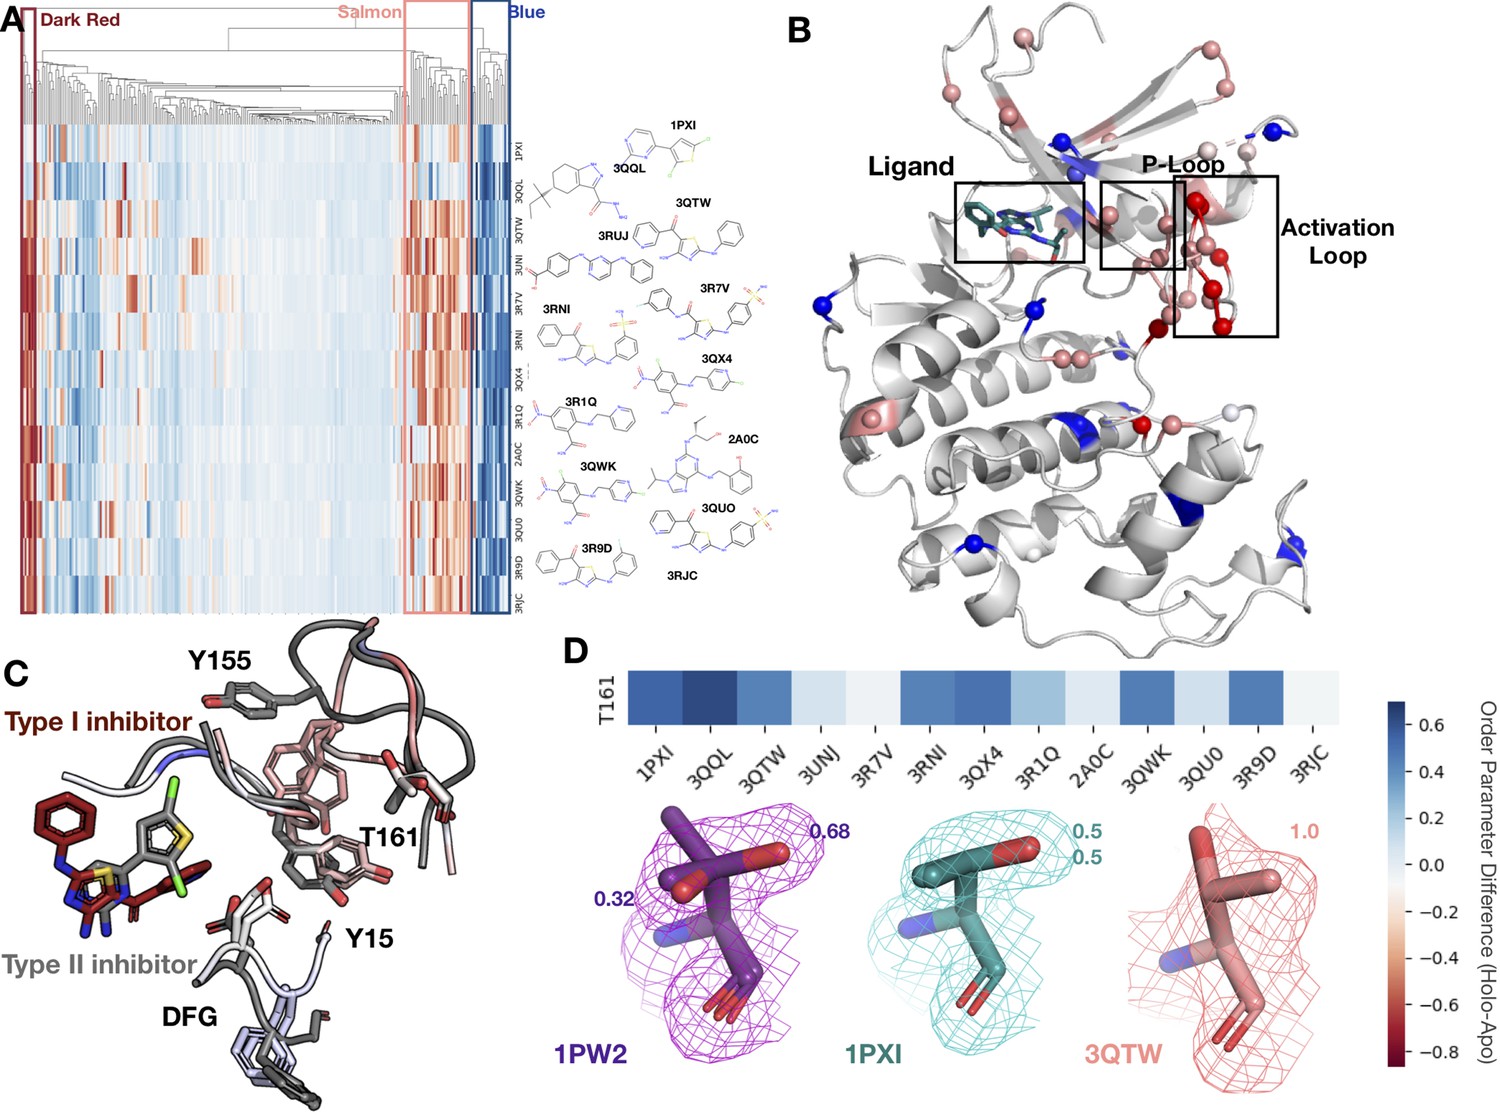
Conformational change and heterogeneity in CDK2.
(A) The clustermap of all residues in the 13 CDK2 protein/ligand pairs. Red values indicate a negative difference (holo-apo) in order parameters, indicating that the holo structures have more heterogeneity compared to the apo. Blue values indicate positive differences, indicating that the apo structures have more heterogeneity compared to the holo. We highlighted three important clusters, the left red cluster, middle salmon cluster, and right blue cluster. (B) A representative structure (PDB: 3QTW) is shown with each residue colored by the difference in order parameter, corresponding to the same coloring scheme as the clustermap. The three distinct clusters (dark red, salmon, blue) are shown in spheres. (C) Many of the key differences between type I inhibitor (PDB: 3QTW) and type II inhibitor (PDB: 1PXI) are located in the DFG motif, P-loop, and activation loop. The type II inhibitor structure is colored in gray, and the type I inhibitor is colored as the difference in order parameters between the type I inhibitor and type II inhibitor structures. Red signifies a more dynamic region in the type I inhibitor structure, and blue signifies a less dynamic region in the type I inhibitor structure. Changes in the DFG motif, propagates changes, both structural and in dynamics, in the P-loop (highlighted by Tyr15), which propagates even larger changes in the activation loop between the two inhibitors, including changes in conformation of Thr161, the phosphorylation site of CDK2. (D) Threonine 161, the phosphorylation site for CDK2. We looked at the supporting density for specific residues between the apo (PDB: 1PW2, purple), type II (PDB: 1PXI, teal), and type I (PDB: 3QTW, salmon) inhibitors. 2Fo-Fc electron density is shown at 1 sigma. Occupancies of the alternative conformers are labeled with the corresponding color. The apo structure has multiple conformations, whereas the type I model only has one, and the type II model has two very similar conformations, but these are in different rotamer states compared to the apo.
Figure 5—figure supplement 1
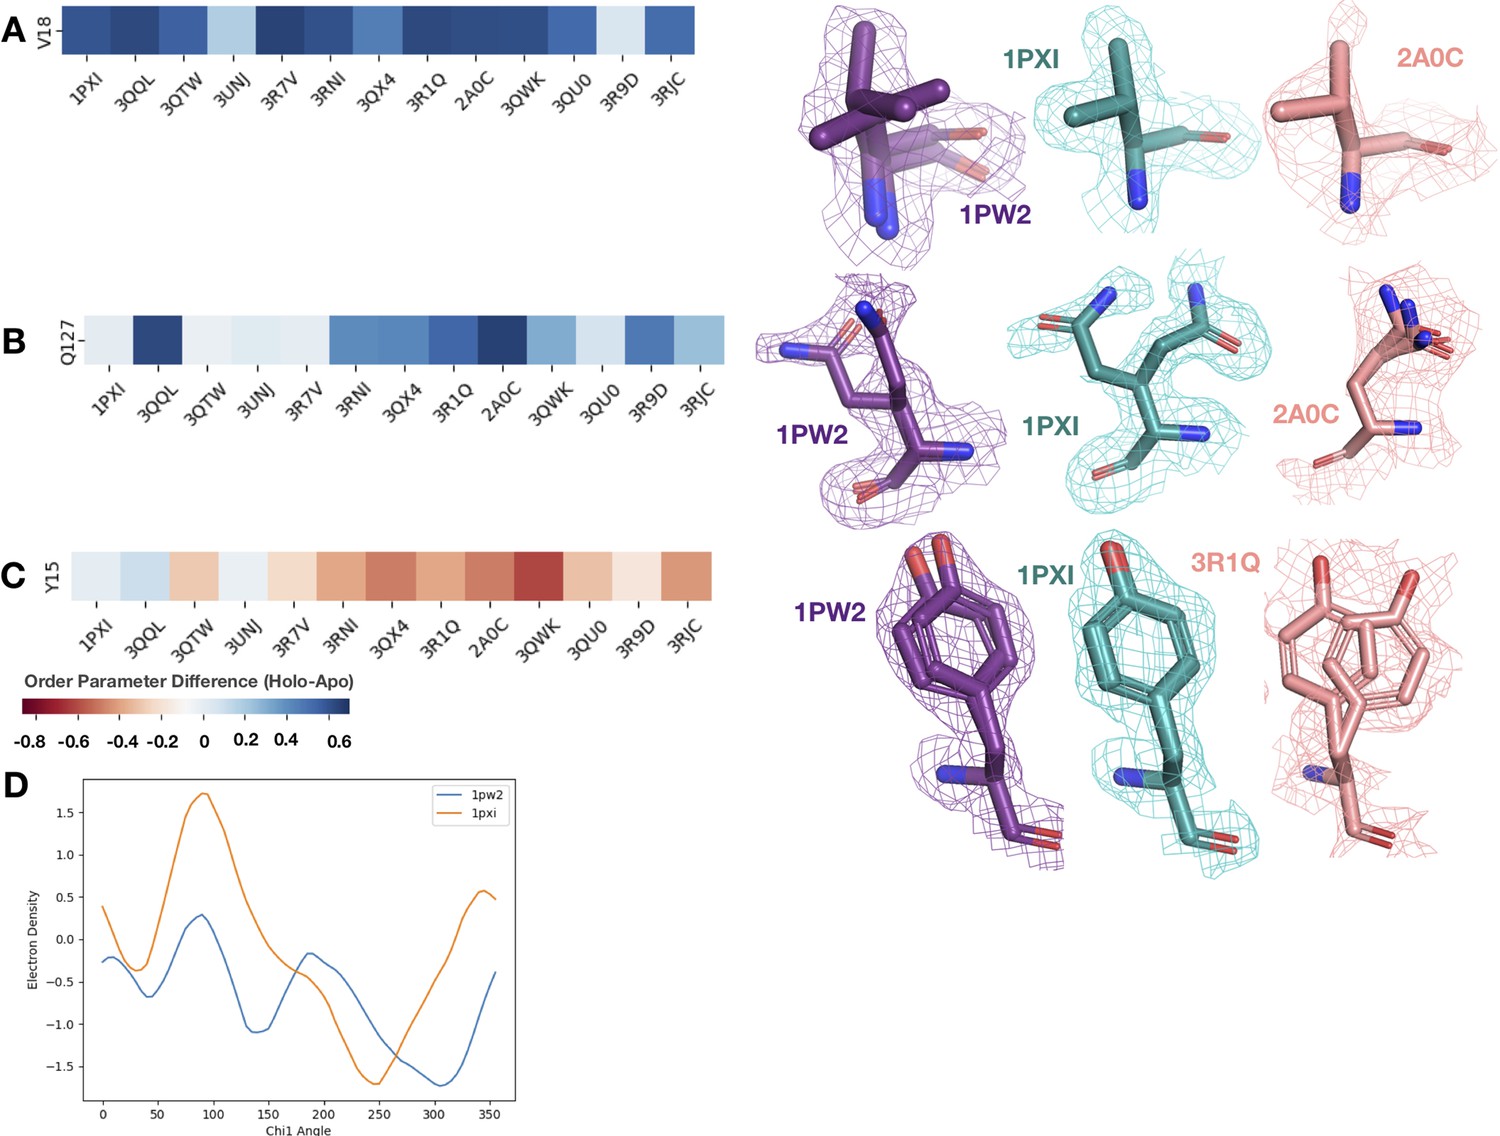
We looked at the difference in order parameters (holo-apo) and the supporting density for specific residues between the apo (PDB: 1PW2, purple), type II (PDB: 1PXI, 3QQL, teal), and type I (PDB: 2A0C, 3QTW, 3R1Q, salmon) inhibitors.
All densities are shown at 1 sigma. (A) Valine 18, one of the ligand contacts for both the type I and type II inhibitors. Across all holo structures, this residue becomes more rigid, including losing an alternative conformer and changing rotamers in the holo structure. This residue is also a part of the blue cluster in the heatmap. (B) Glutamine 127, one of the ligand contacts for both type I and type II inhibitors. This residue has two very different alternative conformers in the apo structure. In the type II inhibitor structure, there are again two very different alternative conformers, whereas in the type I inhibitor structure, there are three very similar alternative conformers. This residue is also a part of the blue cluster in the heatmap. (C) Tyrosine 15 in the P-loop has varying differences in order parameters. In the type II inhibitor, this tyrosine gets more rigid, along with the rest of the P-loop; however, in the type I inhibitor structures, this tyrosine along with the rest of the P-loop becomes more dynamic. (D) Ringer analysis to detect alternative conformations in electron density maps. Ringer detected two peaks for 1PW2, indicating two alternative conformers, whereas only one peak was detected for 1PXI, indicating only one conformation.
Figure 5—figure supplement 2
Differences in hydrogen bonds across CDK2 structures.
(A) Hydrogen bonds broken in the majority of holo structures located in loop regions, especially present in the activation loop. (B) Hydrogen bonds formed upon ligand binding were unique to inhibitors as observed in 3qtw (B, purple) and 2a0c (C, green).
Author response image 1
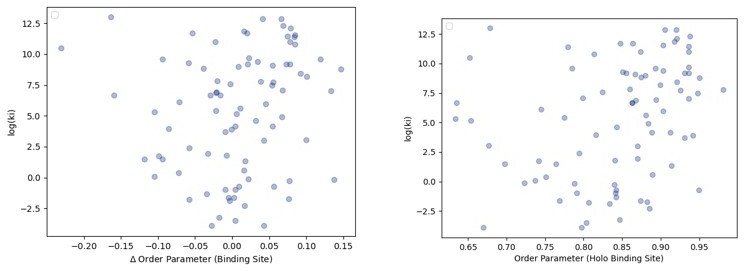
The relationship between order parameters and binding affinity.
(A) The difference in average binding site order parameters (holo-apo) are not correlated with the inhibitory constant (Ki) of binding. (B) The average order parameter of the holo binding site residues are not correlated with the inhibitory constant (Ki) of binding.
Author response image 2
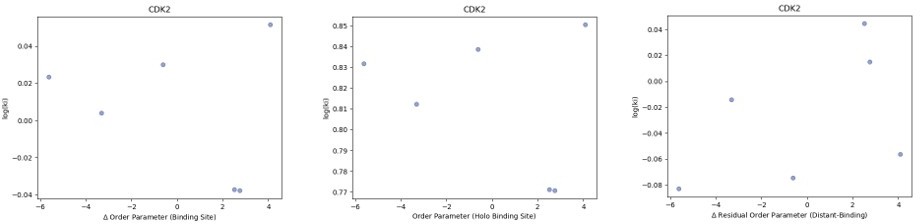
We looked at the correlation between order parameters and the inhibitor constant (Ki) of binding for the five CDK2 protein-inhibitor complexes we had data for.
We did not observe any trends in this data. (A) The difference in average binding site order parameters (holo-apo) are not correlated with the inhibitory constant (Ki) of binding. (B) The average order parameter of the holo binding site residues are not correlated with the inhibitory constant (Ki) of binding. (C) The relationship between the residual order parameter (Distant Residues – Binding Site Residues).
Author response image 3

We looked at the correlation between order parameters and the inhibitor constant (Ki) of binding for the 10 trypsin protein-inhibitor complexes we had data for.
We did not observe any trends in this data. (A) The difference in average binding site order parameters (holo-apo) are not correlated with the inhibitory constant (Ki) of binding. (B) The average order parameter of the holo binding site residues are not correlated with the inhibitory constant (Ki) of binding. (C) The relationship between the residual order parameter (Distant Residues – Binding Site Residues).
Author response image 4
We plotted the distribution of the average difference in order parameters in binding site residues (holo-apo/apo-apo) versus the residual order parameter distant residues versus binding site residue to highlight the slight difference in their slopes (-0.28, apo/apo versus -0.44 apo/holo).
Author response image 5
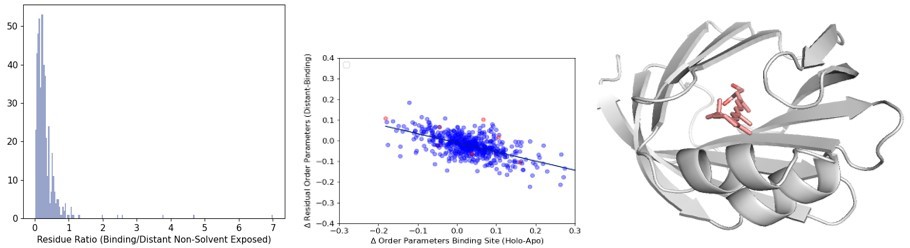
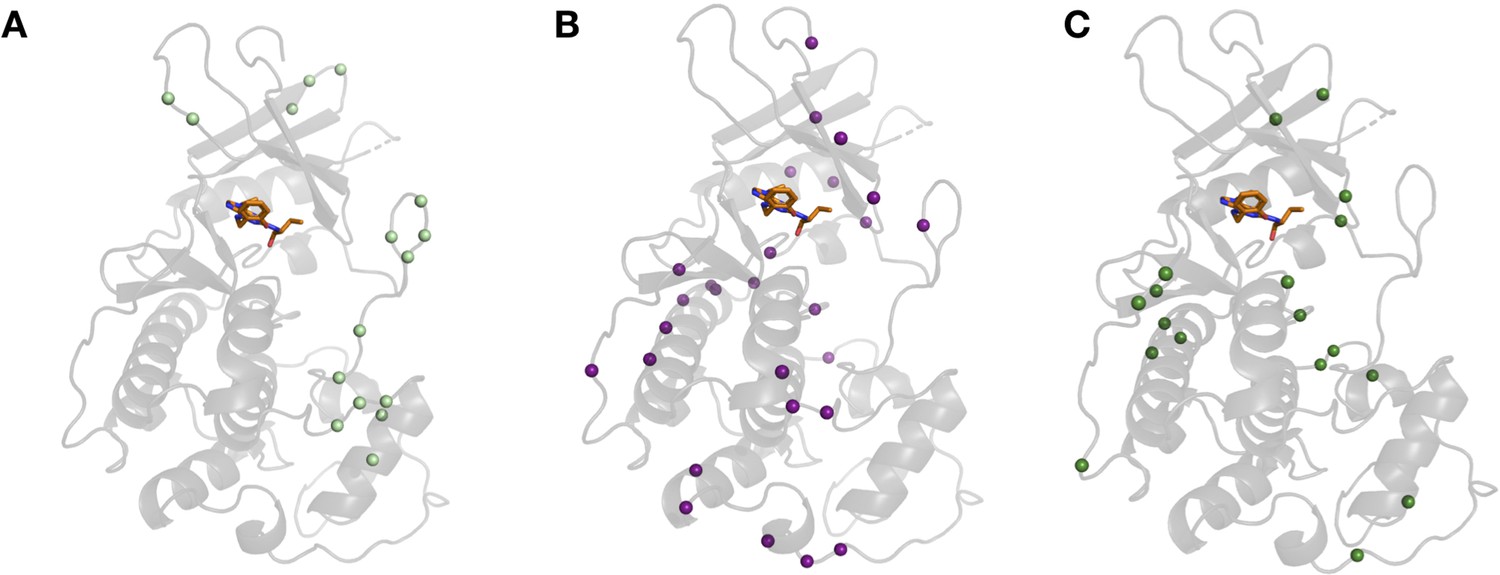
(A)The distribution of the ratio of binding versus distant residues in all structures in our dataset (B) The distribution of the relationship between the difference in binding site order parameters and distant order parameters. The outliers (>2 residue ratio are highlighted in red). (C) An example of a structure (PDB ID: 2RCT) with very few distant residues, one of the outliers in our dataset.
Additional files
-
Supplementary file 1
Crystallographic additives.
- https://cdn.elifesciences.org/articles/74114/elife-74114-supp1-v2.xlsx
-
Supplementary file 2
Apo/holo pairs.
- https://cdn.elifesciences.org/articles/74114/elife-74114-supp2-v2.csv
-
Supplementary file 3
Apo/apo pairs.
- https://cdn.elifesciences.org/articles/74114/elife-74114-supp3-v2.xlsx
-
Supplementary file 4
Lysozyme normalization IDs.
- https://cdn.elifesciences.org/articles/74114/elife-74114-supp4-v2.xlsx
-
Supplementary file 5
Nuclear magnetic resonance (NMR) vs. X-ray order parameters in lysozyme.
- https://cdn.elifesciences.org/articles/74114/elife-74114-supp5-v2.csv
-
Transparent reporting form
- https://cdn.elifesciences.org/articles/74114/elife-74114-transrepform1-v2.docx
Download links
A two-part list of links to download the article, or parts of the article, in various formats.
Downloads (link to download the article as PDF)
Open citations (links to open the citations from this article in various online reference manager services)
Cite this article (links to download the citations from this article in formats compatible with various reference manager tools)
Ligand binding remodels protein side-chain conformational heterogeneity
eLife 11:e74114.
https://doi.org/10.7554/eLife.74114


