Absolute quantitation of individual SARS-CoV-2 RNA molecules provides a new paradigm for infection dynamics and variant differences
- Department of Biochemistry, The University of Oxford, United Kingdom
- Nuffield Department of Medicine, The University of Oxford, United Kingdom
- Chinese Academy of Medical Sciences (CAMS) Oxford Institute (COI), The University of Oxford, United Kingdom
- MRC-University of Glasgow Centre for Virus Research, The University of Glasgow, United Kingdom
- Ludwig Institute for Cancer Research, The University of Oxford, United Kingdom
- Sir William Dunn School of Pathology, The University of Oxford, United Kingdom
- UK Health Security Agency, UKHSA-Porton Down, United Kingdom
- Department of Infectious Diseases, University Hospitals Sussex NHS Foundation Trust, United Kingdom
- James & Lillian Martin Centre, Sir William Dunn School of Pathology, The University of Oxford, United Kingdom
Figures
Figure 1 with 1 supplement
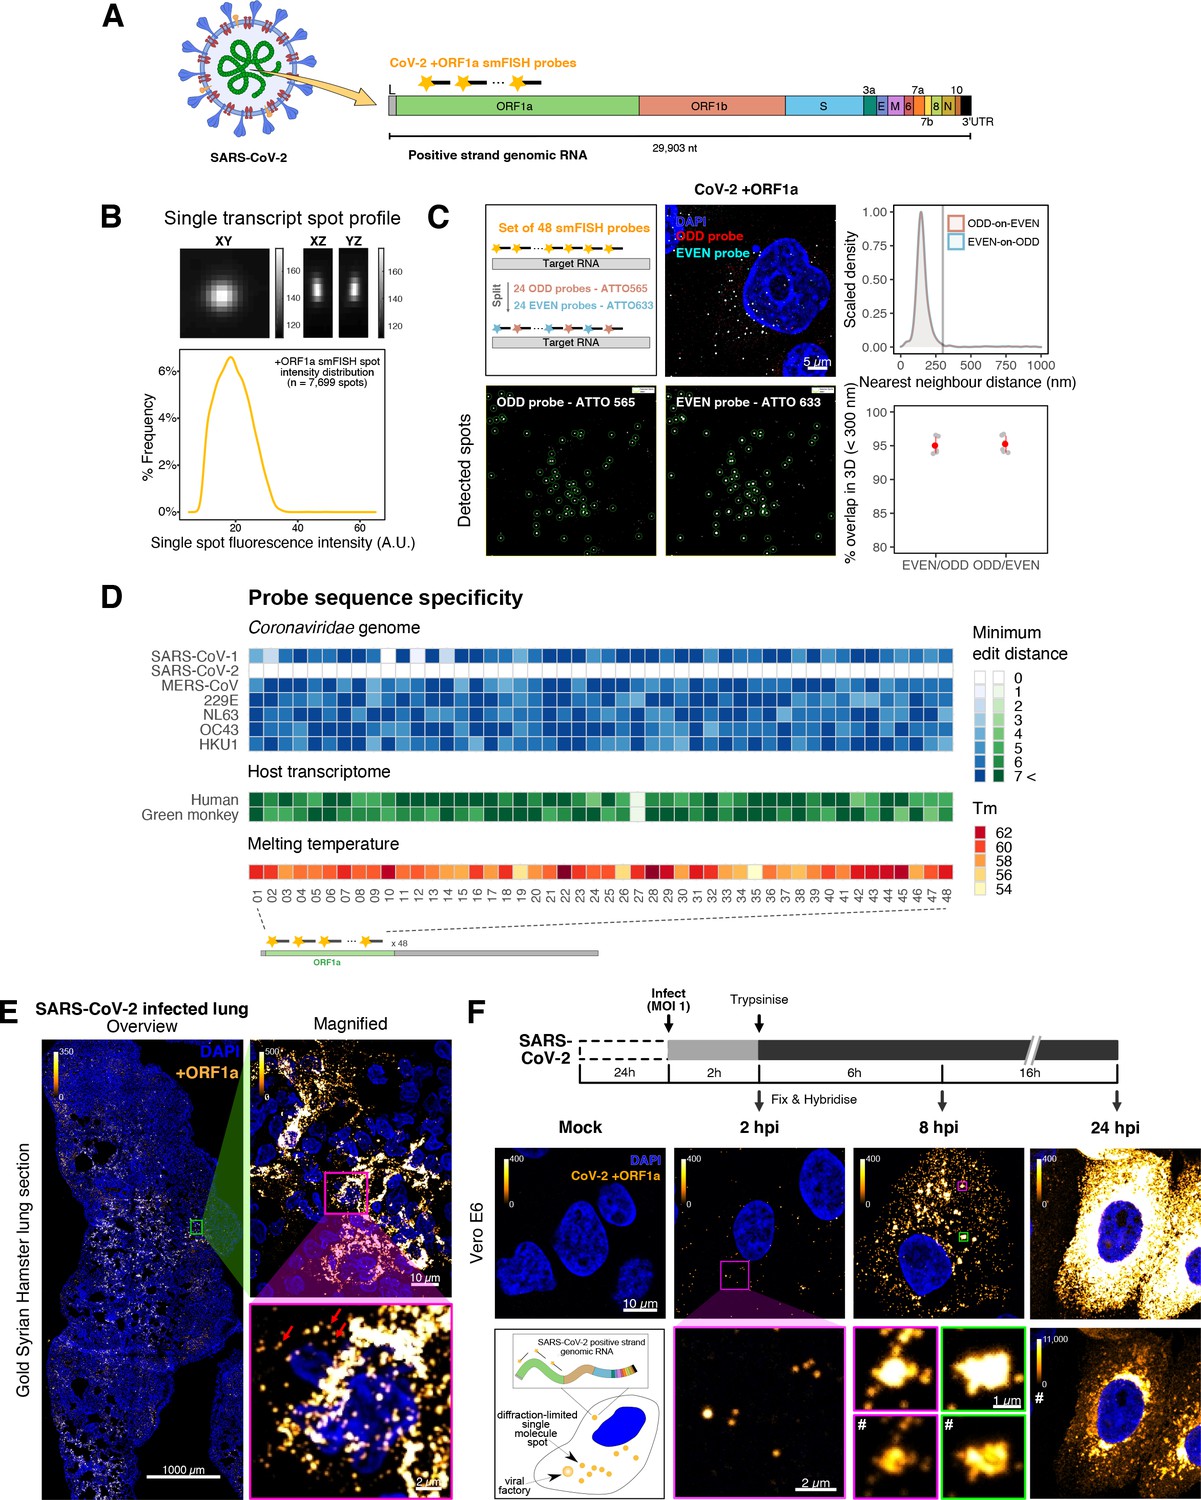
Sensitive single-molecule detection of severe acute respiratory syndrome coronavirus 2 (SARS-CoV-2) genomic RNA in infected cells.
(A) Schematic illustration of single-molecule fluorescence in situ hybridisation (smFISH) for detecting SARS-CoV-2 positive strand genomic RNA (+gRNA) within infected cells. (B) Reference spatial profile of a diffraction-limited +ORF1a smFISH spot. The calibration bar represents relative fluorescence intensity (top). Frequency distribution of smFISH spot intensities, exhibiting a unimodal distribution (bottom). (C) Assessment of smFISH detection sensitivity by a dual-colour co-detection method. Maximum intensity projected images and corresponding FISH-quant spot detection views of ODD and EVEN probe sets are shown. Scale bar = 5 µm. Density histogram of nearest-neighbour distance from one spectral channel to another (top). Vertical line indicates 300 nm distance. Percentage overlap between spots detected by ODD and EVEN split probes, calculated bidirectionally (bottom). (D) Heatmap of probe sequence alignment against various Coronaviridae and host transcriptomes. Each column represents individual 20 nt + ORF1a probe sequences. The minimum edit distance represents mismatch scores, where ‘0’ indicates a perfect match. Melting temperatures of each probe at the smFISH hybridisation condition are shown. (E) smFISH against +ORF1a in SARS-CoV-2-infected formalin-fixed paraffin-embedded (FFPE) lung tissue from Golden Syrian hamster at 4 days post infection. Hamsters were infected intranasally with 5 × 10⁴ plaque-forming unit (PFU) of SARS-CoV-2 BVICO1. At necropsy, lung samples were fixed in 10% buffered formalin and embedded in paraffin wax. Red arrows in magnified panels indicate single-molecule RNA spots. Scale bars = 1000, 10, or 2 µm. (F) Experimental design for visualising SARS-CoV-2 gRNA with smFISH at different timepoints after infection of Vero E6 cells. Cells were seeded on cover-glass and 24 hr later inoculated with SARS-CoV-2 (Victoria [VIC] strain at multiplicity of infection [MOI] 1) for 2 hr. Non-internalised viruses were removed by trypsin digestion and cells fixed at the timepoints shown. Representative 4 µm maximum intensity projection confocal images are shown. The calibration bar labelled with the symbol ‘#’ is used to display wider dynamic contrast range. Magnified view of insets in the upper panels is shown in lower panels. Scale bars = 10 µm or 2 µm.
Figure 1—figure supplement 1
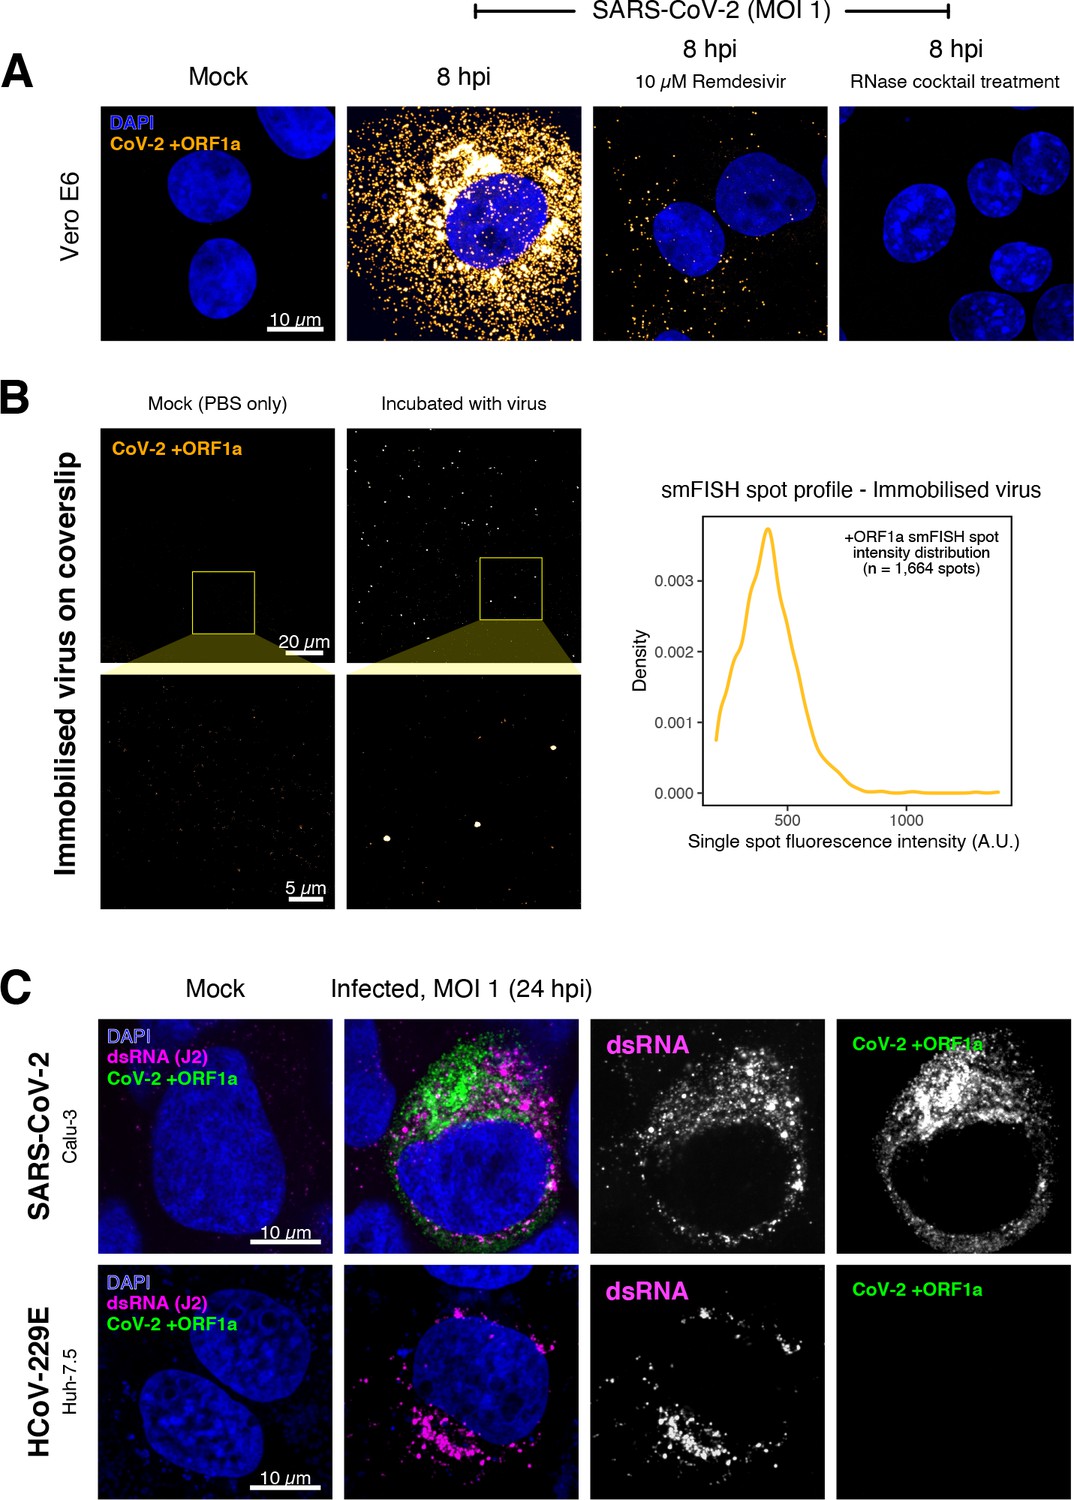
Specific detection of severe acute respiratory syndrome coronavirus 2 (SARS-CoV-2) RNA using single-molecule fluorescence in situ hybridisation (smFISH).
(A) Specificity of the +ORF1a smFISH probe for SARS-CoV-2 RNA. Vero E6 cells were infected with SARS-CoV-2 (Victoria [VIC], multiplicity of infection [MOI] = 1), fixed at 8 hr post infection (hpi), and hybridised with +ORF1a smFISH probe. In the remdesivir (RDV) condition, the drug was added to the cells at 10 µM during virus inoculation and maintained for the infection period. For the RNase digestion, permeabilised cells were treated with a cocktail of RNaseT1 and RNaseIII in the presence of MgCl2 to digest RNA prior to probe hybridisation. Representative full z-projection (8 µm) confocal images are shown. Scale bar = 10 µm. (B) Visualisation of encapsidated SARS-CoV-2 RNA with smFISH (left panels). Virus was immobilised onto poly-L-lysine-coated coverslips and visualised via the +ORF1a probe. Mock (negative control) condition was prepared by incubating coated coverslips in PBS without the virus. 1 µm maximum z-projected confocal images are shown. Scale bar = 20 µm or 5 µm. Density distribution of smFISH spot intensities (right panel), exhibiting a unimodal distribution (n = 1664 spots). (C) Calu-3 (upper panels) and Huh-7.5 (lower panels) cells were infected with SARS-CoV-2 (VIC) and HCoV-229E (MOI = 1), respectively, fixed at 24 hpi and hybridised with the SARS-CoV-2-specific +ORF1a probe. In addition, cells were stained with anti-dsRNA (J2) to identify heavily infected cells. Representative single slice confocal images are shown. Scale bar = 10 µm.
Figure 2 with 3 supplements
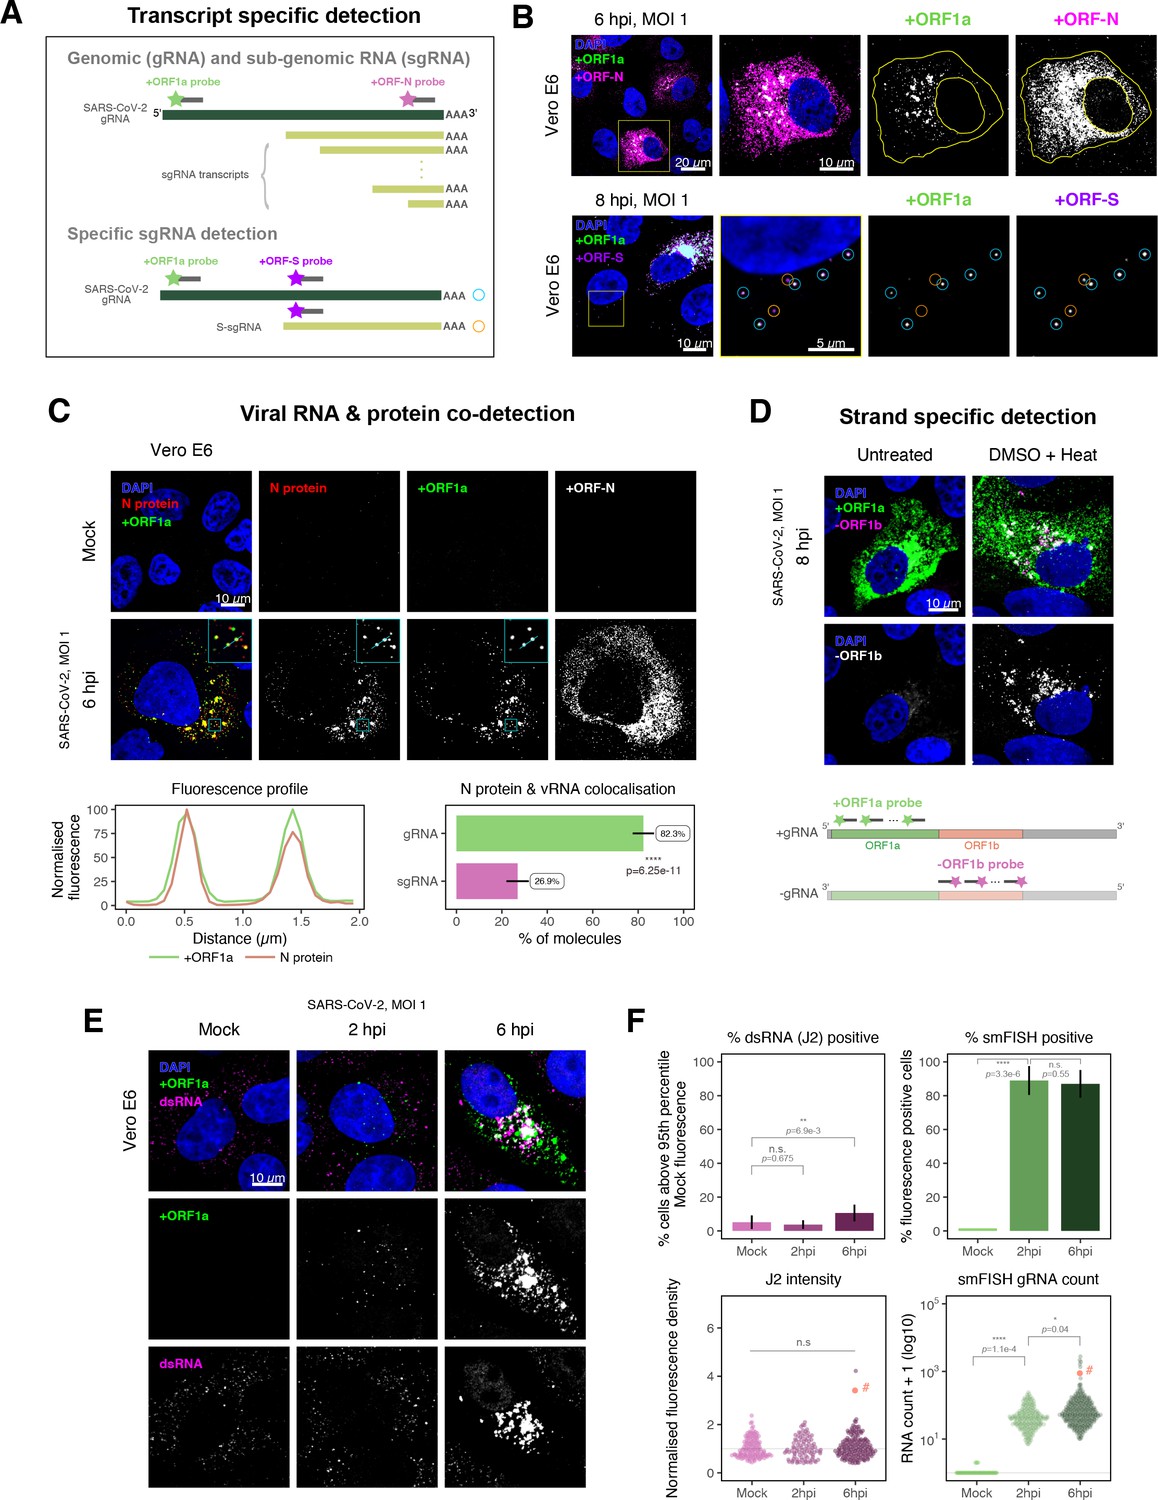
Dissecting severe acute respiratory syndrome coronavirus 2 (SARS-CoV-2) gene expression using single-molecule fluorescence in situ hybridisation (smFISH).
(A) Schematic illustration of transcript-specific targeting of SARS-CoV-2 genomic RNA (gRNA) and subgenomic RNA (sgRNA) using smFISH. (B) Transcript-specific visualisation of gRNA and sgRNA in infected (Victoria [VIC] strain) Vero E6 cells. Cells were infected with SARS-CoV-2 (VIC strain) and hybridised with probes against +ORF1a and +ORFN probe at 6 hr post infection (hpi) (upper panels) or +ORF1a and +ORFS probe at 8 hpi (lower panels). Representative 3 µm maximum intensity projected confocal images are shown. Orange circular regions of interest (ROIs) indicate S-sgRNA encoding Spike, whereas dual-colour spots (teal-coloured ROIs) represent gRNA. Scale bar = 5, 10, or 20 µm. (C) Co-detection of viral nucleocapsid (N) with gRNA and sgRNA. Monoclonal anti-N (Ey2A clone) was used for N protein immunofluorescence. Representative 3 µm z-projected confocal images are shown. The inset shows a magnified view of co-localised N and gRNA. Scale bar = 10 µm. Fluorescence profiles of N immunostaining and gRNA smFISH intensity across a 2 µm linear distance are shown in the image inset (lower left). Percentage of co-localised gRNA or sgRNA molecules with N protein at 6 hpi. Co-localisation was assessed by N fluorescence density within point-spread function ellipsoids of RNA spots over random coordinates. sgRNA were defined as single-coloured spots with +ORFN probe signal only (n = 7) (lower right). Student’s t-test. ****p<0.0001. (D) Detection of both positive and negative genomic RNA by denaturing viral double-stranded RNA (dsRNA) with DMSO and heat treatment at 80°C (upper panels). 3 µm z-projected images of infected Vero E6 cells at 8 hpi are shown. Scale bar = 10 µm. Schematic illustration of +ORF1a and -ORF1b probe targeting regions (lower panel). -ORF1b probe target region does not overlap with +ORF1a target sequences to prevent probe duplex formation. (E) Comparison of anti-dsRNA (J2) and gRNA smFISH. Full z-projected images of infected Vero E6 cells co-stained with J2 and smFISH are shown. Scale bar = 10 µm. (F) Percentage of infected cells detected by J2 or smFISH (upper panels). For J2-based quantification, we defined the threshold as 95th percentile fluorescent signal of uninfected cells (Mock) due to the presence of endogenous host-derived signals. Fluorescent positive signals were used for smFISH-based quantification. Data are presented as mean ± SD. Comparison of quantification results between J2 stain and smFISH (lower panels). Each symbol represents one cell. J2 signal was quantified by fluorescence density over 3D cell volume, which was normalised to the average signal of uninfected control cells (horizontal dotted line). gRNA count represents sum of single-molecule spots and decomposed spots within viral factories. The symbol denoted with ‘#’ is the infected cell shown in Figure 2E (J2 stain, n = 3 independent repeats; smFISH, n = 4). One-way ANOVA and Tukey post-hoc test. n.s., not significant; *p<0.05; **p<0.01; ****p<0.0001.
Figure 2—figure supplement 1
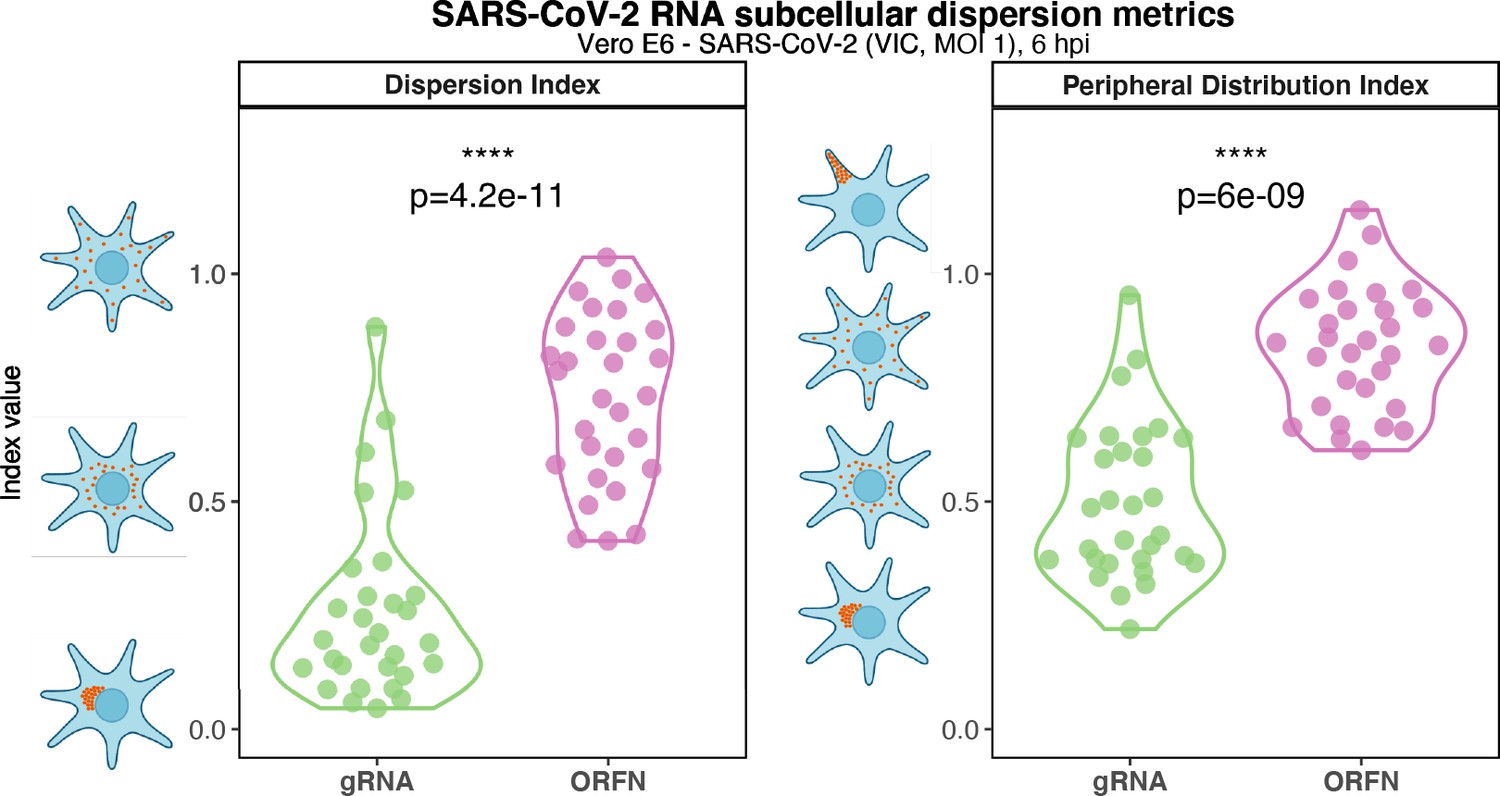
Subcellular RNA dispersion of severe acute respiratory syndrome coronavirus 2 (SARS-CoV-2) genomic RNA (gRNA) and subgenomic RNAs (sgRNAs).
Vero E6 cells were infected with SARS-CoV-2 (Victoria [VIC] strain, multiplicity of infection [MOI] 1) and hybridised with +ORF1a and +ORFN single-molecule fluorescence in situ hybridisation (smFISH) probes at 6 hr post infection (hpi). RNA dispersion and peripheral distribution indices were calculated using the RNA distribution index (RDI) calculator on smFISH channels (see Materials and methods). Schematic diagrams of subcellular RNA distribution of select index values are shown next to the corresponding plots. Mann–Whitney U test. ****p<0.0001 (n = 32 cells).
Figure 2—figure supplement 2
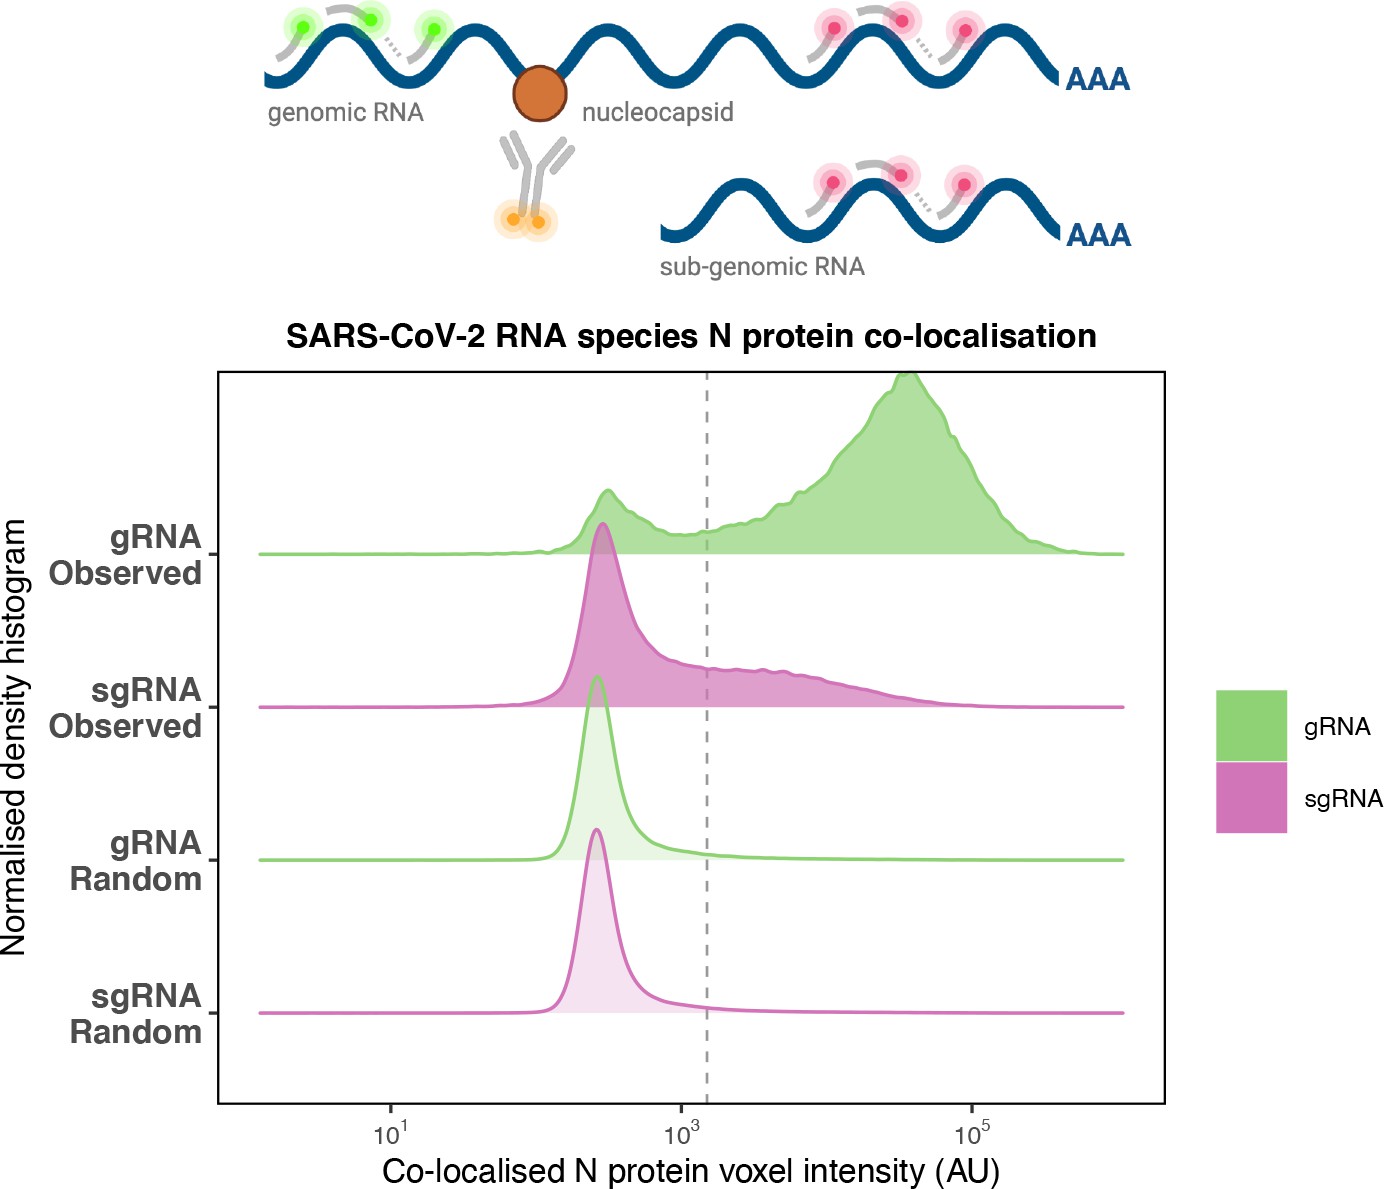
Preferential co-localisation of severe acute respiratory syndrome coronavirus 2 (SARS-CoV-2) nucleocapsid protein with genomic RNA (gRNA).
Density histogram of SARS-CoV-2 nucleocapsid (N) protein voxel intensities co-localised to gRNA or subgenomic RNA (sgRNA) spots that relate to Figure 2C. Schematic diagram of co-staining for N protein and viral RNA is shown. In addition to the ‘observed’ gRNA and sgRNA spots, we performed a ‘random’ simulation to place the same density of RNA spots within infected cells and calculated the voxel intensities that correspond to chance co-localisation. The vertical dotted line corresponds to the threshold of co-detection defined as 2 standard deviation value from the random distribution analysis (n = 7 field of views).
Figure 2—figure supplement 3
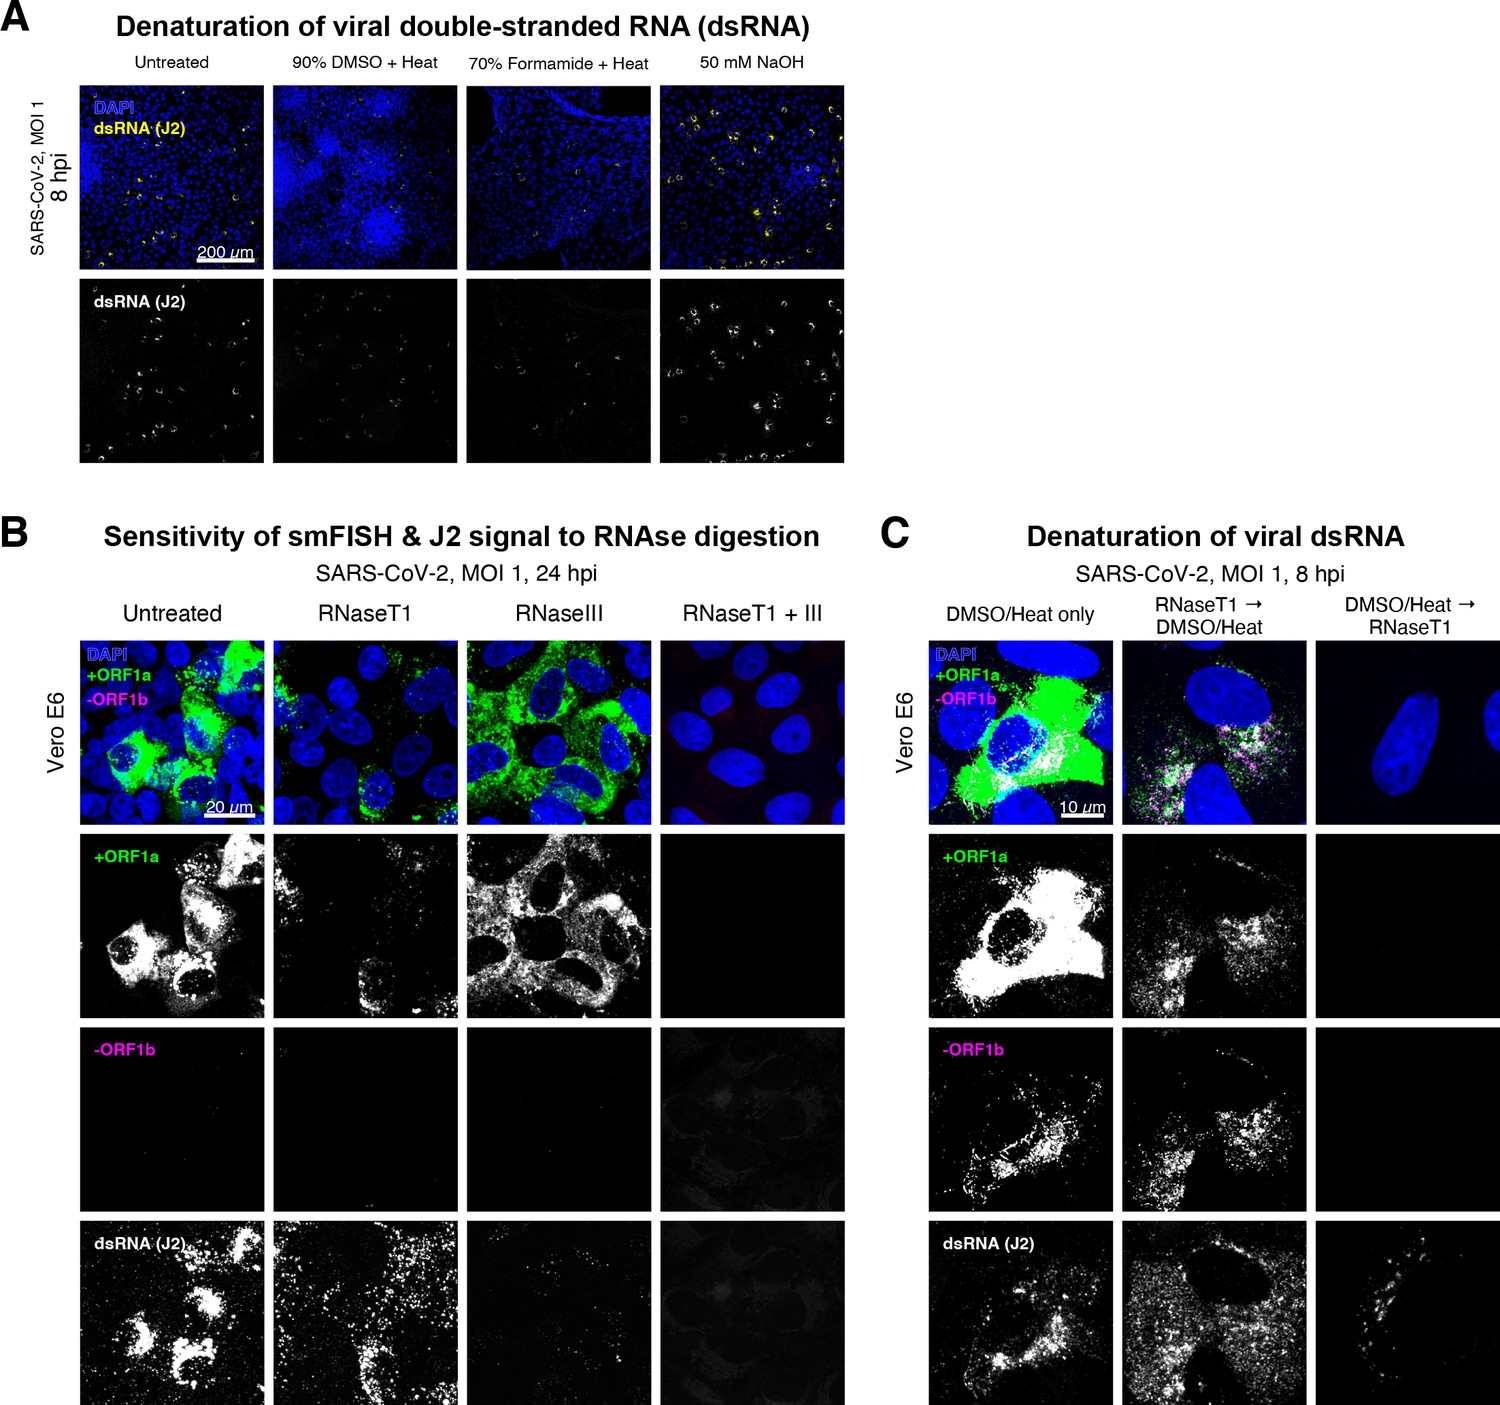
Denaturation of severe acute respiratory syndrome coronavirus 2 (SARS-CoV-2) double-stranded RNA (dsRNA) for negative strand detection.
(A) Comparison of dsRNA denaturation efficiency assessed by the reduction of anti-dsRNA (J2) immunofluorescence. Vero E6 cells infected with SARS-CoV-2 (Victoria [VIC], multiplicity of infection [MOI] = 1) were fixed at 8 hr post infection (hpi) and treated with DMSO, formamide, or NaOH prior to immunostaining (see Materials and methods). DMSO and formamide treatment was performed at 80°C. Representative low-magnification single-slice confocal images are shown. Formamide treatment with heat resulted in cell detachment from coverslips. Scale bar = 200 µm. (B) Sensitivity of +ORF1a single-molecule fluorescence in situ hybridisation (smFISH) and J2 immunofluorescence signal to RNase digestion. Fixed infected cells (24 hpi) were treated with RNaseT1 and/or RNaseIII to digest single-stranded RNA and/or dsRNA, respectively, hybridised with +ORF1a probe and stained with J2. Representative full z-projected confocal images are shown, which are single-molecule contrast matched. Scale bar = 20 µm. (C) RNaseT1 digestion of denatured dsRNA. Fixed infected cells (8 hpi) were treated as follows: (i) DMSO/heat only (left); (ii) RNaseT1 then DMSO/heat (centre); or (iii) in the reverse order of DMSO/heat and then RNaseT1 (right). Treated cells were hybridised with +ORF1a and -ORF1b probes (see Figure 2D for schematics) and stained with J2. RNaseT1 digestion followed by DMSO treatment shows that viral dsRNAs are resistant to RNaseT1 activity, but DMSO treatment preceding RNaseT1 suggests that the denatured dsRNA can be targeted by RNaseT1. Full z-projected confocal images are shown. Scale bar = 10 µm.
Figure 3 with 3 supplements
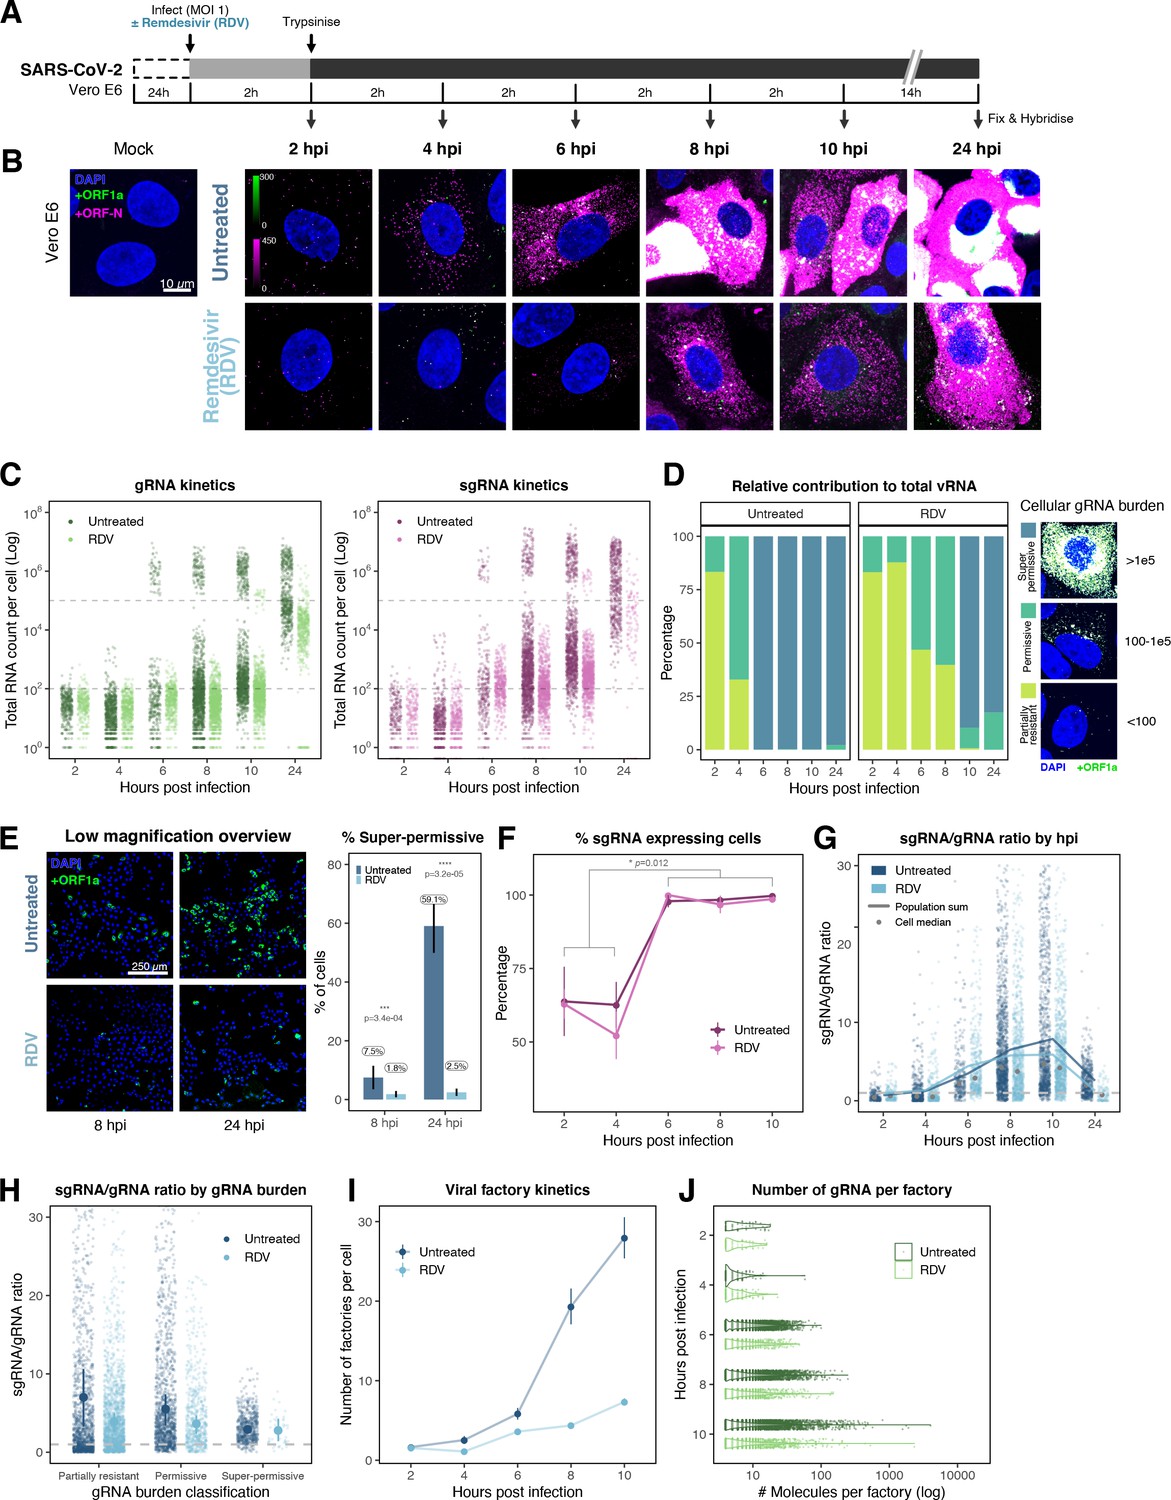
Profiling severe acute respiratory syndrome coronavirus 2 (SARS-CoV-2) replication kinetics at single-molecule resolution.
(A) Experimental design to profile SARS-CoV-2 replication kinetics using single-molecule fluorescence in situ hybridisation (smFISH). Vero E6 cells were seeded on cover-glass and 24 hr later inoculated with SARS-CoV-2 (Victoria [VIC] strain, multiplicity of infection [MOI] = 1) for 2 hr. Non-internalised viruses were removed by trypsin digestion and cells fixed at the timepoints shown for hybridisation with +ORF1a and +ORFN probes. In the remdesivir (RDV) condition, the drug was added to cells at 10 µM during virus inoculation and maintained for the infection period. (B) Maximum z-projected confocal images of infected cells. Intensity calibration bars are shown for the +ORF1a and +ORFN channels. Scale bar = 10 µm. (C) Bigfish quantification of +gRNA or +sgRNA counts per cell. sgRNA counts were calculated by subtracting +ORF1a counts from +ORFN counts per cell. Horizontal dashed lines indicate 102 or 105 molecules of RNA. 24 hr post infection (hpi) samples and the cells harbouring >107 RNA counts were quantified by extrapolating single-molecule intensity. Quantified cells from all replicates are plotted (2–8 hpi, n ≥ 3; 10 and 24 hpi, n = 2). Number of cells analysed (untreated/RDV): 2 hpi, 373/273; 4 hpi, 798/516; 6 hpi, 370/487; 8 hpi, 1442/1022; 10 hpi, 1175/1102; 24 hpi, 542/249. (D) Relative contribution of viral gRNA within the infected cell population. The infected cells were classified into three groups based on gRNA counts: (i) ‘partially resistant’ – gRNA <100; ‘permissive’ – 100 < gRNA < 105; ‘super-permissive’ – gRNA >105. The total gRNA within the infected wells was obtained by summing gRNA counts in population, and the figure shows the relative fraction from each classification. Representative max-projected images of cells in each category are shown (2–8 hpi, n ≥ 3; 10 and 24 hpi, n = 2). (E) Identification of super-permissive cells from a low-magnification (×20) high-throughput smFISH assay (left panels). Full z-projected (9 µm) images of infected Vero E6 cells hybridised with +ORF1a probes are shown. At this magnification, only the cells with vRNA count >~105 (i.e. corresponding to ‘super-permissive’ cells) exhibit significant smFISH fluorescence compared to uninfected cells. Scale bar = 250 µm. Percentage of super-permissive cells in untreated and RDV-treated conditions at 8 and 24 hpi (right panel). Labels represent average values. Data are represented as mean ± SD (n = 3, ~ 2000 cells were scanned from each replicate well). Student’s t-test. ***p<0.001; ****p<0.0001. (F) Percentage of infected cells expressing sgRNA. sgRNA-expressing cells were identified by those having a (ORF-N – ORF1a) probe count more than 1. Data are represented as mean ± SEM (2–8 hpi, n ≥ 3; 10 and 24 hpi, n = 2). (G) Per cell ratio of sgRNA/gRNA counts across the time series. Grey symbols represent cell-to-cell median values, whereas the line plot represents ratio calculated from population sum of gRNA and sgRNA. The number of cells analysed is the same as in (Figure 3C), with the exception of cells having equal ORF1a and ORF-N probe counts. Horizontal dashed line represents value of 1 (2–8 hpi, n ≥ 3; 10 and 24 hpi, n = 2). (H) Per cell ratio of sgRNA/gRNA counts grouped by gRNA burden classification as defined in Figure 3D. Data are represented as median ± SEM. Horizontal dashed line represents value of 1 (2–8 hpi, n ≥ 3; 10 and 24 hpi, n = 2). (I) The number of viral factories per cell increase over time as assessed by smFISH cluster detection. Cells harbouring >107 copies of RNA, less than 10 molecules of RNA, cells with no viral factories, and cells from 24 hpi timepoints were excluded from this analysis. Data are represented as mean ± SEM. Number of cells analysed (untreated/RDV): 2 hpi, 494/240; 4 hpi, 758/494; 6 hpi, 315/417; 8 hpi, 933/877; 10 hpi, 726/885 (2–8 hpi, n ≥ 3; 10 and 24 hpi, n = 2). (J) The kinetics of gRNA copies within viral factories. Spatially extended viral factories were resolved by cluster decomposition to obtain single-molecule counts. The type and number of cells analysed are the same as in Figure 3I (2–8 hpi, n ≥ 3; 10 and 24 hpi, n = 2). gRNA, genomic RNA; sgRNA, subgenomic RNA.
Figure 3—figure supplement 1
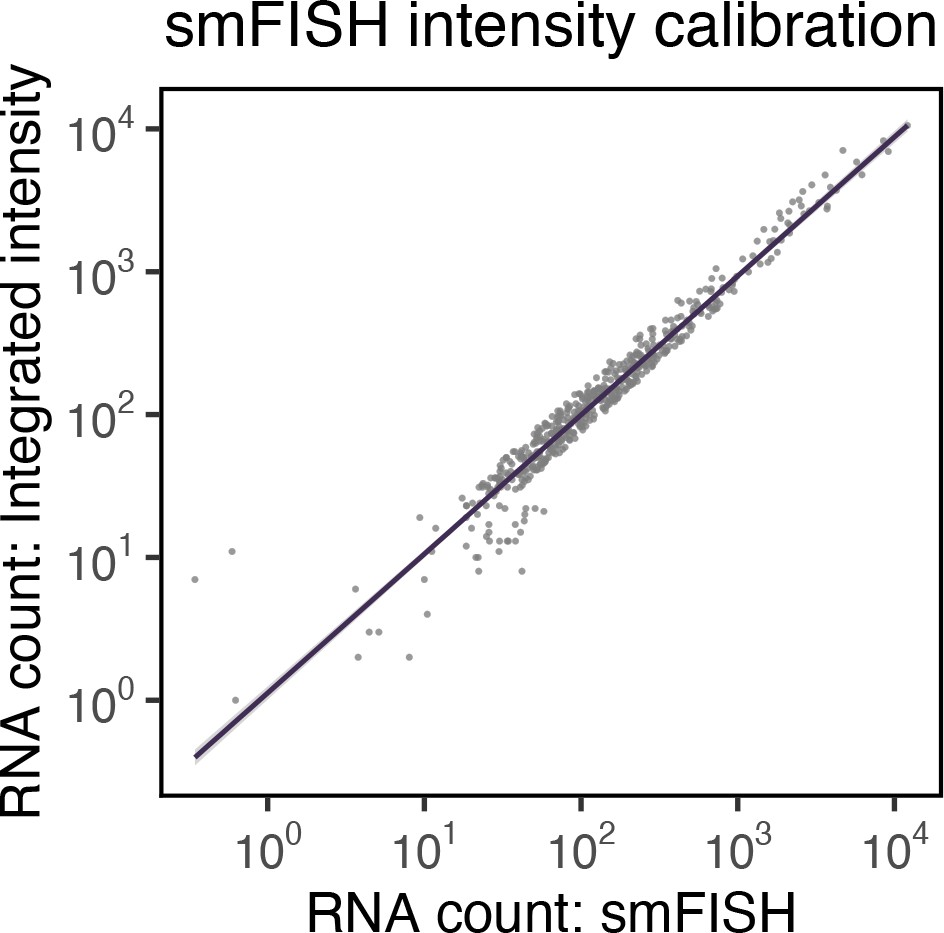
Correlation between single-molecule fluorescence in situ hybridisation (smFISH) RNA counts and smFISH fluorescence intensity.
Correlation of smFISH RNA counts and cellular smFISH fluorescence intensity per cell. Non-‘super-permissive’ cells infected with severe acute respiratory syndrome coronavirus 2 (SARS-CoV-2) (multiplicity of infection [MOI], 1, 8–10 hr post infection [hpi]) were hybridised with +ORF1a probes and RNA counts quantified using Bigfish (absolute RNA count) or via estimation using integrated intensity. RNA count by Integrated intensity method was quantified using reference single-molecule intensity and relating it to the total 3D fluorescence of the cells. A linear correlation was fitted using geom_smooth() function of ‘ggplot2’ R package (n = 383 cells).
Figure 3—figure supplement 2
The dynamics and heterogeneity of severe acute respiratory syndrome coronavirus 2 (SARS-CoV-2) RNA replication.
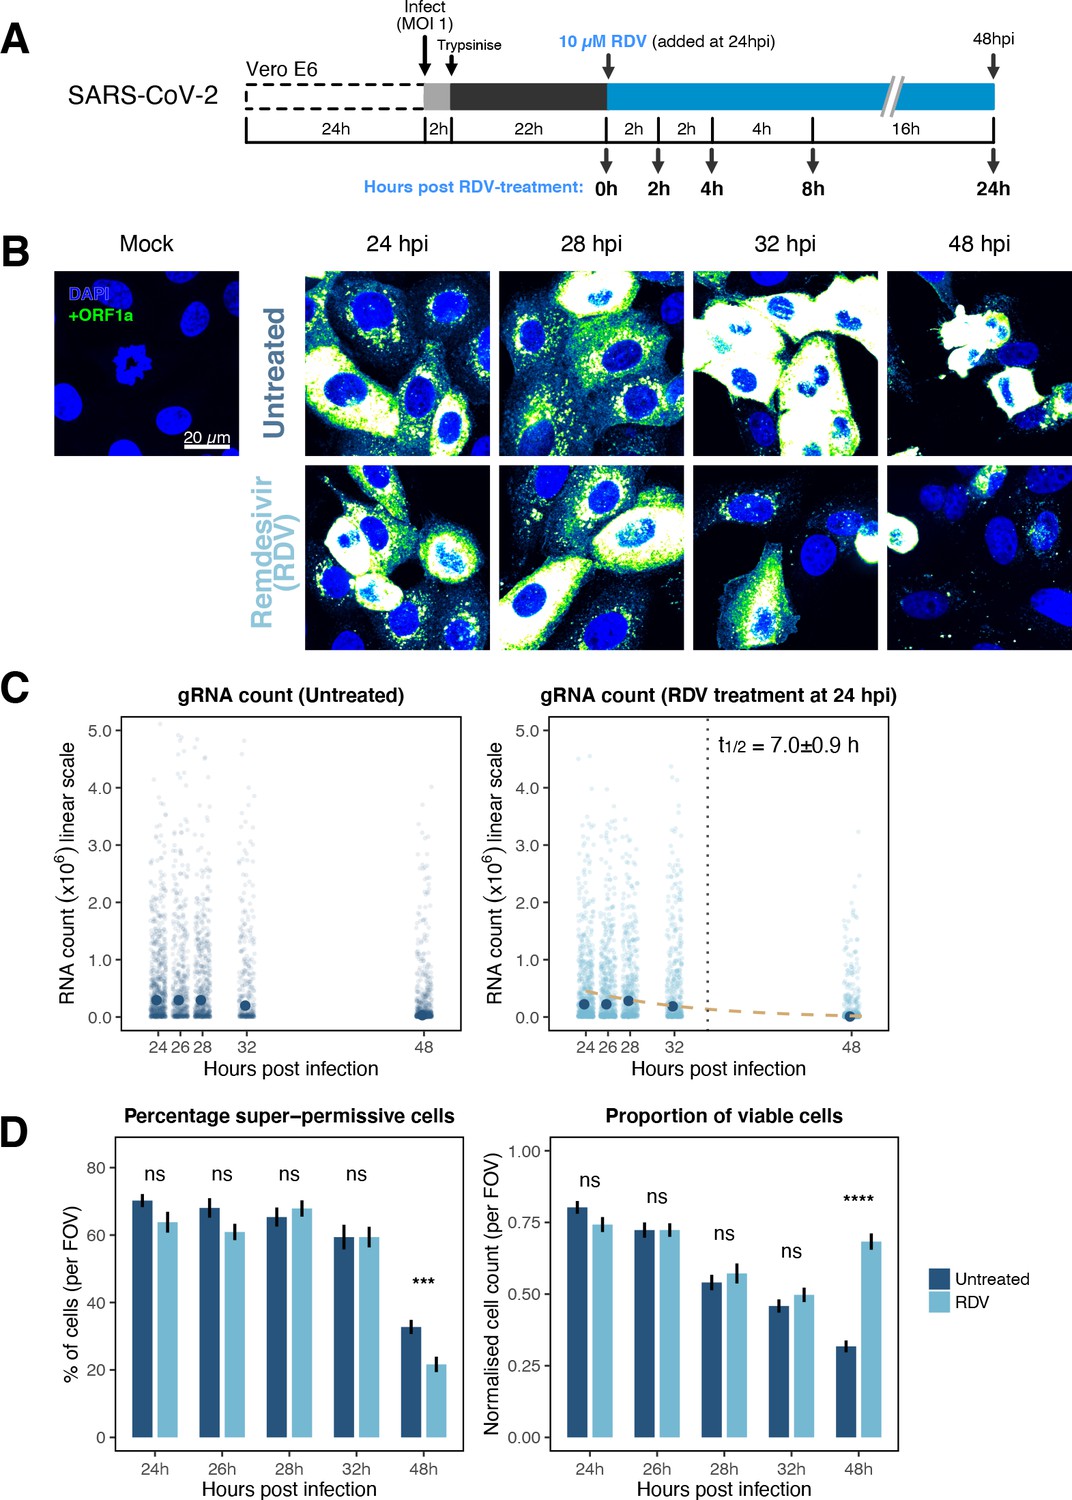
(A) Experimental design to profile SARS-CoV-2 replication kinetics in the late-stage infection. Vero E6 cells were seeded on cover-glass and 24 hr later inoculated with SARS-CoV-2 (Victoria [VIC] strain, multiplicity of infection [MOI] = 1) for 2 hr. Non-internalised viruses were removed by trypsin digestion, and cells were fixed at timepoints shown for hybridisation with +ORF1a probe. In remdesivir (RDV) condition, the drug (10 µM) was added to cells at 24 hpi and maintained for the times shown. (B) Representative full z-projected confocal images of infected cells from the time series. Viral genomic RNA (gRNA) was visualised with +ORF1a probes. Images were contrasted to equivalent single-molecule intensity. Scale bar = 20 µm. (C) Quantification of viral gRNA counts in untreated and RDV-treated cells. Reference single RNA molecule intensity was acquired using Bigfish in signal-sparse region of the images. Viral gRNA counts were quantified by extrapolating single-molecule intensity to 3D integrated intensity per cell. Decay curve was fitted with the median RNA count values using the last three timepoints. Data are represented as median ± SEM (n = 2). (D) The proportion of super-permissive and viable cells per field of view (FOV) across the time series. Cells containing >105 gRNA counts were considered super-permissive. Viable cells were quantified by counting non-condensed nuclei in randomly sampled FOVs. Non-condensed nuclei counts were normalised to the average count values from uninfected ‘Mock’ condition. Student’s t-test. ***p<0.001; ****p<0.0001. Data are represented as mean ± SEM (n = 2).
Figure 3—figure supplement 3
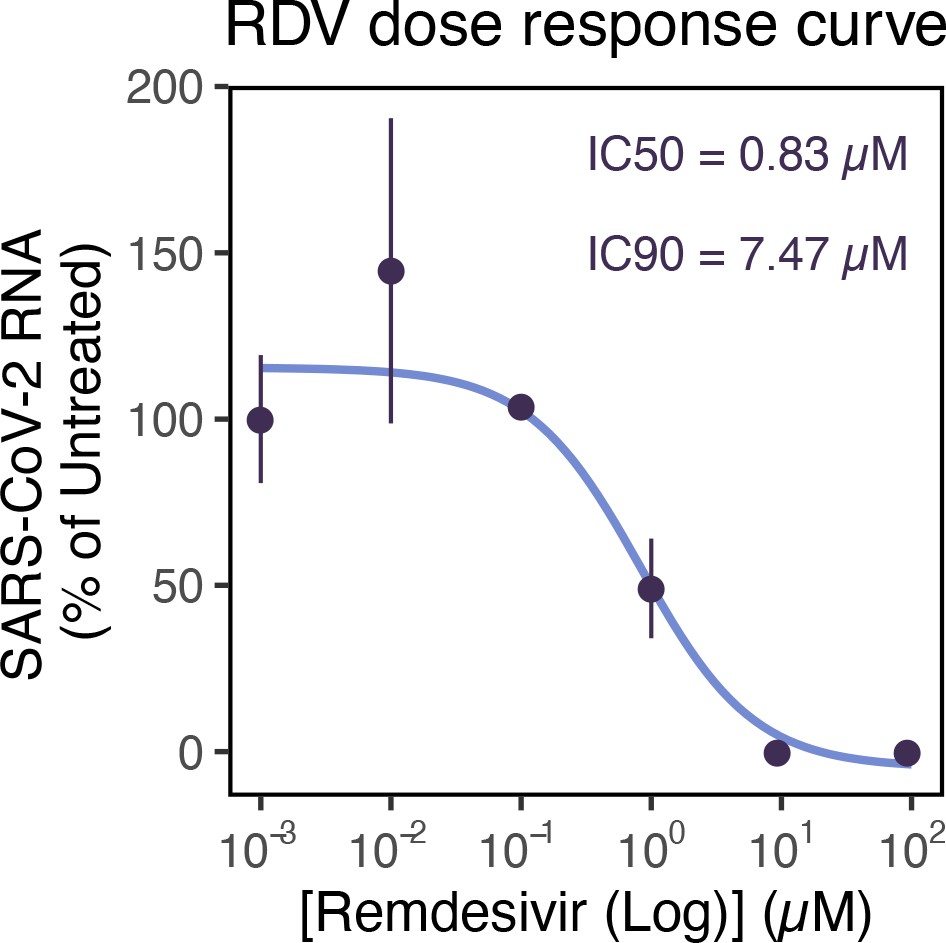
Remdemsivir (RDV) dose-response of severe acute respiratory syndrome coronavirus 2 (SARS-CoV-2) RNA replication.
Dose-response curve of RDV versus SARS-CoV-2 RNA replication. Viral RNA was quantified using RT-qPCR in infected Vero E6 cells at 24 hr post infection (hpi), targeting the ORF-N region. The concentrations of drug required for 50% inhibition (inhibitory concentration 50; IC50) and 90% inhibition (IC90) were estimated by fitting a non-linear (weighted) least-squares model on the data using the nls() function in base R (n = 3).
Figure 4 with 1 supplement
Heterogeneous severe acute respiratory syndrome coronavirus 2 (SARS-CoV-2) RNA replication.
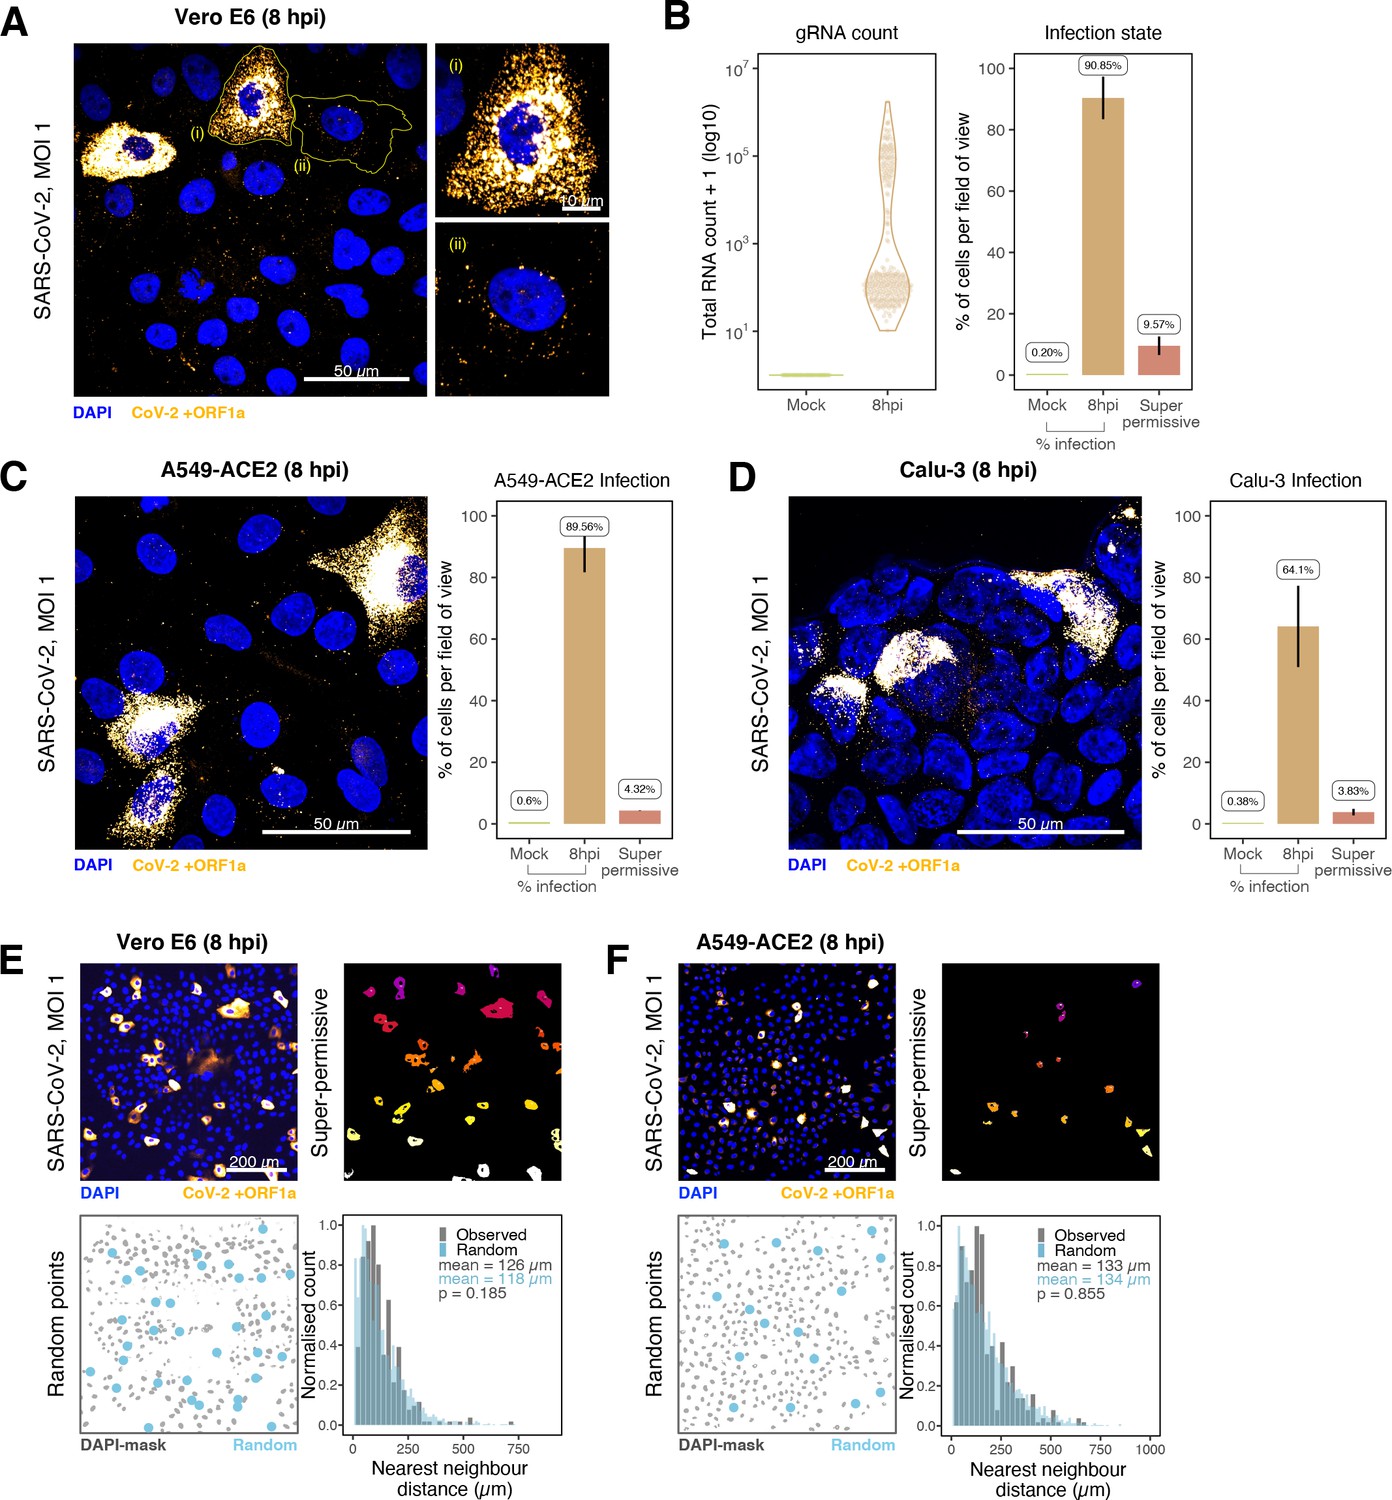
(A) Representative ×60 magnified field of view (FOV) of SARS-CoV-2-infected Vero E6 cells at 8 hr post infection (hpi) (Victoria [VIC] strain, multiplicity of infection [MOI] = 1). Single-molecule fluorescence in situ hybridisation (smFISH) against ORF1a was used to visualise cellular heterogeneity in viral RNA counts. Magnified panels show (i) a ‘super-permissive’ cell and (ii) a cell with discrete viral RNA copies. Scale bar = 10 or 50 µm. (B) Discrete separation of genomic RNA (gRNA) count distribution among infected cells randomly sampled at 8 hpi, where each symbol represents a cell. Statistics for the percentage of infected cells and frequency of ‘super-permissive’ cells at 8 hpi. Quantification was performed per FOV, and the number labels represent average values. Cells with >105 gRNA copies were considered to be ‘super-permissive’ (gRNA quantification: n = 4, 148 uninfected and 316 infected cells; percentage infection: n = 3). (C, D) Heterogeneous SARS-CoV-2 replication in lung epithelial A549-ACE2 and Calu-3 cells. The percentage of infected and super-permissive cells was quantified as with Vero E6 cells above. Scale bar = 50 µm (A549-ACE2, n = 2; Calu-3, n = 3). (E, F) Spatial distribution analysis of super-permissive Vero E6 and A549-ACE2 cells at 8 hpi. Low-magnification smFISH overview of infected cells (top left). 2D mask of super-permissive cells (top right). An example of randomly simulated points within the DAPI mask (bottom left). Same number of random points as super-permissive cells were simulated 10 times per FOV. Histogram of nearest-neighbour distances calculated from super-permissive cells (Observed) and randomly simulated points (Random) (bottom right). Further modes of spatial analyses are presented in Figure 4—figure supplement 1 with infected Calu-3 cells. All confocal images are presented as maximum full z-projection. Data are represented as mean ± SD. Student’s t-test; p-values are shown on the presented visual (Vero E6, n = 3; A549-ACE2, n = 2).
Figure 4—figure supplement 1
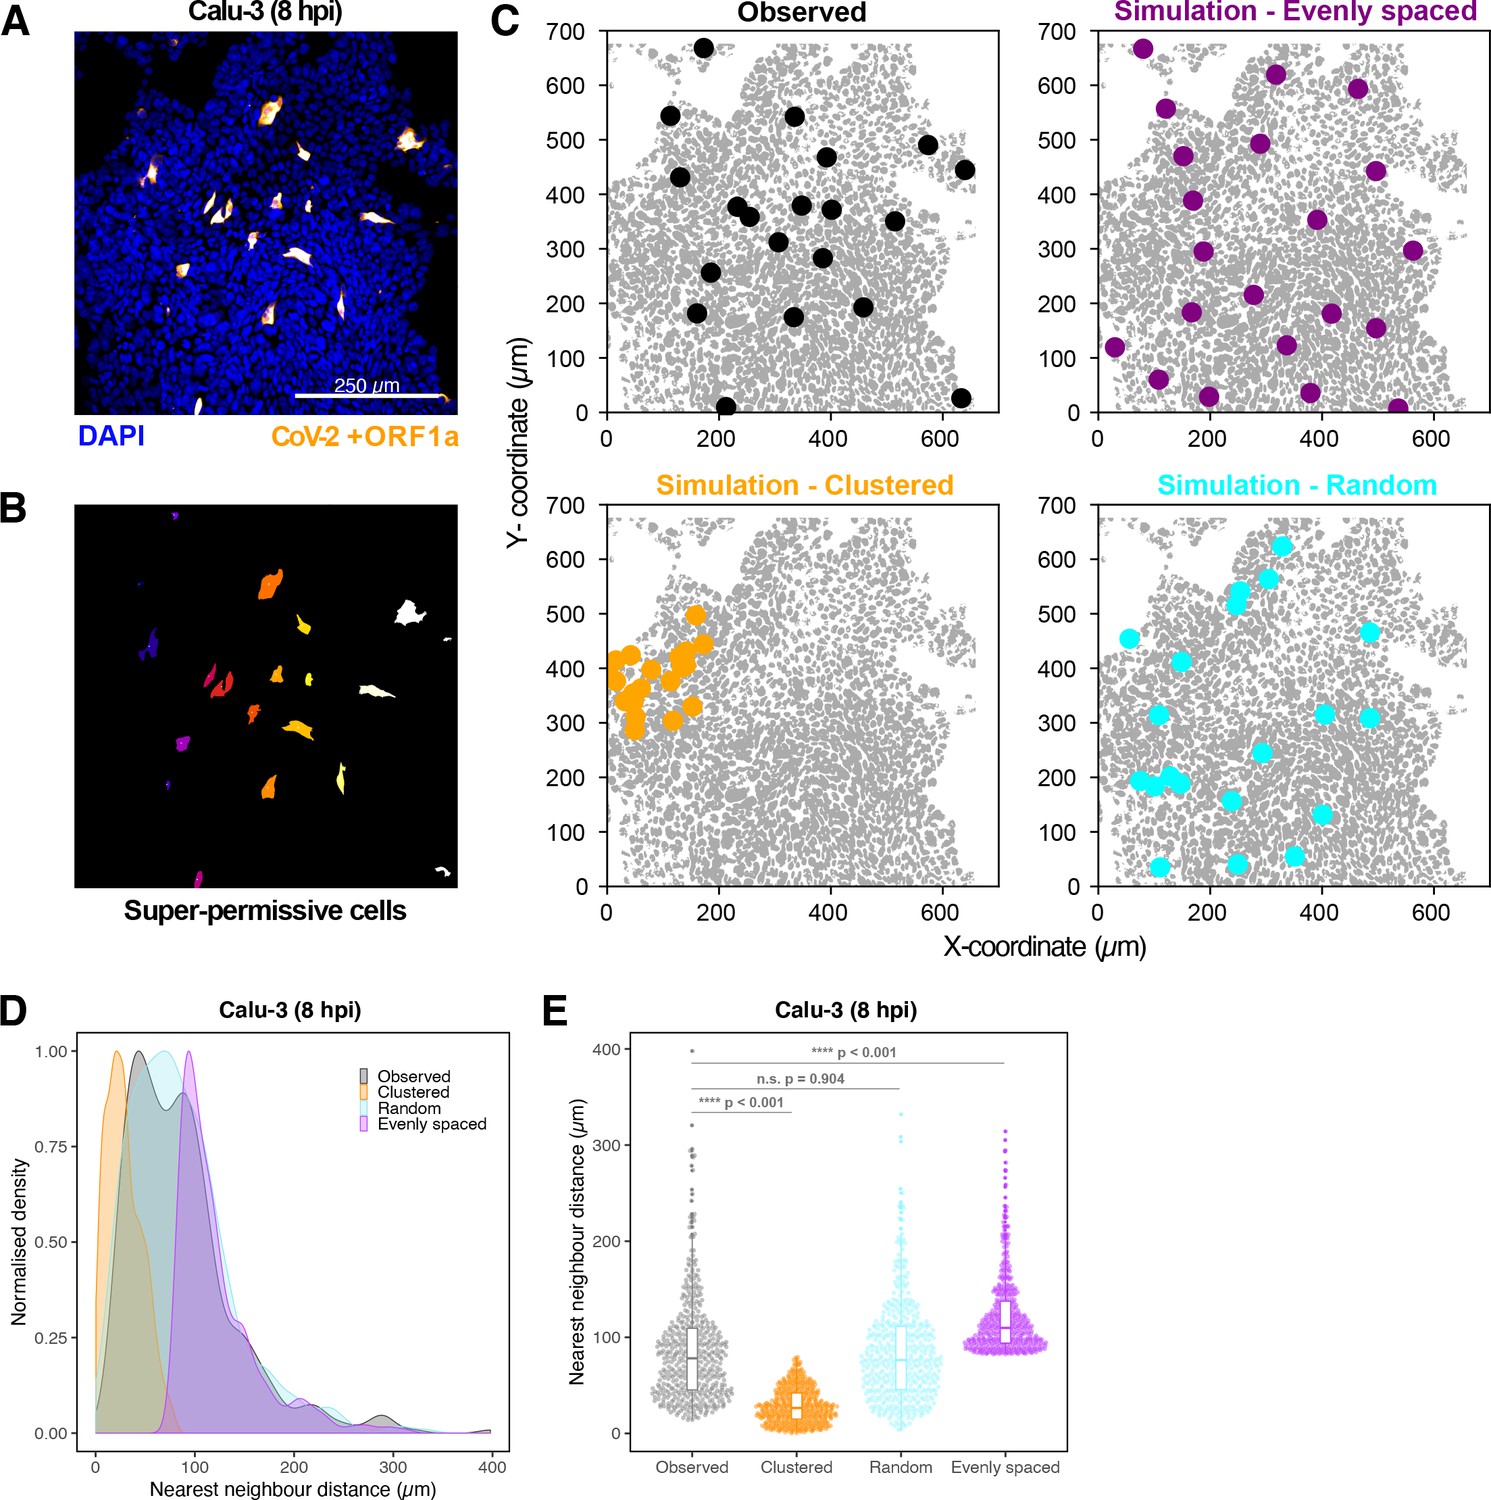
Spatial distribution of super-permissive severe acute respiratory syndrome coronavirus 2 (SARS-CoV-2)-infected cells.
Spatial distribution analysis of ‘super-permissive’ SARS-CoV-2 (Victoria [VIC])-infected Calu-3 cells. Cells were infected with SARS-CoV-2 (VIC strain) at a multiplicity of infection [MOI] of 1, fixed at 8 hr post infection (hpi) and hybridised with +ORF1a single-molecule fluorescence in situ hybridisation (smFISH) probe to visualise viral RNA. (A) Low-magnification image (full z-projection) of infected Calu-3 cells showing a population of minority ‘super-permissive’ cells visible with smFISH. Scale bar = 250 µm. (B) 2D mask generated from spatial coordinates of super-permissive cells. (C) Observed distribution of super-permissive cells (Observed) and the example coordinates of the three modes of spatial distributions: (i) evenly spaced, (ii) clustered, and (iii) random. The simulations were confined to DAPI-positive areas. (D) Density plot of nearest-neighbour distances obtained from the spatial distribution simulation. Each mode of distribution was iterated 10 times per image. (E) Beeswarm plot of nearest-neighbour distances obtained from the spatial distribution analysis. One-way ANOVA with post-hoc Tukey test (n = 3).
Figure 5 with 2 supplements

Delayed replication kinetics of B.1.1.7 variant.
(A) Experimental design to compare the replication kinetics of Victoria (VIC) and B.1.1.7 severe acute respiratory syndrome coronavirus 2 (SARS-CoV-2) strains. Vero E6 cells were seeded on cover-glass and 24 hr later inoculated with VIC or B.1.1.7 strain (multiplicity of infection [MOI] = 1) for 2 hr. Non-internalised viruses were removed by trypsin digestion, and cells were fixed at designated timepoints for hybridisation with +ORF1a and +ORFN probes. In remdesivir (RDV) condition, the drug was added to cells at 10 µM during virus inoculation and maintained for the infection period. (B) Maximum z-projected confocal images of Vero E6 cells infected with VIC or B.1.1.7 strains. Representative super-permissive cells from the time series are shown. Scale bar = 10 µm. (C) Comparing viral genomic RNA (gRNA) counts at 2 hr post infection (hpi) between VIC and B.1.1.7. Each symbol represents a cell. Different hue of colours represents readings taken from individual repeat experiments, and the labels represent average values (n = 3; VIC, 424 cells; B.1.1.7, 519 cells). Mann–Whitney U test. (D) Comparing percentage of infected cells between the two viral strains at 2 hpi. Infected cells were determined by +ORF1a single-molecule fluorescence in situ hybridisation (smFISH) fluorescence. Data are represented as mean ± SD (n = 3). Student’s t-test. (E) Bigfish quantification of gRNA and subgenomic RNA (sgRNA) smFISH counts per cell. Quantification was performed as in (Figure 3C). Due to bimodality of the data, statistical significance was determined using two-sample Kolmogorov-Smirnov test to compare cumulative distribution of+ ORF1 a counts between the two strains. (n = 3). (VIC, 2 : 6 : 8 hpi = 460 : 343 : 407 cells; B.1.1.7, 2 : 6 : 8 hpi = 396 : 487 : 429 cells). (F) Comparing the number of viral factories per cell between the two viral strains across the time series. Cells harbouring >107 copies of vRNA were excluded from analysis. Viral factories were identified using Bigfish cluster detection as with (Figure 3I). Data are represented as mean ± SEM (n = 3). Mann–Whitney U test. (G) Density ridge plot showing the number of gRNA copies within viral factories for VIC and B.1.1.7 variants. The density distribution represents the number of molecules per viral factories per cell. Vertical segment symbol represents a cell (n = 3). Mann–Whitney U test. (H) Per cell ratio of sgRNA/gRNA counts across the time series. Grey symbols represent cell-to-cell mean ± SE which are connected by line plots. Horizontal dashed line represents value of 1 (n = 3). Mann–Whitney U test. (I) Comparison of the percentage of super-permissive cells between the two strains assessed from low-magnification high-throughput smFISH assay (see Figure 5—figure supplement 1 for details). Data are represented as mean ± SD (n = 3). Student’s t-test. n.s., not significant; *p<0.05; **p<0.01; ***p<0.001; ***p<0.0001.
Figure 5—figure supplement 1
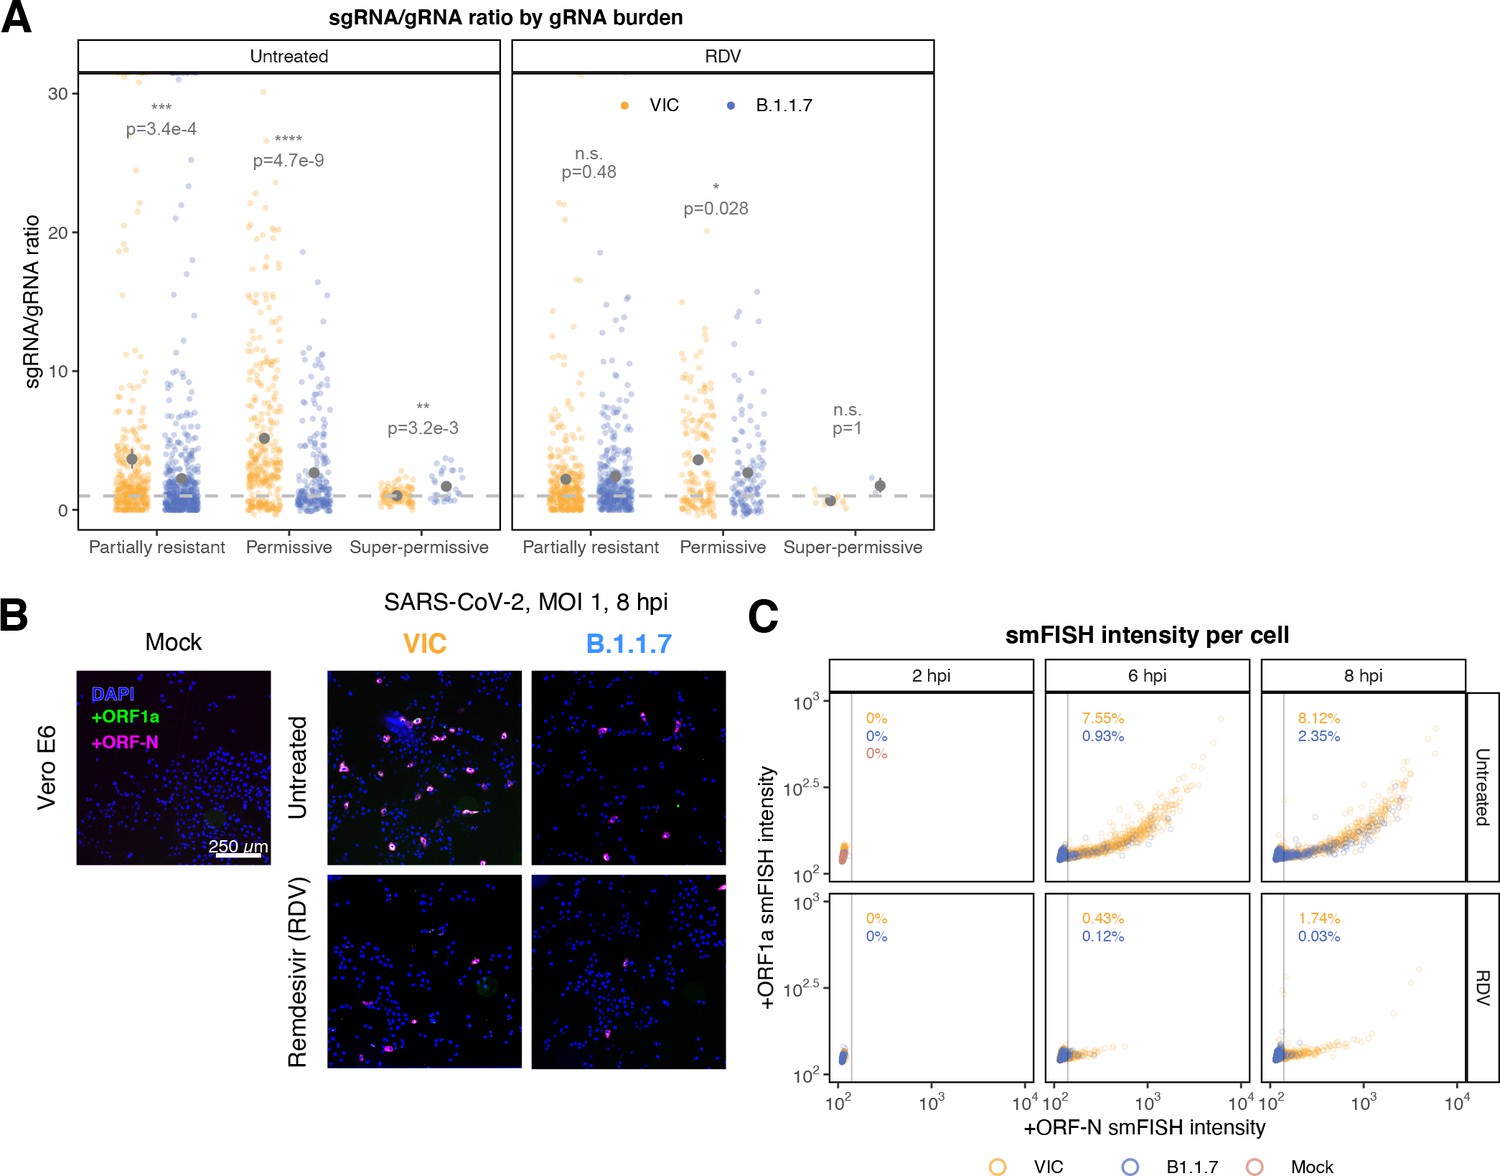
Delayed replication kinetics of B.1.1.7 severe acute respiratory syndrome coronavirus 2 (SARS-CoV-2) variant.
Vero E6 cells were seeded on cover-glass and 24 hr later inoculated with Victoria (VIC) or B.1.1.7 strain (multiplicity of infection [MOI] = 1) for 2 hr. Non-internalised viruses were removed by trypsin digestion, and cells were fixed at designated timepoints. In remdesivir (RDV) condition, the drug was added to cells at 10 µM during virus inoculation and maintained for the infection period. (A) Per cell ratio of subgenomic RNA (sgRNA)/genomic RNA (gRNA) counts grouped by gRNA burden classification as in Figure 3D. Single-molecule fluorescence in situ hybridisation (smFISH) quantification was performed as with Figure 5H. Grey symbols represent mean ± SEM. The horizontal dashed line represents ratio of 1 (3). Mann–Whitney U test. n.s., not significant; *p<0.05; **p<0.01; ***p<0.001; ***p<0.0001. (B) Low-magnification (×20) z-projected (6 µm) images of +ORF1a and +ORFN smFISH in infected Vero E6 cells. Scale bar = 250 µm. (C) Scatter plot showing high-throughput smFISH intensity quantification of +ORF1a and +ORFN probes in VIC and B.1.1.7-infected cells. Each symbol represents a cell. Fluorescence density was measured from stitched ×20 overview images, covering approximately ~60% of the culture well area. At this magnification, smFISH fluorescence is only detectable in ‘super-permissive’ cells (>105 vRNA). The percentage of super-permissive cells was calculated based on a gate which was set with +ORFN signal using uninfected (Mock) condition signal as a threshold (vertical line) (n = 3).
Figure 5—figure supplement 2
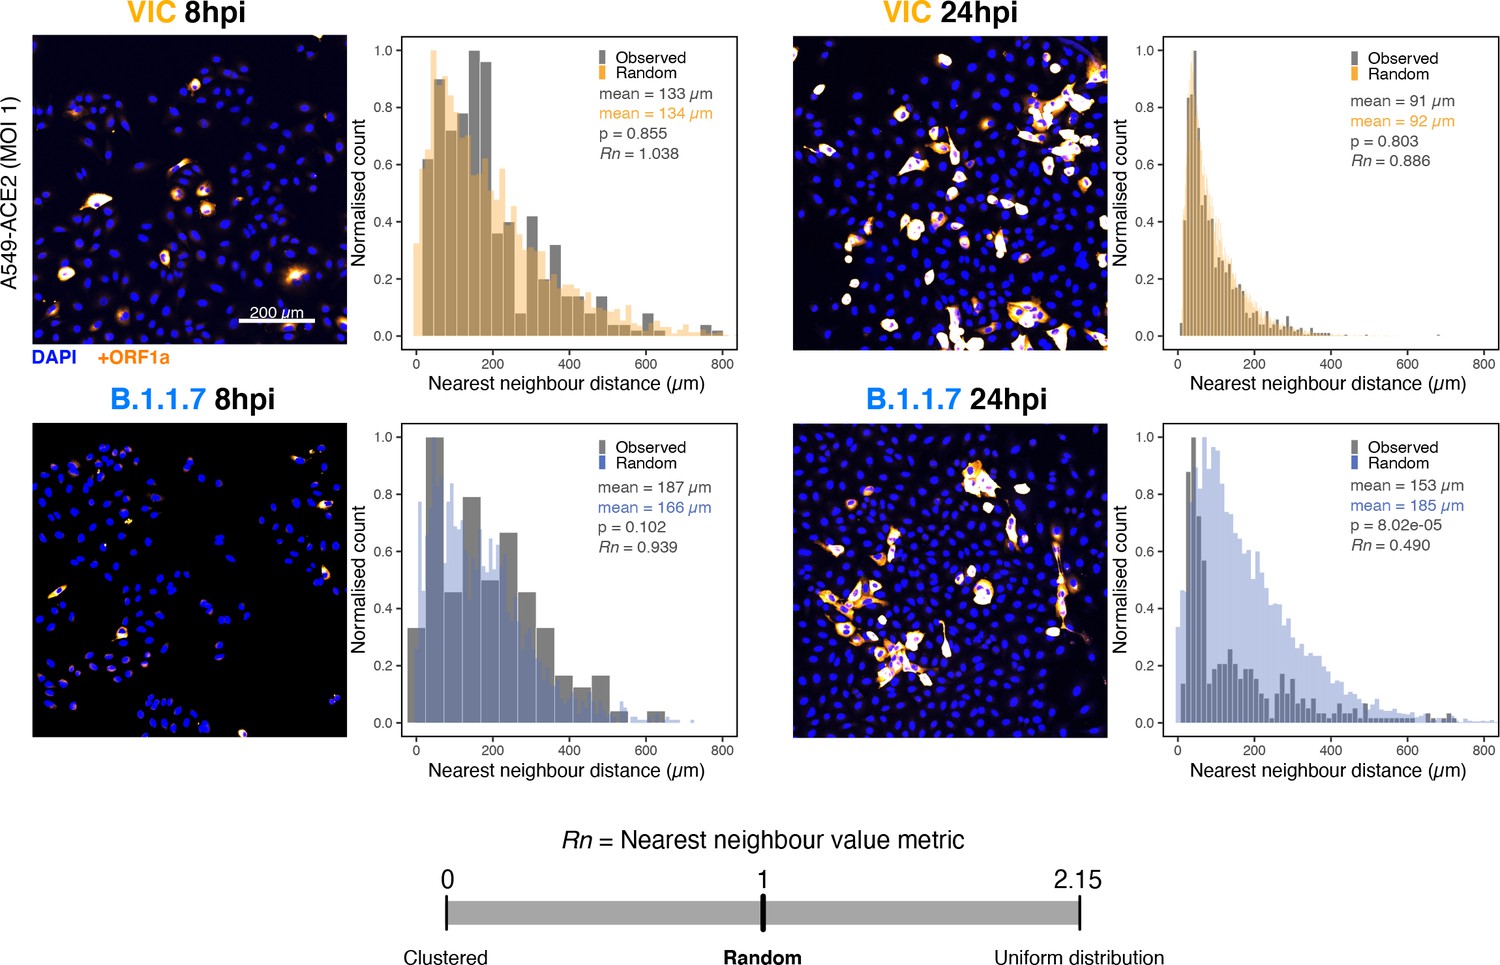
Spatial distribution of Victoria (VIC) or B.1.1.7 severe acute respiratory syndrome coronavirus 2 (SARS-CoV-2) super-permissive cells.
Spatial distribution analysis of super-permissive A549-ACE2 cells infected with VIC or B.1.1.7 strains at 8 hr post infection (hpi) and 24 hpi. Low-magnification overview of infected cells hybridised with +ORF1a probes is shown. To compare the ‘observed’ distribution of super-permissive cells and ‘random’ distributions, the same number of random points as super-permissive cells was simulated 10 times per field of view (FOV). Nearest-neighbour distances calculated from super-permissive cells (Observed) and simulated points (Random) are presented as histogram plots. Nearest-neighbour values (Rn) were calculated for each condition to assess the distribution of cell clusters (see Materials and methods). Rn value below 1 indicates a degree of clustering, and Rn value >1 indicates uniform placements. Student’s t-test. p-Values are denoted on the figure (n = 2 entire chamber wells).
Figure 6 with 2 supplements
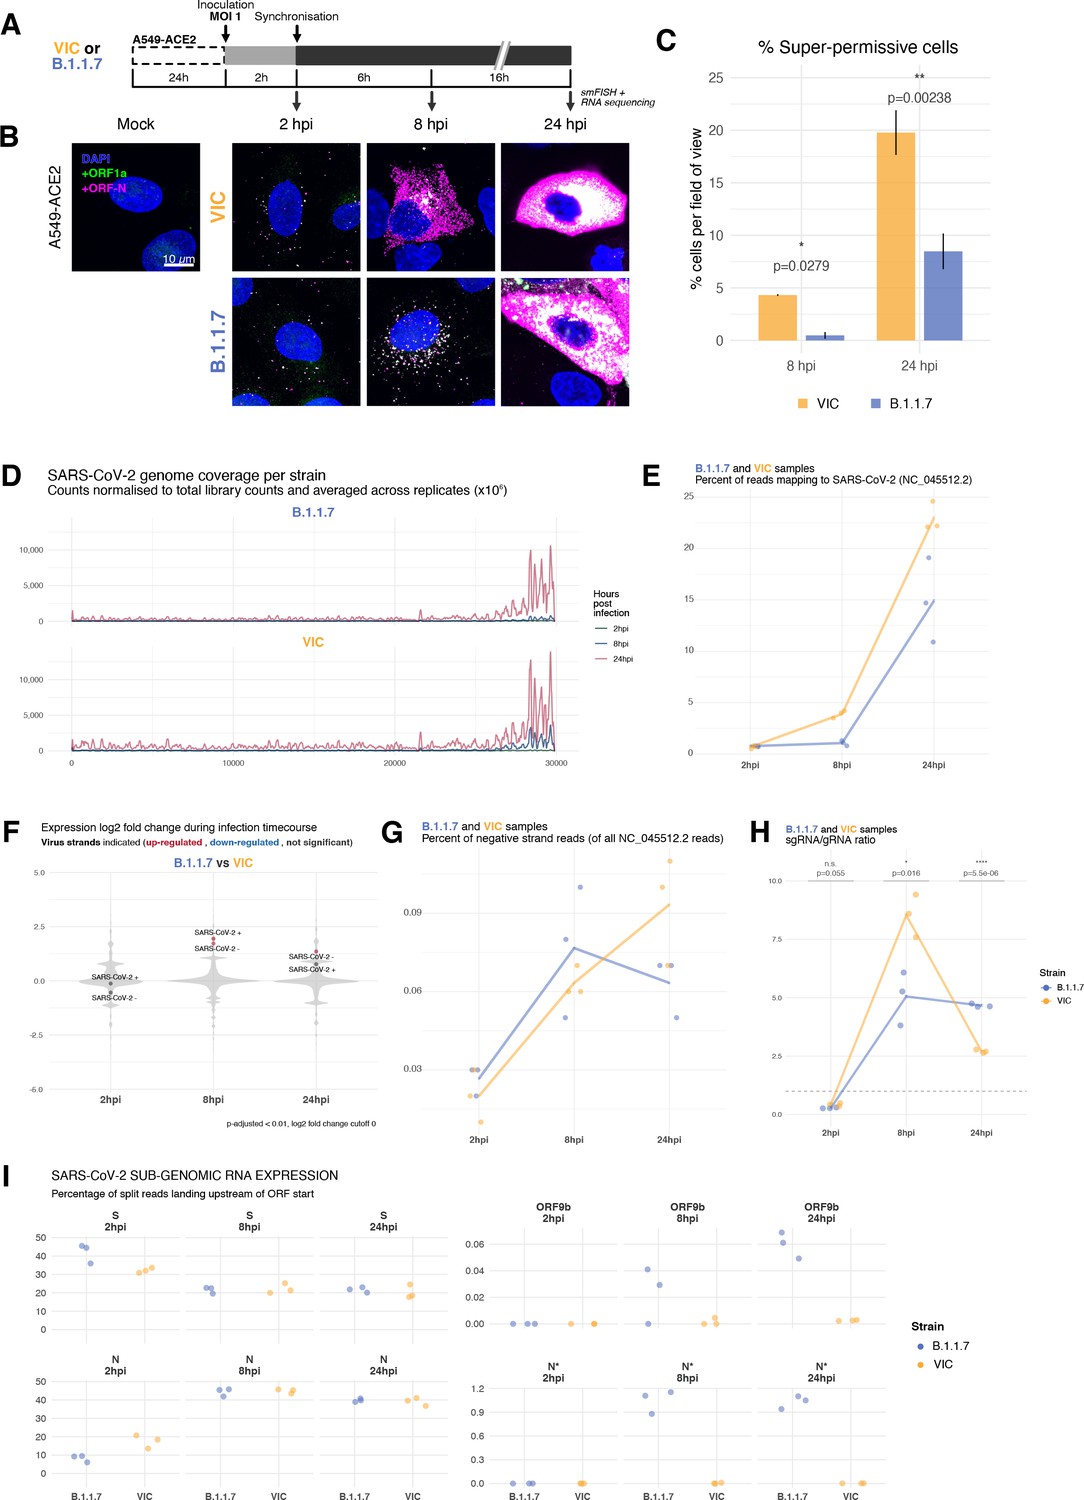
Transcriptomic landscape of B.1.1.7 and Victoria (VIC) severe acute respiratory syndrome coronavirus 2 (SARS-CoV-2) strains.
(A) Experimental design to compare replication kinetics and transcriptomic landscapes of VIC and B.1.1.7 strains. A549-ACE2 cells were seeded and 24 hr later inoculated with VIC or B.1.1.7 strain (multiplicity of infection [MOI] = 1) for 2 hr. Non-internalised viruses were removed by trypsin digestion, and cells were fixed at designated timepoints for single-molecule fluorescence in situ hybridisation (smFISH) or harvested for RNA-seq library preparation. (B) Maximum z-projected confocal images of A549-ACE2 cells infected with VIC or B.1.1.7. Representative super-permissive cells from the time series are shown. Numbers at the bottom-left corner indicate dynamic contrast range used to display the image. Scale bar = 10 µm. (C) Comparison of the percentage of super-permissive cells between the two strains. Super-permissive cells were identified from low-magnification high-throughput smFISH assay (see Figure 6—figure supplement 1B-C). Data are represented as mean ± SD (8 hr post infection [hpi] n = 2; 24 hpi n = 3). *p<0.5: **p<0.01. (D) Read coverage along SARS-CoV-2 genome (positive strand) for the two variants in the three timepoints. Counts are normalised to total read count to show the increased proportion of reads from the virus in addition to the accumulation of subgenomic RNA and averaged across replicates. (n = 3). (E) Percentage of reads mapping to SARS-CoV-2 genome of total mapped reads, shown separately for the two strains. Each symbol represents an experimental replicate (n = 3). (F) Violin plots showing fold-changes in the host transcriptome and viral RNA genome comparing B.1.1.7 and VIC strains at the three timepoints. Fold-changes for SARS-CoV-2-positive and -negative strands are indicated as separate points and coloured according to the statistical significance of the change (red – higher in VIC, blue – higher in B.1.1.7, grey – no change). p-adjusted <0.01, log2 fold-change cut-off = 0 (n = 3). (G) Percent of reads mapping to SARS-CoV-2-negative (antisense) strand relative to all SARS-CoV-2 reads, shown separately for the two strains. Each symbol represents an experimental replicate (n = 3). (H) Estimated ratio of SARS-CoV-2 subgenomic to genomic RNA for the two virus variants at the three timepoints. Student’s t-test. n.s., not significant; *p<0.05; ****p<0.001 (n = 3). (I) Expression of S, N, ORF9b, and N* viral subgenomic RNAs in each strain and different timepoints. Expression of each subgenomic RNA is determined from split reads indicative of transcriptional skipping landing within 100 nt upstream of annotated ORF start site, or until upstream ORF start codon if nearer. Percentage of all skip events is shown (n = 3).
Figure 6—figure supplement 1
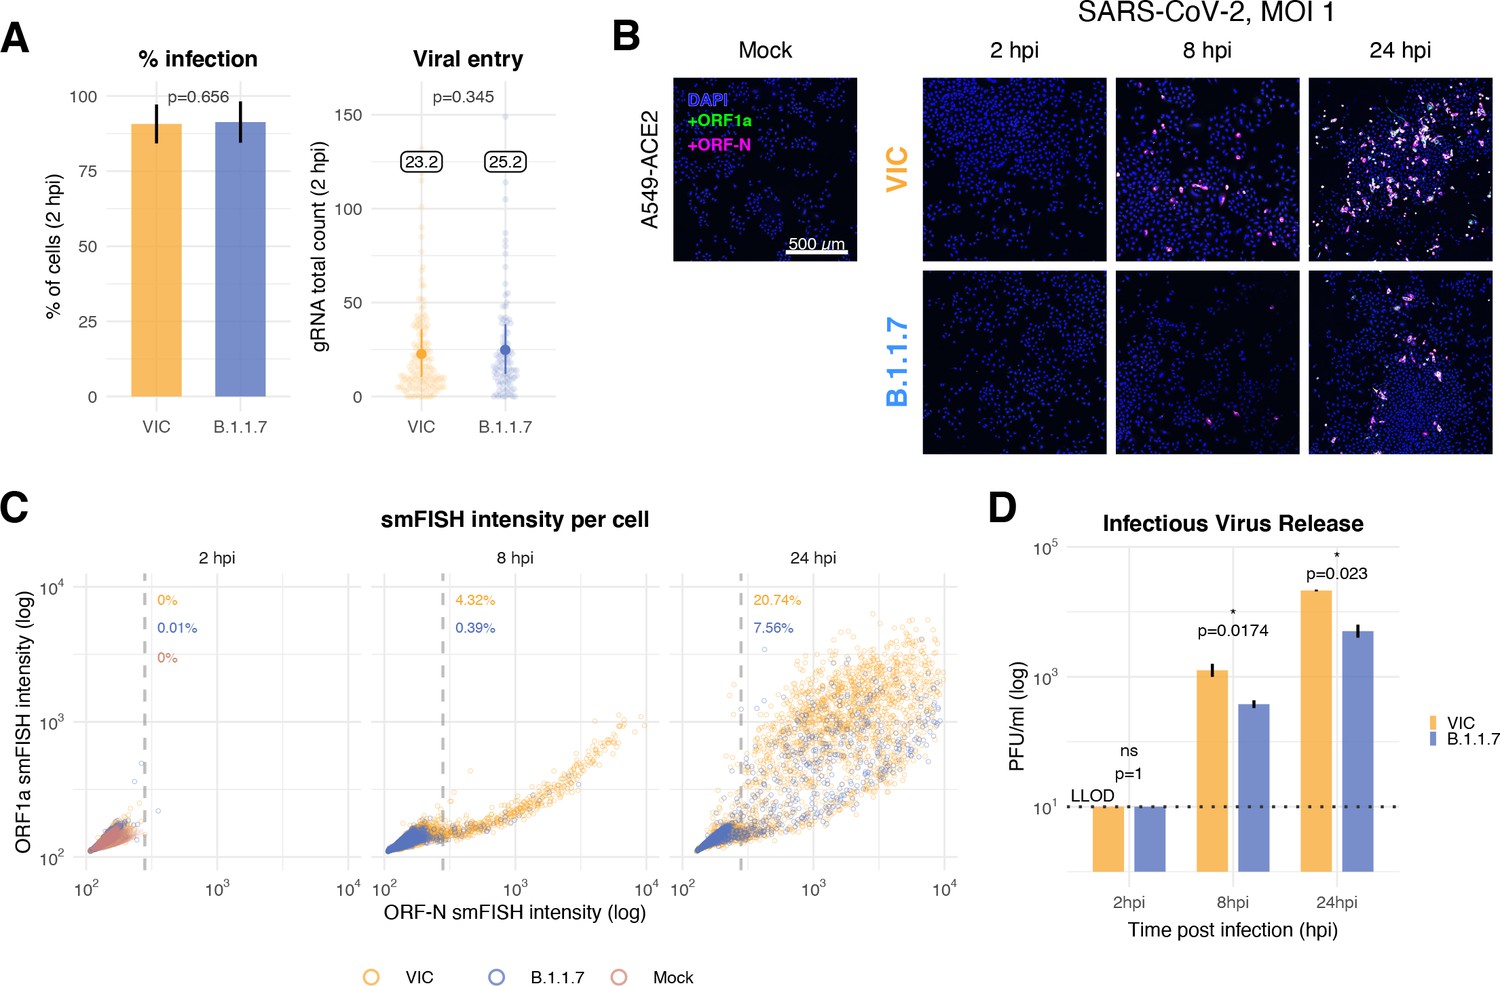
Delayed replication kinetics of B.1.1.7 severe acute respiratory syndrome coronavirus 2 (SARS-CoV-2) variant in A549-ACE2 cells.
A549-ACE2 cells were seeded and 24 hr later inoculated with Victoria (VIC) or B.1.1.7 strain (multiplicity of infection [MOI] = 1) for 2 hr. Non-internalised viruses were removed by trypsin digestion, and the cells were fixed at designated timepoints for single-molecule fluorescence in situ hybridisation (smFISH). (A) Comparing percentage of infected A549-ACE2 cells between VIC and B.1.1.7 at 2 hr post infection (hpi) (left). Infected cells were determined by +ORF1a smFISH spot detection. Data are represented as mean ± SD. Comparison of viral genomic RNA (gRNA) counts at 2 hpi between the two strains (right). Each dot represents a cell. Data are represented as mean ± SEM, and the labels represent average values. (B) Low-magnification z-projected (9 µm) images of SARS-CoV-2-infected A549-ACE2 cells. Cells were hybridised with +ORF1a and +ORFN probes to visualise super-permissive cells. Scale bar = 500 µm. (C) Scatter plot showing high-throughput smFISH intensity quantification of +ORF1a and +ORFN probes in infected cells. Each dot is a cell. Fluorescence signal density was measured from low-magnification overview image of entire culture wells. A gate was set with +ORFN signal using uninfected (Mock) condition (dotted line) (2–4 hpi, n = 2; 24 hpi, n = 3). (D) Comparison of VIC and B.1.1.7 infection and secretion of infectious virus. Extracellular media from infected A549-ACE2 cells was collected at the indicated timepoints and infectious virus quantified using plaque forming assay. Data are represented as mean ± SEM. No apparent plaques were found at 2 hpi, and pseudocounts of 10 PFU/ml were added for plotting purposes (LLOD, lower limit of detection). Student’s t-test (n = 3). *p<0.05.
Figure 6—figure supplement 2
Transcriptomic landscapes of B.1.1.7 and Victoria (VIC) and severe acute respiratory syndrome coronavirus 2 (SARS-CoV-2) strains.
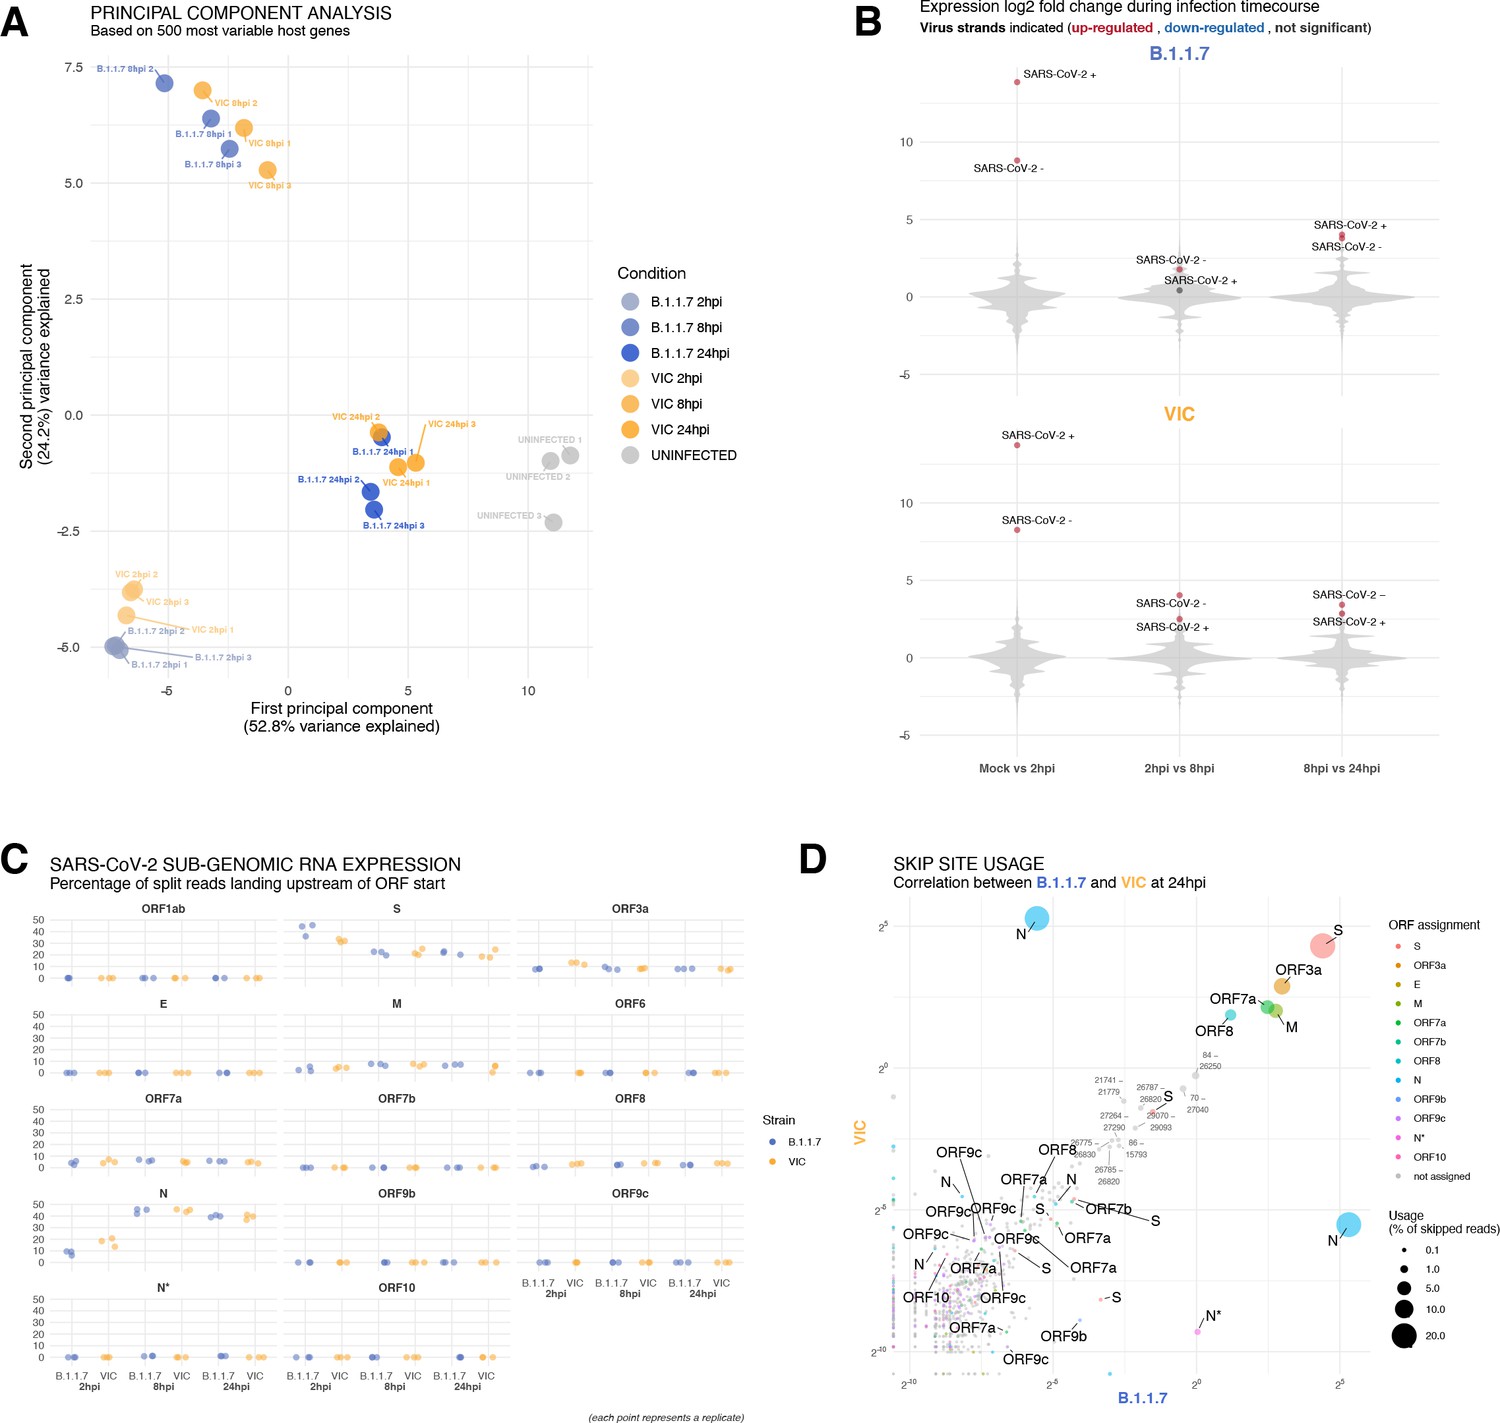
A549-ACE2 cells were seeded and 24 hr later inoculated with VIC or B.1.1.7 strain (multiplicity of infection [MOI] = 1) for 2 hr. Non-internalised viruses were removed by trypsin digestion, and the cells were harvested for RNA-seq library preparation. (A) First two components of a principal component analysis (PCA) performed on the 500 host genes showing the highest variance in RNA-seq. The infection timepoints (coloured) and control (grey) samples group into separate clusters, but the samples of the two strains remain close to one another (n = 3). (B) Violin plots showing fold-changes in the host transcriptome and viral RNA genome comparing consecutive timepoints separately for each of the two strains. Fold-changes for SARS-CoV-2-positive and -negative strands are indicated as separate points and coloured according to the statistical significance of the change (red – upregulated relative to earlier timepoint, blue – downregulated relative to earlier timepoint, grey – no change). p-adjusted <0.01, log2 fold-change cut-off = 0 (n = 3). (C) Expression of viral subgenomic RNAs (sgRNAs) in each strain and different timepoints. Expression of each sgRNA is determined from split reads indicative of transcriptional skipping landing within 100 nt upstream of annotated ORF start site, or until upstream ORF start codon if nearer. Percentage of all skip events is shown (n = 3). (D) Comparison of transcriptional skip site usage between the two virus strains at 24 hr post infection (hpi). Assignment to viral genes is as in panel (C).Average across replicates is shown (n = 3).
Tables
Key resources table
| Reagent type (species) or resource | Designation | Source or reference | Identifiers | Additional information |
|---|---|---|---|---|
| Gene (SARS-CoV-2) | SARS-CoV-2 RefSeq reference genome | NCBI | NC_045512.2 | |
| Gene (Homo sapiens) | human genome | Ensembl | GRCh38.99 | |
| Strain, strain background (SARS-CoV-2) | Victoria 01/20 (BVIC01) | Caly et al., 2020 | Provided by PHE Porton Down after supply from the Doherty Centre Melbourne, Australia | |
| Strain, strain background (SARS-CoV-2) | B.1.1.7 (20I/501Y.V1.HMPP1) | Tegally et al., 2020 | Provided by PHE Porton Down | |
| Strain, strain background (SARS-CoV-2) | HCoV-229E | Provided by Professor Andrew Davidson and Professor Peter Simmonds | ||
| Cell line (African green monkey) | Vero E6 | Kind gift from Professor William James | ||
| Cell line (H. sapiens) | A549-ACE2 | Kind gift from Professor Ralf Bartenschlager | ||
| Cell line (H. sapiens) | Huh-7.5 | Kind gift from Professor Peter Simmonds | ||
| Cell line (H. sapiens) | Calu-3 | Kind gift from Professor Nicole Zitzmann | ||
| Biological sample (Gold Syrian hamster) | hamster lung tissue | This study | Infected tissue provided by the Biological Investigations Group, Public Health England, Porton Down | |
| Antibody | J2 primary antibody (mouse, monoclonal) | Scicons | Cat# 10010200; RRID:AB_2651015 | 1:500 IF |
| Antibody | Anti-SARS-CoV-2 N antibody (human, monoclonal) | Huang et al., 2020 | Ey2A clone | 1:2000 IF |
| Commercial assay or kit | SARS primer probe | IDT | Cat# 100006770 | |
| Commercial assay or kit | B2M primer probe | Applied Biosystems | Cat# 4325797 | |
| Commercial assay or kit | QIAGEN RNeasy kit | QIAGEN | Cat# 74004 | |
| Commercial assay or kit | Illumina Total RNA Prep with Ribo-Zero Plus library kit | Illumina | Cat# 20040525 | |
| Commercial assay or kit | Beckman Coulter RNAClean XP beads | Beckman Coulter | Cat# A63987 | |
| Commercial assay or kit | Takyon Dry Probe MasterMix | Eurogentec | Cat# UFD-NPMT-C0101 | |
| Chemical compound, drug | ATTO633 NHS ester | Atto-Tec | Cat# AD633 | |
| Chemical compound, drug | ATTO565 NHS ester | Atto-Tec | Cat# AD565 | |
| Chemical compound, drug | Cy3 NHS ester | Lumiprobe | Cat# 11320 | |
| Chemical compound, drug | ATTO488 NHS ester | Atto-Tec | Cat# AD488 | |
| Chemical compound, drug | Phalloidin-Alexa Fluor 488 conjugate | Thermo Fisher | Cat# A12379 | |
| Chemical compound, drug | CellMask Green | Thermo Fisher | Cat# C37608 | |
| Chemical compound, drug | RNaseT1 | Thermo Fisher | Cat# EN0541 | |
| Chemical compound, drug | RNaseIII | NEB | Cat# M0245S | |
| Software, algorithm | Stellaris Probe Designer ver 4.2 | Biosearch technologies | ||
| Software, algorithm | ‘bowtie2’ | Langmead and Salzberg, 2012 | v2.4.4 | |
| Software, algorithm | OMERO server | Allan et al., 2012 | ||
| Software, algorithm | cellSens Dimension | Olympus | ||
| Software, algorithm | ImageJ | National Institute of Health | ||
| Software, algorithm | FISH-quant | Mueller et al., 2013 | v3 | |
| Software, algorithm | RNA Distribution Index (RDI) calculator | Stueland et al., 2019 | ||
| Software, algorithm | STAR aligner | Dobin et al., 2013 | v2.7.3a | |
| Software, algorithm | Cellpose | Stringer et al., 2021 | v0.6.1 | |
| Software, algorithm | Bigfish | Imbert et al., 2021 | v0.4.0 | |
| Software, algorithm | R package DESeq2 | Love et al., 2014 | v1.28.1 | |
| Software, algorithm | Affinity Designer | Serif |
Additional files
-
Supplementary file 1
Multiple sequence alignment of severe acute respiratory syndrome coronavirus 2 (SARS-CoV-2) variants of concern and variants of interest centred around transcriptional regulatory sequence motifs.
- https://cdn.elifesciences.org/articles/74153/elife-74153-supp1-v2.pdf
-
Supplementary file 2
Single-molecule fluorescence in situ hybridisation (smFISH) oligonucleotide probe sequences used in this study.
- https://cdn.elifesciences.org/articles/74153/elife-74153-supp2-v2.xlsx
-
Supplementary file 3
Differentially expressed gene analysis of RNA sequencing samples from A549-ACE2 cells infected with B.1.1.7 or Victoria SARS-CoV-2 strains at 2, 8, and 24 hr post infection.
- https://cdn.elifesciences.org/articles/74153/elife-74153-supp3-v2.xlsx
-
Transparent reporting form
- https://cdn.elifesciences.org/articles/74153/elife-74153-transrepform1-v2.pdf
Download links
A two-part list of links to download the article, or parts of the article, in various formats.
Downloads (link to download the article as PDF)
Open citations (links to open the citations from this article in various online reference manager services)
Cite this article (links to download the citations from this article in formats compatible with various reference manager tools)
Absolute quantitation of individual SARS-CoV-2 RNA molecules provides a new paradigm for infection dynamics and variant differences
eLife 11:e74153.
https://doi.org/10.7554/eLife.74153


