Binary outcomes of enhancer activity underlie stable random monoallelic expression
- Division of Immunology and Pathogenesis, Department of Molecular and Cell Biology, University of California, Berkeley, United States
- Cancer Research Laboratory, University of California, Berkeley, United States
- Laboratory of Immune System Biology, National Institute of Allergy and Infectious Diseases, National Institutes of Health, United States
Figures
Figure 1 with 2 supplements
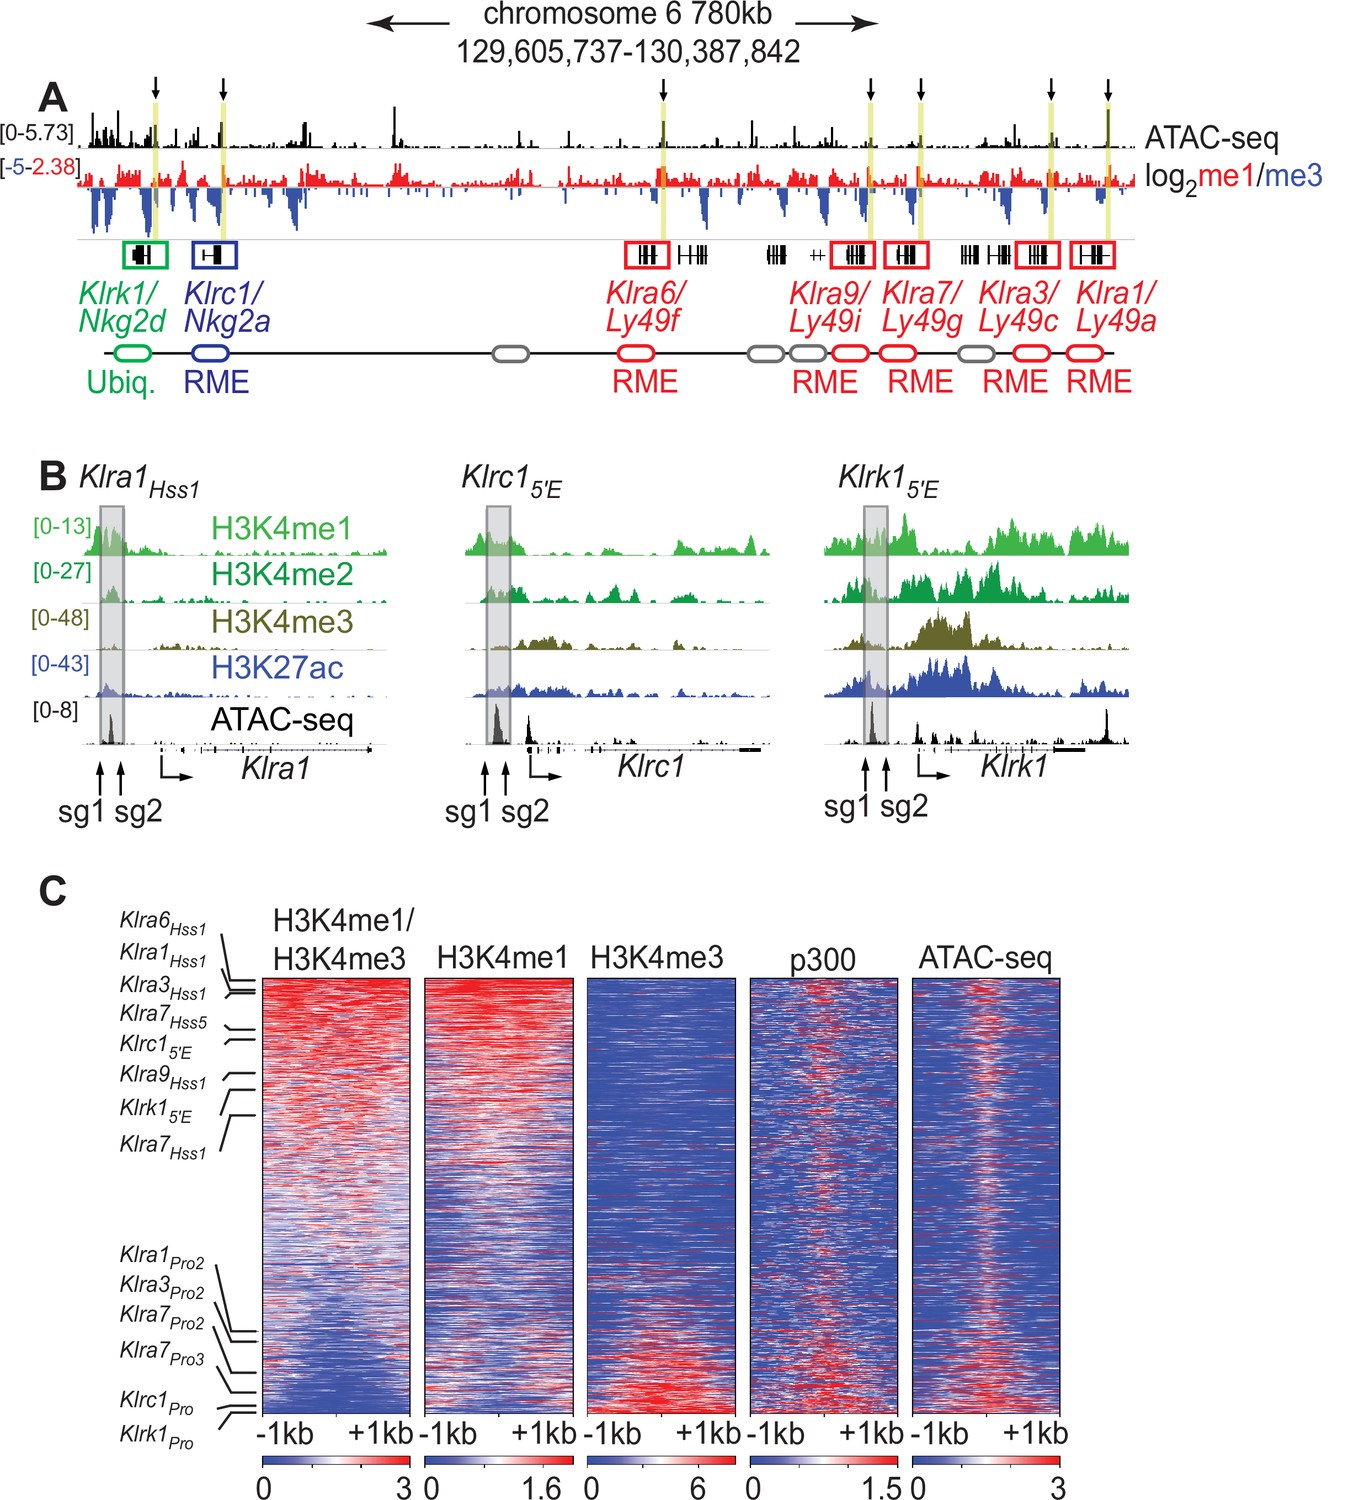
The Klra1Hss 1, Klrc15′E and Klrk15′E elements display chromatin features of enhancers.
(A) ATAC-seq and H3K4me1:me3 log2 ratio ChIP-seq data of relevant NKC genes in primary NK cells; red denotes positive me1:me3 ratios (enhancer-like) while blue indicates negative values (promoter-like). Approximate gene locations are indicated (bottom). Standard gene names (Klr nomenclature) are indicated followed by names derived from the gene products (Ly49 or Nkg2) for reference. Gray ovals represent additional undiscussed Klra genes. Vertical yellow bars and arrows denote the positions of the Hss1 and 5′E enhancers at the indicated genes. Data are sourced from ref (Lara-Astiaso et al., 2014). Normalized data ranges are indicated on the left. (B) Normalized ChIP-seq and ATAC-seq results (sourced from Lara-Astiaso et al., 2014), showing enhancer and promoter histone modifications at Klra1, Klrc1, and Klrk1. Approximate locations of sgRNAs used in this study to delete enhancers are shown. All datasets are presented with the same vertical scale across sub-panels, which are indicated in normalized signal per million reads (SPMR) in the left sub-panel. (C) Heatmaps depict 51,650 ATAC-seq peaks in primary NK cells (excluding peaks ranking in the bottom 5% for either H3K4me1 or H3K4me3) ranked according to H3K4me1:me3 ratio of average ChIP-seq signal calculated over a 2kb window centered on the ATAC-seq peak midpoint. The indicated data are displayed over these peaks in each heatmap. The locations of selected NK receptor gene Hss1, 5′E and promoter elements within the me1:me3 ranking are shown. H3K4 methylation data are sourced from ref (Lara-Astiaso et al., 2014) while p300 is sourced from ref (Sciumè et al., 2020).
Figure 1—figure supplement 1
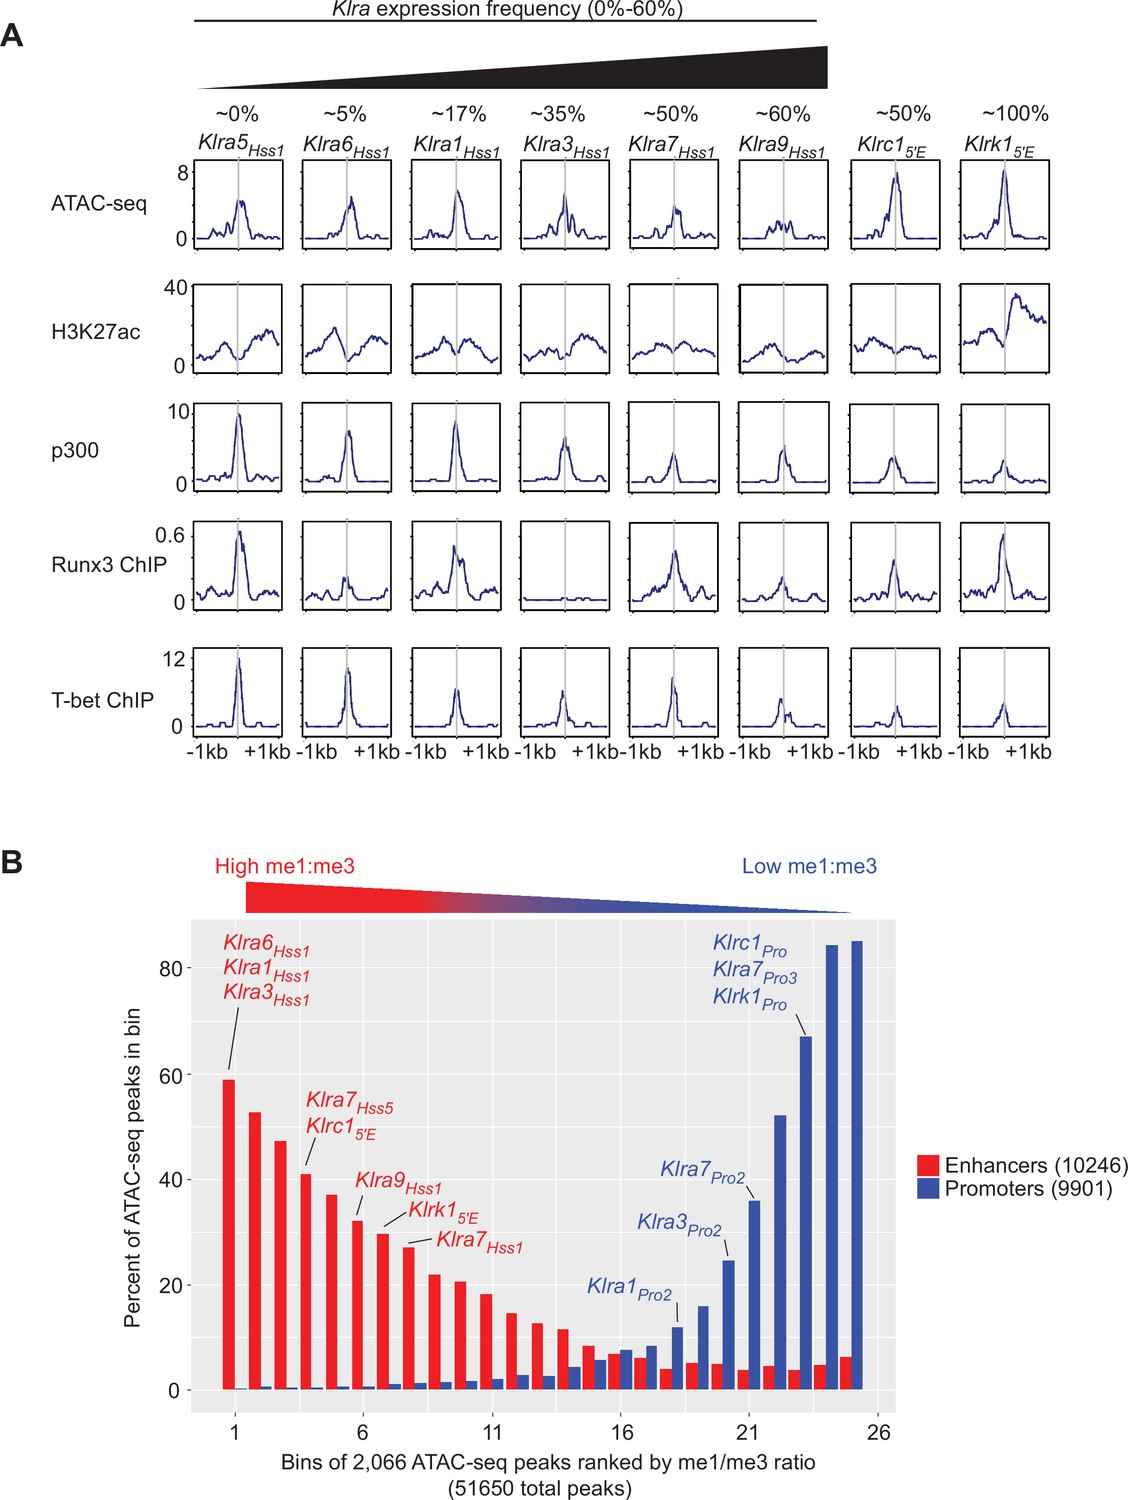
Chromatin features and TF binding profile of the KlraHss1, Klrc15′E, and Klrk15′E enhancers.
(A) Selected Klra genes are depicted left to right according to approximate expression percentages, which are specified above each gene name and are based on historical and published data from our group and others (Coles et al., 2000; Guerra et al., 2008; Joncker et al., 2009; Kubota et al., 1999). The Klrc15′E and Klrk15′E elements are depicted on the right. ATAC-seq and ChIP-seq data profiles are shown over a 2kb window centered at the midpoint of the called ATAC-seq peak. ATAC-seq and H3K27ac are sourced from ref (Lara-Astiaso et al., 2014), p300 data are from ref (Sciumè et al., 2020), Runx3 data are from ref (Levanon et al., 2014) and T-bet data are from ref (Shih et al., 2016). Vertical data values in SPMR for each dataset are indicated on the left-most sub-panel for each row. (B) The H3K4me1 and H3K4me3 ChIP-seq datasets analyzed in Figure 1 from ref (Lara-Astiaso et al., 2014) were used to examine these modifications in 51,560 MACS2-called ATAC-seq peaks in NK cells expressing both Klra7 alleles (Figure 2D). The MACS2-called peaks were first filtered for peaks found in the top 95% of both me1 and me3 signal in NK cells, and then ranked by me1:me3 ratio over a 2kb window as in Figure 1C. The filtered ATAC-seq peaks were then binned in sets of 2,066 peaks according to me1:me3 ratio, with the highest me1:me3 ratio as bin 1. Separately, a total of 9901 NK cell promoters were defined by mouse EPDnew as promoters that overlap with broad H3K27ac peaks called from sourced from ref (Lara-Astiaso et al., 2014), and a total of 10,246 enhancers were defined as ATAC-seq peaks that are enriched in p300 ChIP-seq signal, sourced from ref (Sciumè et al., 2020). Within each bin, the percentage of peaks that overlap with enhancers (red) or promoters (blue) defined in this manner are depicted. Bins that contain ATAC-seq peaks corresponding to key selected NK receptor gene promoters or enhancers are indicated.
Figure 1—figure supplement 2
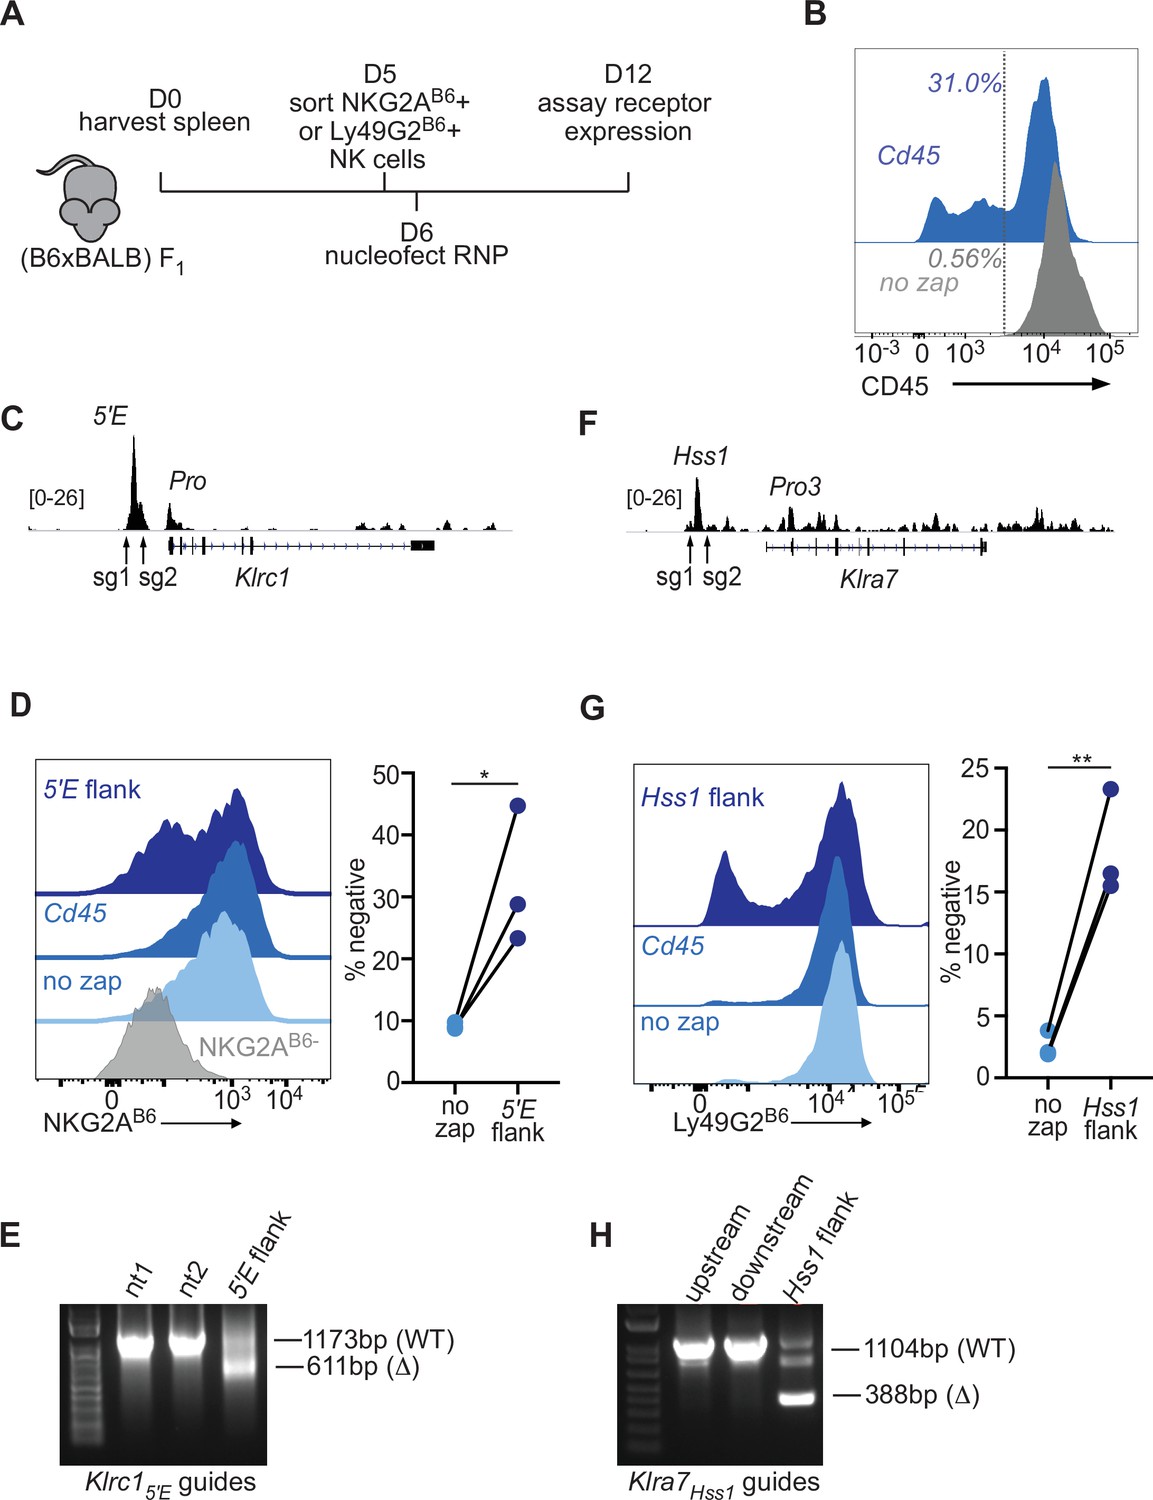
The Klrc15′E and Klra7Hss1 enhancers are required to maintain gene expression in primary NK cells.
(A) Experimental design. (B6 x BALB/c)F1 splenocytes were cultured with IL-2 for 5 days before sorting NK cells positive for NKG2AB6 or Ly49G2B6. After recovery, cells were nucleofected with Cas9-RNP complexed with the indicated sgRNA, or were not treated (“no zap”) before culture and analysis. (B) CD45 staining of IL-2 cultured NK cells isolated from splenocytes using the Mojosort Mouse NK isolation kit from Biologend on day 2 of culture, nucleofected, or not, with an sgRNA to disrupt the Ptprc/Cd45 gene, on day 5 of culture and stained for CD45 expression on day 10 of culture. (C) Location of flanking guide RNAs for deleting Klrc15′E with NK cell ATAC-seq data for reference. The vertical data scale in SPMR is shown. (D) Flow cytometric analysis of NKG2AB6 expression by NK cells on day 12 (6 days after nucleofection with sgRNAs (5’E flank), control CD45 sgRNAs or no treatment). Control cells were sorted to be NKG2AB6-negative on day 6 (grey). Data from three independent experiments are quantified on the right. (E) Deletion test of sgRNAs used to delete Klrc15′E. Agarose gel electrophoresis of PCR amplified fragments from the region surrounding Klrc15′E in cells nucleofected with either non-targeting (nt) guides, or guides flanking Klrc15′E (5’E flank) in IL-2 cultured mouse splenocytes. Amplicon sizes of the WT and Δ bands are depicted. NK cells enriched using the MojoSort Mouse NK cell isolation kit from Biolegend were cultured for 6 days in IL-2 containing media before samples of 1 × 10⁶ cells were nucleofected on day 6. On day 9, gDNA was prepared and used as a template for PCR. (F–G) Flow cytometric analysis of Ly49G2B6 expression in cells nucleofected with Klra7Hss1 sgRNAs, control sgRNAs or no treatment, as in (C–D). Data from three independent experiments are quantified on the right. The groups were compared using ratio paired t-tests. *p < 0.05, **p < 0.01. (H) Deletion test, as in (E) for the sgRNA pair used to delete Klra7Hss1 in comparison to results with only the upstream or downstream sgRNAs.
Figure 2 with 1 supplement
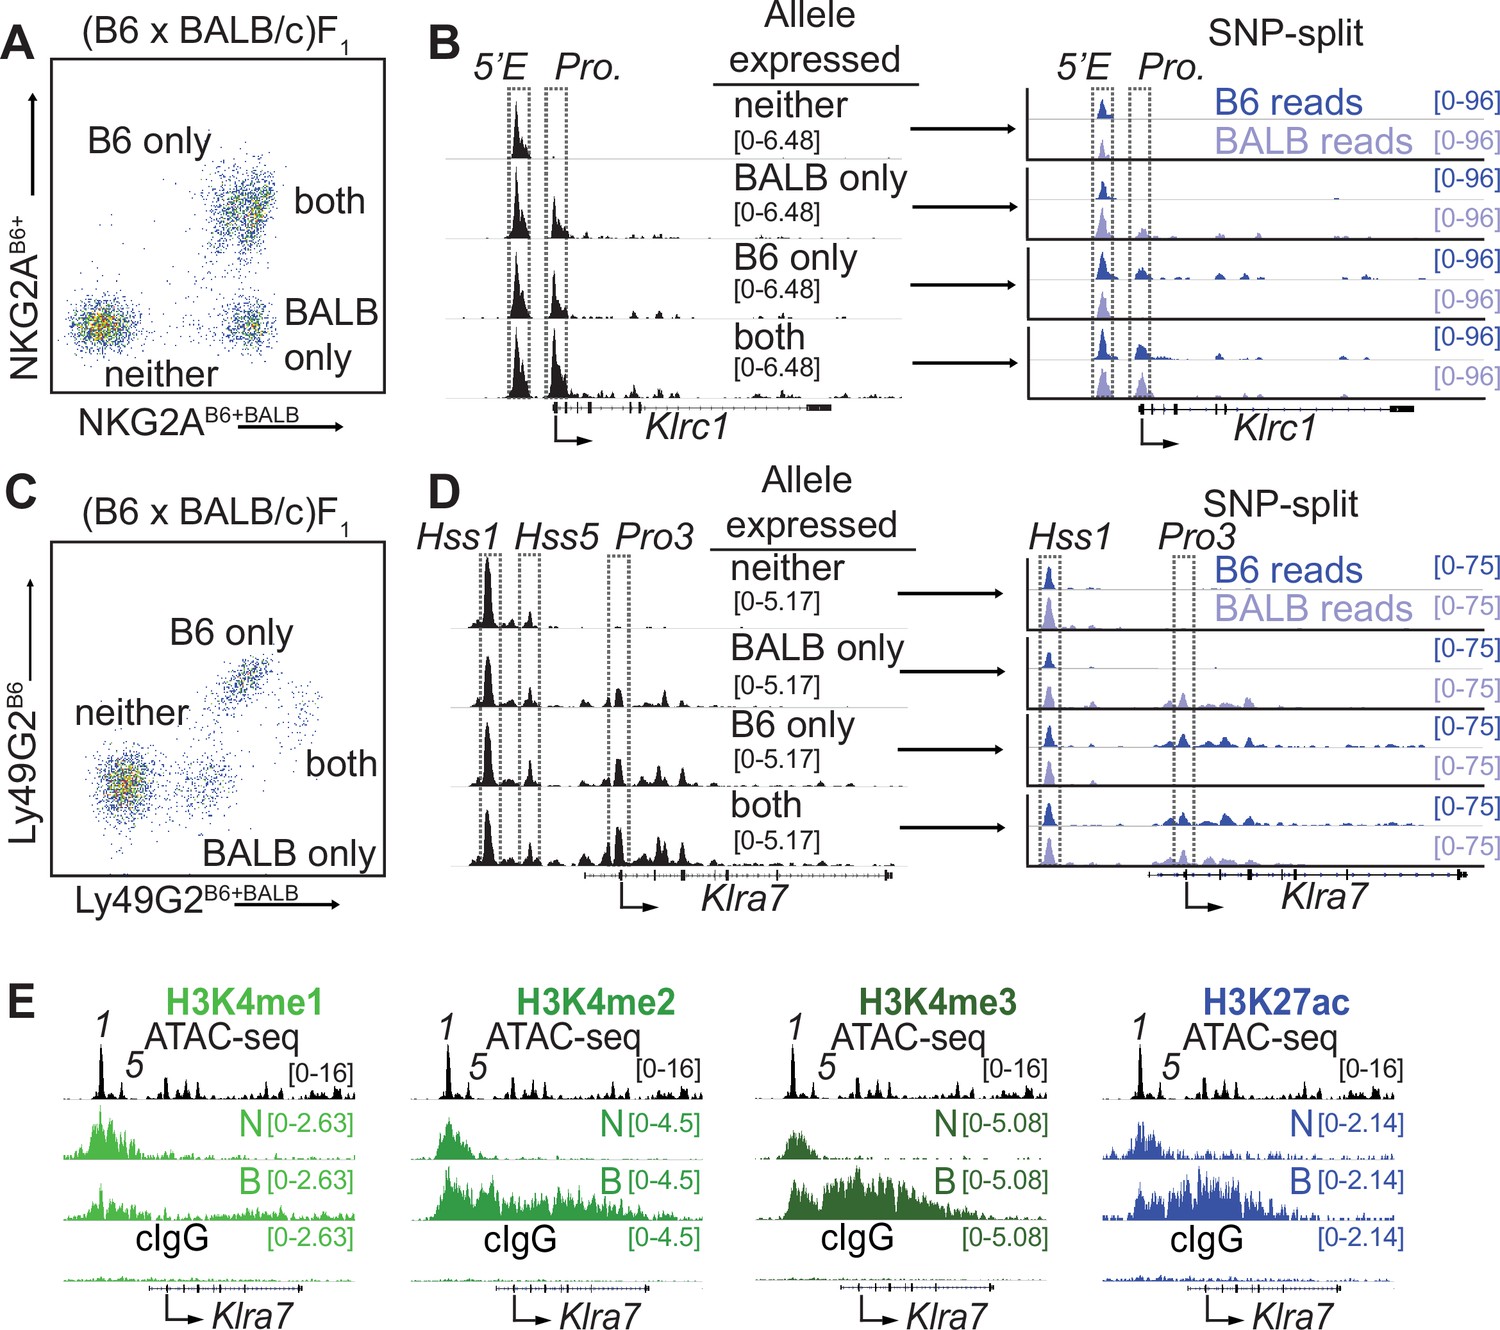
Klrc15′E and Klra7Hss1 are constitutively accessible, while promoters are accessible only at expressed alleles.
(A) FACS plot depicting splenic NK cells from a (B6 x BALB/c)F1 hybrid mouse stained with allele-specific antibodies, allowing separation of NK cells expressing both, either, or neither NKG2A allele. (B) (left) Normalized ATAC-seq data generated from the 4 cell populations depicted in (A) aligned to the mm10 reference genome. (right) Allele-informative reads were binned according to chromosome of origin, and displayed as signal mapping to the B6 or BALB/c chromosome. The Klrc15′E enhancer and promoter (Pro.) are boxed (dotted line). Vertical data range in SPMR is indicated for each track. (C and D) Data are as in (A and B), but using an allele-specific staining protocol with respect to the Ly49G2 receptor. Klra7Hss1, Klra7Hss5 and the dominant TSS (Pro3, Gays et al., 2011) are boxed. (E) CUT&RUN data depicting each of 4 indicated histone modifications at the Klra7 gene in IL-2 expanded NK cells sorted to express neither ‘N’ or both ‘B’ alleles of Klra7. Negative control CUT&RUN data were generated using a mouse IgG2aκ (cIgG) antibody, and a 50:50 mixture of IL-2 expanded NK cells that expressed the B6 or BALB/c alleles. These data are displayed in the bottom track in each sub-panel. The ATAC-seq patterns are shown for reference above each analysis; Klra7Hss1 is denoted as ‘1’, Klra7Hss5 is denoted as ‘5’. Arrows depict the locations of the dominant Pro3 TSS. All ATAC-seq and CUT&RUN data within a sub-panel are presented with the same vertical scale.
Figure 2—figure supplement 1
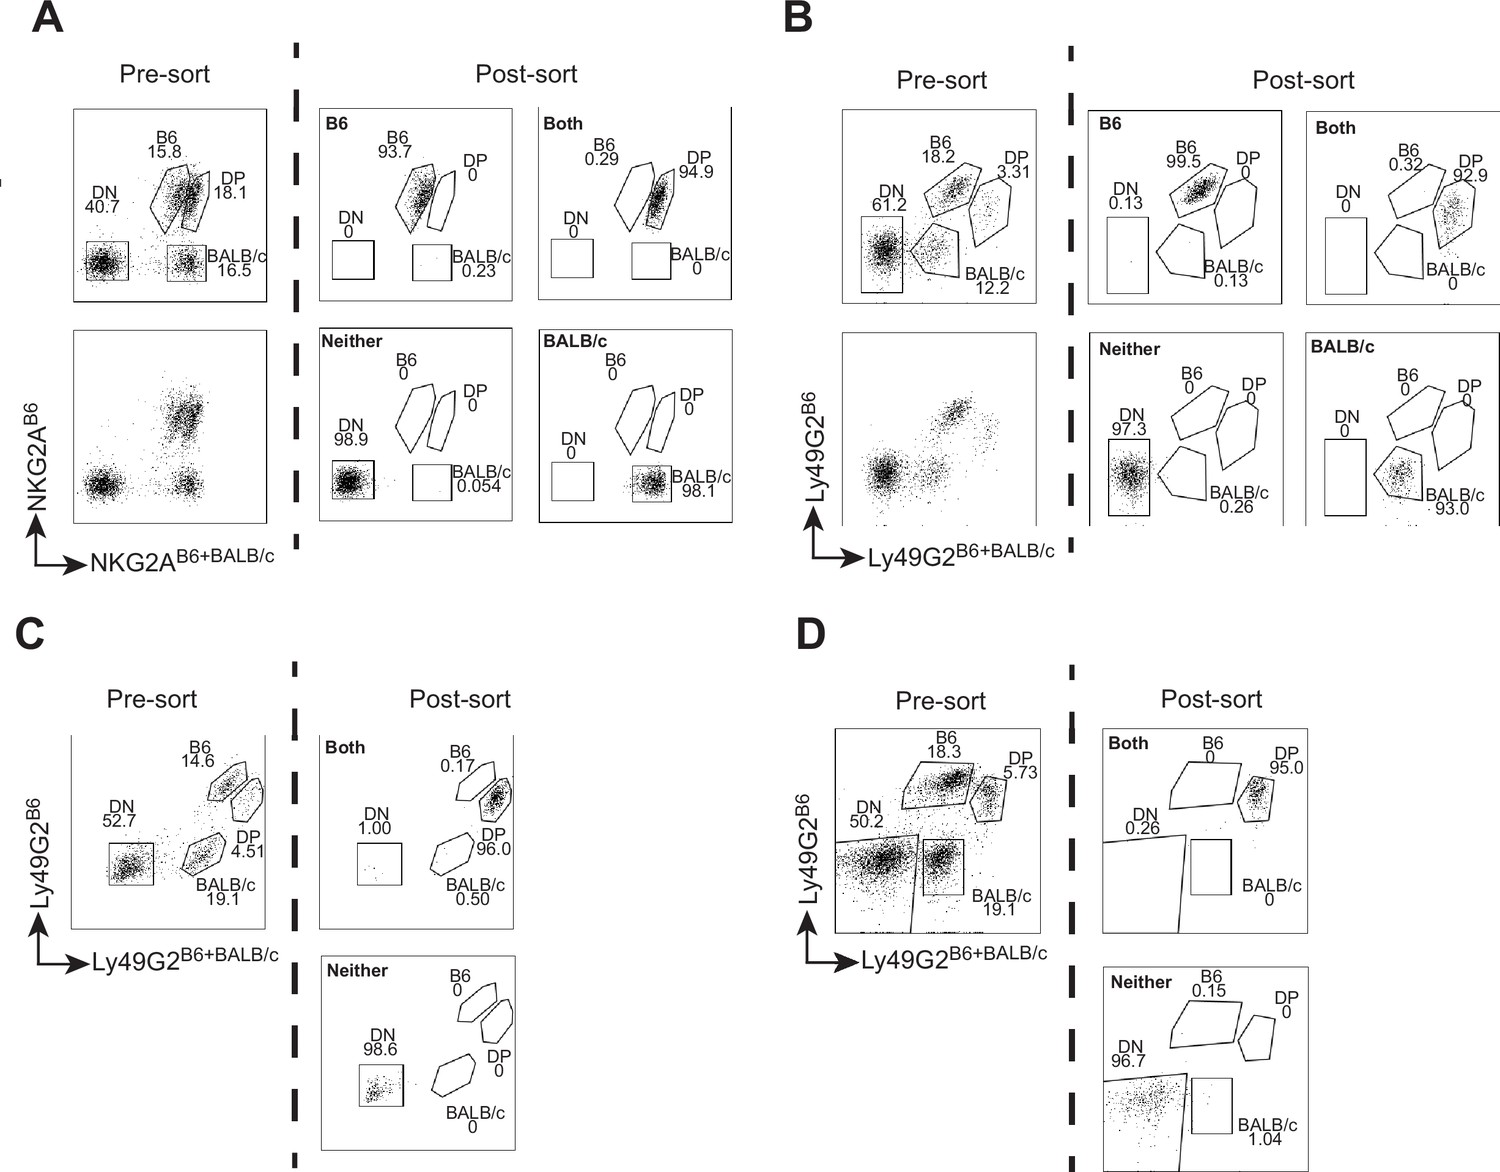
Post-sort analysis of sorted NK cell populations used for ATAC-seq and CUT&RUN analysis.
(A) Flow cytometric analysis of freshly isolated splenic NK cells from (B6 x BALB/c)F1 hybrid mice before (left) and after (right) sorting according to NKG2A allelic expression status. The sorted cells were used in the ATAC-seq analysis presented in Figure 2B. The plot shown on the left is replicated from Figure 2A for ease of reference, and is shown both with and without gates drawn. Population frequencies are depicted next to each gated population. The same gates are applied to the post-sort samples. (B) Data are displayed as in (A), depicting NK cells sorted according to Ly49G2 allelic expression status and used for the ATAC-seq analysis displayed in Figure 2D. The pre-sort data on the left are duplicated from Figure 2C for ease of reference, and are shown with and without gates and population frequencies. (C) Pre and post-sort population analysis of IL-2 expanded (B6 x BALB/c)F1 hybrid NK cells sorted with respect to Ly49G2 allelic expression status used in CUT&RUN analysis of H3K4me1/2/3 displayed in Figure 2E. (D) Data are shown as in (C) for cells used for CUT&RUN analysis of H3K27ac displayed in Figure 2E.
Figure 3 with 2 supplements
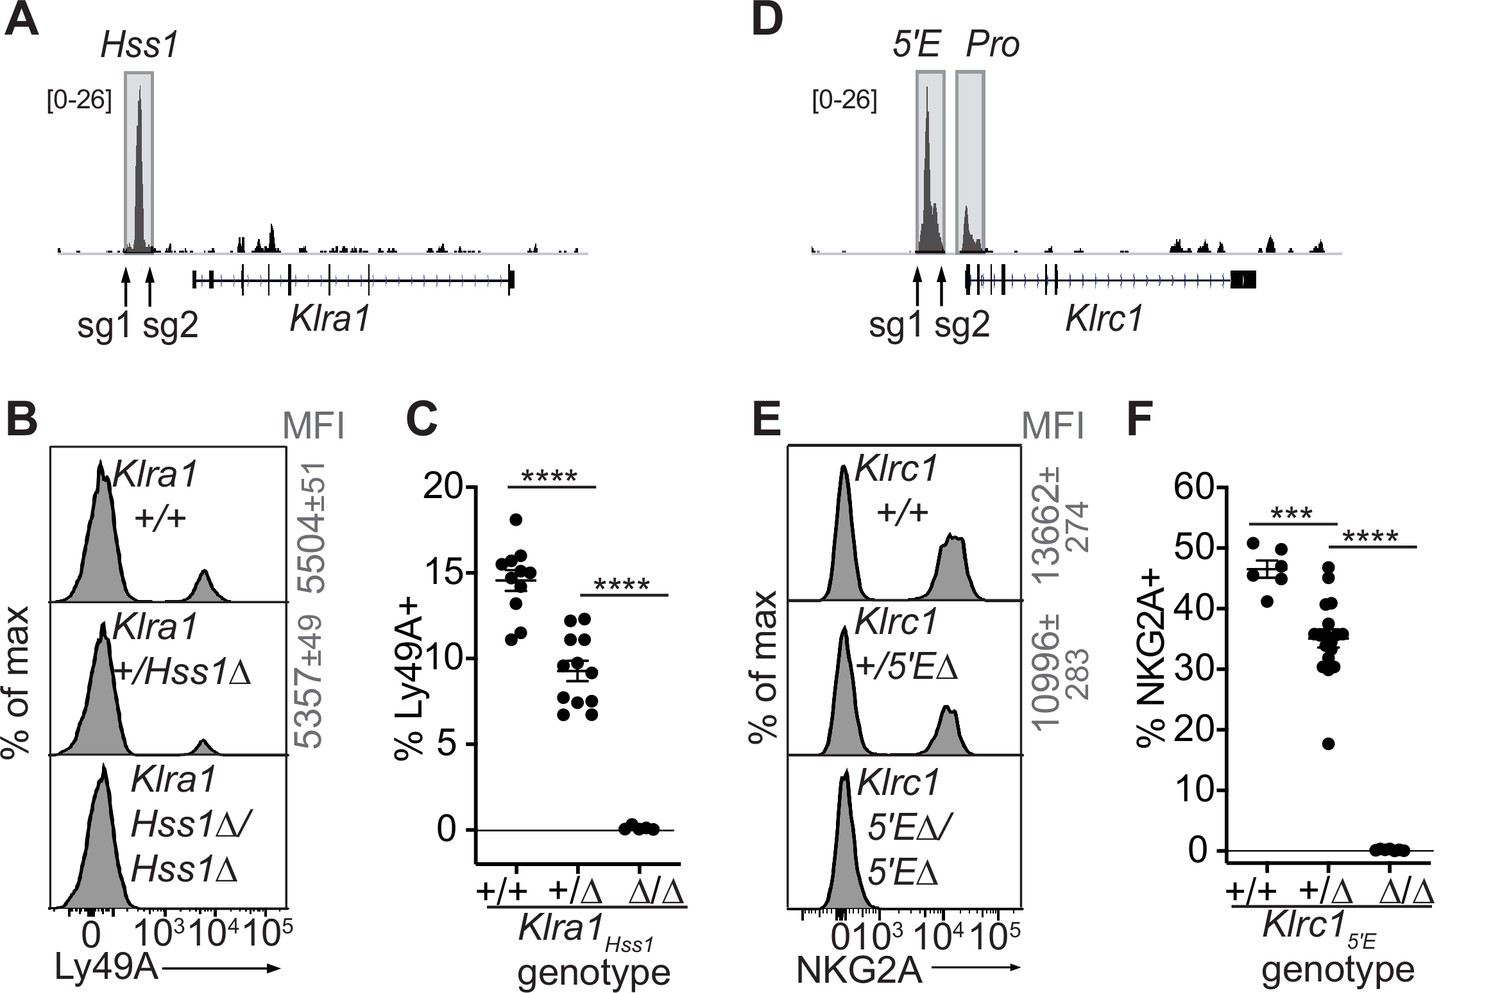
The Klra1Hss1 and Klrc15′E enhancers are required for gene expression.
(A) Locations of sgRNAs used to delete Klra1Hss1 in the B6 germline; NK cell ATAC-seq are displayed for reference with the vertical data scale in SPMR indicated. (B–C) Ly49A staining of the indicated Klra1Hss1 deletion littermates. MFI of staining ± SEM are depicted in gray. In (C), data are combined from two independent experiments (means ± SEMs, n = 5–12). (D–F) Data as in (A–C) for Klrc15′E. Data in (F) are combined from two experiments with the Klrc15′E(B3Δ) allele (Figure 3—figure supplement 1C) and were recapitulated in analysis of the B1Δ allele (means ± SEMs, n = 6–18). ****p < 0.0001; ***p < 0.0001 using one-way ANOVAs with Tukey’s multiple comparisons.
Figure 3—figure supplement 1
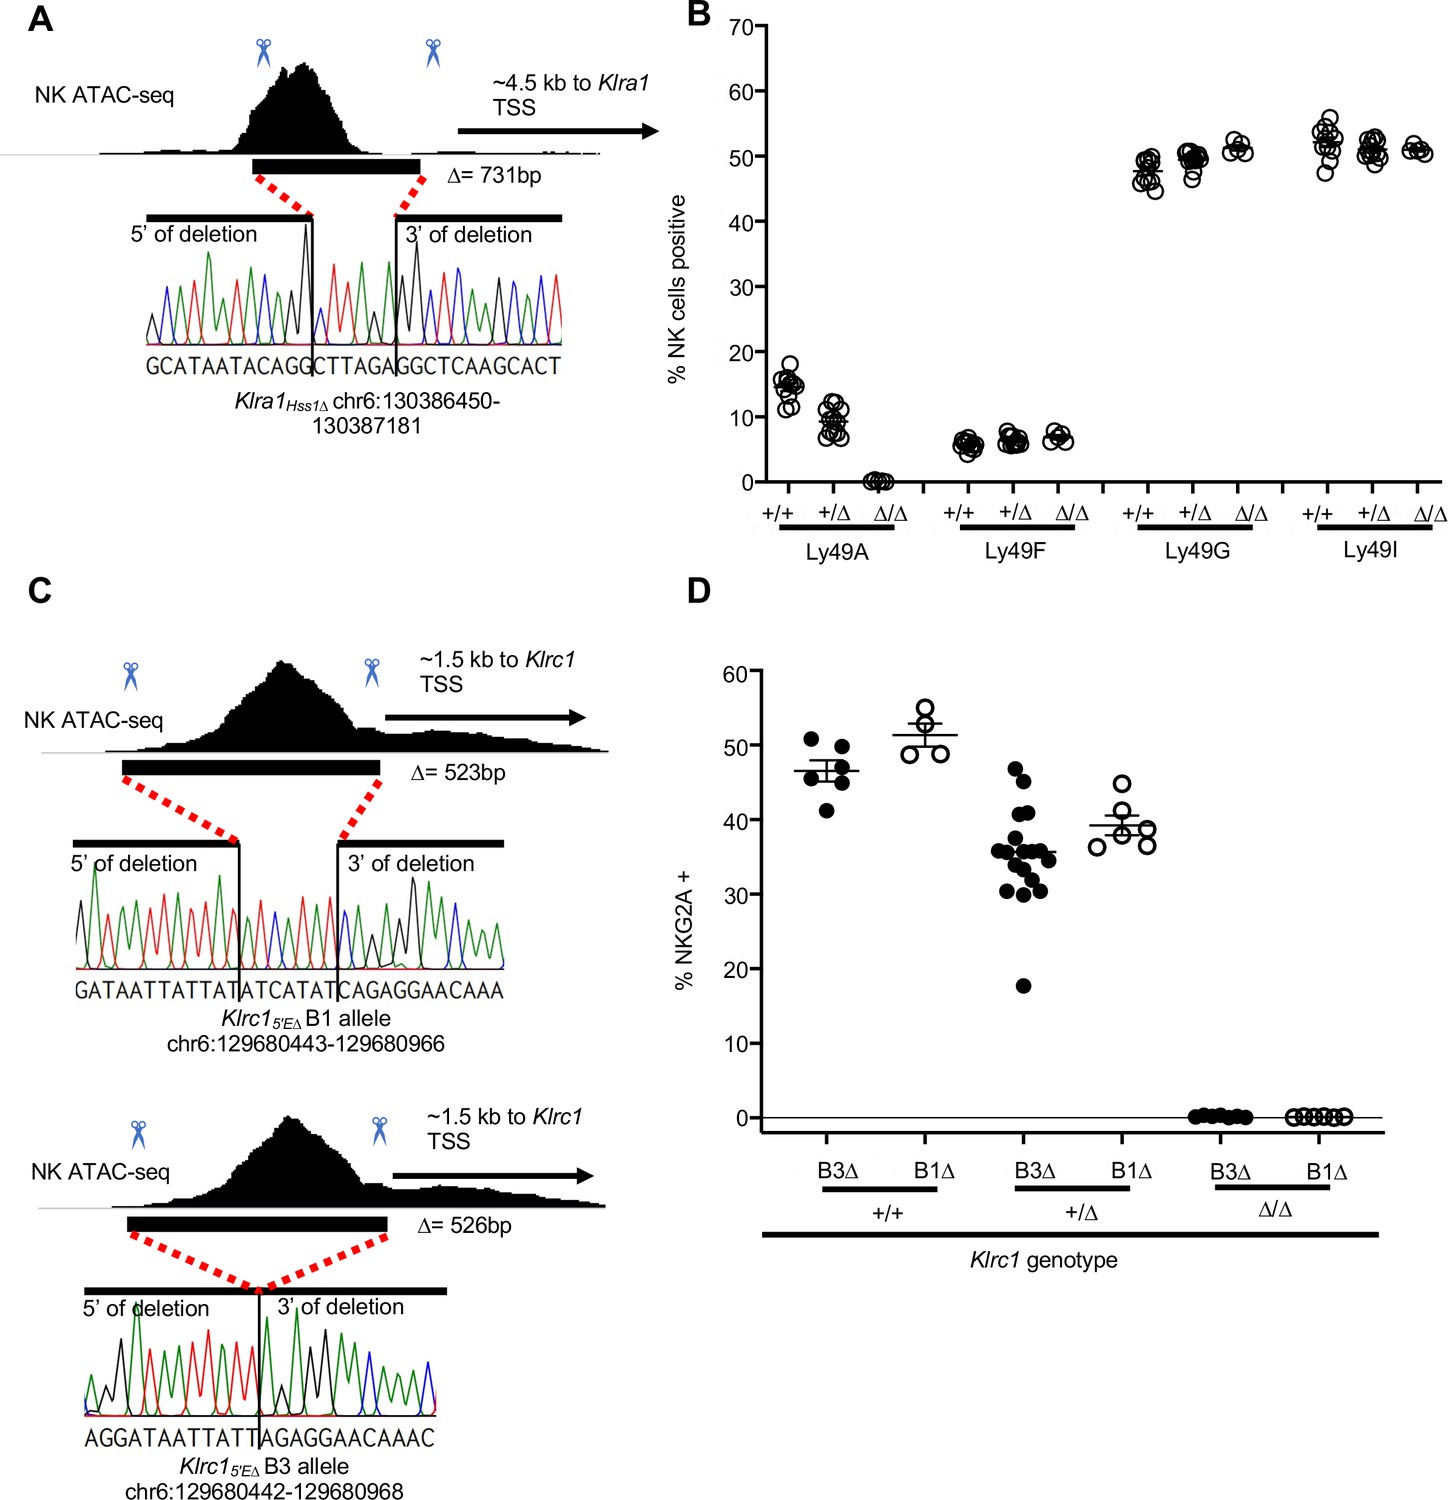
Klra1Hss1Δ and Klrc15′EΔ alleles employed in the study.
(A) Genomic position and sequence of the Klra1Hss1Δ allele analyzed in this study. The black bar shows the location of the CRISPR/Cas9 generated in/del based on Sanger sequencing of a PCR amplicon spanning the region. (B) Percentages of cells expressing indicated Ly49 receptors in Klra1Hss1Δ/Hss1Δ mice, heterozygous and wildtype littermates, from flow cytometry analyses. Data are combined from two independent experiments, n = 5–12. Data for Ly49A are replicated from Figure 3C for ease of reference. (C) Two Klrc15′EΔ alleles generated and analyzed in this study, as in panel (A). (D) Percentages of cells expressing NKG2A in mice with the genotypes shown. Data are combined from two independent experiments with the Klrc15′E-B3Δ allele (replicated from Figure 3F for ease of reference), and one experiment with the Klrc15′E-B1Δ allele.
Figure 3—figure supplement 2
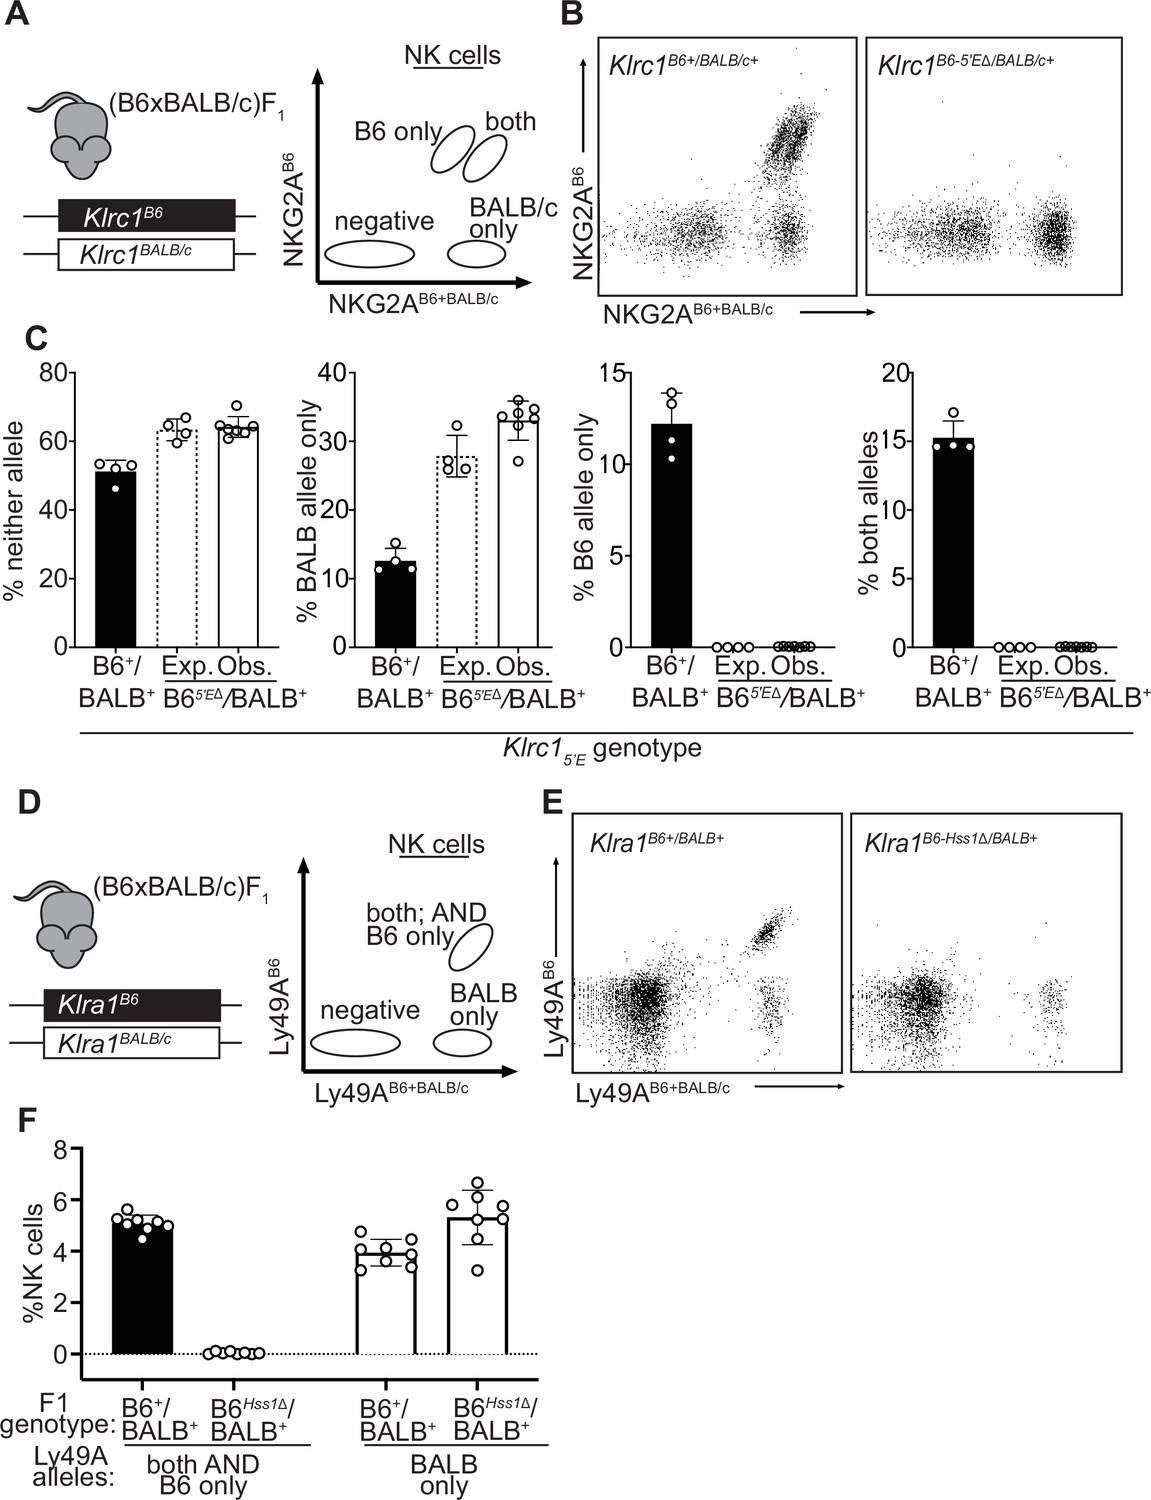
The constitutively accessible Klrc15′E and Klra1Hss1 enhancers act entirely in cis.
(A) Schematic of (B6 x BALB/c)F1 hybrid NK cell staining pattern using 16a11 (NKG2AB6 reactive) and 20d5 (NKG2AB6+BALB/c reactive) antibodies. (B) Representative dot plots displaying staining of (B6 x BALB/c)F1 hybrid splenic NK cells using 16a11 and 20d5 (n = 4–7). (C) Expected (dotted bar) and observed (solid white bar) percentages of populations in Klrc1B6-5′EΔ/BALB/c-5′E+ mice, compared to wildtype littermate (B6 x BALB/c)F1 hybrid mice (black bar). Expected frequencies are calculated assuming stochastic cis regulation of alleles (detailed in Materials and methods). Data are representative of two independent experiments. (D) Schematic of (B6 x BALB/c)F1 NK cell staining pattern using A1 (Ly49AB6 reactive) and JR9 (Ly49AB6+BALB/c reactive) antibodies. (E) Representative dot plots displaying (B6 x BALB/c)F1 hybrid NK cells using A1 and JR9. (F) Percentages of NK cells expressing the indicated Ly49A alleles; data are combined from two independent experiments (n = 8–9). Error bars in all panels denote SEM.
Figure 4 with 1 supplement
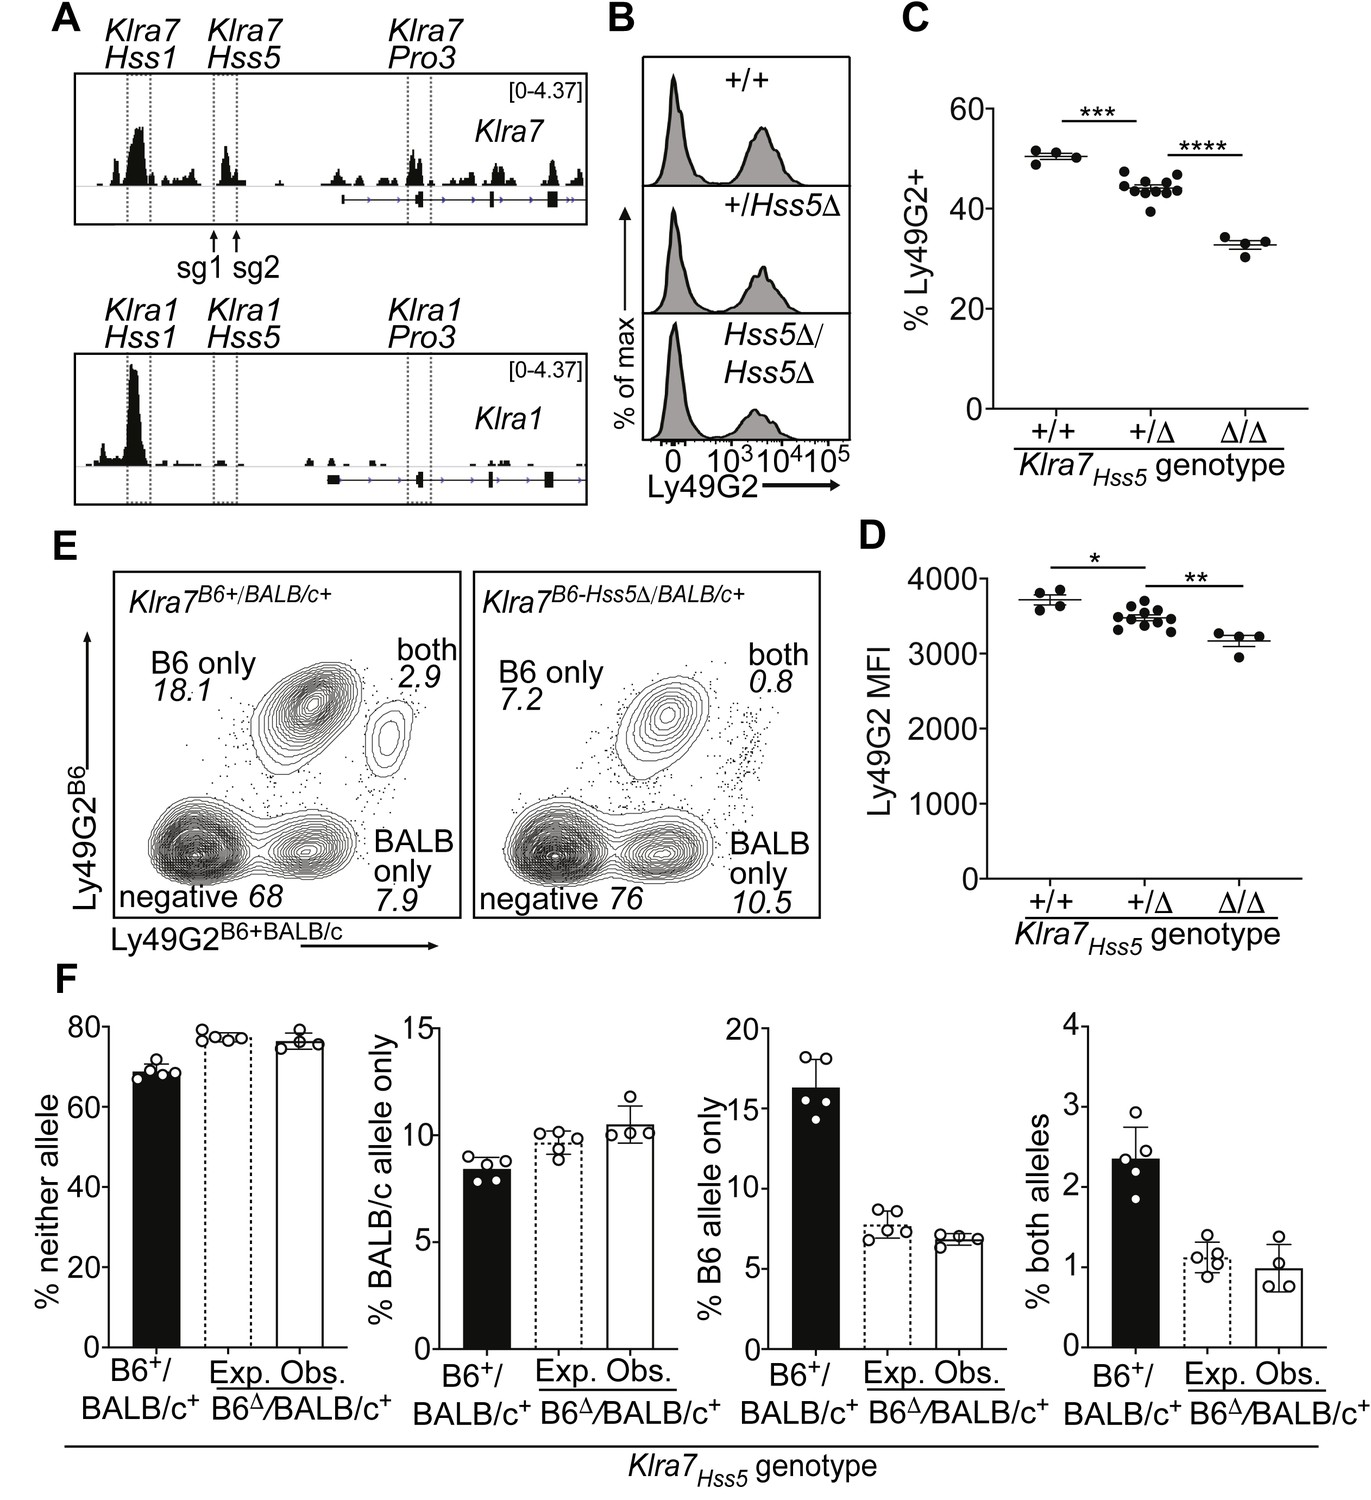
A minor cis-acting enhancer amplifies Ly49G2 expression frequency.
(A) Normalized ATAC-seq tracks of Klra1 and Klra7 in bulk NK cells; the vertical data range in SPMR is displayed on each track. Hss1 and Hss5 enhancers and the Pro3 promoter are highlighted. sgRNAs used to generate Klra7Hss5Δ alleles are shown (arrows). (B) Ly49G2 staining of NK cells in the indicated Klra7Hss5 deletion littermates (B2Δ allele, Figure 4—figure supplement 1A). (C–D) Ly49G2 percentages (C), and mean fluorescence intensities of the positive populations (D) (n = 4–11). Similar results were obtained with the B1Δ allele (Figure 4—figure supplement 1B). (*p < 0.05; **p < 0.01; ***p < 0.001; ****p < 0.0001 using One-way ANOVA with Tukey’s multiple comparisons). (E) Flow cytometry plots of gated Klra7B6-Hss5Δ/BALB/c+ NK cells using Ly49G2B6-specific and Ly49G2B6+BALB/c-specific antibodies (right) and a wildtype littermate (left). (F) Expected and observed percentages of populations depicted in ‘E’ in F1 mice with the Klra7Hss5Δ (hatched bar is expected, white bar is observed) or wildtype (black) Klra7 allele. Expected frequencies were calculated assuming stochastic cis regulation of alleles (see Materials and methods; note effect of genetic background). Data are representative of two experiments. All error bars represent SEM.
Figure 4—figure supplement 1
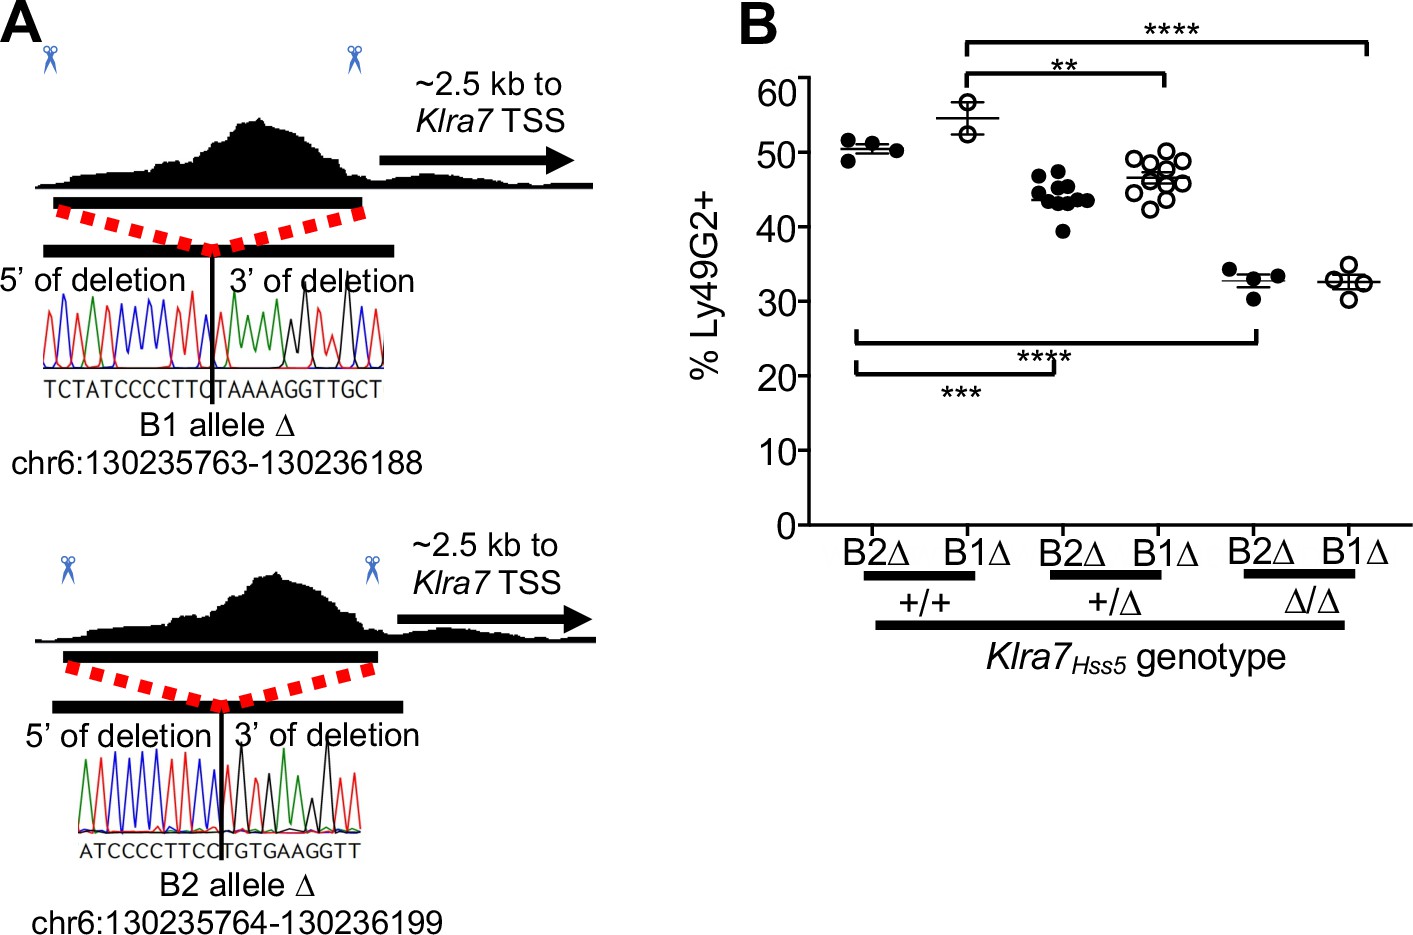
Klra7Hss5Δ alleles employed in this study.
(A) Genomic position and sequences of Klra7Hss5Δ alleles as in Figure 3—figure supplement 1A. (B) Percentages of cells expressing Ly49G2 in mice with the indicated genotypes, comparing one experiment each with the two alleles (Klra7Hss5 -B1Δ and Klra7Hss5-B2Δ). Klra7Hss5-B2Δ data are replicated from Figure 4D for ease of reference. Klra7Hss5 -B1Δ groups consist of n = 2–11mice. **p < 0.01; ***p < 0.001; ****p < 0.0001 computed by a one-way ANOVAs with Tukey’s multiple comparisons.
Figure 5 with 2 supplements
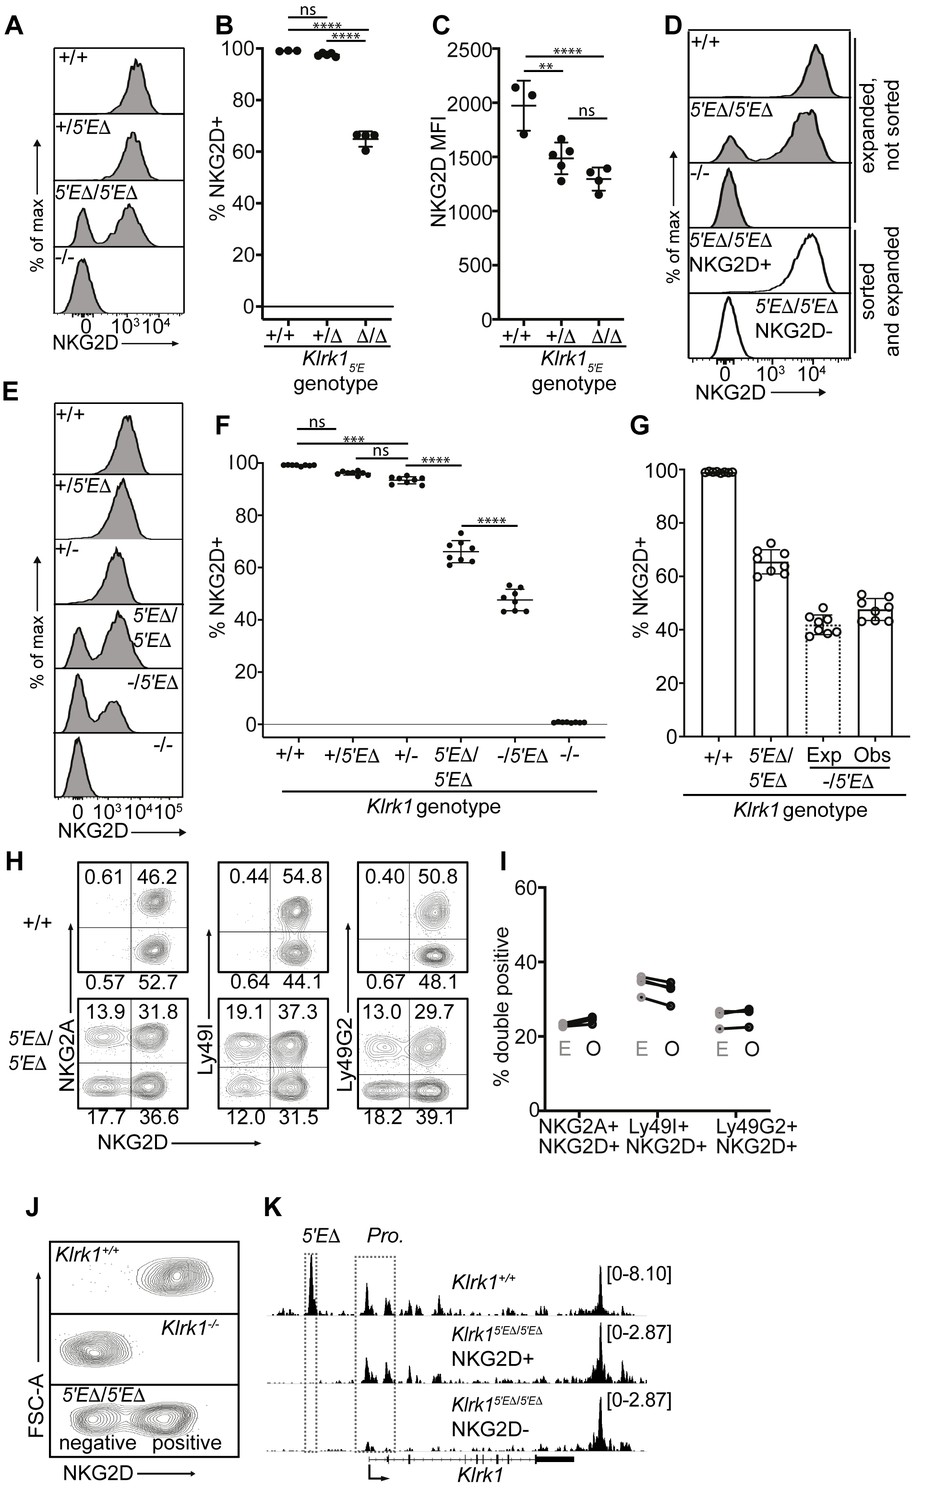
Klrk15′E deletion results in mitotically stable RME, fully recapitulating natural variegation.
(A–C) NKG2D staining of splenocytes from Klrk15′E deletion littermates (B1Δ allele), and an Klrk1-/- mouse (n = 3–5). Results are representative of four experiments with two deletion alleles (Figure 4—figure supplement 1, C and D). (D) Splenocytes from Klrk15′EΔ/5′EΔ mice were cultured with IL-2 for 2–3 days before sorting NKG2D+ and NKG2D- NK cells, which were expanded in fresh IL-2 medium for 8–10 days before analysis (white fill). Expanded, unsorted NK cells are shown in gray. (E) Staining of splenic NK cells from mice of six genotypes. “+”, “-” and “Δ” refer to wildtype, gene knockout, and Klrk15′E deletion alleles, respectively. (F) Quantified results in (E) compiled from two experiments. (G) Expected and observed percentages of NKG2D+ NKcells in Klrk1-/5′EΔ mice. Expected expression is calculated based on observed NKG2D+ percentages in Klrk15′EΔ/5′EΔ mice, assuming stochastic expression (see Materials and methods). Data are comprised of selected groups displayed in (G). (H) Stochastic co-expression of NKG2D and NKG2A, Ly49I or Ly49G by NKp46+ NKcells in Klrk15′EΔ/5′EΔ mice. WT (+/+) mice are shown for comparison. (I) Expected (‘E’) and observed (‘O’) percentages of cells coexpressing the indicated receptors in Klrk15′EΔ/5′EΔ mice. Expected percentages were calculated by mutiplying percentages of cells in each mouse expressing each receptor individually (n = 4). Data are representative of two experiments. (J) NKG2D staining of presorted gated NK cells from Klrk15′EΔ/5′EΔ mice (bottom), compared to wildtype and Klrk1-/- NK cells. (K) Normalized ATAC-seq tracks generated from NKG2D+ and NKG2D- cells sorted from the Klrk15′EΔ/5′EΔ mouse shown in (J) and are presented on the same vertical scale. ATAC-seq results for WT splenic NK cells were sourced from Lara-Astiaso et al., 2014 and auto-scaled to match the data generated from the Klrk15′EΔ/5′EΔ mouse. Vertical data scale in SPMR is displayed for each track. Error bars represent SEM. **p < 0.01; ***p < 0.001; ****p < 0.0001, computed using One-way ANOVAs with Tukey’s multiple comparisons.
Figure 5—figure supplement 1
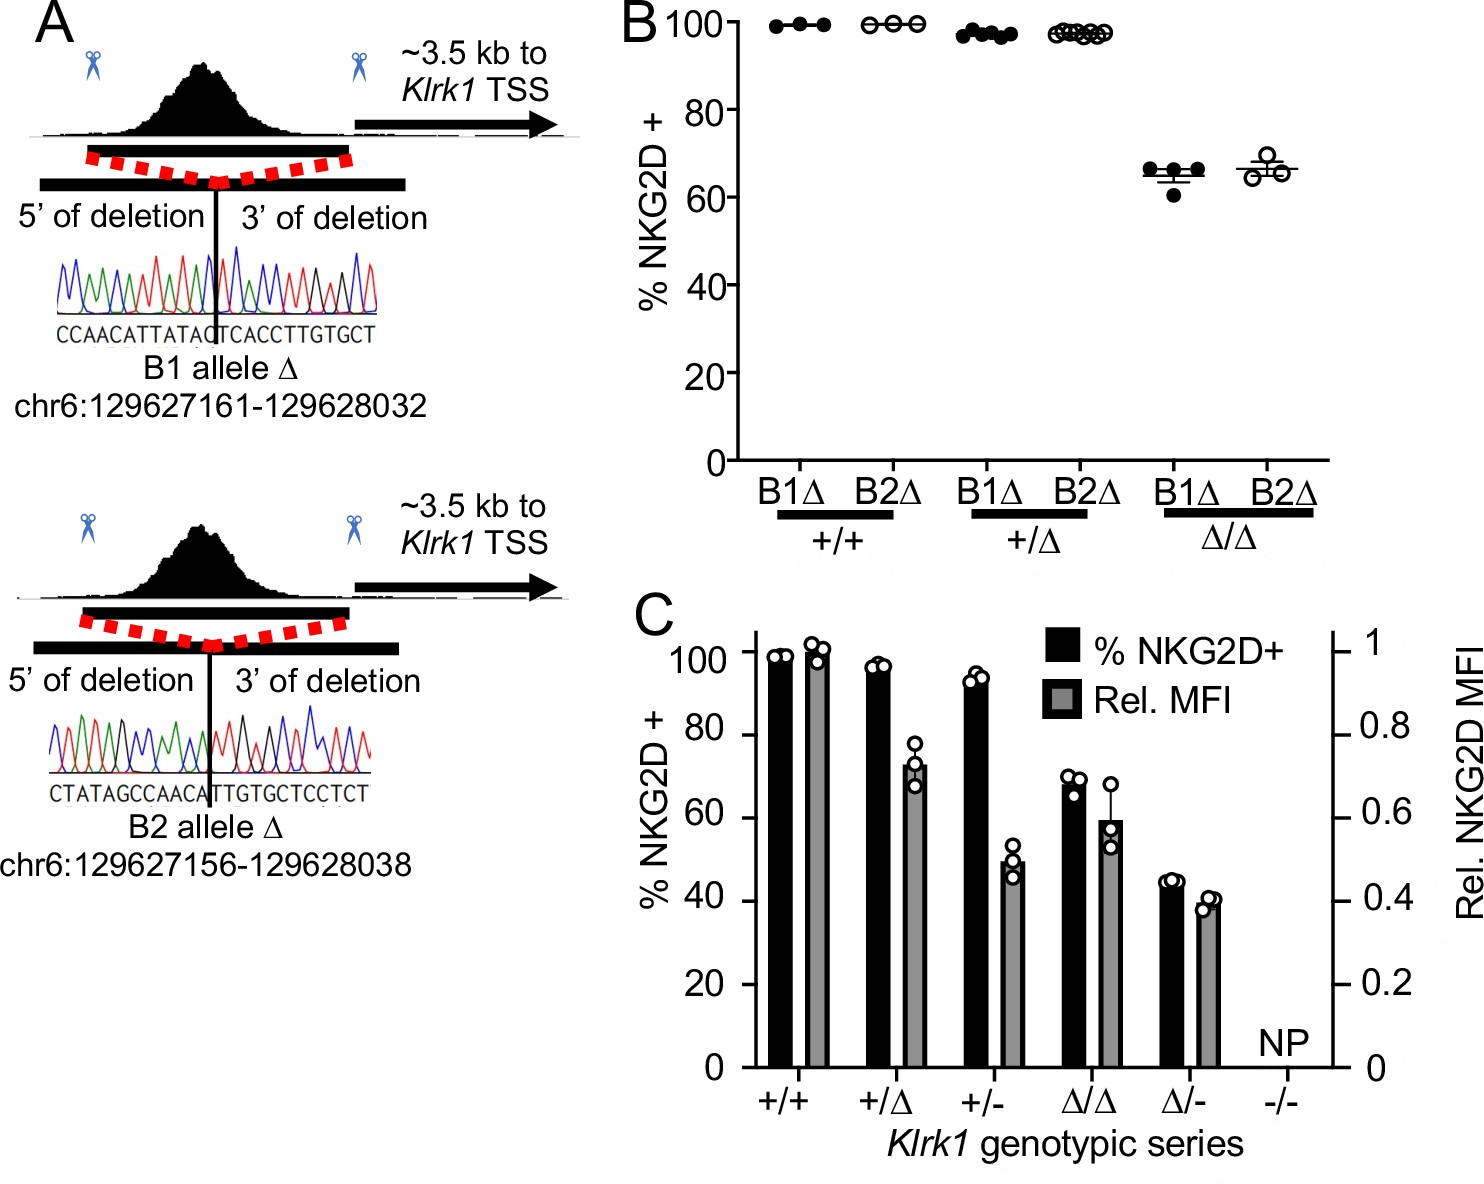
Klrk15′EΔ alleles employed in this study.
(A) Genomic position and sequences of Nkg2d5’EΔ alleles (see Figure 3—figure supplement 1A legend for details). (B) Percentages of NKG2D+ cells in mice with the indicated Klrk1 genotypes, depicting one experiment each with the B1Δ and B2Δ alleles. B1Δ allele data are replicated from Figure 5B for ease of reference. (C) Comparison of percentages of % NKG2D+ NKcells (left y-axis) and mean staining intensity of NKG2D staining (normalized to +/+ mice, right y-axis) from mice with the indicated Klrk1 genotypes. Data are representative of two independent experiments.
Figure 5—figure supplement 2
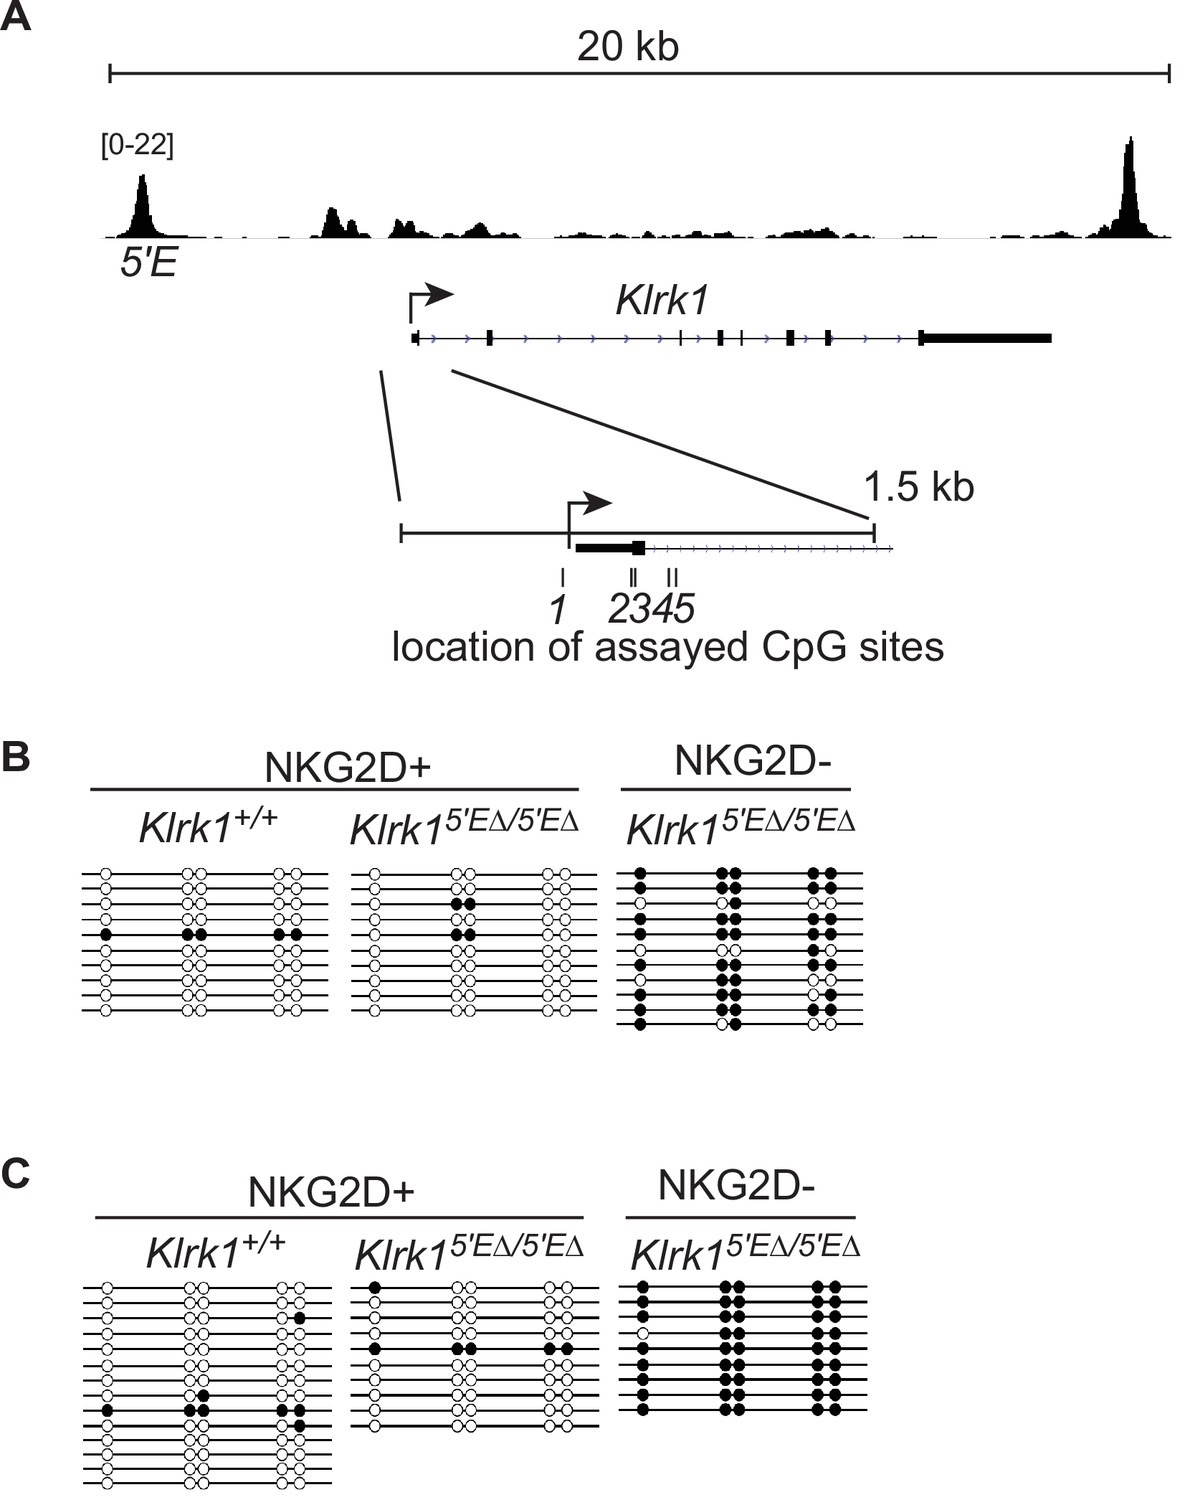
The Klrk1 promoter is CpG methylated at silent alleles in Klrk15′EΔ/5′EΔ NK cells.
(A) Representation of the Klrk1 locus on chromosome 6. NK cell ATAC-seq data provide a reference for the location of the promoter and 5′E; the vertical data range in SPMR is displayed. The inset highlights the promoter region (indicated by the arrow), first exon (thick bar represents 5’ UTR, thicker bar denotes coding sequence), and the approximate locations of 5 CpG sites surrounding the promoter that were assayed by bisulfite conversion and Sanger sequencing of PCR clones. (B) The methylation status of each of the 5 CpG sites in sorted freshly isolated splenic NK cells from mice of the indicated genotypes and NKG2D expression status are shown (white circles represent an unmethylated CpG; black circles represent methylation), and each line represents a single sequenced PCR clone. (C) As in panel B except the sorted NK cells populations were expanded in IL-2-containing medium for 8 days before analysis.
Figure 6 with 1 supplement
Silent NK receptor gene alleles resemble inactive genes expressed in non-NK lineages, rather than repressed genes.
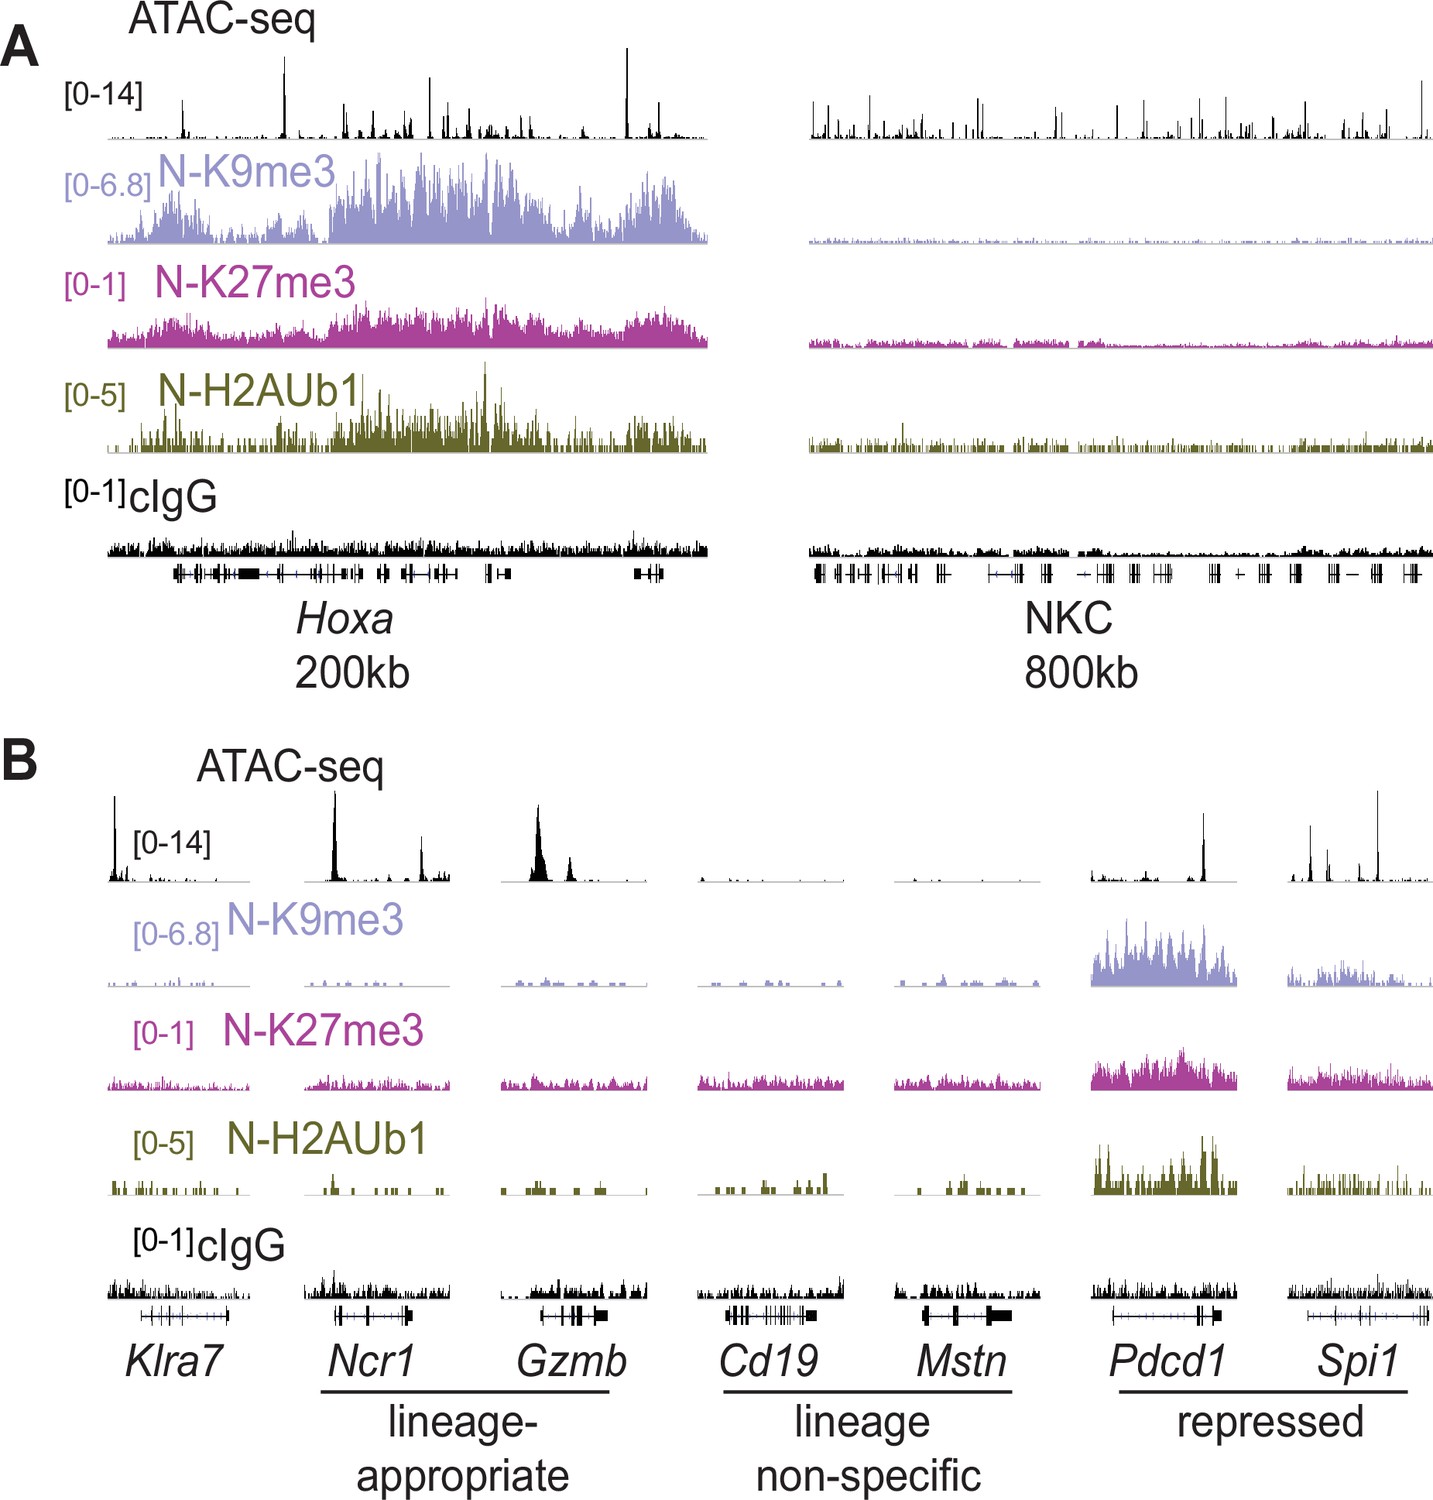
(A) Repressive histone modification CUT&RUN data generated with primary IL-2 expanded NK cells sorted to express neither allele of Ly49G2 (‘N’ cells). IGV screenshots depicting the indicated histone modification or analyses with control mouse IgG2aκ (cIgG), which binds protein A. The Hoxa gene cluster (left) serves as a positive control. The entire NKC gene cluster is displayed on the right. The vertical scales in SPMR, indicated on the left of the panels, were matched for each type of mark for all samples analyzed and were chosen to provide strong signals for the positive control Hoxa cluster. The cIgG data were scaled the same as the H3K27me3 data, which had the weakest signal of the marks analyzed. (B) Data are displayed as in (A), at Klra7 (left), and gene loci belonging to the following classes: NK cell lineage-appropriate, NK cell lineage non-specific, and loci repressed in NK cells.
Figure 6—figure supplement 1
Chromatin state analysis of NK cells expressing neither (N) allele or both (B) alleles of Ly49G2.
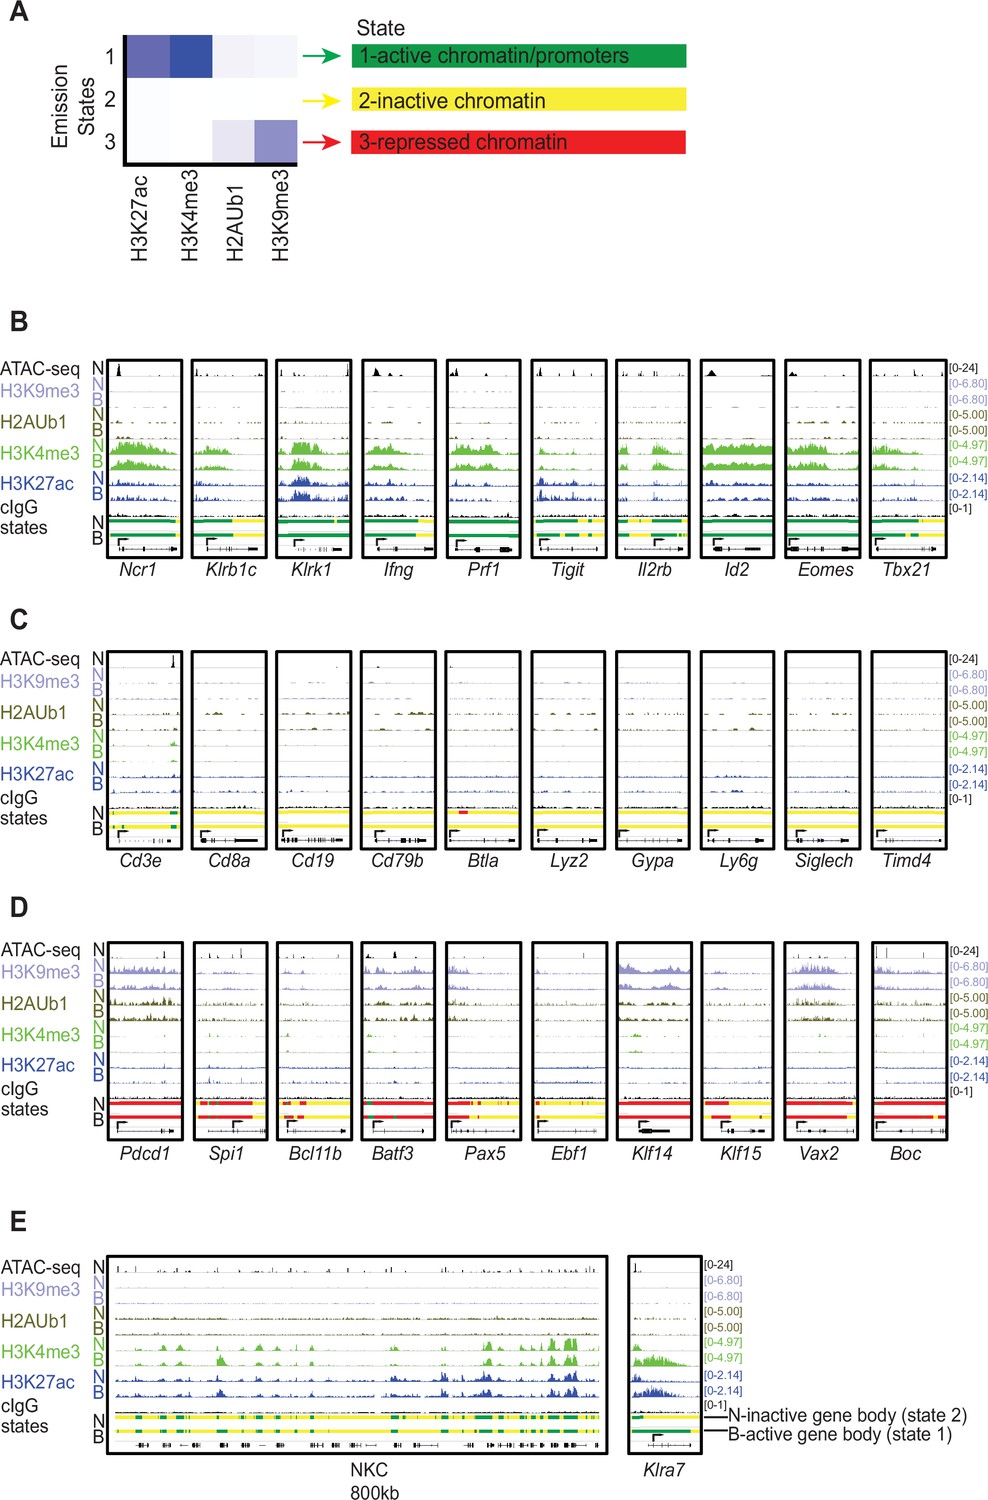
(A) Emission chromatin states determined by ChromHMM (Ernst and Kellis, 2012) in a 3 state model, based on active (H3K27ac and H3K4me3) and repressive (H2AUb1 and H3K9me3) chromatin modifications in the two NK cell populations, from CUT&RUN analyses. The vertical scale is the same for all panels. State 1 (green), defined by active modifications, is denoted ‘active chromatin’. State 2 (yellow) lacks both active and repressive marks and is denoted ‘inactive chromatin’. State 3 (red) is defined by repressive modifications and is denoted ‘repressed chromatin’. (B) IGV screenshots depicting the modifications and, at the bottom of each panel, the color-coded chromatin states of selected genes characteristically expressed by NK cells, including lineage-specific receptors, effector molecules, and transcription factors. For each modification and state, results with cells expressing neither (‘N’) Ly49G2 allele, or both (‘B’) are shown. (C) Data as in (B), except depicting selected genes encoding cell surface receptors emblematic of non-NK cell hematopoietic lineages. (D) Data as in (B–C), except depicting select genes expressed in non-NK cells lineages that exhibit state 3 or ‘repressed’ chromatin either across the entire gene locus or proximal to the promoter. (E) Data as in (B–D), depicting the entire 800kb segment of the NKC containing the Klra, Klrc1, and Klrk1 loci (left) and zoomed in on the Klra7 locus (right). In all panels, arrows indicated the position of the annotated promoters in the EDPNew database (Dreos et al., 2017). Vertical scales within a dataset are constant within and across panels, and the data range in SPMR are displayed for each track.
Figure 7 with 2 supplements
The lineage-defining Klrk1, Ptprc, Cd8a and Thy1 genes are RME genes.
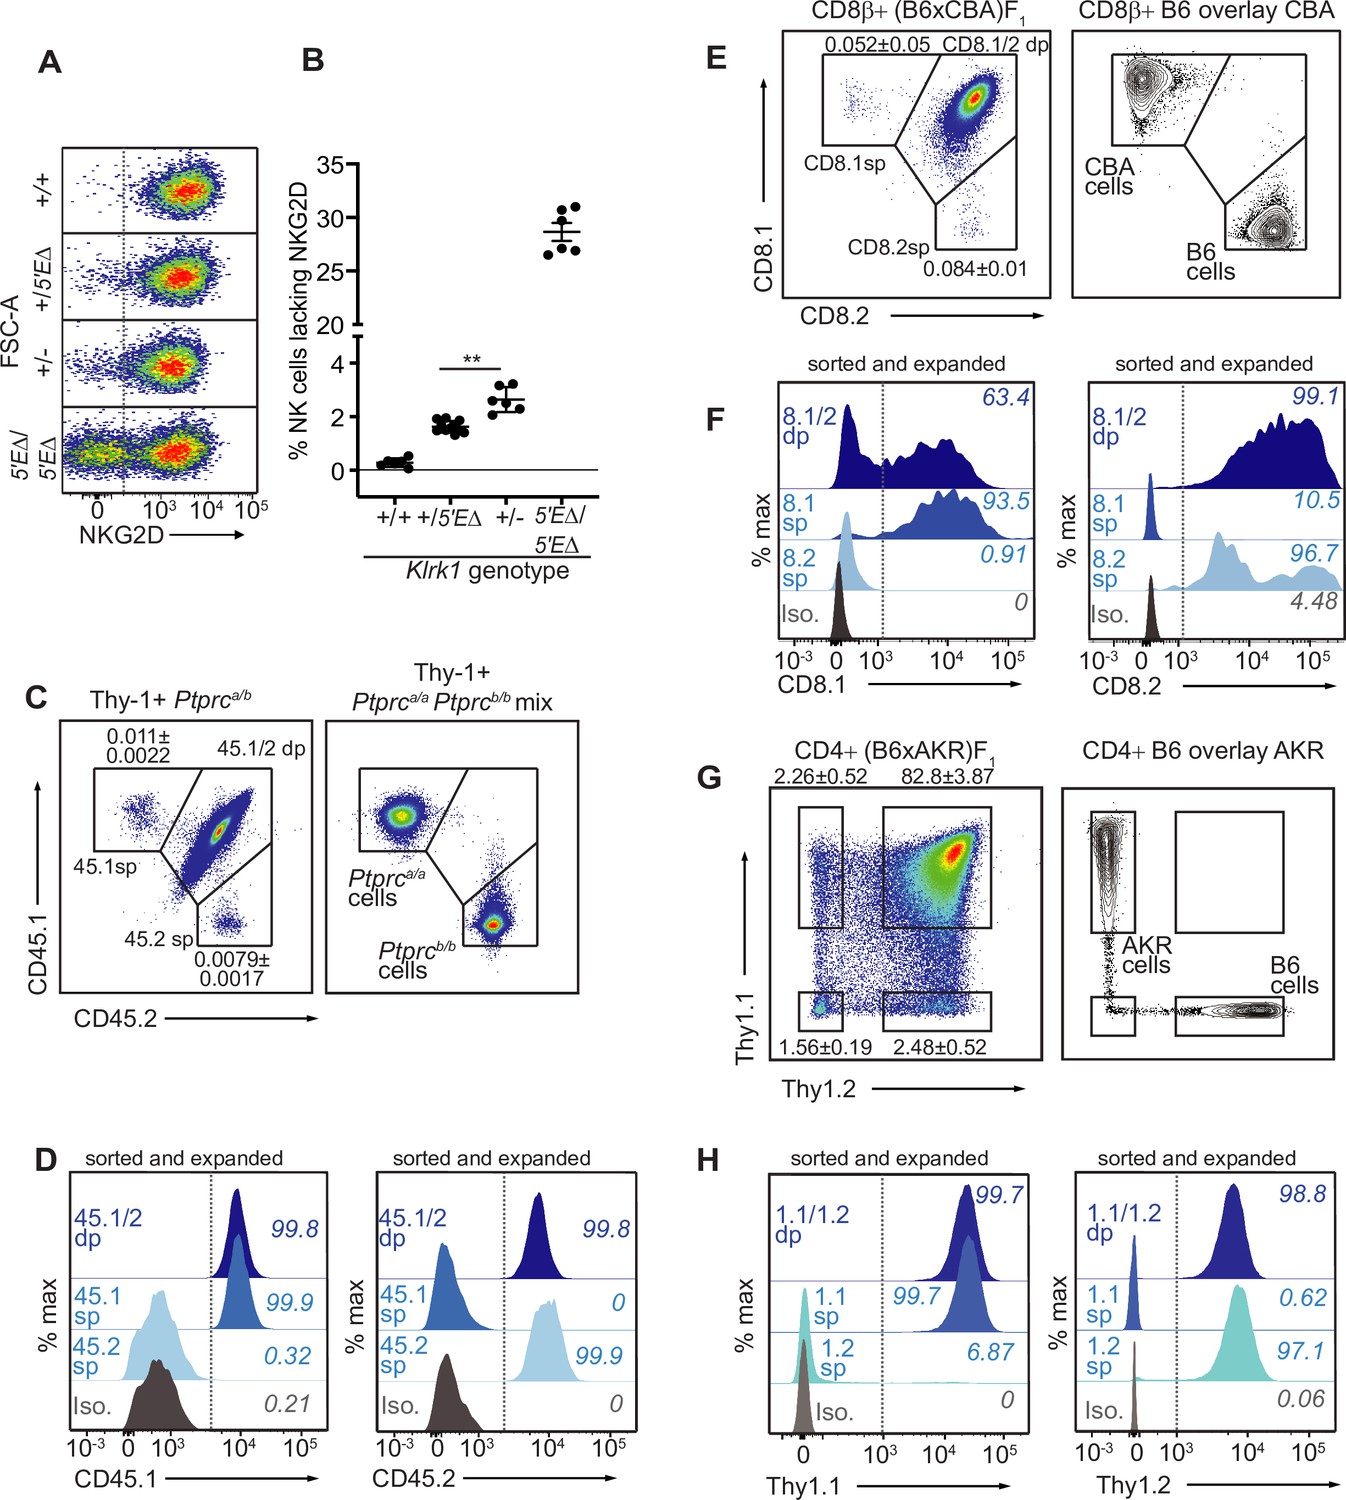
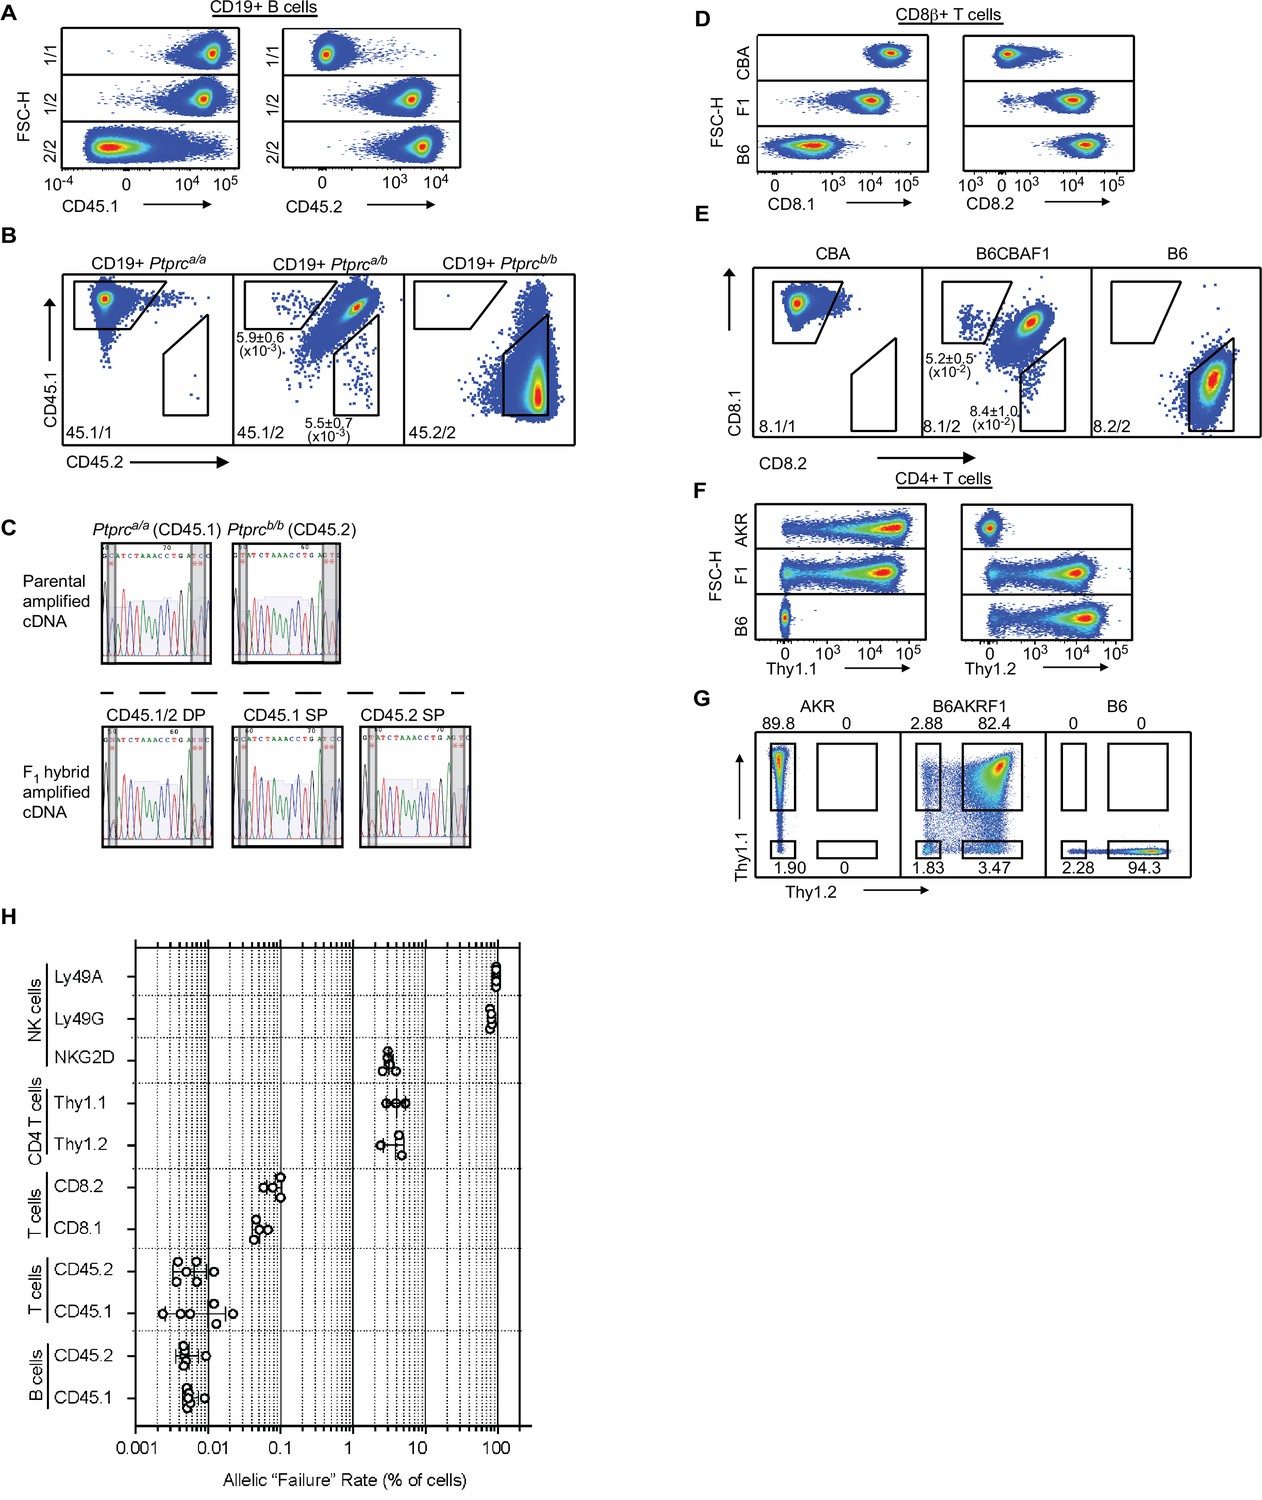
(A, B) Flow cytometry (A) and quantification of % NKG2D-negative cells (B) of selected Klrk1 genotypes. p = 0.0021, student’s t-test. (C) Monoallelic CD45 expression. Flow cytometry of gated Thy-1+ cells pooled from 2 Ptprca/b mice (left). The mean percentages ± SEM of each monoallelic population, combined from three experiments, are depicted within the plot. Right panel: a mixture of cells from Ptprca/a and Ptprcb/b mice. (D) CD45 allele single positive and double positive T cell populations were sorted from Ptprca/b mice using gates in panel C, expanded for 1 week in vitro, resorted to purity and expanded an additional ~5–8 fold. Histograms show CD45.1 and CD45.2 staining for the sorted populations after expansion. (E–F) Monoallelic expression of CD8α in (B6 x CBA)F1 mice presented as in (C) and (D). (F) shows CD8β+ cells from F1 mice sorted and expanded twice as in (D) (~5–10 fold expansion in the second stumulation). (G–H) Data are displayed as in (C–F) but with respect to Thy-1 allelic expression on CD3+CD4+ T cells in (B6 x AKR)F1 hybrid mice (6–8 fold expansion in the second stimulation). All experiments are representative of 2–3 performed. Error bars represent SEM.
Figure 7—figure supplement 1

Similar patterns of NKG2A, Ly49I and Ly49G2 expression in NKG2D+ and NKG2D- NK cells.
(A–C) Percentages of NK cells expressing NKG2A (A), Ly49I (B) Ly49G2 (C) among gated NKG2D+ and NKG2D- NK cells in mice with the indicated genotypes. NN = insufficient negatives to stain; NP = no positives.
Figure 7—figure supplement 2
Monoallelic expression of receptors thought to be expressed by all cells in various hematopoietic lineages compared to NK cell receptors.
(A) Scatterplot staining patterns of gated CD19+ splenic B cells from mice with the indicated genotypes with CD45.1 and CD45.2 mAbs vs FSC-H. The genotypes are as follows: 1/1: Ptprca/a, 1/2: Ptprca/b, and 2/2: Ptprcb/b. One mouse from each of the depicted genotypes is displayed; data are representative of three independent experiments. (B) Staining of B cells for CD45.1 and CD45.2 expression on a two-dimensional scatter plot. A single representative mouse is displayed for each depicted genotype. Gates outlining cells with monoallelic CD45 expression are shown. Mean percentages and SEMs from three experiments are shown in the panels. (C) Sanger sequence reads of amplified cDNA from Ptprc transcripts isolated from the indicated cells depicted in Figure 7D. RNA was isolated from ex vivo expanded parental (homozygous) T cells from Ptprca/a and Ptprcb/b mice (top), or sorted and expanded Ptprca/b F1 hybrid T cells (bottom) expressing both alleles (CD45.1/2 DP), only the Ptprca allele (CD45.1 SP), or only the Ptprcb allele (CD45.2 SP). Red asterisks denote the position of allele-informative SNPs between the Ptprca and Ptprcb alleles assayed in the amplified region. (D) Scatterplot staining patterns of gated CD8β+ splenic T cells from mice with the indicated genotypes with CD8.1 or CD8.2 mAbs vs FSC-H. Data are representative of 4 independent experiments. (E) Two-dimensional scatter plots showing CD8.1 vs CD8.2 staining of gated CD8β+ cells. A single representative mouse is displayed for each genotype. Gates outlining cells with monoallelic CD8α expression are shown. Mean percentages and SEMs from 4 experiments from (B6 x CBA)F1 mice are shown in the panels. (F) Scatterplot staining patterns of gated CD4+ splenicT cells from B6, AKR and (B6 x AKR)F1 mice. Thy-1.1 (left) or Thy-1.2 (right) staining is depicted against FSC-H. Data are representative of three independent experiments. (G) Scatterplots of the data depicted in (F) but showing the Thy-1.1 vs Thy-1.2 parameters. In all cases, a single representative mouse is displayed. Data in (G) are duplicated from Figure 7G for ease of reference. (H) Quantification of failure rates of selected alleles in this study. Failure rate is defined as the percentage of cells in the indicated cell population that fail to express a particular allele as measured in a genetic background that allows detection of such cells by flow cytometry. Klra allelic failure rates were based on analysis in a (B6 x BALB/c)F1 hybrid background; Klrk1 alleles in mice where the opposing chromosome harbors the Klrk1 knockout allele; Cd8a alleles in (B6 x CBA)F1 hybrids; Cd45 alleles in Ptprca/b F1 congenic mice on the B6 genetic background; Thy1 alleles in (B6 x AKR)F1 mice. Data are compiled from 3 to 6 mice per group from multiple experiments. The horizontal axis depicting failure rates as a percentage of cells is on a log10 scale. In each case, error bars represent the SEM.
Author response image 1
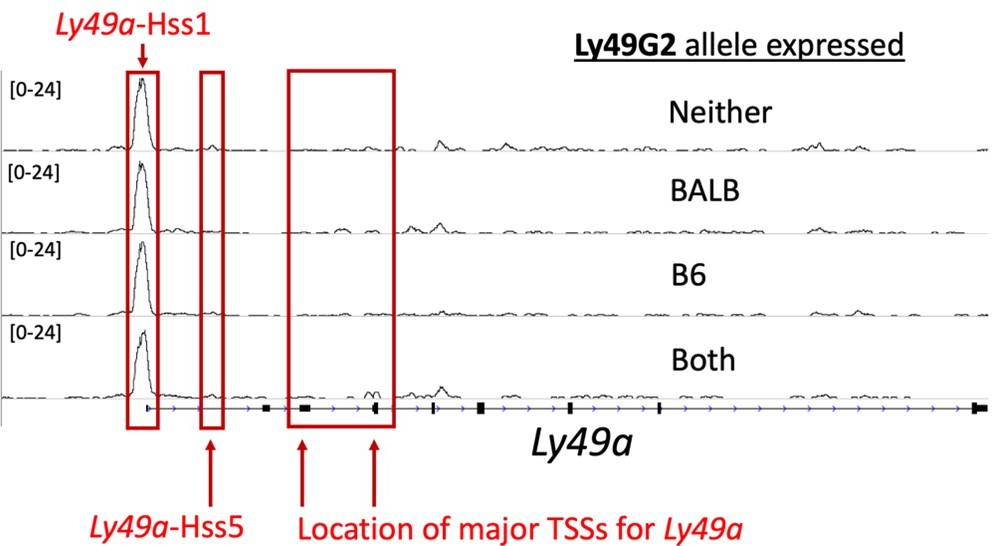
ATAC-seq tracks in NK cells at the Ly49a locus show weak signal at the Ly49aHss5 and Ly49aPro elements.
Here we display four ATAC-seq tracks generated from (B6 x BALB/c)F1 NK cells sorted according to Ly49G2 allelic expression status as shown in Figure 2D, but at the Ly49a locus. The locations of Hss1, Hss5, and the major annotated TSSs are indicated.
Author response image 2
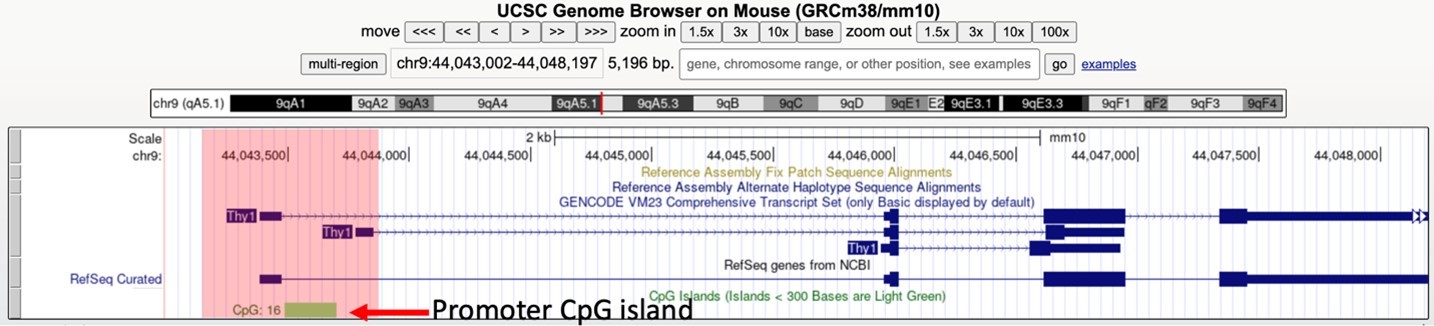
The Thy1 gene harbors a promoter proximal CpG island.
We provide a screenshot of the UCSC genome browser displaying the Thy1 locus with the CpG track. The red box highlights the region of interest. We show in Figure 7 of the manuscript that Thy1, which is widely regarded as a marker of all T cells, is actually an RME gene. CpG islands are defined as those with GC content of >50%, and the ratio of observed/expected CpG dinucleotides is >0.6, as described in the following link: https://genome.ucsc.edu/cgi-bin/hgc?db=mm10&c=chr9&l=44043001&r=44048197&o=44043488&t=44043701&g=cpgIslandExt&i=CpG%3A+16.
Author response image 3
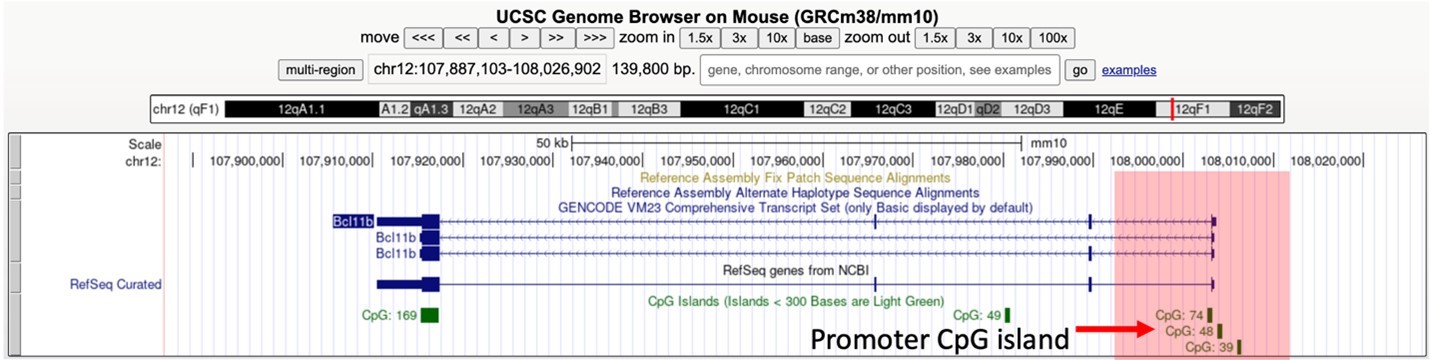
The Thy1 gene harbors a promoter proximal CpG island.
Similar to Author response image 2, we provide a UCSC genome browser screenshot of the Bcl11b locus with the CpG track displayed. It was recently shown that the gene, which encodes a key transcription factor commiting thymocytes to the T cell lineage, is expressed in an RME fashion and is further subect to enhancer deletion-associated variegation (Ng et al., eLife 2018 PMID: 30457103). The promoter region of interest is highlight in the red box, and the CpG island is indicated with the red arrow.
Tables
Appendix 1—key resources table
| Reagent type (species) or resource | Designation | Source or reference | Identifiers | Additional information |
|---|---|---|---|---|
| Genetic reagent (Mus musculus) | C57BL/6J background | Jackson Laboratory | Strain #:000664 RRID:IMSR_JAX:000664 | |
| Genetic reagent (Mus musculus) | BALB/cJ background | Jackson Laboratory | Strain #:000651 RRID:IMSR_JAX:000651 | |
| Genetic reagent (Mus musculus) | AKR/J | Jackson Laboratory | Strain #:000648 RRID:IMSR_JAX:000648 | |
| Genetic reagent (Mus musculus) | CBA/J | Jackson Laboratory | Strain #:000656 RRID:IMSR_JAX:000656 | |
| Genetic reagent (Mus musculus) | CB6F1/J | Jackson Laboratory | Strain #:100007 RRID:IMSR_JAX:100007 | Purchased from the Jackson Laboratory or generated in-house |
| Genetic reagent (Mus musculus) | B6CBAF1/J | Jackson Laboratory | Strain #:100011 RRID:IMSR_JAX:100011 | |
| Genetic reagent (Mus musculus) | B6AKRF1/J | Jackson Laboratory | Generated in-house by crossing C57BL/6J with AKR/J | |
| Genetic reagent (Mus musculus) | B6.Cg-Klrk1tm1Dhr/J | Jackson Laboratory | Strain #:022733 RRID:IMSR_JAX:022733 | |
| Genetic reagent (Mus musculus) | B6-Klra1Hss1Δ | This paper | Generated by Cas9 RNP microinjection | |
| Genetic reagent (Mus musculus) | B6-Klrc15’EΔ | This paper | Generated by Cas9 RNP electroporation (CRISPR-EZ) | |
| Genetic reagent (Mus musculus) | B6-Klrk15’EΔ | This paper | Generated by Cas9 RNP electroporation (CRISPR-EZ) | |
| Genetic reagent (Mus musculus) | B6-Klra7Hss5Δ | This paper | Generated by Cas9 RNP electroporation (CRISPR-EZ) | |
| Antibody | (Armenian hamster monoclonal) anti-CD3e (clone 145–2C11) in PE-Cy5 | Biolegend | RRID: AB_312667 (BioLegend Cat. No. 100302) | FACS (1:400) |
| Antibody | (rat monoconal) anti-CD4 (clone GK1.5) in BUV737 | BD Biosciences | BD Biosciences Cat# 612844, RRID:AB_2870166 | FACS (1:200) |
| Antibody | (rat monoclonal) anti-CD19 (clone 6D5) in PE-Cy5 | Biolegend | RRID: AB_313644 (BioLegend Cat. No. 115509) | FACS (1:400) |
| Antibody | (rat monoclonal) anti-F4/80 (clone BM8) in PE-Cy5 | Biolegend | RRID: AB_893482 (BioLegend Cat. No. 123112) | FACS (1:400) |
| Antibody | (rat monoclonal) anti-Ter119 (clone TER-119) in PE-Cy5 | Biolegend | RRID: AB_313711 (BioLegend Cat. No. 116210) | FACS (1:400) |
| Antibody | (rat monoclonal) anti-NKp46 (clone 29A1.4) in BV421 | Biolegend | RRID: AB_10915472 (BioLegend Cat. No. 137611) | FACS (1:100) |
| Antibody | (mouse monoclonal) anti-NKG2AB6 (clone 16a11) in PE | Biolegend | RRID: AB_10959654 (BioLegend Cat. No. 142803) | FACS (1:50) |
| Antibody | (mouse monoclonal) anti-Ly49AB6 (clone A1) in PE | Biolegend | RRID: AB_2134787 (BioLegend Cat. No. 138703) | FACS (1:50) |
| Antibody | (rat monoclonal) anti-NKG2D (clone CX5) in PE-Dazzle 504 | Biolegend | RRID: AB_2728147 (BioLegend Cat. No. 130213) | FACS (1:100) |
| Antibody | (rat monoclonal) anti-CD8β (clone YTS156.7.7) in PE-Cy7 | Biolegend | RRID: AB_2562777 (BioLegend Cat. No. 126616) | FACS (1:200) |
| Antibody | (mouse monoclonal) anti-CD45.1 (clone A20) in APC | Biolegend | RRID: AB_313503 (BioLegend Cat. No. 110714) | FACS (1:200) |
| Antibody | (mouse monoclonal) anti-CD45.2 (clone 104) in FITC | Biolegend | RRID: AB_313443 (BioLegend Cat. No. 109806) Cat. No. 109806 | FACS (1:200) |
| Antibody | (rat monoclonal) anti-CD90.2 (clone 53–2.1) in FITC | Biolegend | RRID: AB_10641145 (BioLegend Cat. No. 140308) | FACS (1:200) |
| Antibody | (rat monoclonal) anti-CD90.2 (clone 53–2.1) in PE | Biolegend | RRID: AB_10641145 (BioLegend Cat. No. 140308) | FACS (1:200) |
| Antibody | (goat polyclonal) anti-mouse IgG (Poly4053) in PE | Biolegend | RRID: AB_315010 (BioLegend Cat. No. 405307) | FACS (1:200) |
| Antibody | (mouse monoclonal) anti-NKG2A (clone 20d5) in PerCP-eFlour 710 | eBioscience/ThermoFisher | RRID: AB_10853352 (Catalog # 46-5896-82) | FACS (1:100) |
| Antibody | (mouse monoclonal) anti-Ly49I (clone YLI-90) in FITC | eBioscience/ThermoFIsher | RRID: AB_2534426 Catalog # A15413 | FACS (1:100) |
| Antibody | (mouse monoclonal) anti-Ly49G2 (clone 4D11) in PerCP-eFlour 710 | eBioscience/ThermoFIsher | RRID: AB_1834437 Catalog # 46-5781-82 | FACS (1:100) |
| Antibody | (mouse monoclonal) anti-CD90.1 (clone HIS51) in FITC | eBioscience/ThermoFIsher | RRID: AB_465151 Catalog # 11-0900-81 | FACS (1:100) |
| Antibody | (donkey polyclonal) anti-rat IgG F(ab’)2 in APC | eBioscience/ThermoFIsher | RRID:AB_469453 polyclonal, lot 17-4822-82 (discontinued) | FACS (1:200) |
| Antibody | (mouse monoclonal) anti-CD8.1 (clone 116–13.1) | BioXCell | RRID: AB_10949065 Catalog # BE0118 | FACS (1:250) |
| Antibody | (rat monoclonal) anti-CD8.2 (clone 2.43) | BioXCell | RRID: AB_1125541 Catalog # BE0061 | FACS (1:50) |
| Antibody | (mouse monoclonal) anti-Ly49A (clone JR9) biotin conjugated | Purified in-house. Ref: Roland and Cazenave Int. Immunol. 1992 PMID: 1535510 | FACS (1:100) | |
| Antibody | (mouse monoclonal) anti-Ly49G2B6 (clone 3/25) unconjugated | Used as ascites Ref: Tanamachi et al. J. Exp. Med. 2001 PMID: 11157051 | FACS (1:100) | |
| Antibody | (rat monoclonal) anti-NKG2D (clone MI-6) conjugated to biotin in-house | eBioscience/ThermoFIsher | RRID: AB_494129 Catalog # 16-5880-86 | FACS (1:100) |
| Antibody | (rabbit polyclonal) anti-H3K4me1 (ab8895) | Abcam | Abcam Cat# ab8895, RRID:AB_306847 | CUT&RUN (1:50) |
| Antibody | (rabbit polyclonal) anti-H3K4me2 (ab7766) | Abcam | Abcam Cat# ab7766, RRID:AB_2560996 | CUT&RUN (1:50) |
| Antibody | (rabbit polyclonal) anti-H3K4me3 (ab8580) | Abcam | Abcam Cat# ab8580, RRID:AB_306649 | CUT&RUN (1:50) |
| Antibody | (rabbit polyclonal) anti-H3K27ac (ab4729) | Abcam | Abcam Cat# ab4729, RRID:AB_2118291 | CUT&RUN (1:50) |
| Antibody | (rabbit polyclonal) anti-H3K9me3 (ab8898) | Abcam | Abcam Cat# ab8898, RRID:AB_306848 | CUT&RUN (1:50) |
| Antibody | (rabbit monoclonal) anti-H3K27me3 (clone C36B11) | Cell Signaling | Cell Signaling Technology Cat# 4395, RRID:AB_11220433 | CUT&RUN (1:50) |
| Antibody | (rabbit monoclonal) anti-H2AUb1 (clone D27C4) | Cell Signaling | Cell Signaling Technology Cat# 8240, RRID:AB_10891618 | CUT&RUN (1:50) |
| Antibody | (mouse monoclonal) IgG2a k (clone MOPC-173) | Biolegend | Cat # 400202 | CUT&RUN (1:50) |
| Commercial assay or kit | HiScribe T7 Quick High Yield RNA Synthesis Kit | New England Biolabs | Cat # E2050S | |
| Commercial assay or kit | iScript cDNA Synthesis Kit | Bio-rad | Cat # 1708890 | |
| Commercial assay or kit | P3 Primary Cell 4D-Nucleofector X Kit S | Lonza | Cat #: V4XP-3032 | |
| Commercial assay or kit | Mojosort Mouse NK Cell Isolation Kit | Biolegend | Cat # 480049 | |
| Commercial assay or kit | Nextera DNA Library Prep Kit | Nextera | Cat # FC-121–1030 | |
| Commercial assay or kit | NEBNext Ultra II DNA Library Prep Kit for Illumina | New England Biolabs | Cat # E7645S | |
| Commercial assay or kit | NEBNext Multiplex Oligos for Illumina (Index Primers Set 1) | New England Biolabs | Cat # E7335S | |
| Commercial assay or kit | Epitect Fast DNA Bisulfite Kit | Qiagen | Cat # 59,824 | |
| Commercial assay or kit | Invitrogen TOPO TA Cloning Kit for Subcloning, without competent cells | ThermoFisher | Cat # Invitrogen 450641 | |
| Commercial assay or kit | LIVE/DEAD Fixable Near-IR Dead Cell Stain Kit | ThermoFisher | Cat # L34975 | Used at (1:1000) in PBS for flow cytometry |
| Peptide, recombinant protein | Recombinant human IL-2 (teceleukin) | National Cancer Institute (BRB Preclinical Biologics Repository) | Used at 1,000U/mL for NK cell culture | |
| Peptide, recombinant protein | Cas9-NLS (40uM) | UC QB3 MacroLab | 15.6mg used per nucleofection reaction | |
| Peptide, recombinant protein | pA-MNase (Batch #6, 143mg/ml) | Kindly provided by the Henikoff lab | Used at 0.7mg/mL for CUT&RUN | |
| Peptide, recombinant protein | EpiTaq HS (for bisulfite-treated DNA) | Takara | Cat # R110B | |
| Other | DAPI | Biolegend | Cat # 422801 | Used at (1:2000) for flow cytometry |
| Other | Dynabeads mouse T-activator CD3/CD28 | ThermoFisher | Cat # 11,456D | |
| Other | BioMagPlus Concanavalin A | Bangs Laboratories | Cat # BP531 | |
| Other | AmpureXP beads, 5mL | Beckman Coulter | Cat # A63880 | |
| Software, algorithm | FlowJo Version 10 | FlowJo | https://www.flowjo.com/ RRID:SCR_008520 | |
| Software, algorithm | Python 3.7.4 | Python | https://www.python.org/downloads/release/python-374/ | |
| Software, algorithm | Bowtie 2.1.1 | DOI: 10.1038/nmeth.1923 | ||
| Software, algorithm | Picard | Broad Institute | https://broadinstitute.github.io/picard/ | |
| Software, algorithm | SAMtools 1.8 | DOI:10.1093/bioinformatics/btp352 | ||
| Software, algorithm | BEDTools | DOI: 10.1093/bioinformatics/btq033 | ||
| Software, algorithm | MACS2 | DOI: 10.1186/gb-2008-9-9-r137 | ||
| Software, algorithm | bedGraphToBigWig | DOI: 10.1093/bioinformatics/btq351 | ||
| Software, algorithm | IGV | DOI: 10.1093/bib/bbs017 | ||
| Software, algorithm | SeqPlots | DOI: 0.12688/wellcomeopenres.10004.1 | ||
| Software, algorithm | deepTools | DOI: 10.1093/nar/gku365 |
Additional files
-
Supplementary file 1
Guides and primers used to generate and genotype CRISPR/Cas9-edited mice.
Guide RNAs (sgRNAs) used to generate germline enhancer deletion mice via electroporation or microinjection are displayed. A flanking guide pair was used to delete the indicated enhancer, except for in the case of Klrk15′E, where two sets of flanking guides were used (all four sgRNAs were simultaneously delivered to embryos). Primers used to genotype mice carrying a deletion allele and mice lacking a WT allele are also shown. These primers allow delineation of WT, heterozygous and homozygous enhancer deletion animals with respect to the indicated enhancer element. More than one primer is shown if PCR was performed as a nested reaction; “1” indicates use in the first amplification and “2” indicates use in the subsequent amplification.
- https://cdn.elifesciences.org/articles/74204/elife-74204-supp1-v1.docx
-
Supplementary file 2
Guides and primers used for ex vivo NK cell editing.
Guide RNAs (sgRNAs) used in the ex vivo NK cell enhancer deletion assay are displayed. Non-targeting sgRNA pairs 1 (nt1) and 2 (nt2) were used as negative controls in Figure 3—figure supplement 1A. Primers used to detect the presence of the intended deletion in nucleofected NK cells using the indicated sgRNAs used are also shown. More than one primer is shown if PCR was performed as a nested reaction; “1” indicates use in the first amplification and “2” indicates use in the second amplification.
- https://cdn.elifesciences.org/articles/74204/elife-74204-supp2-v1.docx
-
Supplementary file 3
Primers used to amplify Ptprc PCR products.
Intron-spanning primers detecting a region of the Ptprc transcript containing 3 allele-informative SNPs.
- https://cdn.elifesciences.org/articles/74204/elife-74204-supp3-v1.docx
-
Transparent reporting form
- https://cdn.elifesciences.org/articles/74204/elife-74204-transrepform1-v1.docx
-
Source data 1
NK cell promoters and enhancers in Figure 1.
xlsx file containing a list of called NK cell promoters (first tab), NK cell enhancers (second tab), 51,650 ATAC-seq peaks (1kb windows centered at ATAC-seq peak midpoints over which the H3K4me1:H3K4me3 ratio was calculated) in NK cells (third tab), and labeled promoters and enhancers investigated in this study (fourth tab). See methods for a description of how these lists were generated.
- https://cdn.elifesciences.org/articles/74204/elife-74204-data1-v1.xlsx
-
Source data 2
Original gel images in Figure 1—figure supplement 2.
Original agarose gel images corresponding to Figure 1—figure supplement 2 E and H are provided in both annotated and unannotated format. The relevant lanes are highlighted and labeled. The cropped lanes are denoted with a white vertical bar.
- https://cdn.elifesciences.org/articles/74204/elife-74204-data2-v1.zip
-
Source data 3
All raw data values used to generate bar graphs.
The raw data provided correspond to all graphed data points in both the main and supplementary figures. Each tab corresponds to one or multiple panels within a figure. In cases where the data displayed in a graph are combined from two independent experiments, data points from each experiment are indicated. The results from statistical tests performed are also displayed.
- https://cdn.elifesciences.org/articles/74204/elife-74204-data3-v1.xlsx
-
Source data 4
Chromatin states in Ly49G2 negative and biallelic sorted NK cells in Figure 6—figure supplement 1.
.xlsx file containing ChromHMM-derived 3 state model for cells expressing neither (Ly49G2 DN) or both (Ly49G2 DP) NK cells. Models were built using CUT&RUN data as is described in the methods.
- https://cdn.elifesciences.org/articles/74204/elife-74204-data4-v1.xlsx
Download links
A two-part list of links to download the article, or parts of the article, in various formats.
Downloads (link to download the article as PDF)
Open citations (links to open the citations from this article in various online reference manager services)
Cite this article (links to download the citations from this article in formats compatible with various reference manager tools)
Binary outcomes of enhancer activity underlie stable random monoallelic expression
eLife 11:e74204.
https://doi.org/10.7554/eLife.74204


