Temporal analysis of enhancers during mouse cerebellar development reveals dynamic and novel regulatory functions
- Centre for Molecular Medicine and Therapeutics, BC Children’s Hospital Research Institute, Canada
- University of British Columbia, Canada
- RIKEN, Japan
- The Centre for Applied Genomics, The Hospital for Sick Children, Canada
Figures
Figure 1 with 1 supplement
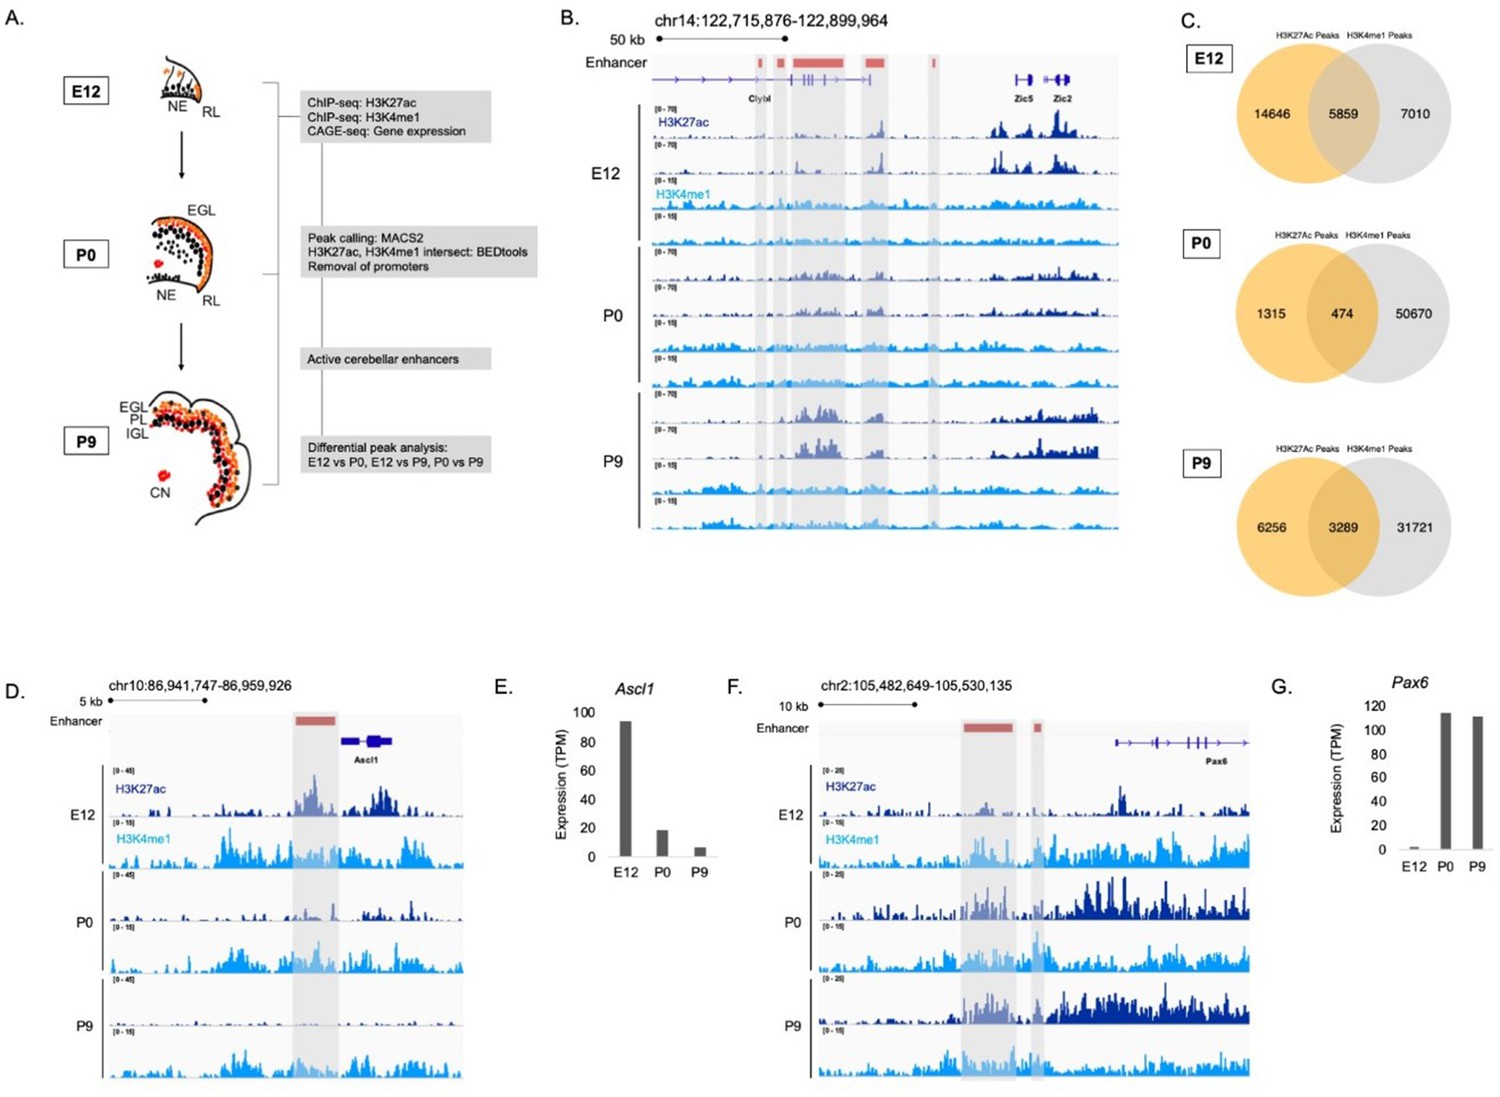
Enhancer identification during cerebellar development.
(A) An overview of the stages of cerebellar development profiled in this study. The datasets collected at these ages and the downstream analyses are shown in the flow chart. Labels: NE: Neuroepithelium, RL: Rhombic lip, EGL: External granular layer, PL: Purkinje layer, IGL: Inner granular layer, CN: Cerebellar nuclei (B) A region of the mouse genome chr14:122,715,876–122,899,964 (mm9) in the Integrative Genomics Viewer (IGV) showing H3K27ac and H3K4me1 profiles across biological replicates of E12, P0, P9 cerebella. Active cerebellar enhancers are highlighted (gray box). (C) Venn diagrams displaying overlap between H3K27ac and H3K4me1 peaks at E12, P0 and P9. (D–E) An example of a cerebellar enhancer identified from the E12 cerebellum. Shown is normalized H3K27ac and H3K4me1 signal at the enhancer (gray box), as well as (E) normalized CAGE-seq expression of the nearest gene, Ascl1, across developmental time, at E12, P0, P9. TPM, Transcripts Per Million. (F–G) An example of a cerebellar enhancer identified from the P9 cerebellum. Shown is normalized H3K27ac and H3K4me1 signal at the enhancer (gray box), as well as (G) normalized (TPM) CAGE-seq expression of the nearest gene, Pax6, across developmental time, at E12, P0, P9.
Figure 1—figure supplement 1
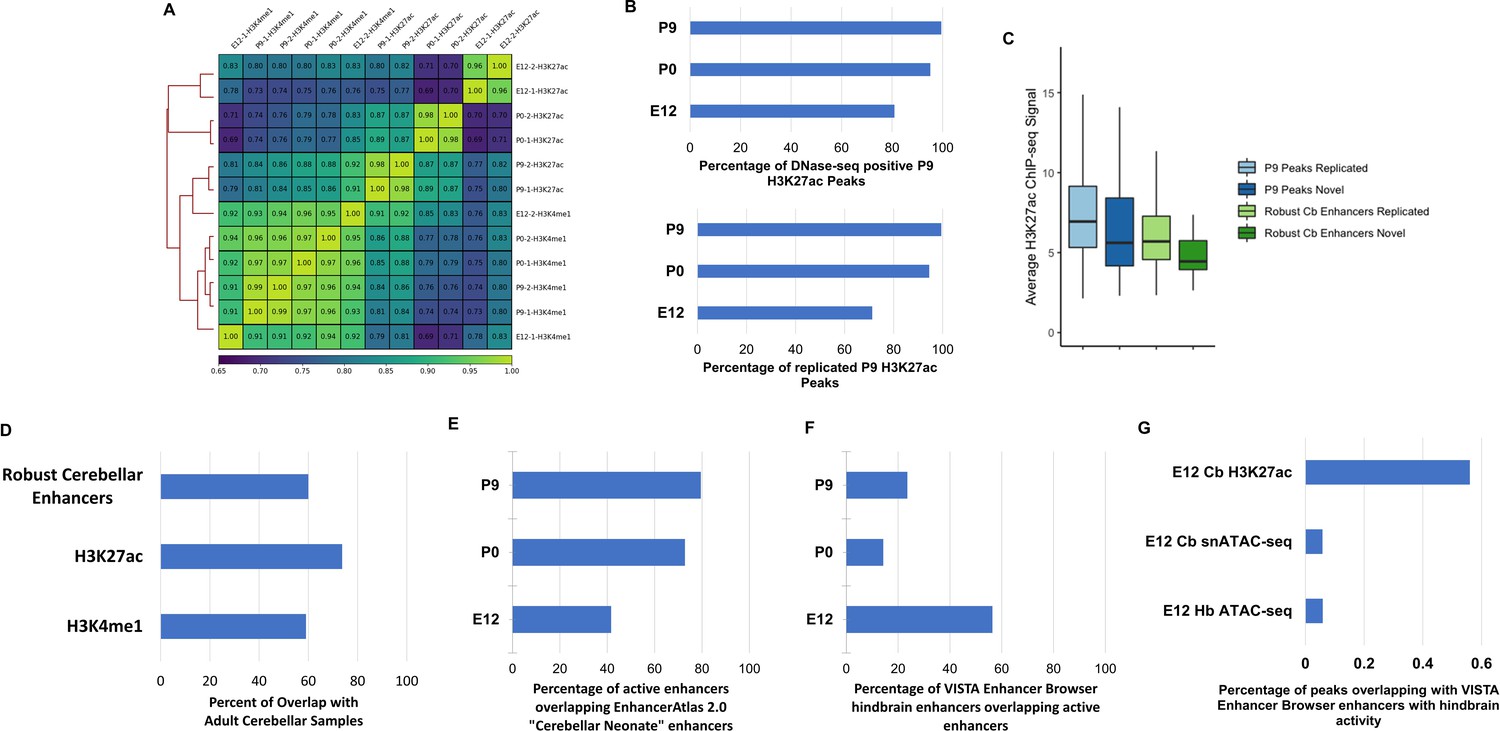
Validation of identified enhancer sequences.
(A) Sample-sample correlation heatmap and dendrogram comparing H3K4me1 and H3K27ac profiles of all samples collected in this study. (B) Bar plot displaying the percentage of H3K27ac peaks collected in our study at E12, P0, and P9 that overlap with DNase-seq peaks detected in the P7 cerebella by Frank et al., 2015 (top) and percentage of peaks overlapping with H3K27ac peaks detected in P7 cerebella by Frank et al., 2015 (bottom). (C) Normalized H3K27ac signal for novel and replicated P9 H3K27ac peaks as well as novel and replicated robust cerebellar enhancers. Samples were grouped by: Replicated – reported in both Frank et al., 2015 and this study; Novel – identified in this study but not in previous literature. A similar distribution of signal was observed between enhancers with replicated activity and those unique to our study. Error bars represent the standard error of the mean. (D) Bar plot displaying the percentage of overlap of robust cerebellar enhancers an H3K27ac and H3K4me1 peaks identified at P9 with adult cerebellar samples from Gorkin et al., 2020. (E) Bar plot showing the percent of robust cerebellar enhancers that overlap with enhancers from EnhancerAtlas 2.0 database. (F) Bar plot showing the percent of VISTA Enhancer Browser enhancers with hindbrain activity that overlap with robust cerebellar enhancers at E12, P0, P9 cerebella in our study. (G) Bar plot displaying the percentage of cerebellar H3K27ac peaks, cerebellar open chromatin regions (snATAC-seq, Sarropoulos et al., 2021) and hindbrain open chromatin regions (bulk ATAC-seq Gorkin et al., 2020) quantified at E12 overlapping with the VISTA Enhancer Browser enhancers with hindbrain.
Figure 2 with 4 supplements
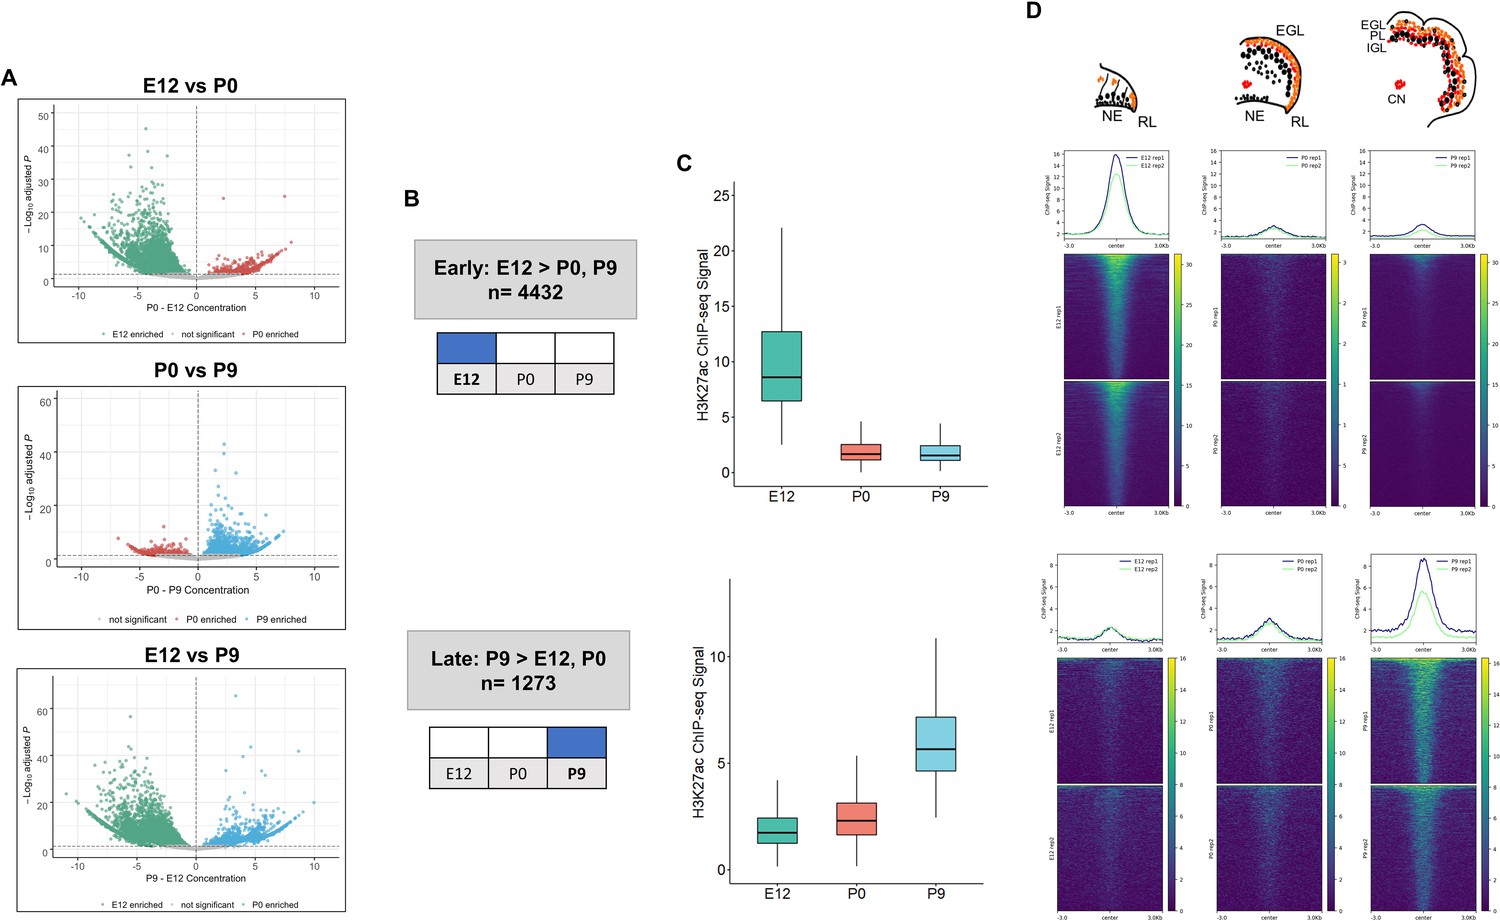
Enhancer activity is dynamic throughout cerebellar development.
(A) Volcano plots showing robust cerebellar enhancers with differential H3K27ac peak signal for three comparisons: E12 vs P9, E12 vs P0, and P0 vs P9. Differential signal strength was identified for 4433 and 4355 robust cerebellar enhancers when comparing E12 to P9 and to P0, respectively. At P9, 1275 and 403 robust cerebellar enhancers had differential signal when compared to E12 and P0, respectively. Enhancers with significant differential activity are colored at a cutoff of an adjusted P-value <0.05. Displayed on the y-axis is the negative log10 adjusted p-value and on the x-axis is the difference in ChIP-seq signal between to the ages for a given peak. (B) Diagram displays how Early and Late active cerebellar enhancers are classified based on differential peak analysis results. (C) Boxplot shows mean ChIP-seq signal (y-axis) for all Early (upper) and Late (lower) active enhancers. Error bars represent the standard error of the mean. (D) Mean profile and heatmaps of H3K27ac signal at the midpoint of our predicted cerebellar enhancers (rows ±3 kb) in Early and Late groups at E12, P0, and P9.
Figure 2—figure supplement 1
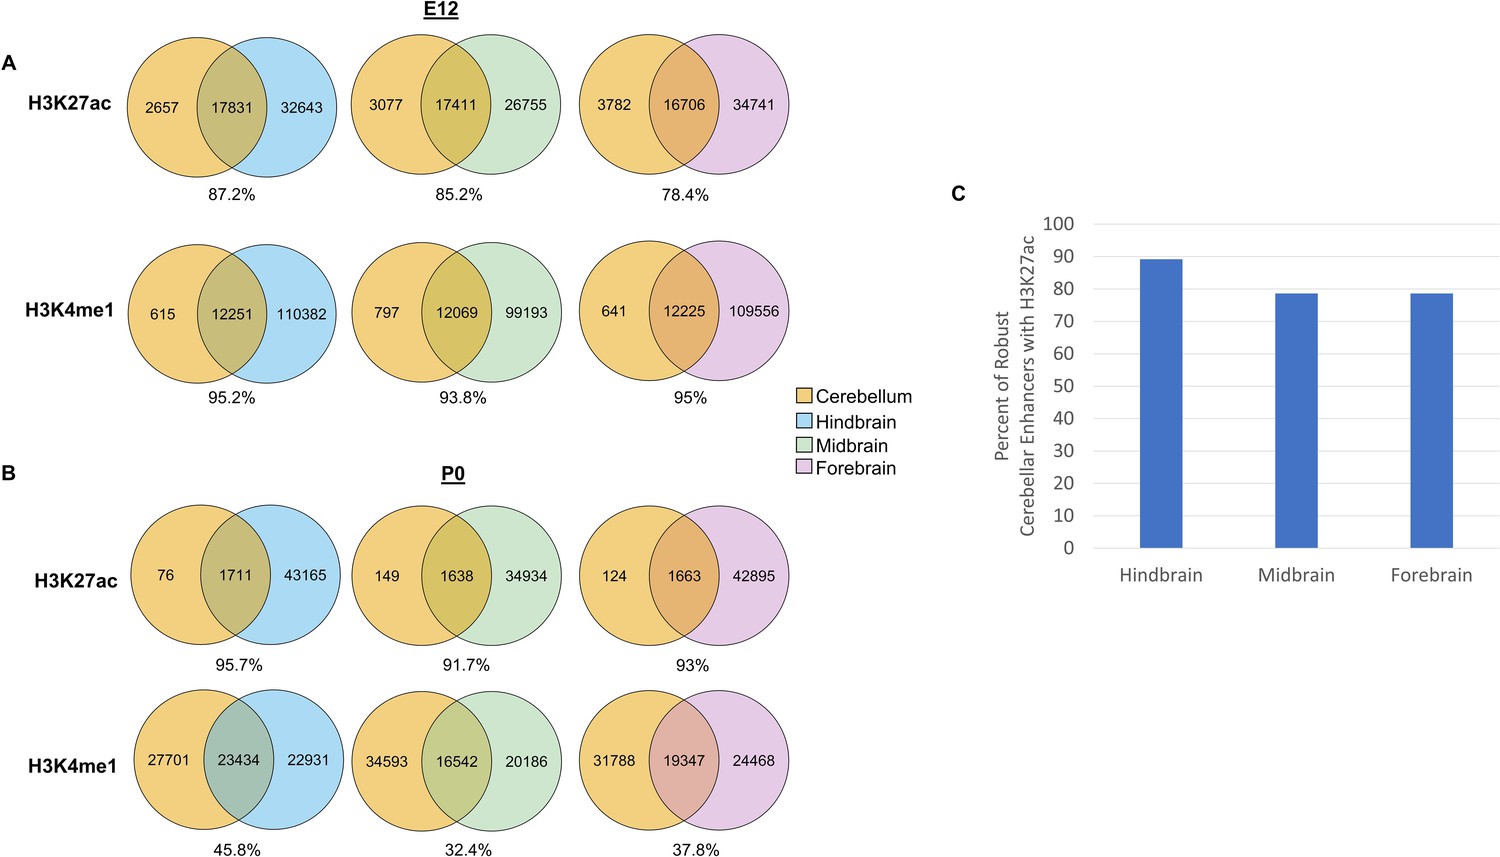
Overlap with histone profiles from the developing hindbrain, midbrain and forebrain.
(A–B) Venn diagrams showing overlap of H3K27ac and H3K4me1 peaks called at E12 (A) and P0 (B) in the developing cerebellum with hindbrain, midbrain and forebrain samples at their respective ages. (C) Bar plot showing the percentage of robust cerebellar enhancers overlapping with H3K27ac peaks called in the hindbrain, midbrain, and forebrain.
Figure 2—figure supplement 2
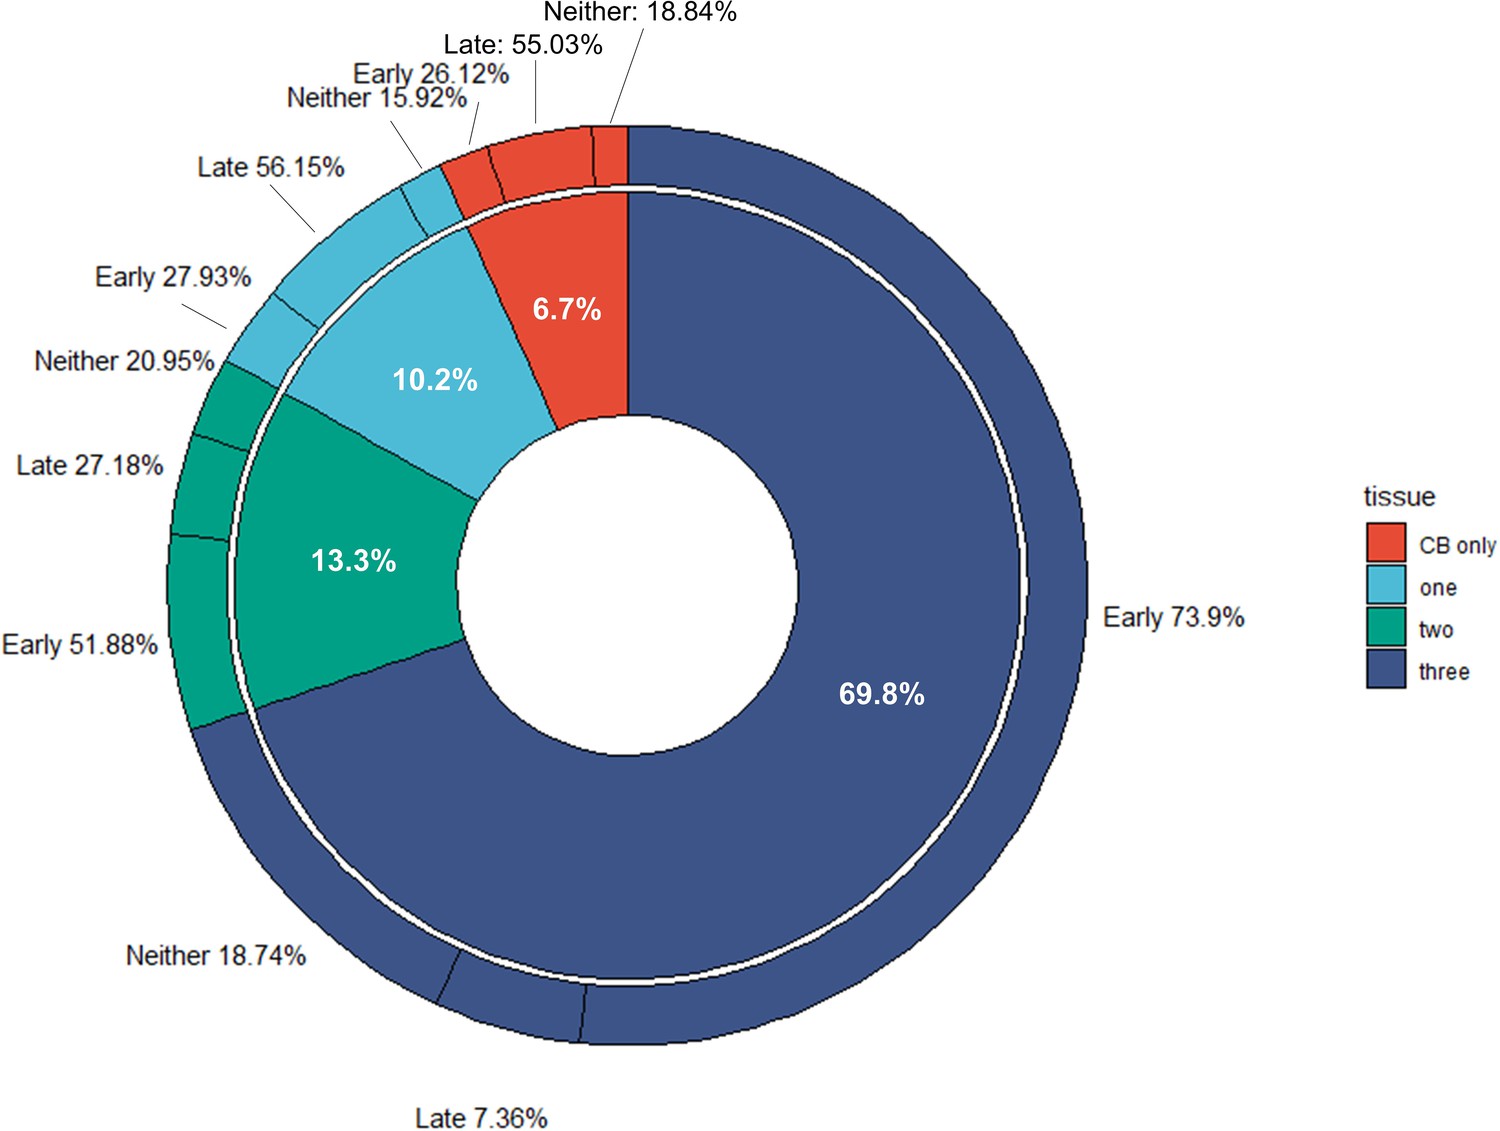
Donut chart displaying the proportion of robust cerebellar enhancers that were found to overlap with one, two or three brain regions examined (hindbrain, midbrain and forebrain) or found to be active only in cerebellar samples (CB only).
The outer donut chart shows the percentage of Early and Late active enhancers for each category (tissue).
Figure 2—figure supplement 3
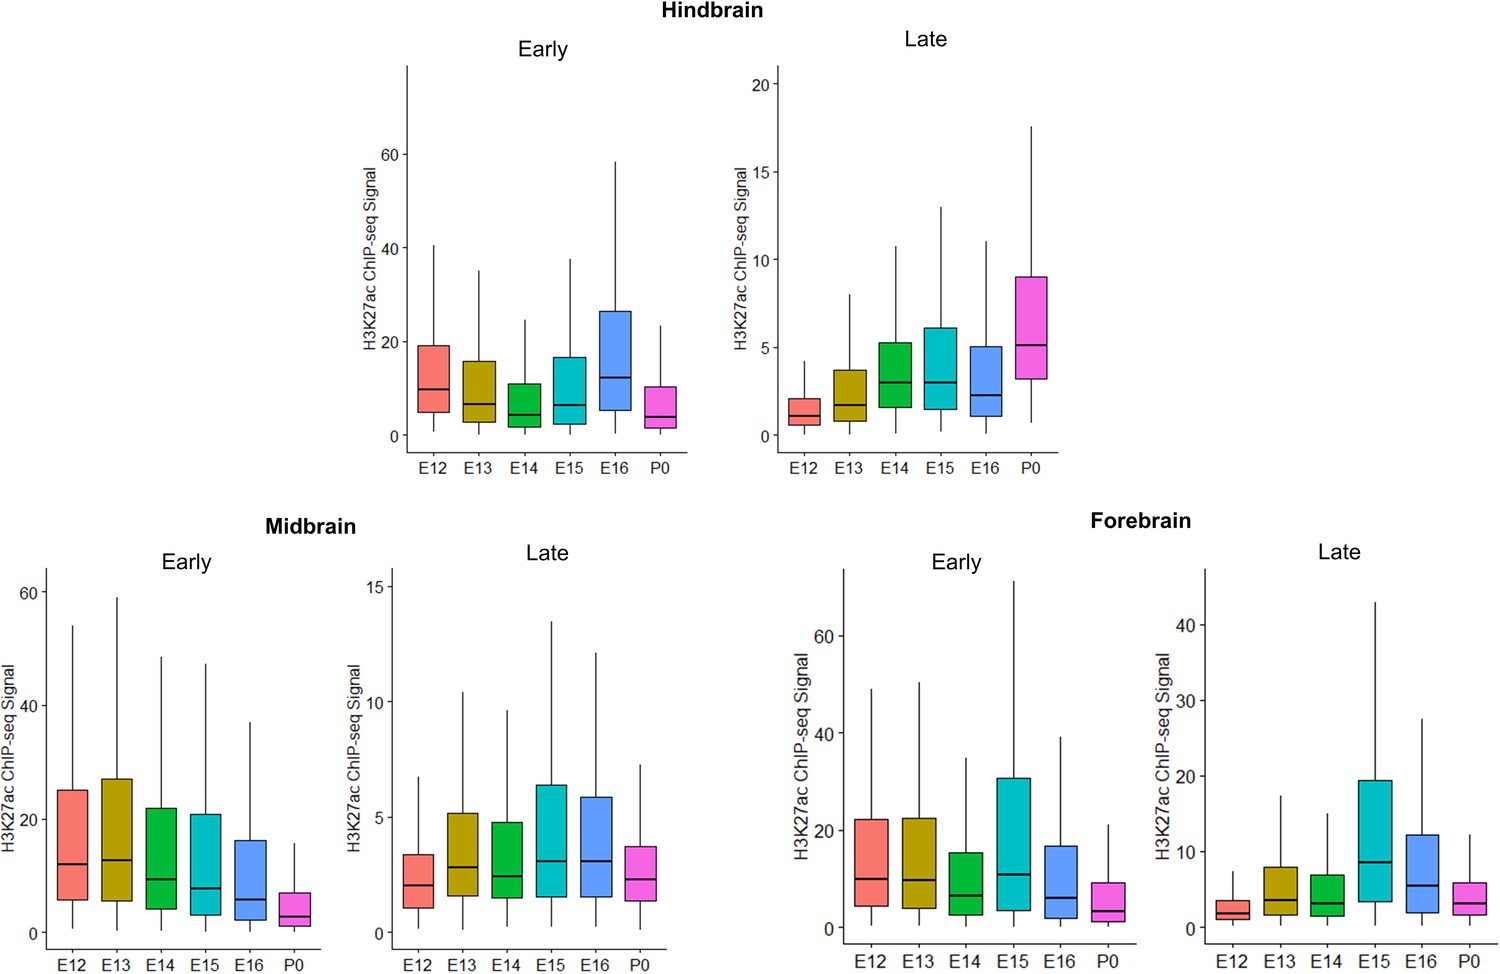
Box plots of Early and Late active enhancer activity for robust cerebellar enhancers with overlapping activity in the developing hindbrain, midbrain and forebrain.
Y-axis indicates the H3K27ac ChIP-seq signal in each brain region for Early or Late active robust cerebellar enhancers.
Figure 2—figure supplement 4
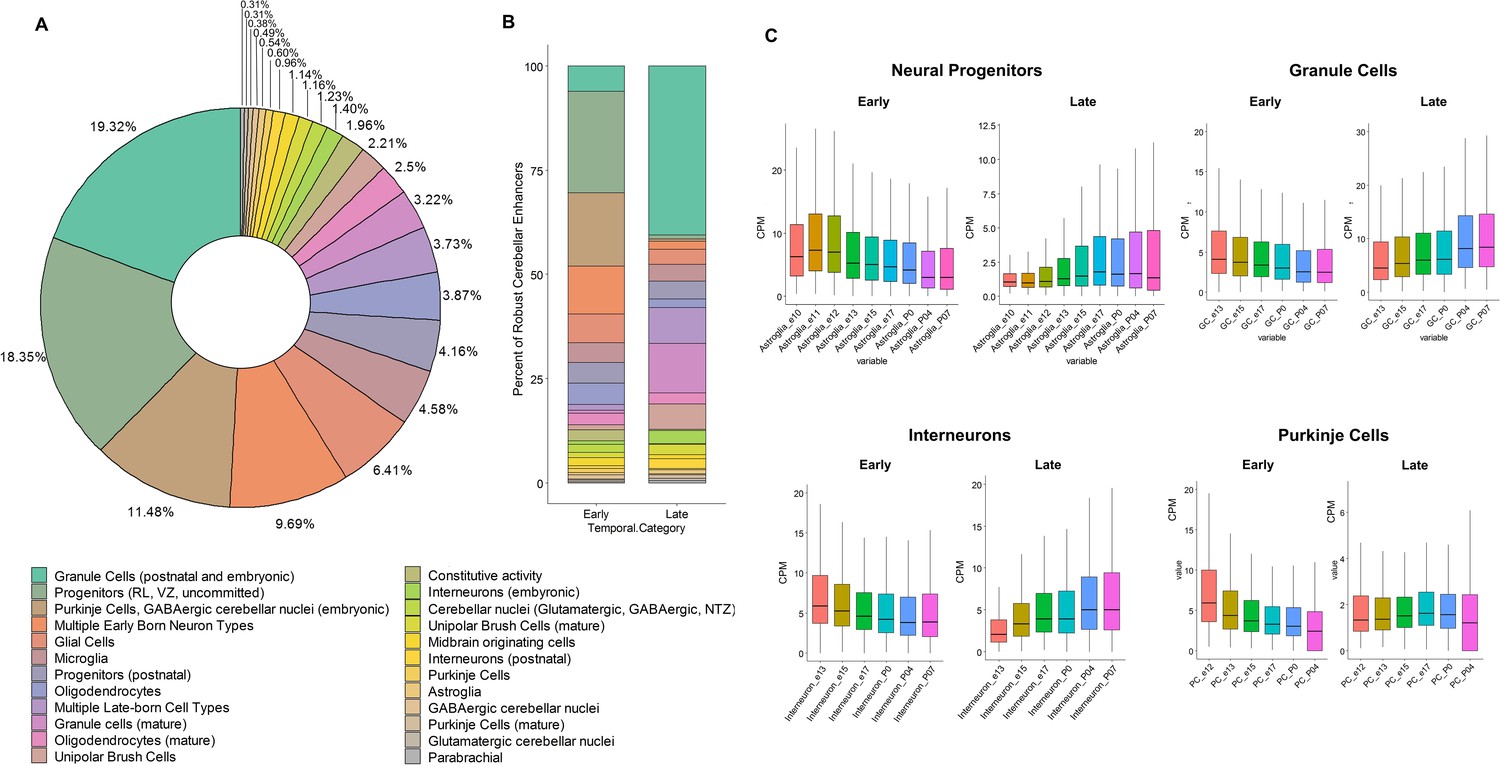
Cell type assignment of robust cerebellar enhancers using snATAC-seq as generated by Sarropoulos et al., 2021 in the developing cerebellum.
(A) Donut plot displaying the proportion robust cerebellar enhancers assigned to the cell-types of the developing cerebellum. (B) Bar plot indicating the percentage of Early and Late robust cerebellar enhancers assigned to the cell-types of the developing cerebellum. (C) Boxplots displaying snATAC-seq signal at CREs overlapping with Early and Late active robust cerebellar enhancers. y-axis represents normalized counts per million (CPM) for each cell type quantified using snATAC-seq. X-axis represents developmental stages at which these values were quantified.
Figure 3 with 2 supplements
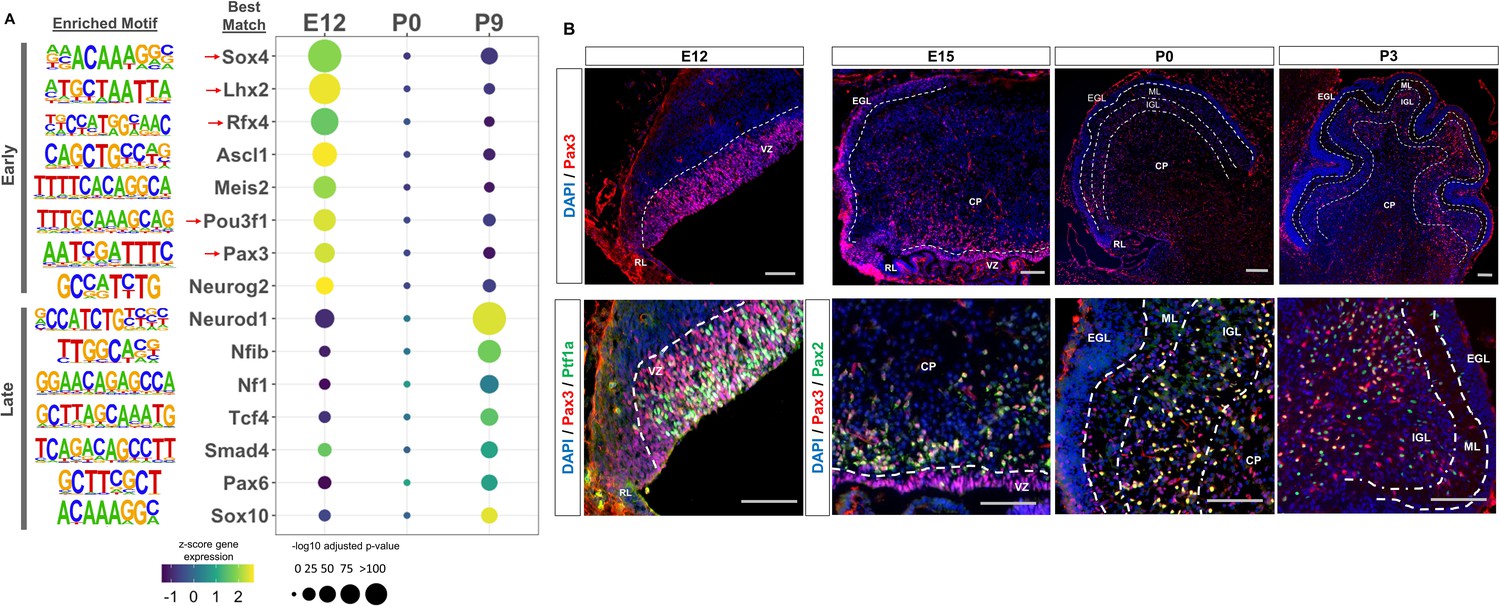
Neural transcription factors with known and novel function in the developing cerebellum are enriched in dynamic cerebellar enhancers.
(A) Dot plot displaying significantly enriched (adjusted p-value <1E-11) motifs and the predicted matching transcription factor (TF). Displayed are the results for Early (top) and Late (bottom) active enhancers. TFs with an unknown functional role in cerebellar development are indicated with a red arrow. Size of the dots indicate the negative log10 adjusted p-value for a given motif and the color scale displays the z-score normalized expression throughout the cerebellar developmental time course. (B) Top: Immunofluorescent staining of Pax3 in the mouse cerebellum at E12, E15, P0, and P3. Bottom: Pax3 and Ptf1a immunofluorescent co-staining of the E12 mouse cerebellum. Immunofluorescent co-staining of Pax3 and Pax2 in the mouse cerebellum at E15 and P0. Labels: CP: Cerebellar parenchyma, EGL: External granular layer, NGL: Nascent granular layer, RL: Rhombic lip, VZ: Ventricular zone, Scalebars = 100 µm.
Figure 3—figure supplement 1
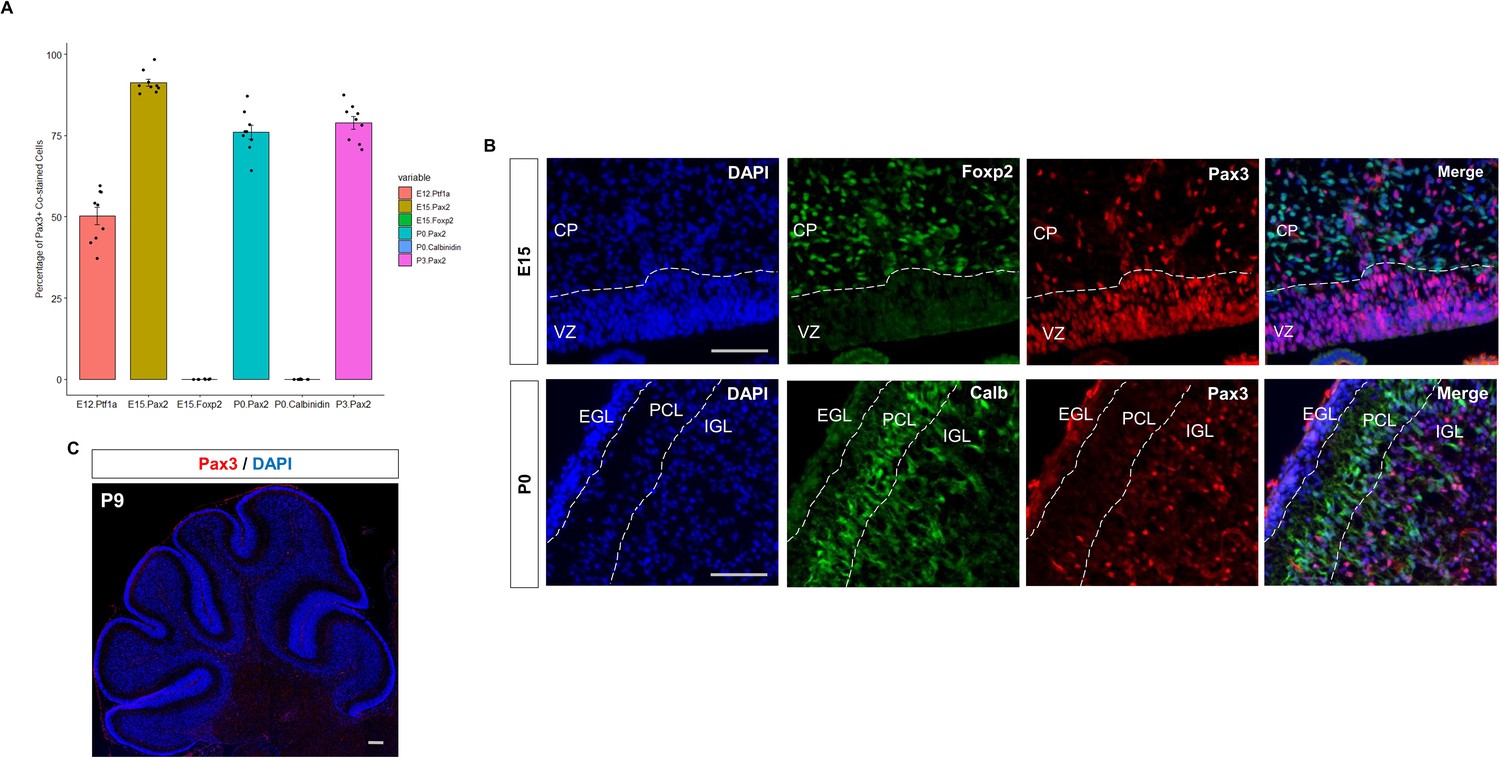
Immunofluorescent analysis of Pax3 expression in the developing mouse cerebellum.
(A) Bar plot showing the percentage of Pax3 + cells co-stained (y-axis) with cerebellar cell markers Pax2, Foxp2 and Calbindin at E12, E15, and P3 (x-axis). (B) Top: Immunofluorescent co-staining of Pax3 (red) and Foxp2 (green) in embryonic cerebellum at E15. Merged image is a composite image of the Pax3, Foxp2, and DAPI. Bottom: Immunofluorescent co-staining of Pax3 (red) and Calb (green) in the postnatal cerebellum at P0. Merged image is a composite image of the Pax3, Foxp2, and DAPI. Labels: VZ: Ventricular zone, EGL: External granular layer, PCL: Purkinje cell layer, ML: Molecular layer, Scalebars = 100 µm. (C) Immunofluorescent staining of Pax3 (red) in the developing cerebellum at P9.
Figure 3—figure supplement 2
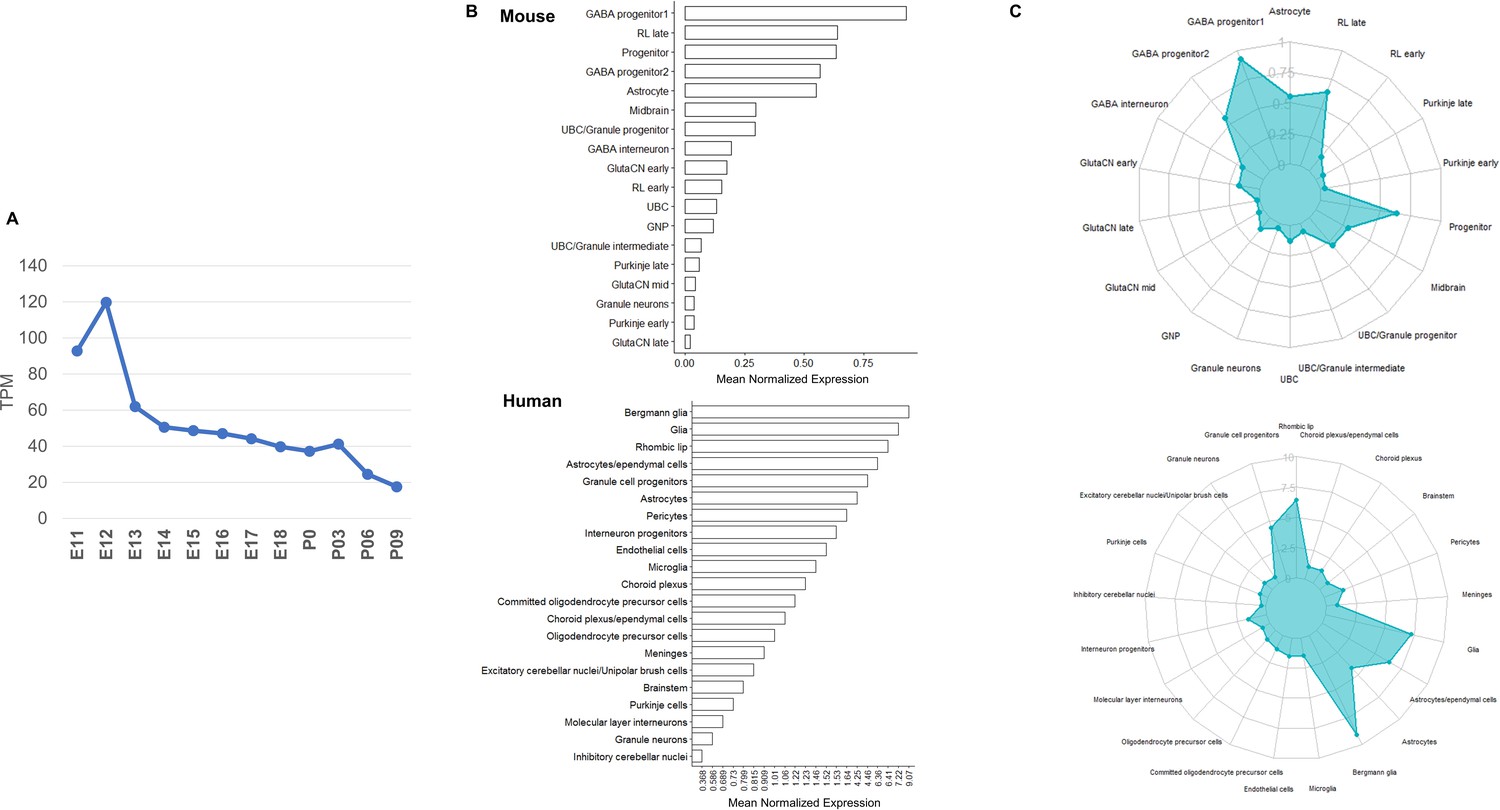
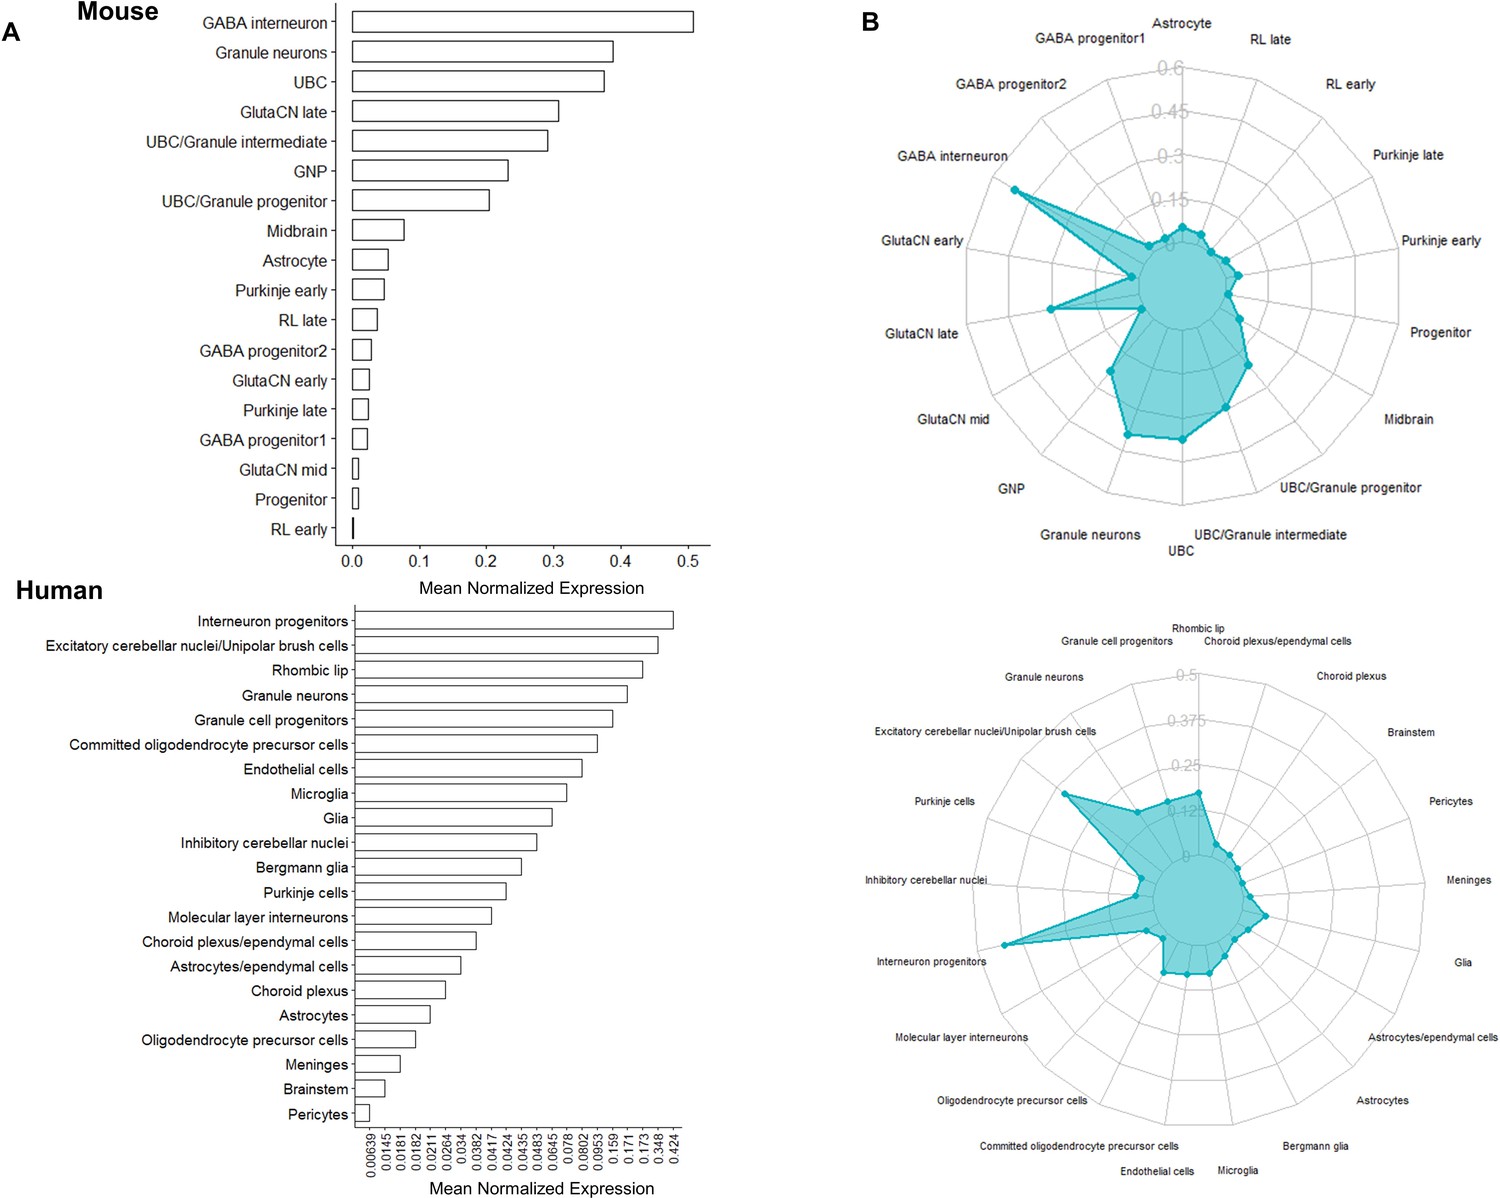
Pax3 expression in the developing mouse and human cerebellum quantified by CAGE-seq and scRNA-seq.
(A) Line plot displaying Pax3 CAGE-seq expression in the developing cerebellum. Y-axis represents normalized expression in transcripts per million (TPM). (B) Bar plots and (C) radar plots displaying mouse (top; Carter et al., 2018) and human (bottom; Aldinger et al., 2021) scRNA-seq average expression of Pax3/PAX3 for cell type clusters defined by cell-type-specific makers. Expression values (x-axis for bar plot, y-axis for radar plot) displayed were calculated based on average normalized expression across all cells within the cell type cluster.
Figure 4 with 2 supplements
Correlated Early target genes are expressed in spatially distinct areas and have diverse roles in cerebellar development.
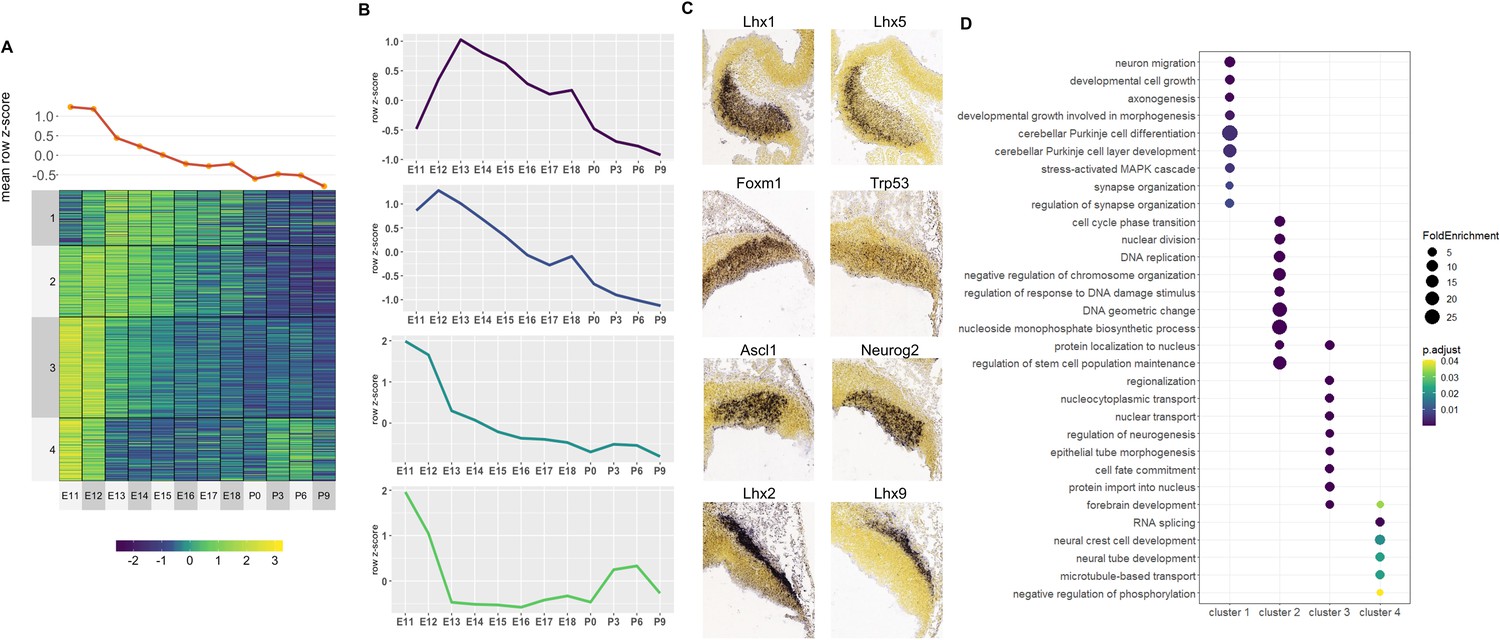
(A) Line plot and heatmap showing mean z-score expression for Early target genes throughout the cerebellar time course. (B) Line graph representation of expression pattern throughout time for each cluster. (C) Known cerebellar genes in each cluster and in situ hybridization (ISH) images showing spatial expression at peak expression ages. ISH images were taken from the Developing Mouse Atlas at E13.5 for clusters 1 and 2, and E11.5 for clusters 3 and 4. (D) Gene Ontology (GO) enrichment analysis of target genes from each cluster, displaying the top enriched GO terms. Size of the dots indicates the observed vs expected fold enrichment of genes within that GO category (FoldEnrichment). Color scale indicates the adjusted p-value for each GO term.
Figure 4—figure supplement 1
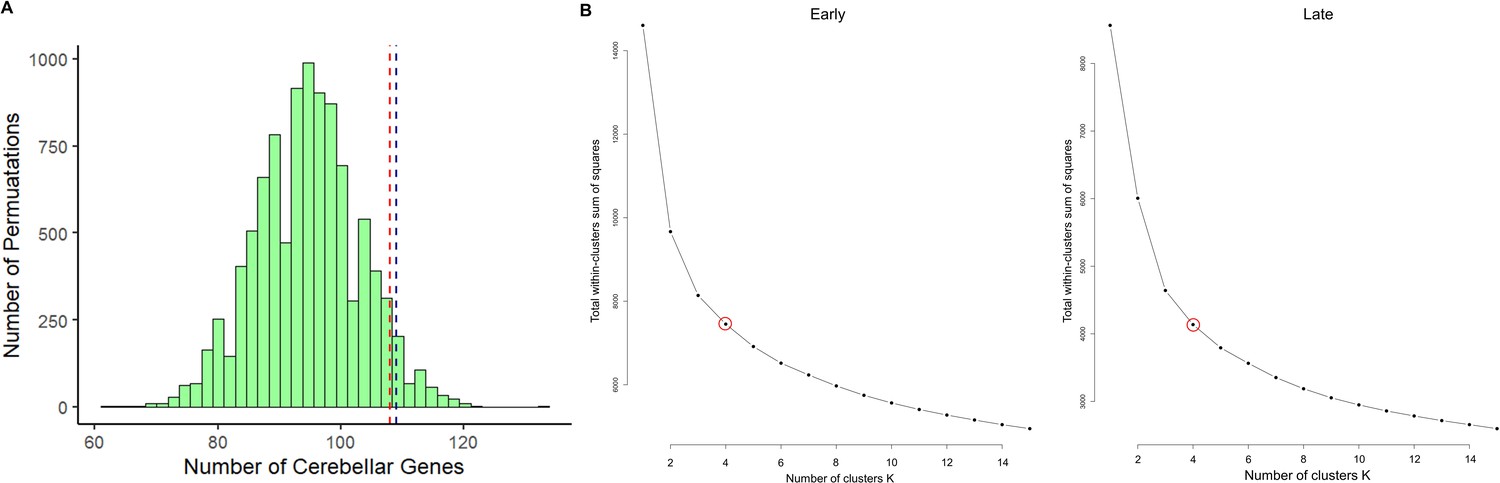
Enrichment analysis of cerebellar genes in robust enhancer target gene list and Elbow anlaysis to determine the optimal k value for k-means clustering.
(A) Histogram plotting the number of permutations (y-axis) of 2064 genes expressed in the cerebellum against the number of cerebellar genes found within a randomly generated list of genes. The red line represents the number of cerebellar genes with a p-value of 0.05 and the blue line represents the number of cerebellar genes found in the list of putative target genes for robust cerebellar enhancers (p-value 0.04). (B) Line plot from an Elbow analysis to determine the optimal k-value for the k-means clustering analysis of putative target genes. Y-axis represents the total within-clusters sum of squares and the x-axis represents the number of clusters (k-value).
Figure 4—figure supplement 2
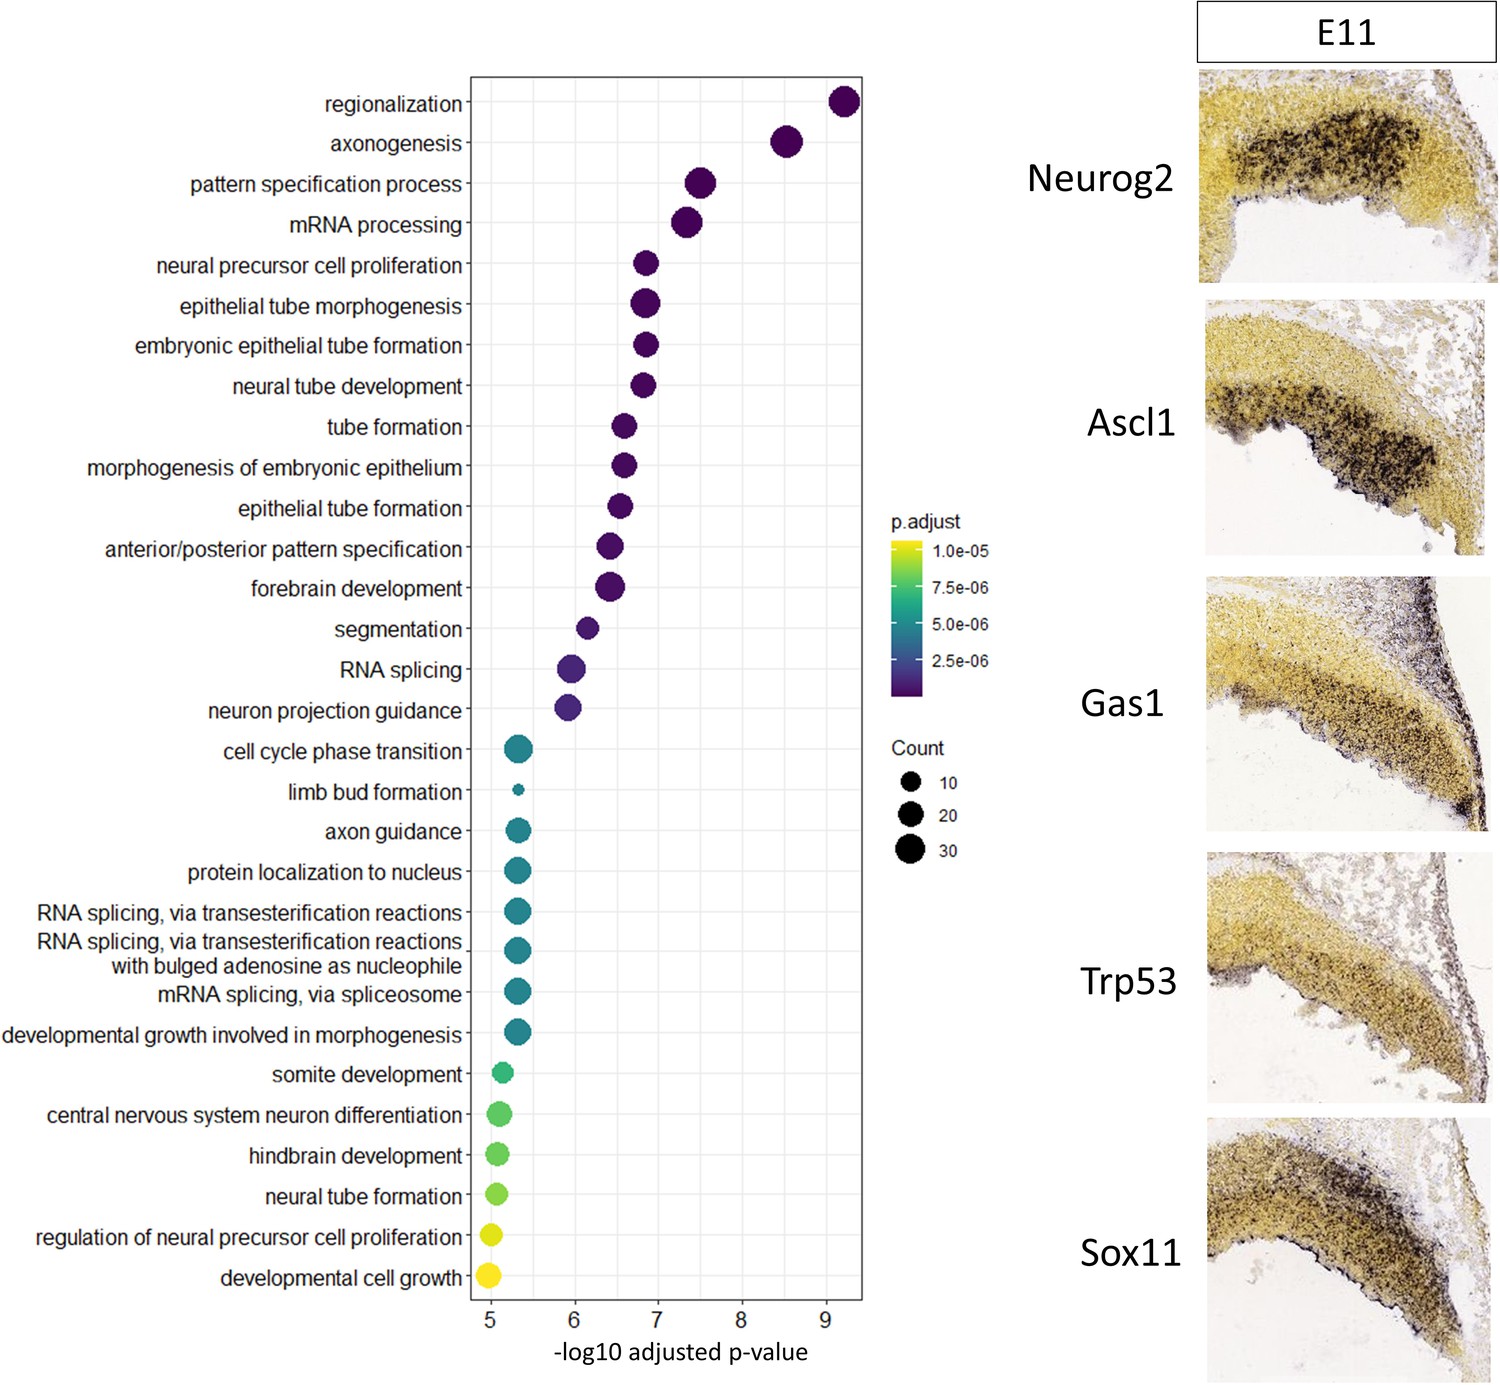
Putative target genes of robust cerebellar enhancers containing Pax3 DNA binding motifs regulate neural progenitor function.
Left: Gene Ontology (GO) enrichment analysis of all target genes of Early active robust cerebellar enhancers containing Pax3 DNA-binding motifs, displaying the top enriched GO terms. Size of the dots indicates the number of target genes in the corresponding GO category and the x-axis represents the -log10 adjusted p-value for each GO term. Color scale indicates the adjusted p-value for each GO term. Right: In situ hybridization (ISH) showing spatial expression at E11 of Pax3 enhancer putative target genes previously associated with cerebellar development. ISH images were taken from the Developing Mouse Atlas provided by the Allen Brain Atlas.
Figure 5
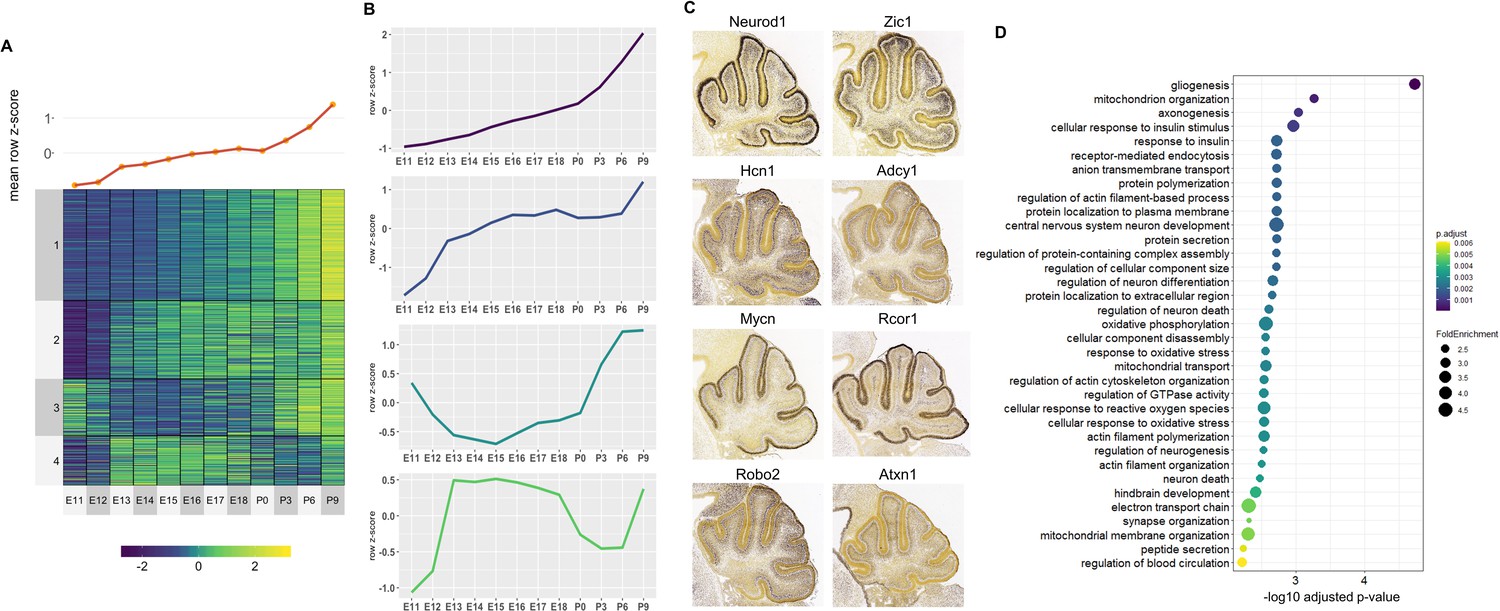
Correlated Late target genes are expressed in developing granule cells or Purkinje cells with common roles in cerebellar development.
(A) Line plot and heatmap showing mean z-score expression throughout the cerebellar time course. (B) Line plot representation of expression pattern throughout time for each cluster. (C) Known cerebellar genes in each cluster and in situ hybridization showing spatial expression at peak expression ages. ISH images were taken from the Developing Mouse Atlas provided by the Allen Brain Atlas conducted at P4.5 for all clusters. (D) Gene Ontology (GO) enrichment analysis of all target genes of Late active enhancers, displaying the top enriched GO terms. Size of the dots indicates the observed vs expected fold enrichment of genes within that GO category (FoldEnrichment) and the x-axis represents the -log10 adjusted p-value for each GO term. Color scale indicates the adjusted p-value for each GO term.
Figure 6 with 2 supplements
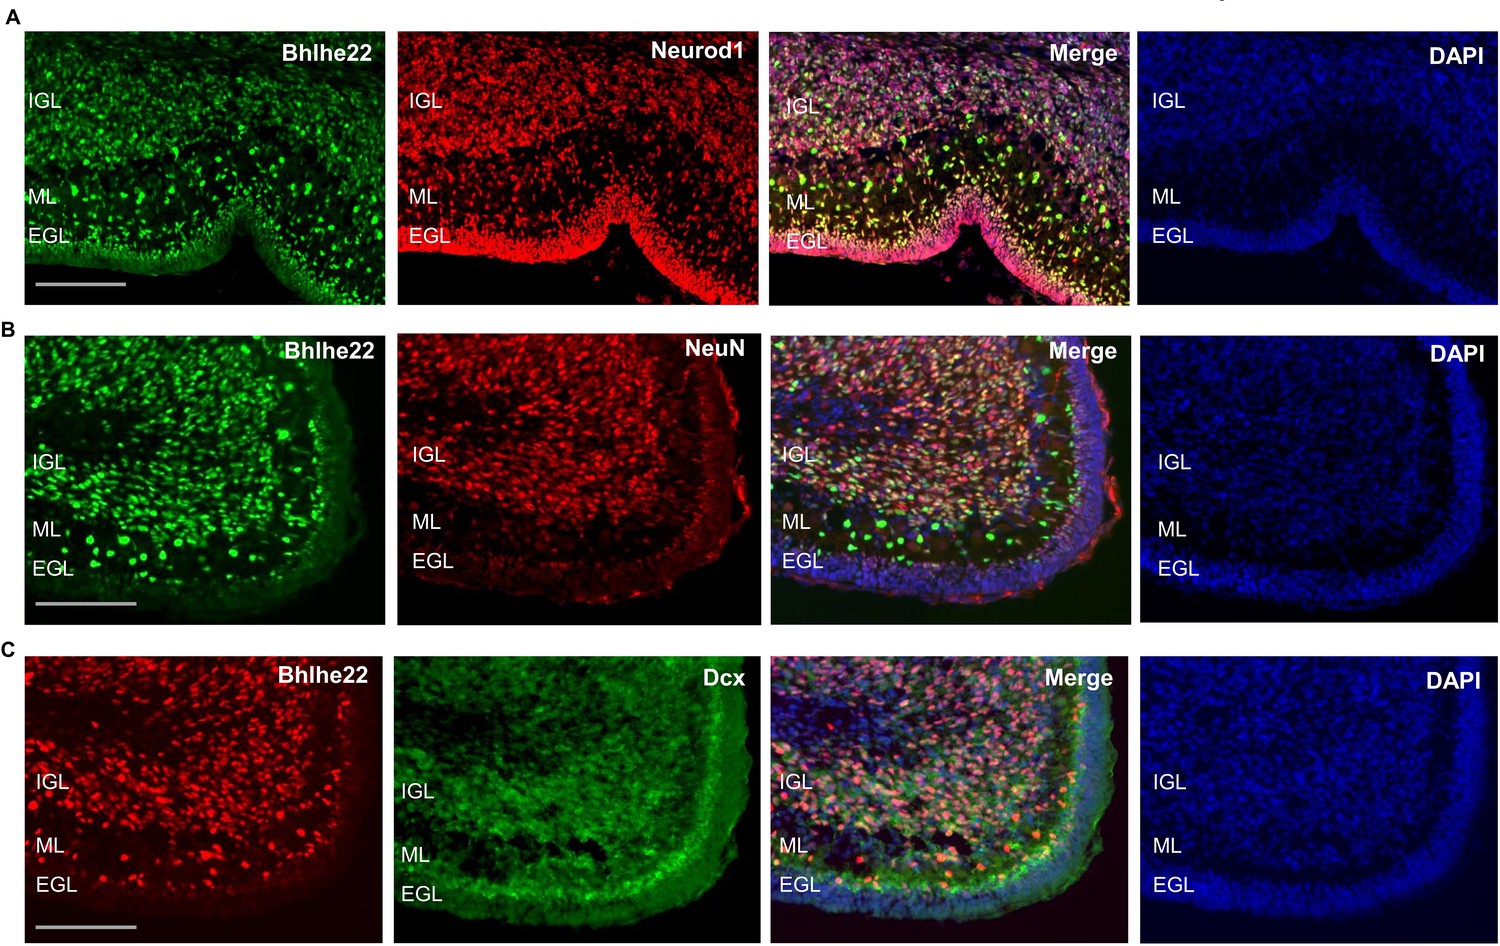
Bhlhe22 is expressed in differentiating granule cells in postnatal cerebellar development.
(A) Bhlhe22 (green) and Neurod1 (red) immunofluorescent co-staining at P9.5 of taken from a posterior lobe IX. (B) Bhlhe22 (green) and NeuN (red) immunofluorescence co-staining at P6 taken from posterior lobe IX. (C) Bhlhe22 (red) and Dcx (green) immunofluorescent co-staining at P6 showing the posterior lobe IX; Labels: EGL = external granular layer IGL = internal granular layer, ML = molecular layer, Scalebars = 100 µm.
Figure 6—figure supplement 1
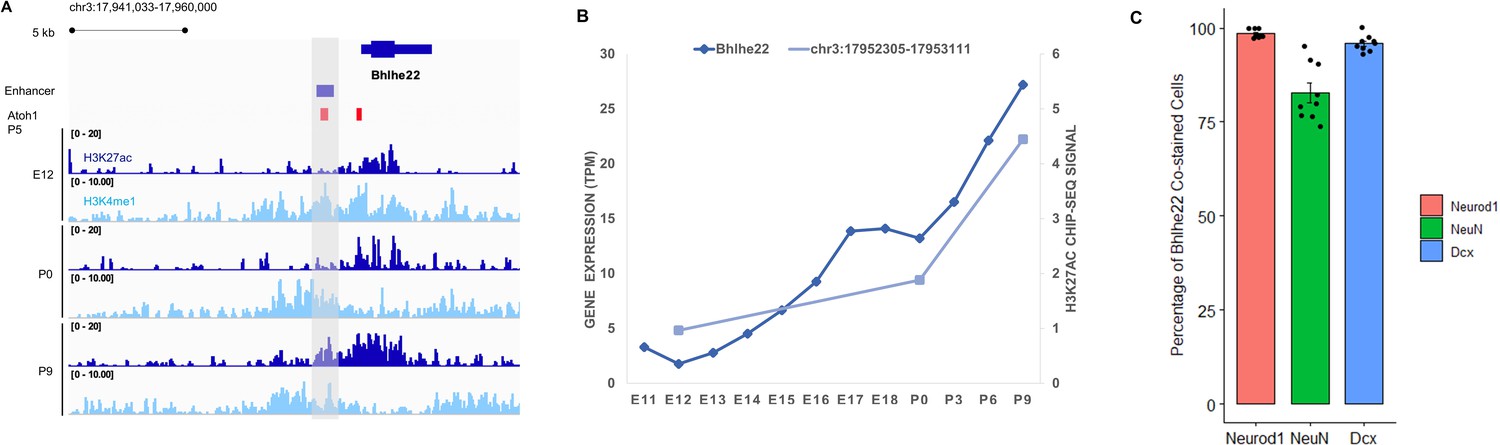
Transcription factor Bhlhe22 is expressed in the granule cell layer during cerebellar development.
(A) The Bhlhe22 locus (chr3:17,941,033–17,960,000) in IGV showing H3K27ac and H3K4me1 profiles across biological replicates of E12, P0, P9 cerebella. The predicted Bhlhe22 enhancer is highlighted (gray box). (B) Whole-cerebellum transcription profile of Bhlhe22 during cerebellar development based on CAGE-seq data. The y-axis shows expression level in tags per million (TPM). (C) Bar plot showing the percentage of Bhlhe22 +co-stained cells (y-axis) with granule cell markers Neurod1 and NueN as well as with migration cell marker Dcx.
Figure 6—figure supplement 2
Bhhe22 expression in the developing mouse and human cerebellum quantified by scRNA-seq.
(A) Bar plots and (B) radar plots displaying mouse (top; Carter et al., 2018) and human (bottom; Aldinger et al., 2021) scRNA-seq average expression of Bhlhe22/BHLHE22 for cell type clusters defined by cell-type specific makers. Expression values (x-axis for bar plot, y-axis for radar plot) displayed were calculated based on average normalized expression across all cells within the cell type cluster.
Figure 7
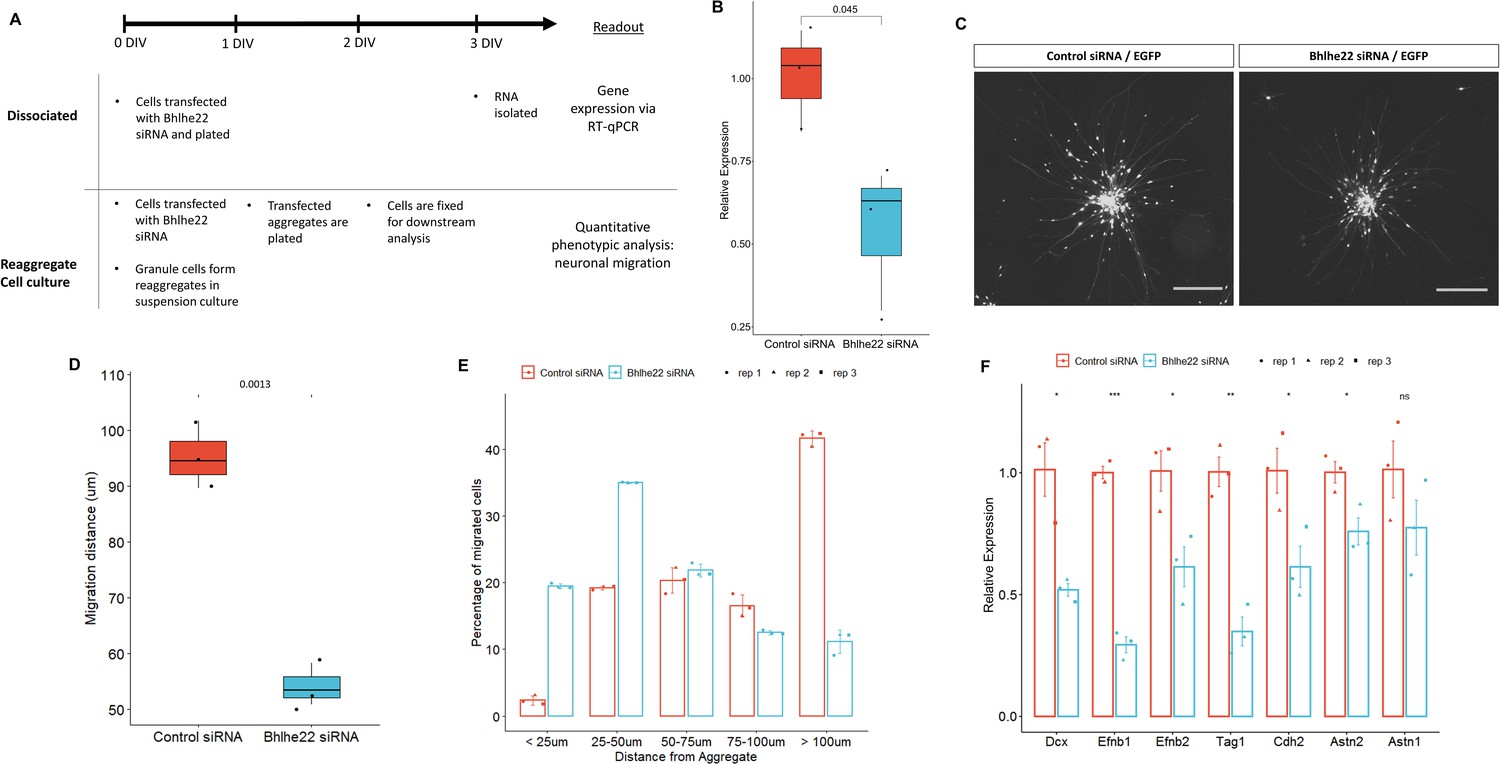
Knockdown of Bhlhe22 reduces migration of cultured cerebellar granule cells.
(A) Workflow for dissociated and reaggregate postnatal granule cell cultures. (B) RT-qPCR analysis of Bhlhe22 gene expression in dissociated postnatal granule cell cultures after treatment with Bhlhe22 siRNA. Gene expression was normalized relative to the expression of the co-transfected EGFP protein to account for transfection variability between cultures. Data are presented as mean ± SD (n=3). (C) Image of cultured cerebellar granule cell reaggregates treated with control and Bhlhe22 siRNA. Shown are EGFP-positive cells indicating successful transfection. Scalebars = 100 µm. (D) Box plot displaying mean distance of granule cell migration from the aggregate. Value above indicates a statistical difference between control cultures and those treated with Bhlhe22 siRNA (p-value = 0.0013). (E) Bar plot showing the percentage of cells migrated at different distances from the aggregate for control and Bhlhe22 siRNA-treated cerebellar granule cell cultures. (F) RT-qPCR analysis of gene expression of cell adhesion molecules in dissociated postnatal granule cell cultures after treatment with Bhlhe22 siRNA. Gene expression was normalized relative to the expression of the co-transfected EGFP protein to account for transfection variability between cultures. Data are presented as mean ± SD (n=3). Symbols: *: p ≤ 0.05, **: p ≤ 0.01, ***: p ≤ 0.001, which indicate statistical differences observed between Bhlhe22 siRNA-treated samples and controls. All error bars represent the standard error of the mean,.
Figure 8 with 3 supplements
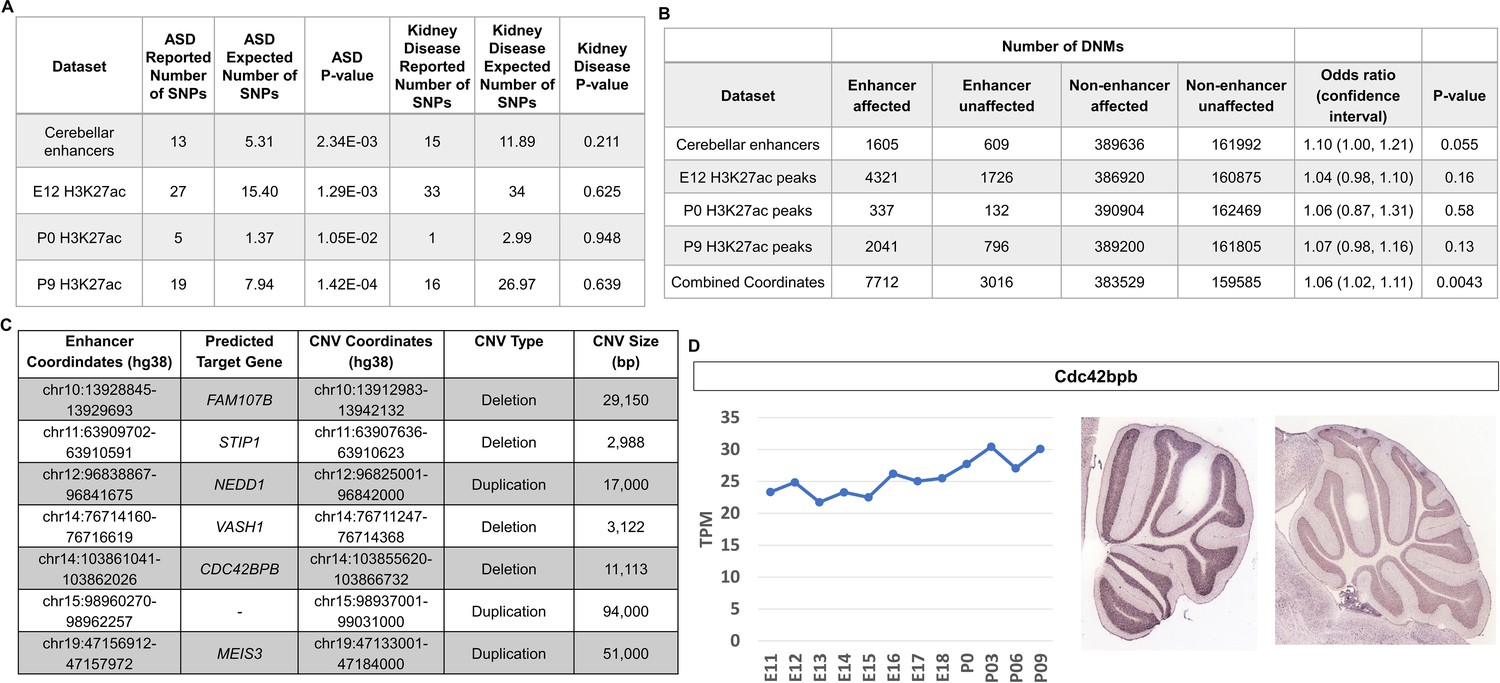
Cerebellar enhancers are enriched for GWAS SNPs and DNMs associated with ASD.
(A) Enrichment analysis of ASD-associated and chronic kidney disease associated (negative control) GWAS variants in cerebellar enhancers and H3K27ac peaks called from E12, P0, and P9 samples. (B) Enrichment of de novo single nucleotide variants and indels in ASD-affected individuals compared with their unaffected siblings. Counts are not equal to the sum of the four enhancer types because some enhancers are categorized as more than one type. (C) Gene targets for enhancers overlapped by de novo CNVs in the SSC cohort. (D) Left: Line graph representing Cdc424bpb normalized expression in the developing mouse cerebellum from E11 to P9. TPM = transcripts per million. Right: In situ hybridization showing Cdc42bpb expression in the lateral (left) and medial (right) adult mouse cerebellum (Developing Mouse Brain Atlas). Note expression is found in granule cells, particularly those of the lateral cerebellum.
Figure 8—figure supplement 1
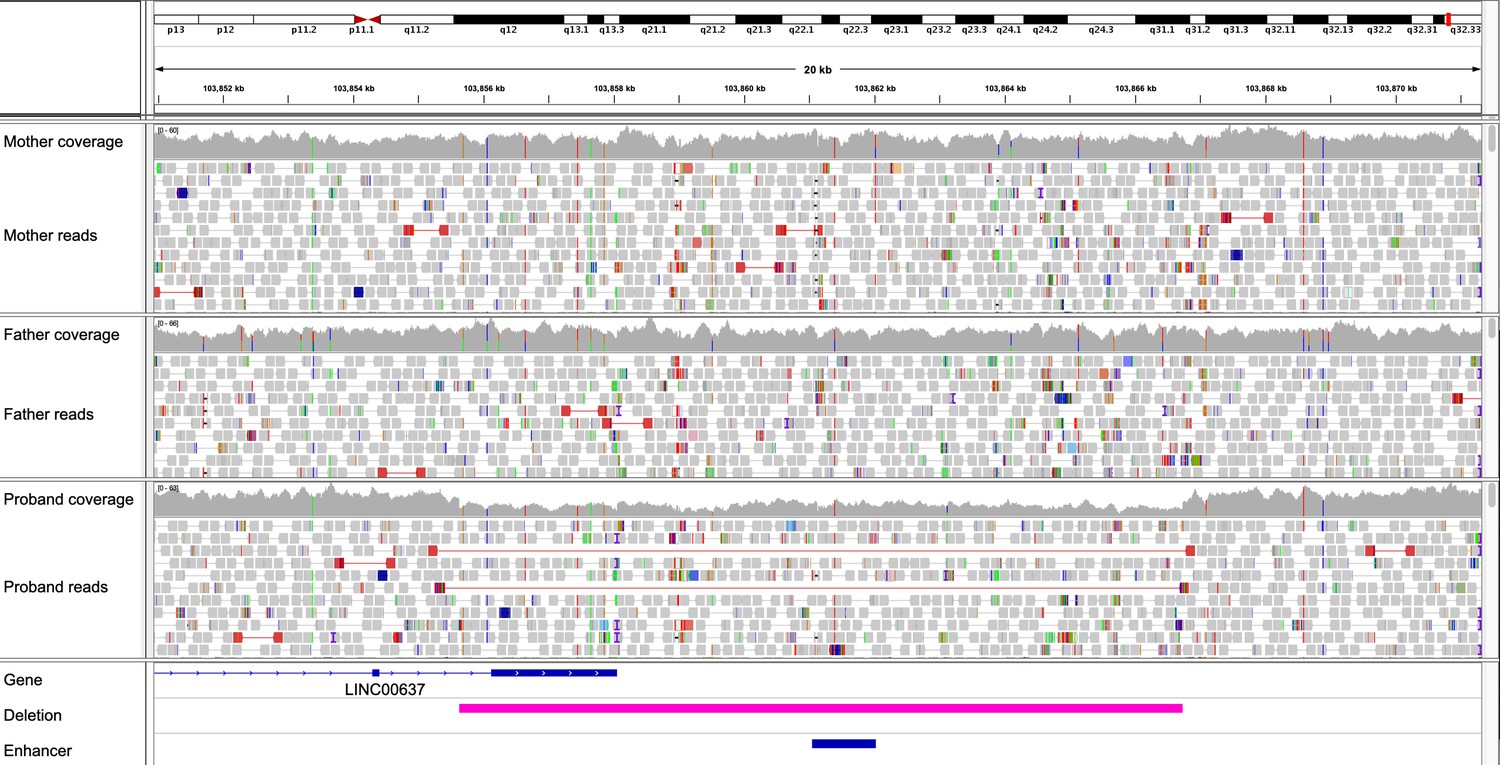
Integrative Genomics Viewer visualization of a de novo 11 kb deletion overlapping an enhancer predicted to target the CDC42BPB gene.
Evidence supporting the correctness of the deletion in the proband includes the 50% drop in read depth, along with read pairs mapping further apart than expected (red lines). No such evidence was observed in either parent. The regions spanned by the enhancer and the deletion are indicated at the bottom.
Figure 8—figure supplement 2
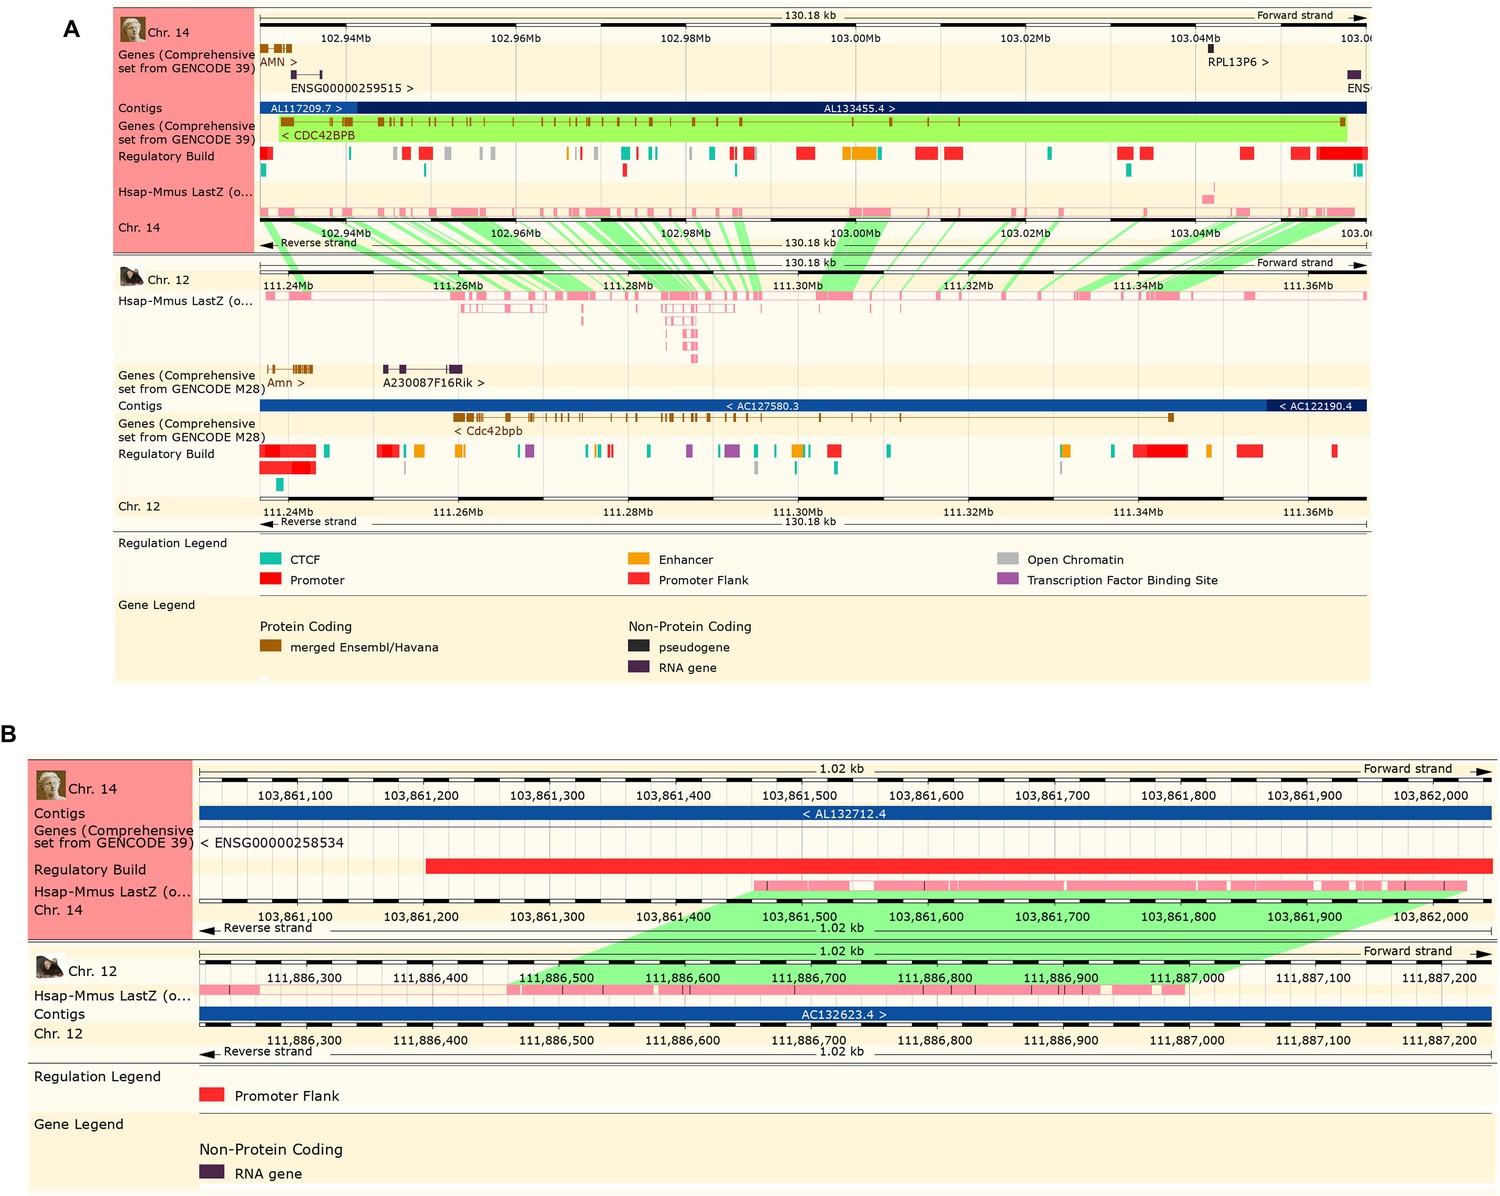
Sequence alignment between mouse and humans for CDC42BPB and an enhancer element predicted to regulated CDC42BPB expression.
(A) Ensembl browser screenshot depicting the sequence alignment of CDC42BPB between humans and mouse showing a conservation of coding sequence. (B) Ensembl browser screenshot showing sequence alignment of the CDC42BPB predicted enhancer between mouse and humans. Sequence alignment can be found between these two genomes at indicating conservation and that enhancer activity may occur at orthologous regions.
Figure 8—figure supplement 3
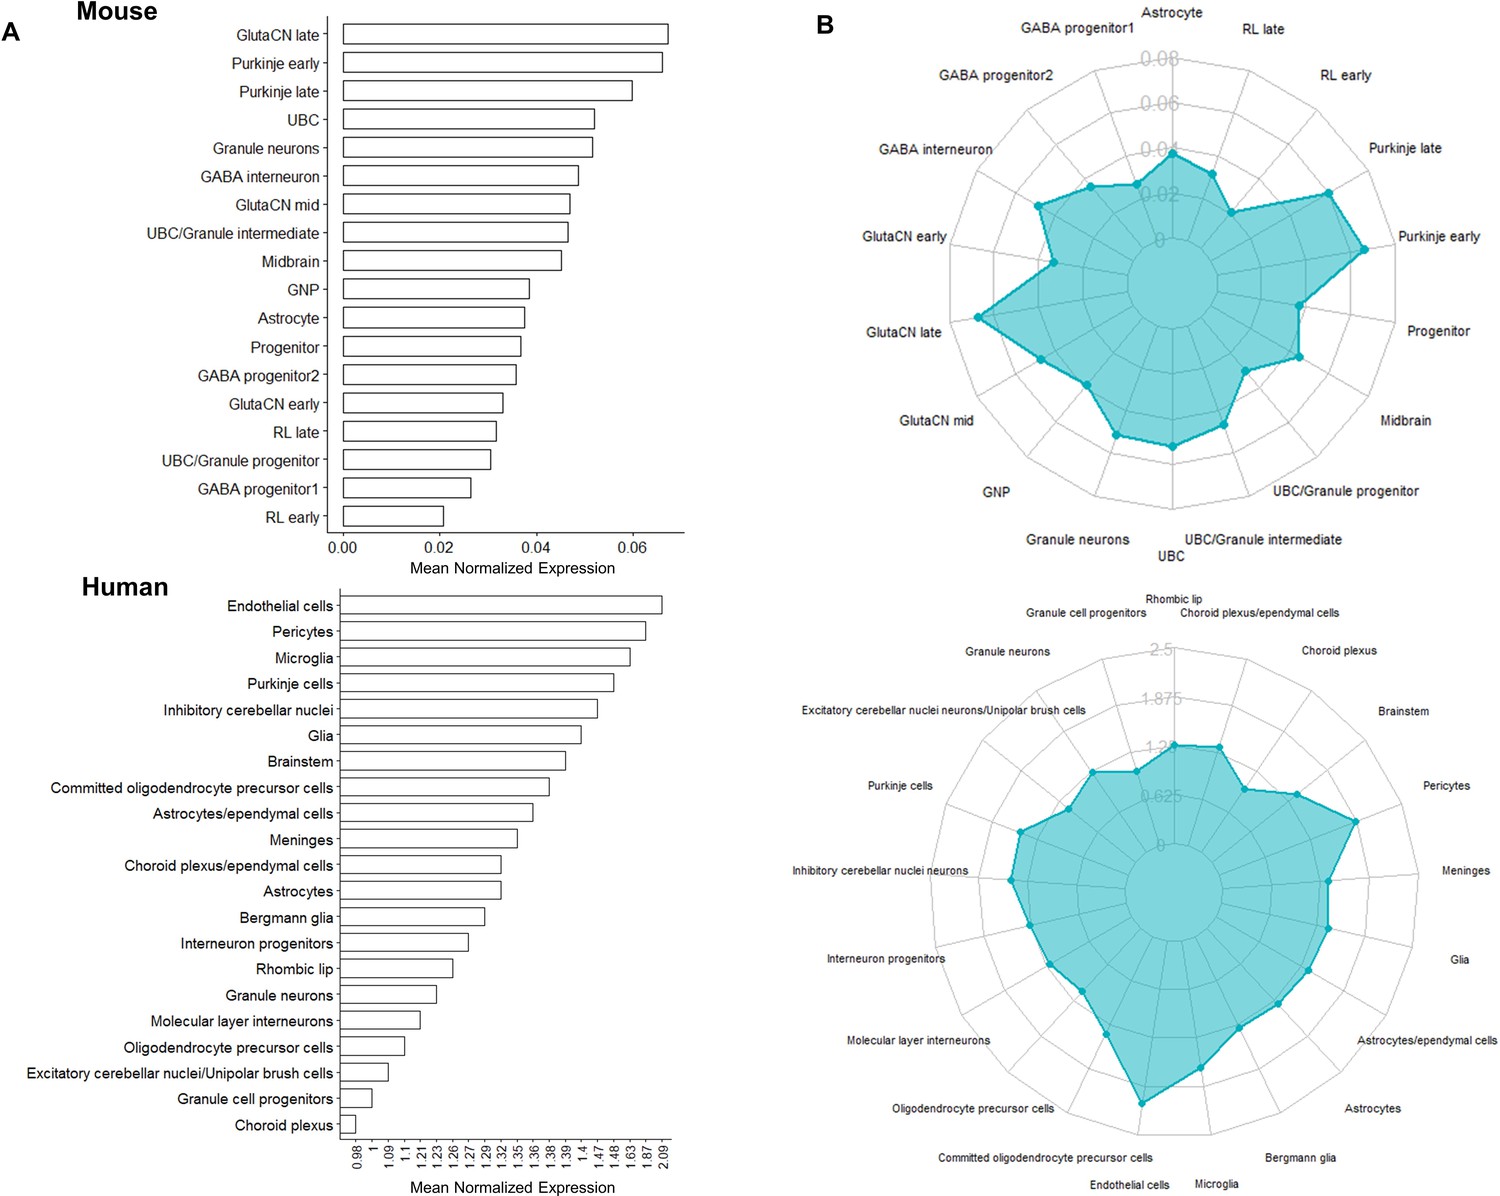
Cdc42bpb expression in the developing mouse and human cerebellum quantified by scRNA-seq.
(A) Bar plots and (B) radar plots displaying mouse (top; Carter et al., 2018) and human (bottom; Aldinger et al., 2021) scRNA-seq average expression of Cdc42bpb/CDC42BPB for cell type clusters defined by cell-type-specific makers. Expression values (x-axis for bar plot, y-axis for radar plot) displayed were calculated based on average normalized expression across all cells within the cell type cluster.
Tables
Table 1
A list of enhancer-regulated target genes from Late Cluster 1 found to be significantly differentially expressed in the conditional Atoh1 knockout mouse.
The second and third column contain the observed P-value and fold change from the differential expression analysis, respectively. The fourth and fifth columns indicate whether the gene has previously been implicated in cerebellar development and the corresponding reference PubMed ID.
| Gene | p-value (Atoh1-null) | Fold Change (Atoh1-null) | Cerebellar Development | Reference (PMID) |
|---|---|---|---|---|
| Neurod1 | 9.196E-229 | 0.2 | X | 19609565 |
| Nfix | 1.1991E-43 | 0.53 | X | 21800304 |
| Zic1 | 1.3082E-37 | 0.35 | X | 21307096 |
| Barhl1 | 2.2505E-35 | 0.22 | X | 9412507 |
| Zic2 | 2.0968E-20 | 0.34 | X | 11756505 |
| Insm1 | 5.4814E-20 | 0.25 | X | 18231642 |
| Tcf4 | 9.9139E-20 | 0.69 | X | 30830316 |
| Nfia | 1.8675E-16 | 0.6 | X | 17553984 |
| Bhlhe22 | 4.7662E-10 | 0.53 | ||
| Purb | 2.5878E-09 | 0.53 | ||
| Neurod2 | 4.424E-09 | 0.37 | X | 11356028 |
| Klf13 | 1.7938E-06 | 0.72 | ||
| Zfp521 | 3.5899E-06 | 0.8 | X | 24676388 |
| Sox18 | 3.7168E-05 | 0.71 | ||
| Nfib | 0.00021009 | 0.63 | X | 17553984 |
Additional files
-
Supplementary file 1
Coordinates in BED file format of all 7024 robust cerebellar enhancers.
- https://cdn.elifesciences.org/articles/74207/elife-74207-supp1-v2.zip
-
Supplementary file 2
Coordinates of Early and Late active robust cerebellar enhancers.
- https://cdn.elifesciences.org/articles/74207/elife-74207-supp2-v2.xlsx
-
Supplementary file 3
Quality control metrics evaluating H3K27ac and H3K4me1 ChIP-seq sensitivity.
Map%: Percentage reads mapped, Filt%: percentage of reads filtered, Dup%: duplication rate, ReadL: read length, FragL:, FRiP%: fraction of reads in peaks, RSC: relative strand correlation.
- https://cdn.elifesciences.org/articles/74207/elife-74207-supp3-v2.xlsx
-
Supplementary file 4
TF motifs enriched in robust cerebellar enhancers.
This table contains the motif symbol, the TF in the JASPAR database that best matches the enriched motif, protein family of the best match TF, percentage of robust cerebellar enhancers and background sequences containing each motif.
- https://cdn.elifesciences.org/articles/74207/elife-74207-supp4-v2.xlsx
-
Supplementary file 5
List of the most highly correlated putative gene targets of robust cerebellar enhancers.
This file contains coordinates of the enhancer, gene target symbol, and Pearson correlation coefficient.
- https://cdn.elifesciences.org/articles/74207/elife-74207-supp5-v2.xlsx
-
Supplementary file 6
Robust cerebellar enhancers containing a Pax3 motif and their putative target genes.
The rightmost column indicates whether the putative target gene has been previously implicated in cerebellar development.
- https://cdn.elifesciences.org/articles/74207/elife-74207-supp6-v2.xlsx
-
Supplementary file 7
Coordinates of mouse robust cerebellar enhancers and putative target genes converted to human genome build hg38.
The rightmost column (‘Orthologous’) indicates whether an enhancer and it’s putative target genes are found on the same chromosome after conversion.
- https://cdn.elifesciences.org/articles/74207/elife-74207-supp7-v2.xlsx
-
Supplementary file 8
Gene targets for enhancers enriched with ASD variants from the GREGOR analysis.
The second column indicates the group to which the gene belongs to in the SFARI gene database of ASD candidate genes. S: Syndromic gene category; 1: Category 1 (High Confidence); 2: Category 2 (Strong Candidate).
- https://cdn.elifesciences.org/articles/74207/elife-74207-supp8-v2.xlsx
-
Supplementary file 9
Primers used for RT-qPCR analysis.
- https://cdn.elifesciences.org/articles/74207/elife-74207-supp9-v2.xlsx
-
Supplementary file 10
GWAS Catalog traits used to identify variants associated with ASD.
All variants associated with these traits were used as input for the ASD variant enrichment analysis conducted using GREGOR.
- https://cdn.elifesciences.org/articles/74207/elife-74207-supp10-v2.xlsx
-
Transparent reporting form
- https://cdn.elifesciences.org/articles/74207/elife-74207-transrepform1-v2.pdf
-
Source code 1
Generate psuedobulk expression values (CPM) by developmental stage.
- https://cdn.elifesciences.org/articles/74207/elife-74207-code1-v2.zip
Download links
A two-part list of links to download the article, or parts of the article, in various formats.
Downloads (link to download the article as PDF)
Open citations (links to open the citations from this article in various online reference manager services)
Cite this article (links to download the citations from this article in formats compatible with various reference manager tools)
Temporal analysis of enhancers during mouse cerebellar development reveals dynamic and novel regulatory functions
eLife 11:e74207.
https://doi.org/10.7554/eLife.74207


