Structure of the human ATM kinase and mechanism of Nbs1 binding
- Structural Biology Program, Memorial Sloan Kettering Cancer Center, United States
- Howard Hughes Medical Institute, Memorial Sloan Kettering Cancer Center, United States
Figures
Figure 1 with 7 supplements

Overall structure of the human ATM kinase.
(A) Domain map of the human ATM kinase showing Spiral (residues 1–1166), Pincer (1167–1898), FAT (1899–2613), Kinase (2614–3026), and FATC (3027–3056) domains. FAT domain is further divided into TRD1 (1899–2025), TRD2 (2026–2192), TRD3 (2193–2479), and HRD (2480–2613) subdomains. Kinase domain is further divided into N-lobe (2614–2770), C-lobe (2771–2957), and PRD (2958–3026) subdomains. (B) Composite cryo-EM density map of ATM kinase colored by approximate domain location. AMP-PNP molecule and Mg2+ ion in the active site colored cyan and gray, respectively. (C) Structure of the overall ATM dimer colored by domain.
Figure 1—figure supplement 1
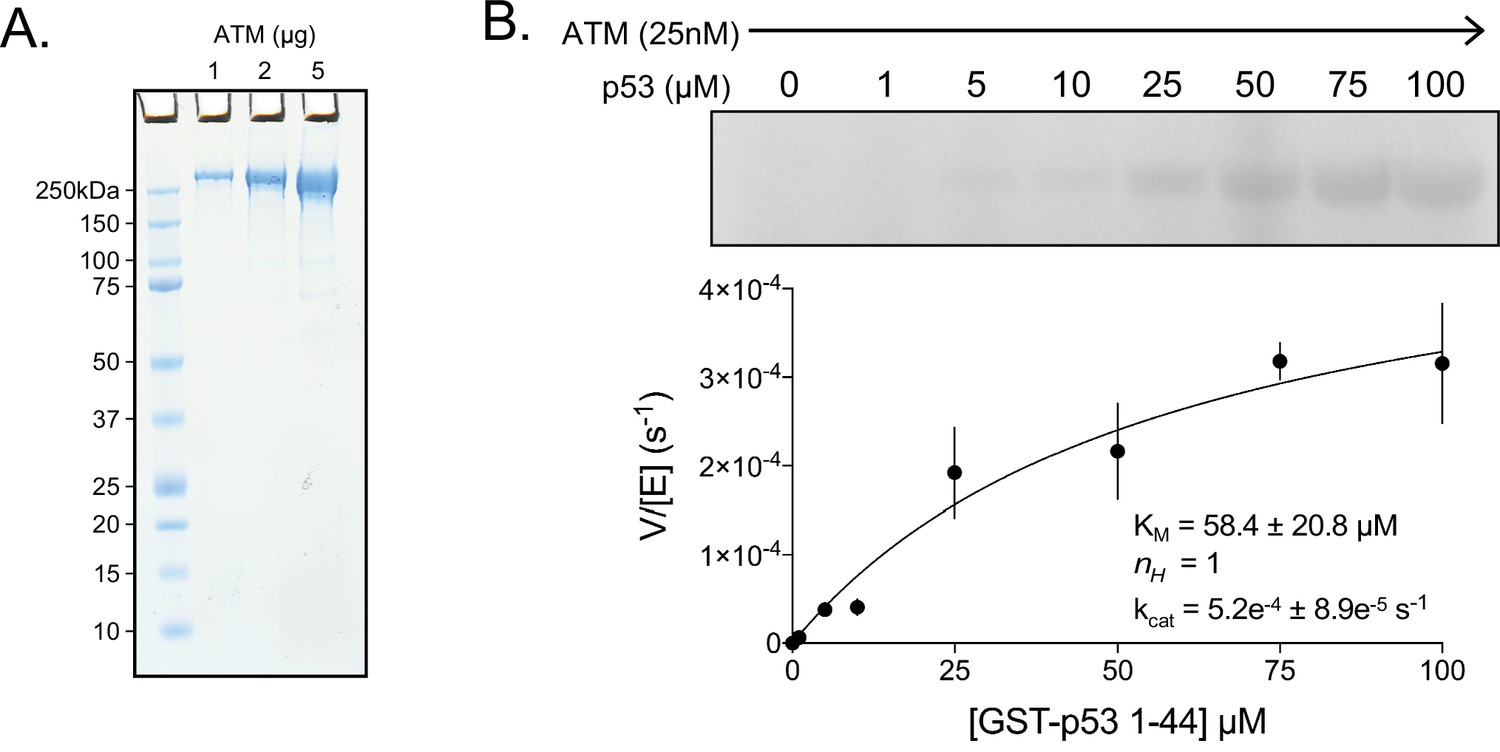
Purification and basal activity of ATM kinase.
(A) SDS-PAGE of purified FLAG-tagged ATM kinase. 1, 2, and 5 µg of protein were run on the gel. (B) Top: Steady-state kinase assay of ATM with various concentrations of GST-tagged p53 N-terminal 44 residue substrate (GST-p53 1–44) with no dsDNA or MRN added. Bottom: Quantification of enzymatic parameters (KM, nH, and kcat) of ATM toward GST-tagged p53 peptide substrate. Three biological replicates per point. Curve fit to the Michaelis-Menten equation.
-
Figure 1—figure supplement 1—source data 1
Figure 1—figure supplement 1A SDS-PAGE of purified ATM kinase.
Figure 1—figure supplement 1B ATM kinase assay without MRN or DNA.
- https://cdn.elifesciences.org/articles/74218/elife-74218-fig1-figsupp1-data1-v2.zip
Figure 1—figure supplement 2
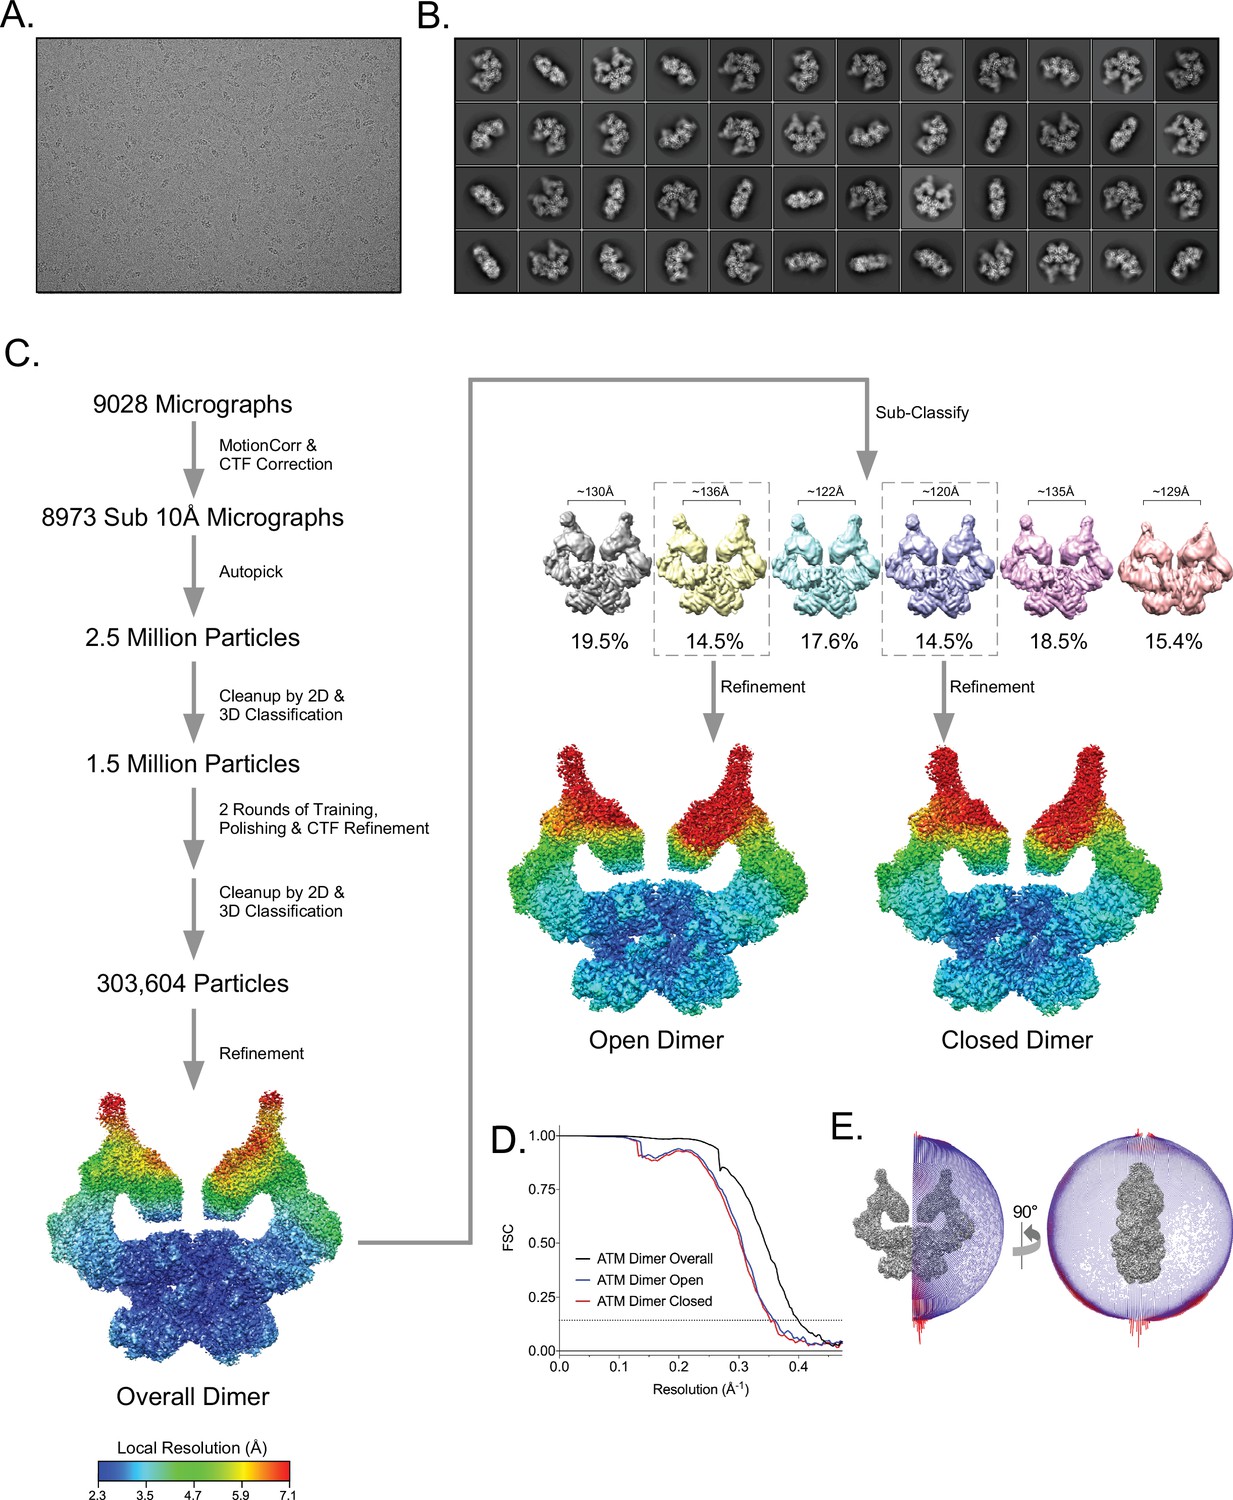
Cryo-EM data processing of the apo ATM sample.
(A) Example micrograph of ATM. (B) Example 2D class averages of ATM. (C) Workflow of ATM cryo-EM data analysis. Rainbow maps are colored by local resolution, color scale at bottom left. (D) Fourier shell correlation (FSC) curves of B-factor sharpened overall, open, and closed ATM dimer maps. Gold-standard resolution threshold (FSC = 0.143) shown as a dashed line. (E) Angular distribution of ATM particles in the overall consensus refinement with C2 symmetry imposed.
Figure 1—figure supplement 3
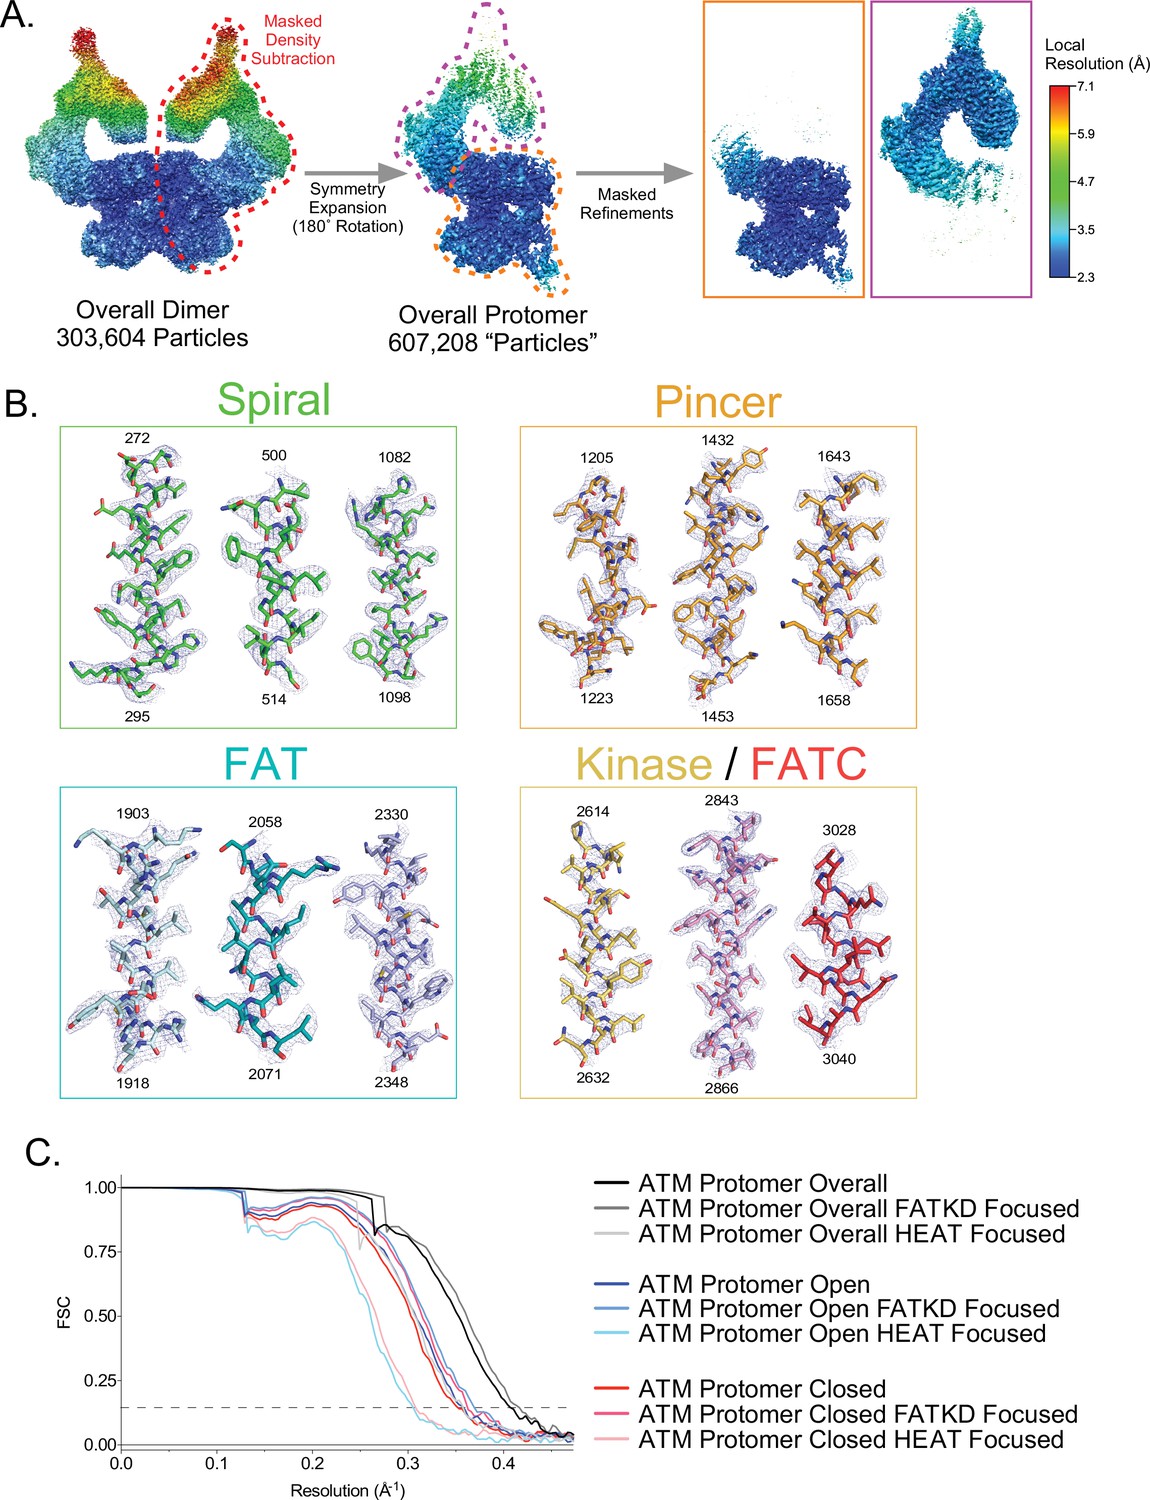
Partial signal subtraction, symmetry expansion, and focused refinement procedure for ATM.
(A) Graphic of the partial signal subtraction, symmetry expansion and focused refinement procedure. FATKD and HEAT-focused refinement maps shown in orange and magenta boxes on right, respectively. All maps colored by local resolution based on the scale on the right. (B) Electron density snapshots of helices within the Spiral, Pincer, FAT, and Kinase/FATC domains. Helices colored according to domain as in Figure 1A. Corresponding residue numbers are displayed at the top and bottom of each helix. All maps are contoured to 7σ. (C) FSC curves of B-factor sharpened overall, open, and closed protomer maps, including FATKD and HEAT focused maps for each. Gold-standard resolution threshold (FSC = 0.143) shown as a dashed line.
Figure 1—figure supplement 4
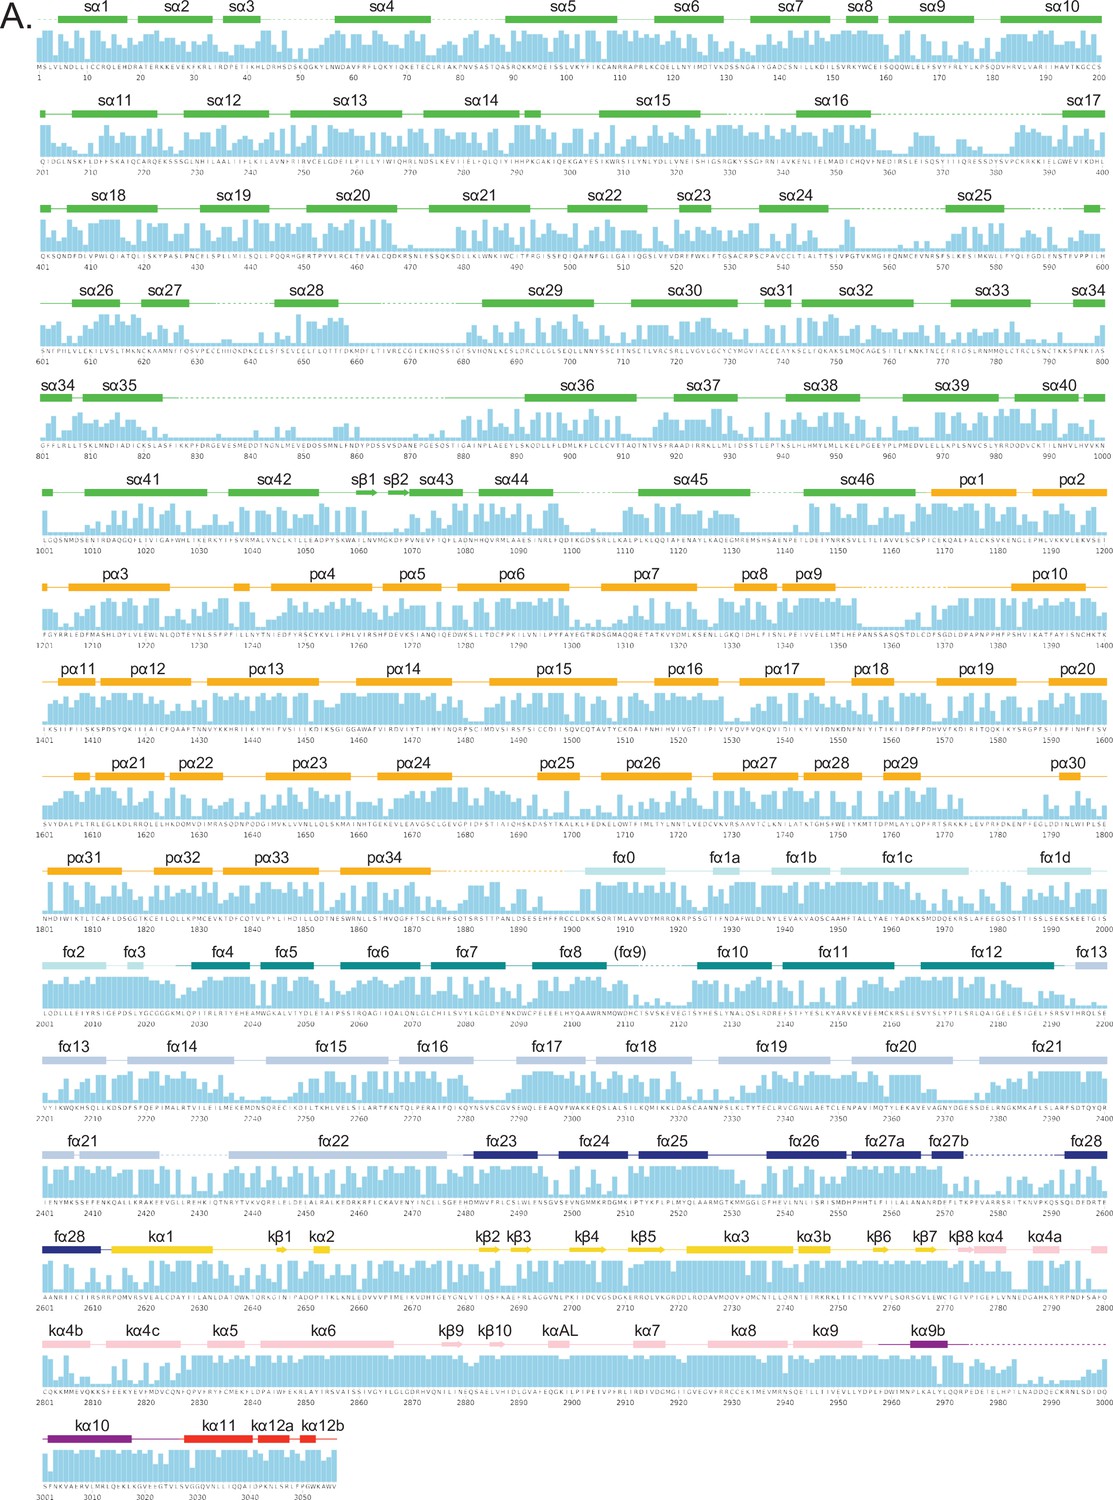
Secondary structure and sequence conservation of human ATM.
(A) Sequence of human ATM kinase showing CONSURF scores as a bar graph for each residue. STRIDE-calculated secondary structures of the overall protomer are mapped onto the sequence. Helices are shown as rectangles, sheets as arrows, and coils as solid lines. Disordered regions not built in our structure are shown as dashed lines. Secondary structures are colored by domain as in Figure 1A and labeled.
Figure 1—figure supplement 5
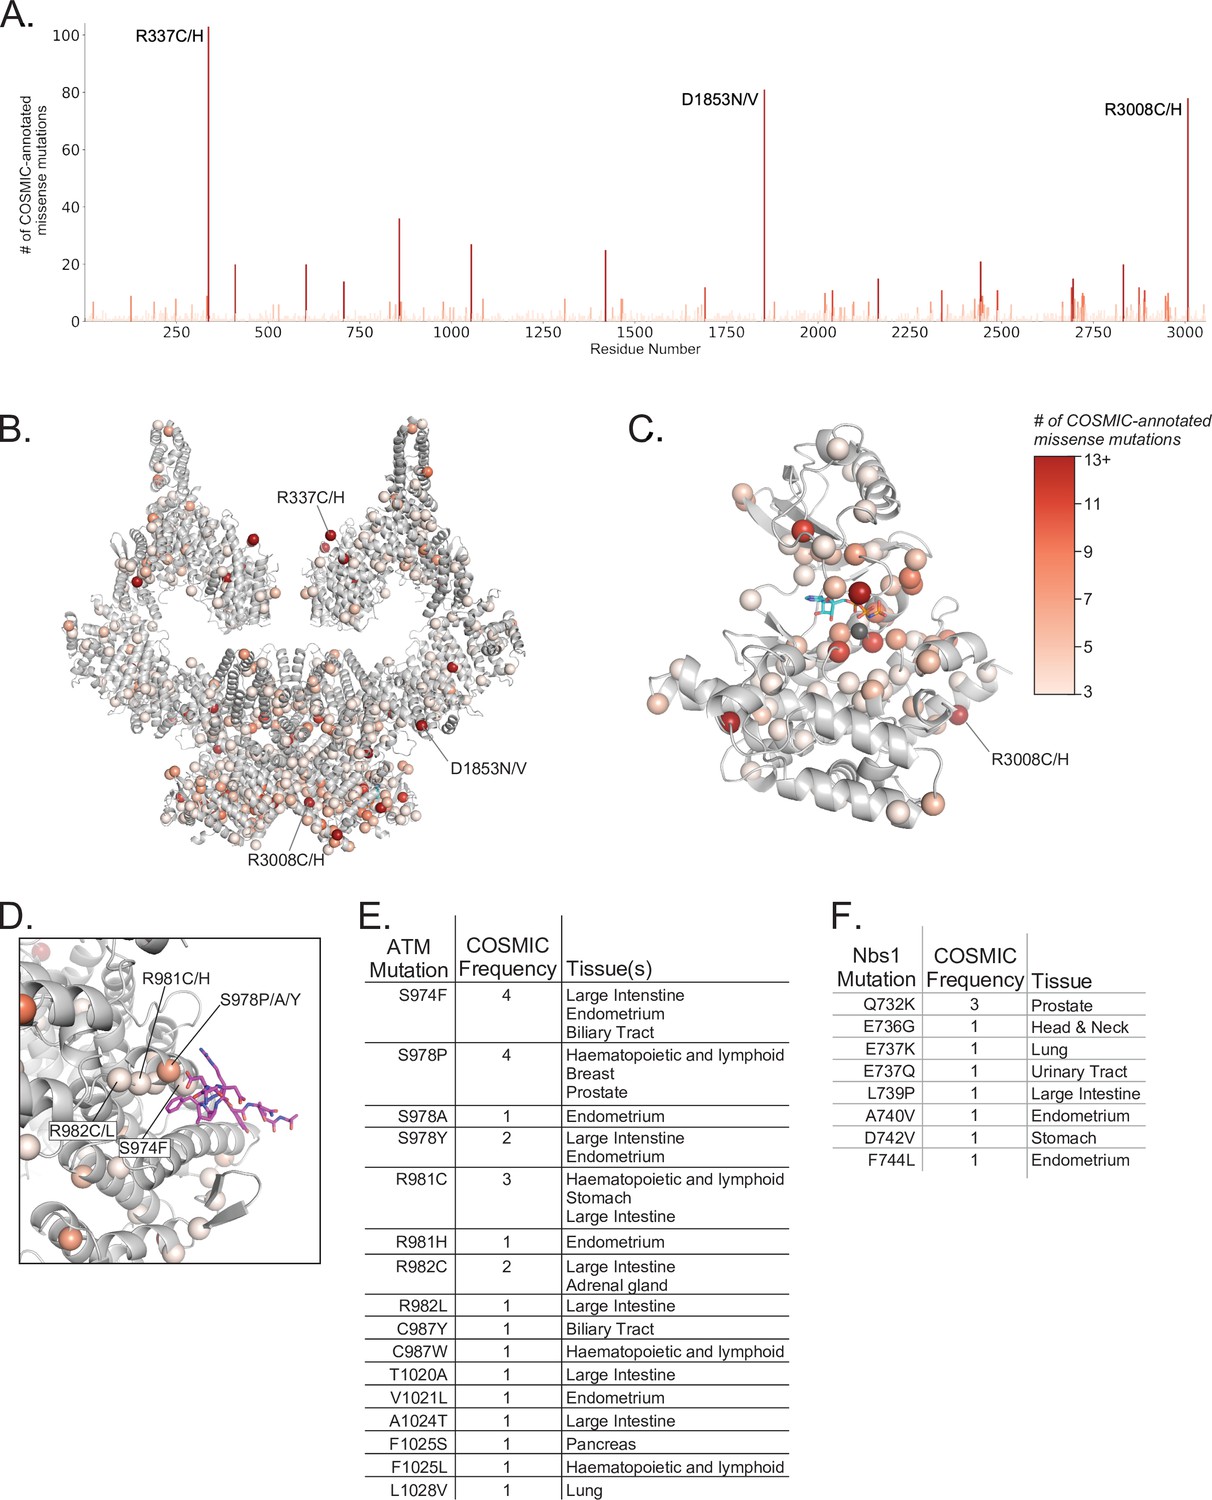
Positions and frequencies of cancer-associated ATM missense mutations.
(A) Positions and frequencies of cancer associated missense mutations from the COSMIC database along the sequence of ATM. The three most prevalent missense mutations are labeled. (B) Positions of cancer associated missense mutations from the COSMIC database mapped onto the overall ATM dimer structure as spheres. Frequencies of each mutation shown by color scale (right of figure). Positions with less than three COSMIC-annotated mutations are not displayed for clarity. (C) Positions and frequencies of cancer associated missense mutations within the ATM kinase domain. AMP-PNP and magnesium ion colored cyan and gray, respectively. (D) Positions and frequencies of ATM cancer associated missense mutations within the Nbs1 binding cleft. Nbs1 C-terminal peptide (Nc28) shown as magenta sticks. Frequent mutations that may impact Nbs1 binding are labeled. (E) Table of ATM missense mutations, frequencies, and associated cancer types that may interfere with Nbs1 binding. (F) Table of all Nbs1 missense mutations, frequencies, and associated cancer types from the C-terminal 28 amino acids.
Figure 1—figure supplement 6
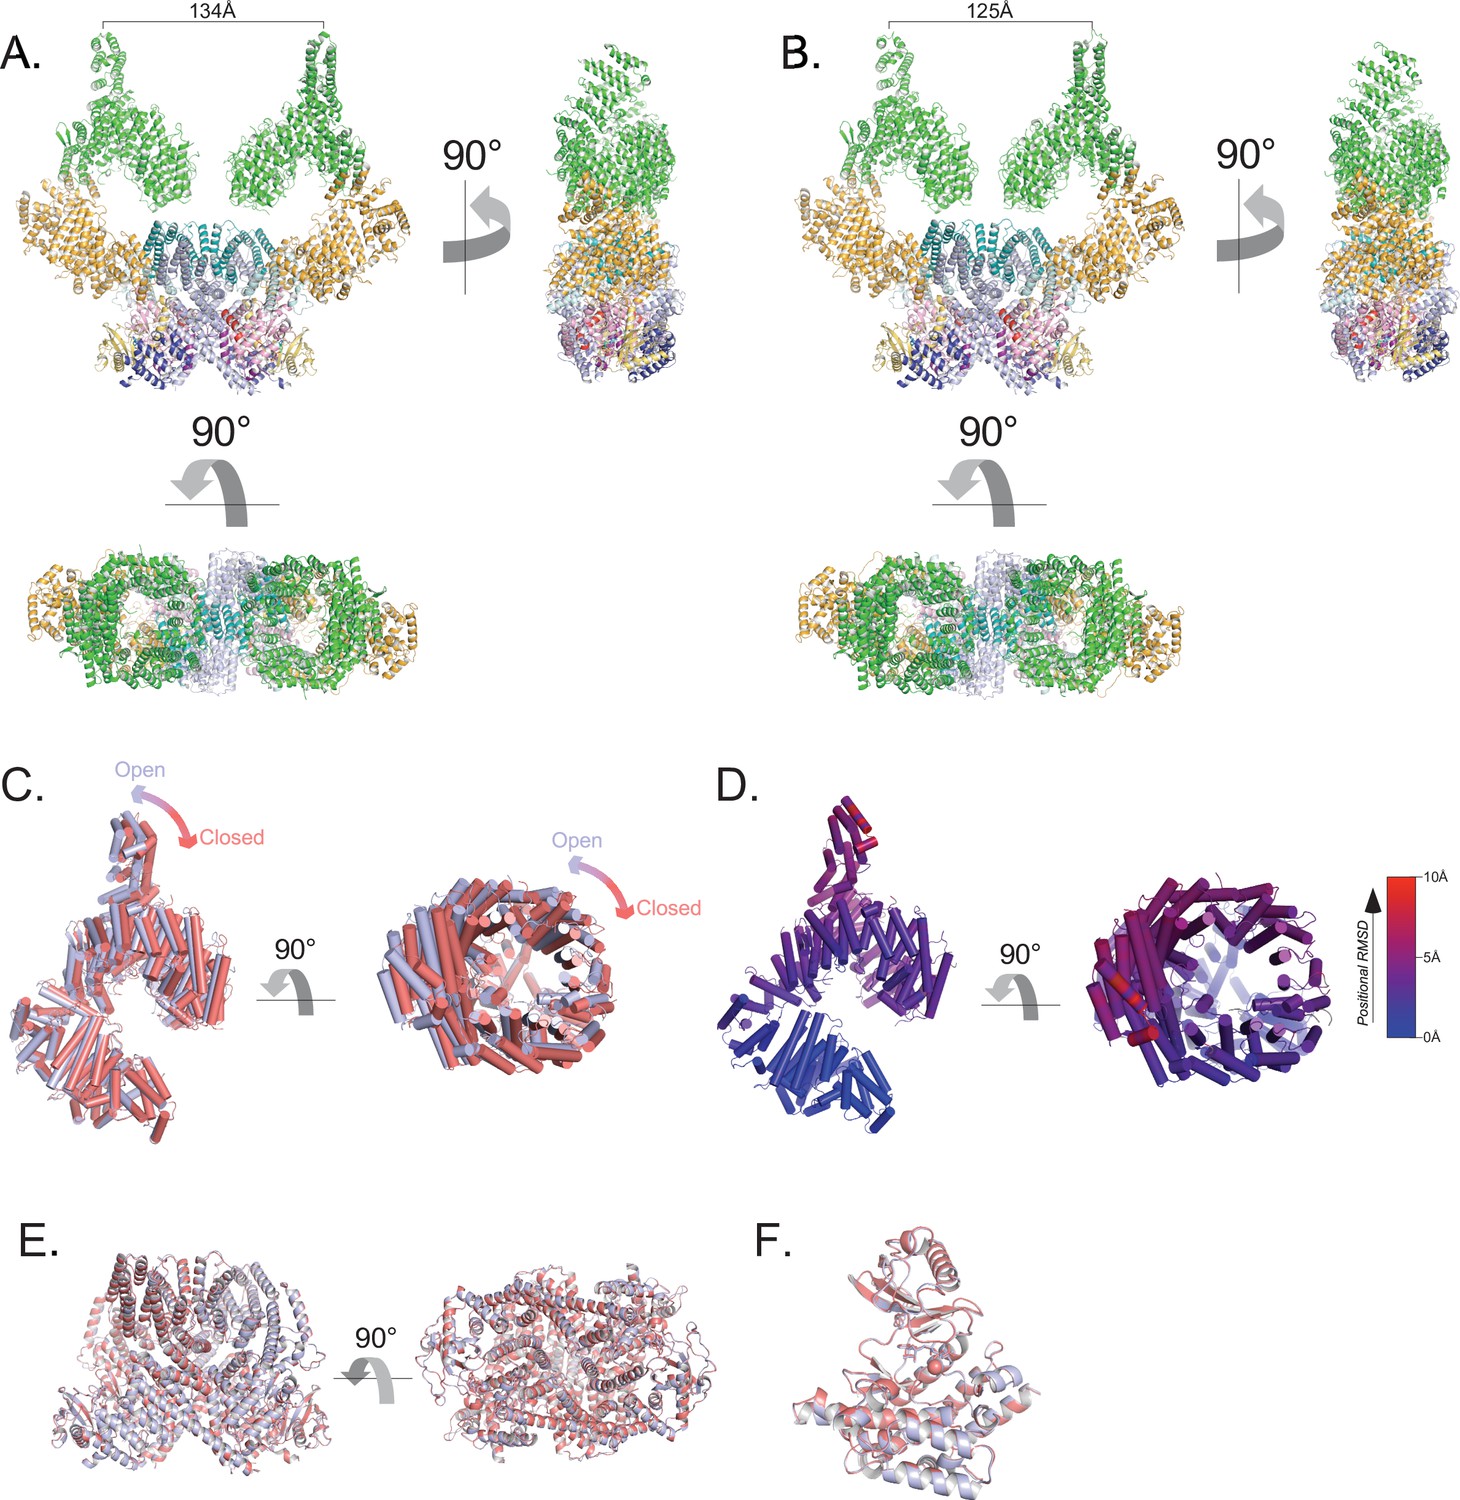
Flexibility of the ATM spiral and pincer domains.
(A) Structure of the most open class of the ATM dimer. Cα-Cα distance between protomers from residue Ile10 on sα1 shown. (B) Structure of the most closed class of the ATM dimer. Cα-Cα distance between protomers from residue Ile10 on sα1 shown. (C) Alignment of the Spiral and Pincer domains of the most open and closed ATM protomers. Open structure is colored light blue, closed structure is colored red. (D) Structure of the Spiral and Pincer domains of the most open ATM protomer colored by Cα positional RMSD (0–10 Å, blue to red) compared to the closed protomer. Generated by the ColorByRMSD PyMOL script. (E) Alignment of the FATKD of the most open and most closed classes. Overall Cα positional RMSD = 0.39 Å. (F) Alignment of the kinase domains of the most open and closed classes. Overall Cα positional RMSD = 0.24 Å.
Figure 1—figure supplement 7
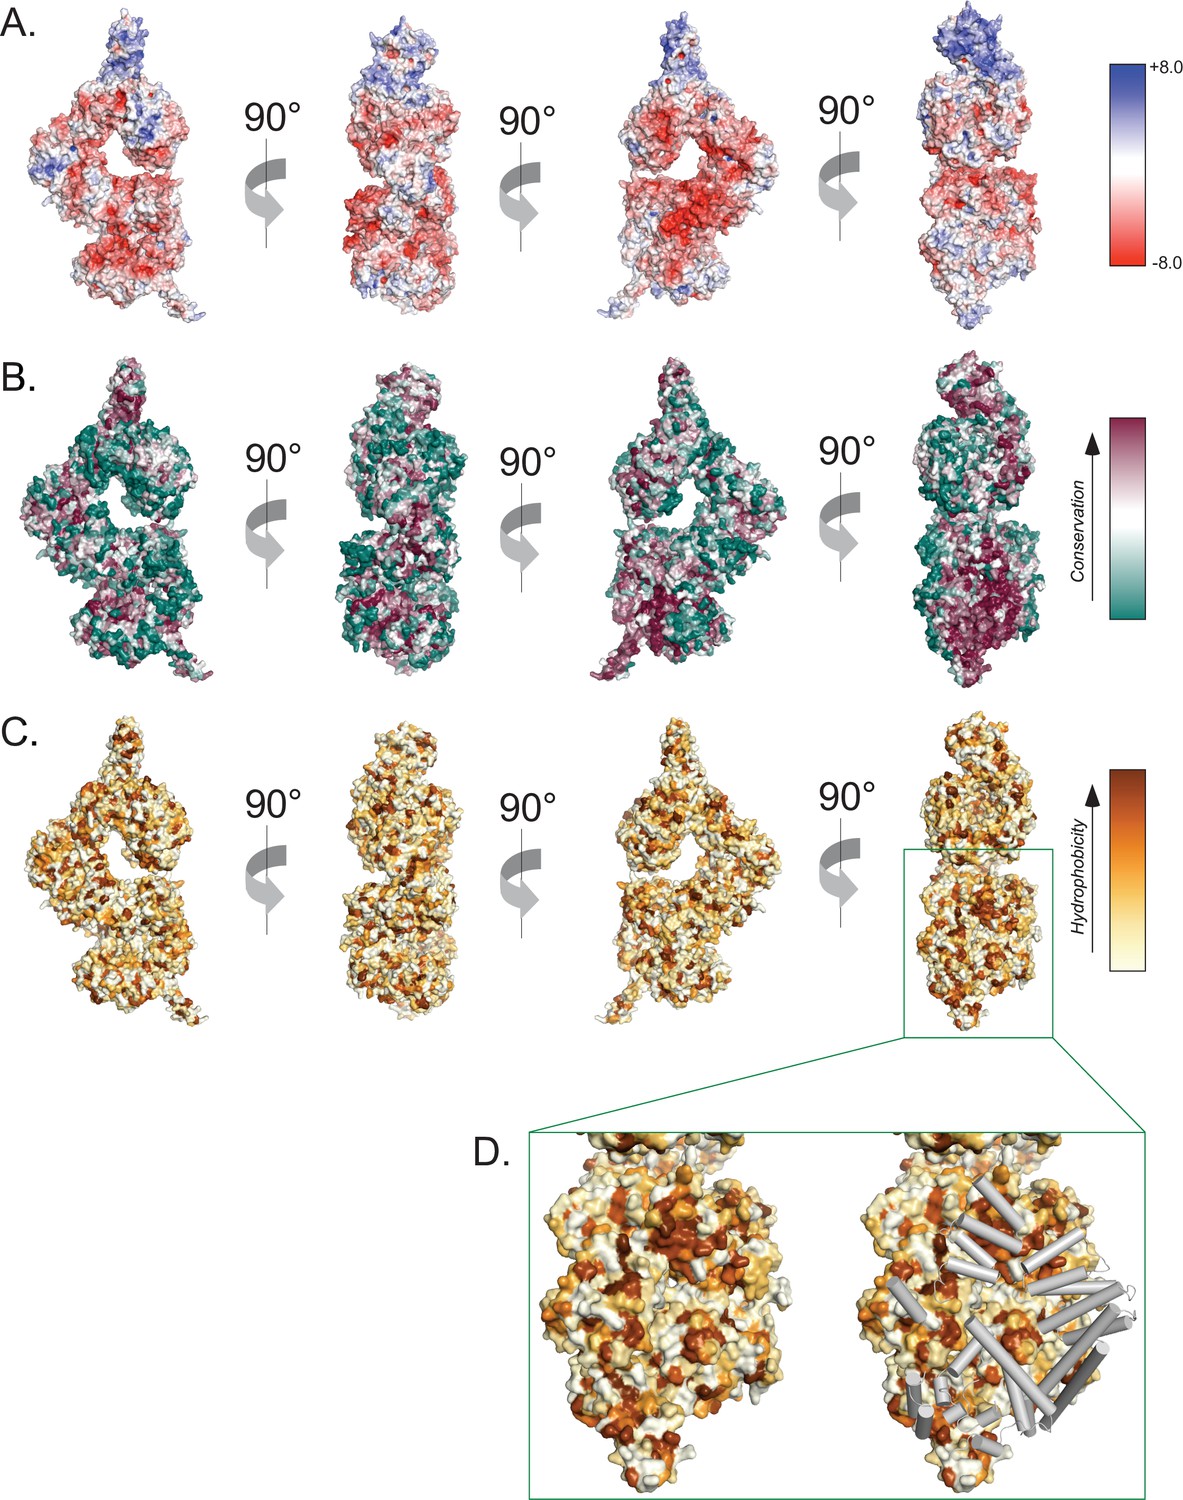
Surface properties of the ATM protomer.
(A) Overall ATM protomer colored by APBS-calculated surface potential. Charge scale shown on the right. (B) Overall ATM protomer colored by CONSURF sequence conservation scores. Conservation scale shown on the right. (C) Overall ATM protomer colored by relative hydrophobicity. Relative hydrophobicity scale shown on the right. (D) Left: zoom on the dimer interface including FAT, Kinase, and FATC domains showing multiple large hydrophobic patches. Right: Identical view showing FAT, Kinase, and FATC domain helices from the symmetric protomer as gray tubes that shield hydrophobic patches in the dimer structure.
Figure 2
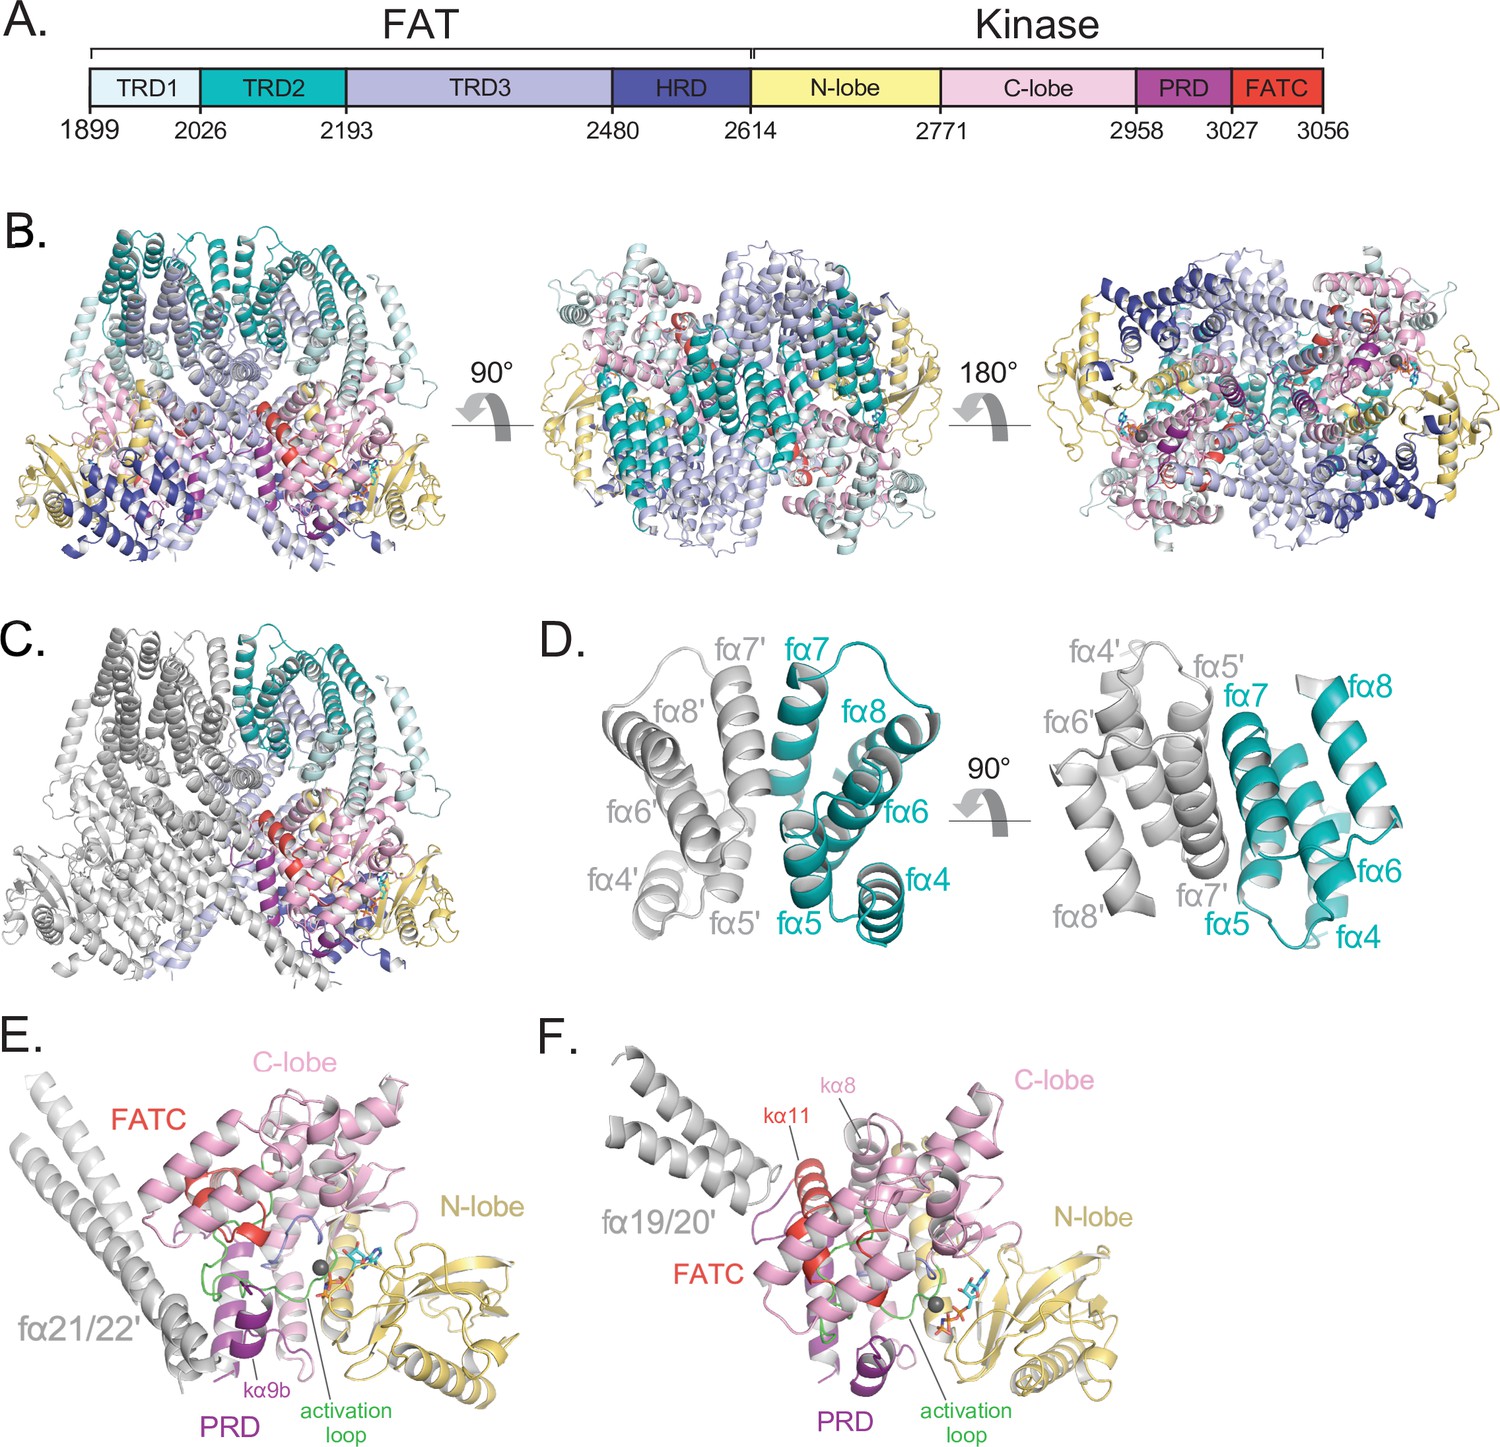
Details of the FAT domain and dimer interface of ATM.
(A) Domain map of the FATKD colored by subdomain as in Figure 1A. (B) Structure of the FATKD colored by domain as in Figure 1A showing side, top and bottom views. AMP-PNP molecule and single magnesium ion colored cyan and gray, respectively. (C) Structure of the FATKD with one chain colored gray to highlight intermolecular contacts. (D) Intermolecular helical packing within the upper dimer interface by FAT helices fα4–8 located within the TRD2 subdomain. (E) Details of the contacts between the long coiled coil of TRD3 (fα21–22) with the kα9b of the PRD of the symmetric ATM protomer. (F) Contacts between fα19–20 of TRD3 with the FATC of the symmetric ATM protomer.
Figure 3 with 1 supplement

Details of the kinase domain and active site of ATM.
(A) Structure of the Kinase, PRD, and FATC domains with secondary structure elements labeled. Also highlighted are the locations of the catalytic loop (residues 2866–2875, blue) and activation loop (residues 2888–2911, green). AMP-PNP and a single magnesium ion in the active site colored cyan and gray, respectively. (B) Details of the interactions within the active site. Critical residues within the N lobe, C lobe, catalytic and activation loops are shown as sticks and labeled. (C) Electron density around AMP-PNP and Mg2+ cofactors contoured to 5σ. (D) Steric occlusion of the γ phosphate of AMP-PNP by residues V2696 and N2697 on the N lobe and Y2969 on kα9b of the PRD. (E) Salt-bridge formed between K3016 (PRD, kα10) to E2895 (activation loop). K3016 is acetylated during the DNA-damage response and correlates with active ATM kinase. (F) Alignment of the Kinase domain of ATM with those of mTOR and DNA-PKcs in the inactive and active states. Structures are aligned along their corresponding catalytic and activation loops. ATM N and C lobes are colored yellow and pink, respectively. Inactive and active mTOR are colored orange and cyan, respectively. Inactive and active DNA-PKcs are colored red and green, respectively. Arrow indicates movement of the N lobe relative to the C lobe coincident with mTOR and DNA-PKcs activation. (G) Positions of catalytically important residues relative to those of mTOR in the inactive and active states. (H) Positions of catalytically important residues relative to those of DNA-PKcs in the inactive and active states.
Figure 3—figure supplement 1
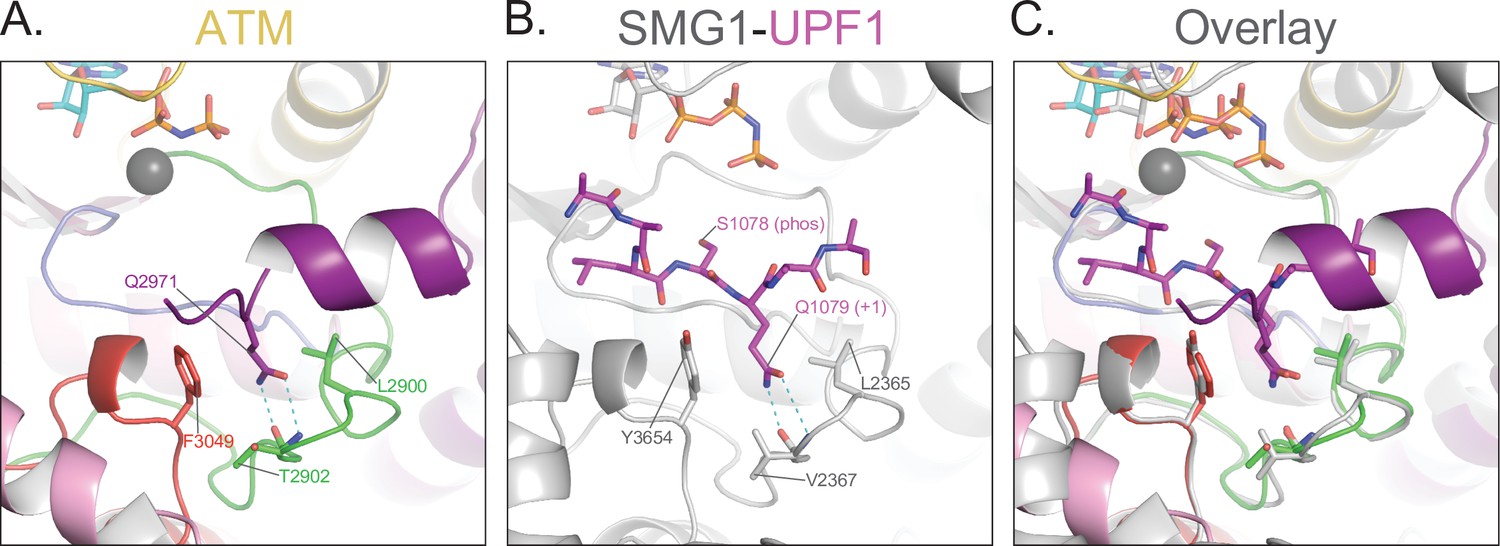
Blockage of the substrate-binding site.
(A) Structure of ATM catalytic cleft showing Gln2971 hydrogen bonding to backbone amide and carbonyl groups of Thr2902 on the activation loop, anchored between hydrophobic residues Leu2900 and Phe3049. (B) Structure of Smg1 catalytic cleft bound to a Upf1 substrate peptide (PDB: 6Z3R) showing Gln1079 in the P+1 position hydrogen bonding to backbone amide and carbonyl groups of Val2367 on the activation loop, anchored between hydrophobic residues Leu2365 and Tyr3654. (C) Alignment of the activation loops of ATM and Smg1 showing the blockage of the substrate binding site by ATM Gln2971.
Figure 4 with 2 supplements
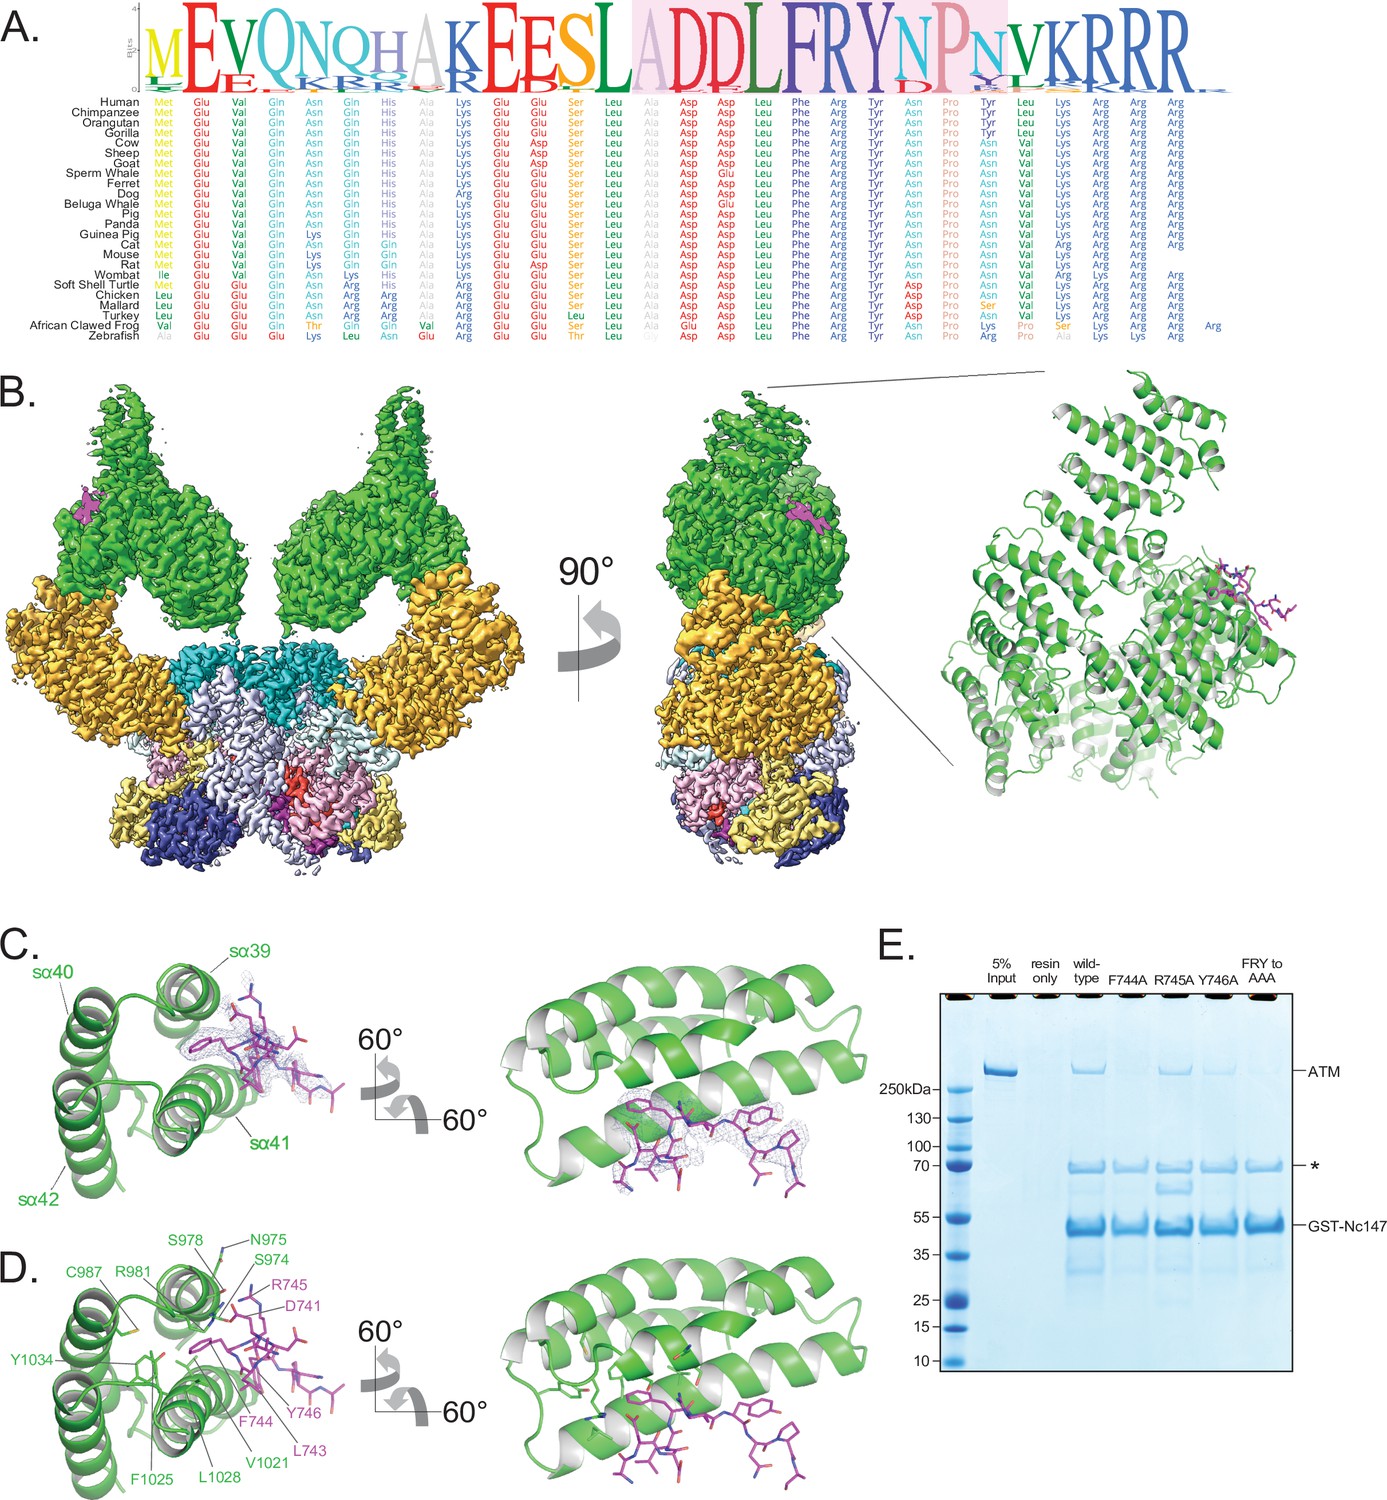
Structure of ATM bound to the C-terminus of Nbs1.
(A) Alignment of the Nbs1 C-terminal 28 residues (Nc28) from 24 vertebrate species showing the conservation of the C-terminus and FxF/Y motif. Portion of Nc28 visible in the cryo-EM map is highlighted in magenta. (B) Location of the Nc28 bound to the ATM Spiral domain in the composite map (left) and structure (right). Nc28 is colored magenta. (C) Zoom of the location of the Nc28 peptide showing Phe744 inserted into a hydrophobic groove made up of ATM helices sα39 to sα42. Nc28 peptide density is contoured to 4σ. (D) Details of the interaction between Nc28 and the ATM Spiral, showing Phe744 inserted into a hydrophobic pocket created by ATM residues Arg981, Cys987, Val1021, Ala1024, Phe1025, Leu1028, and Tyr1034. Arg745 of Nbs1 makes electrostatic contacts with ATM Asn975 and Ser978. Tyr746 of Nbs1 packs against the sα41. Nbs1 L743 makes contacts with an adjacent hydrophobic cleft created by ATM residues Leu1028 and His1064. Nbs1 Asp741 makes electrostatic and H-bonding contacts with ATM residues Arg981 and Ser978, respectively. (E) ATM pull-down assay using GST-tagged Nbs1 C-terminal 147 residues (GST-Nc147) as bait. Lanes are labeled at the top of the image, and bands are labeled on the right. Asterisk indicates Hsp70/DnaK contaminant that co-purifies with all GST-Nc147 preparations.
-
Figure 4—source data 1
Figure 4E Nbs1 pull-down assay.
- https://cdn.elifesciences.org/articles/74218/elife-74218-fig4-data1-v2.zip
Figure 4—figure supplement 1
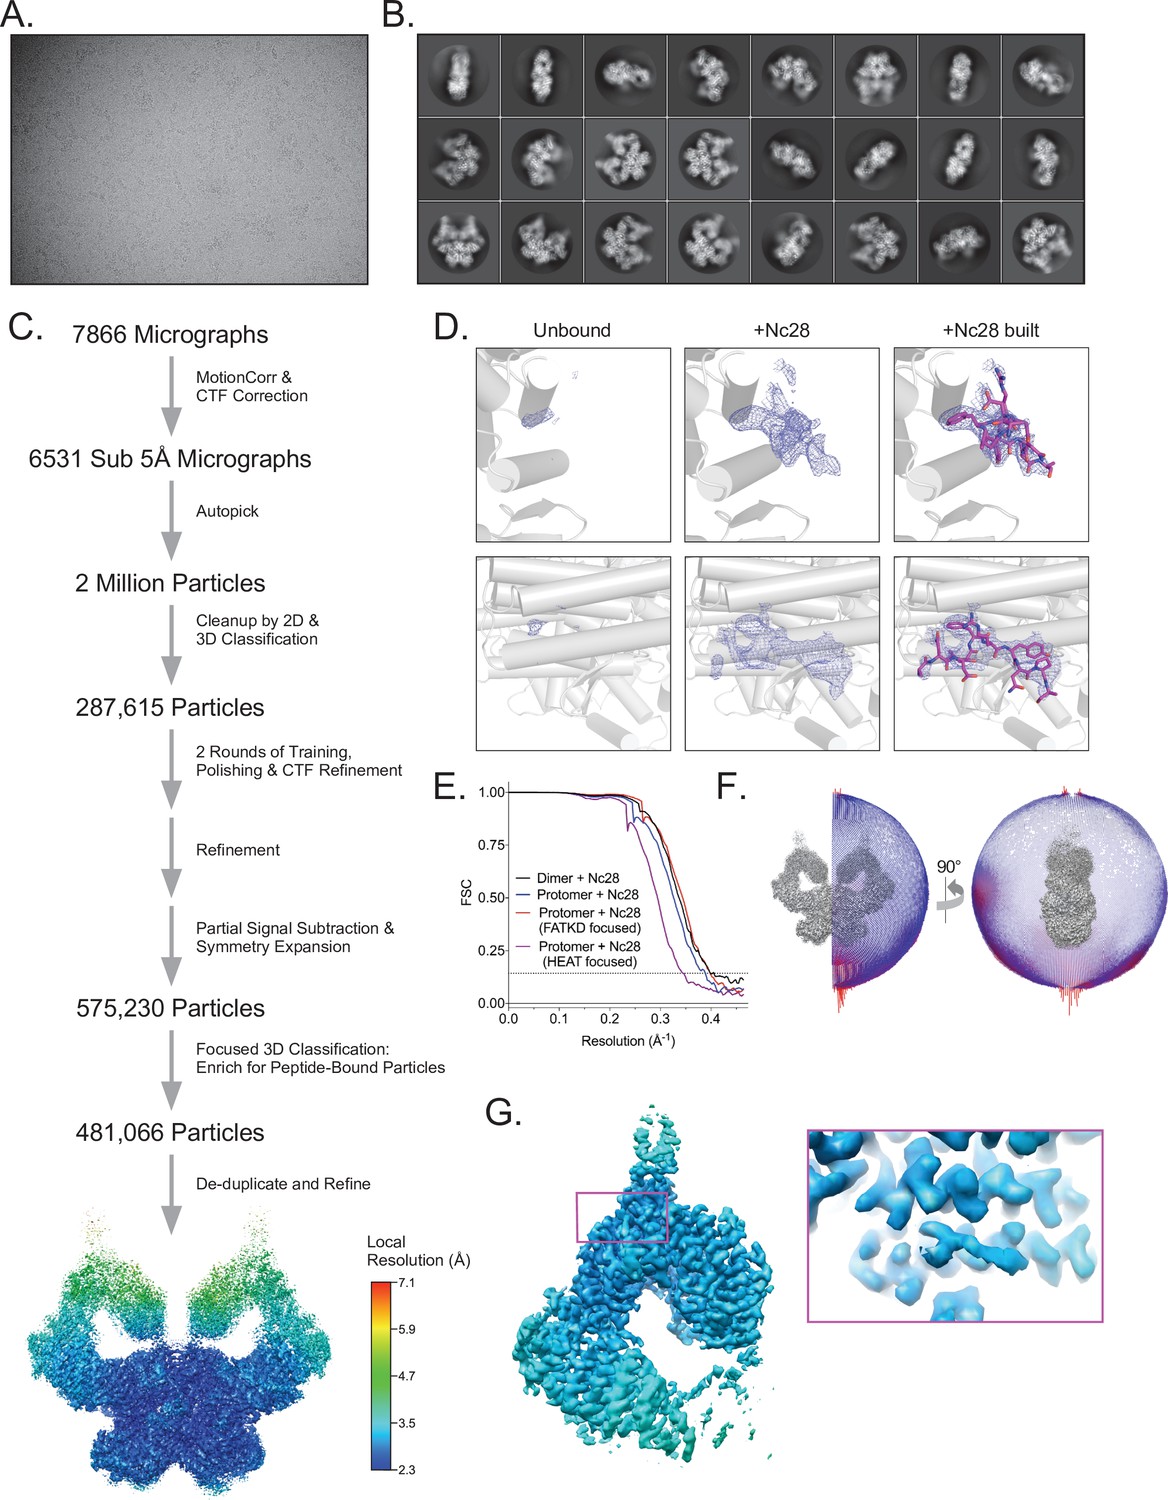
Cryo-EM data processing of the ATM-Nc28 sample.
(A) Example micrograph of ATM-Nc28. (B) Example 2D class averages of ATM-Nc28. (C) Workflow of ATM-Nc28 cryo-EM data analysis. Rainbow consensus map is colored by local resolution, color scale on the right. (D) Electron density within the hydrophobic pocket of ATM without and with the Nc28 peptide in the sample. Rows show two different views of the hydrophobic pocket. First column of images shows minimal electron density in this region in the HEAT-focused overall apo map (607,208 particles). Second column shows much stronger density in this region in the HEAT-focused ATM-Nc28 map (481,066 particles). Third column shows the model of the Nc28 peptide structure built into the density shown in the second column. All maps are contoured to 6σ. (E) Fourier shell correlation (FSC) curves of the ATM-Nc28 dimer and protomer maps, including FATKD and HEAT-focused maps. Gold-standard resolution threshold (FSC = 0.143) shown as a dashed line. (F) Angular distribution of ATM-Nc28 particles in the overall consensus refinement with C2 symmetry imposed. (G) Focused refinement of the symmetry expanded Spiral + Pincer domains of ATM-Nc28 particles using the same procedure as detailed in Figure S3A. Map is colored by local resolution based on the scale to the left. Boxed area shows the local resolution of the Nc28 peptide, with the map contoured to a high level for clarity.
Figure 4—figure supplement 2
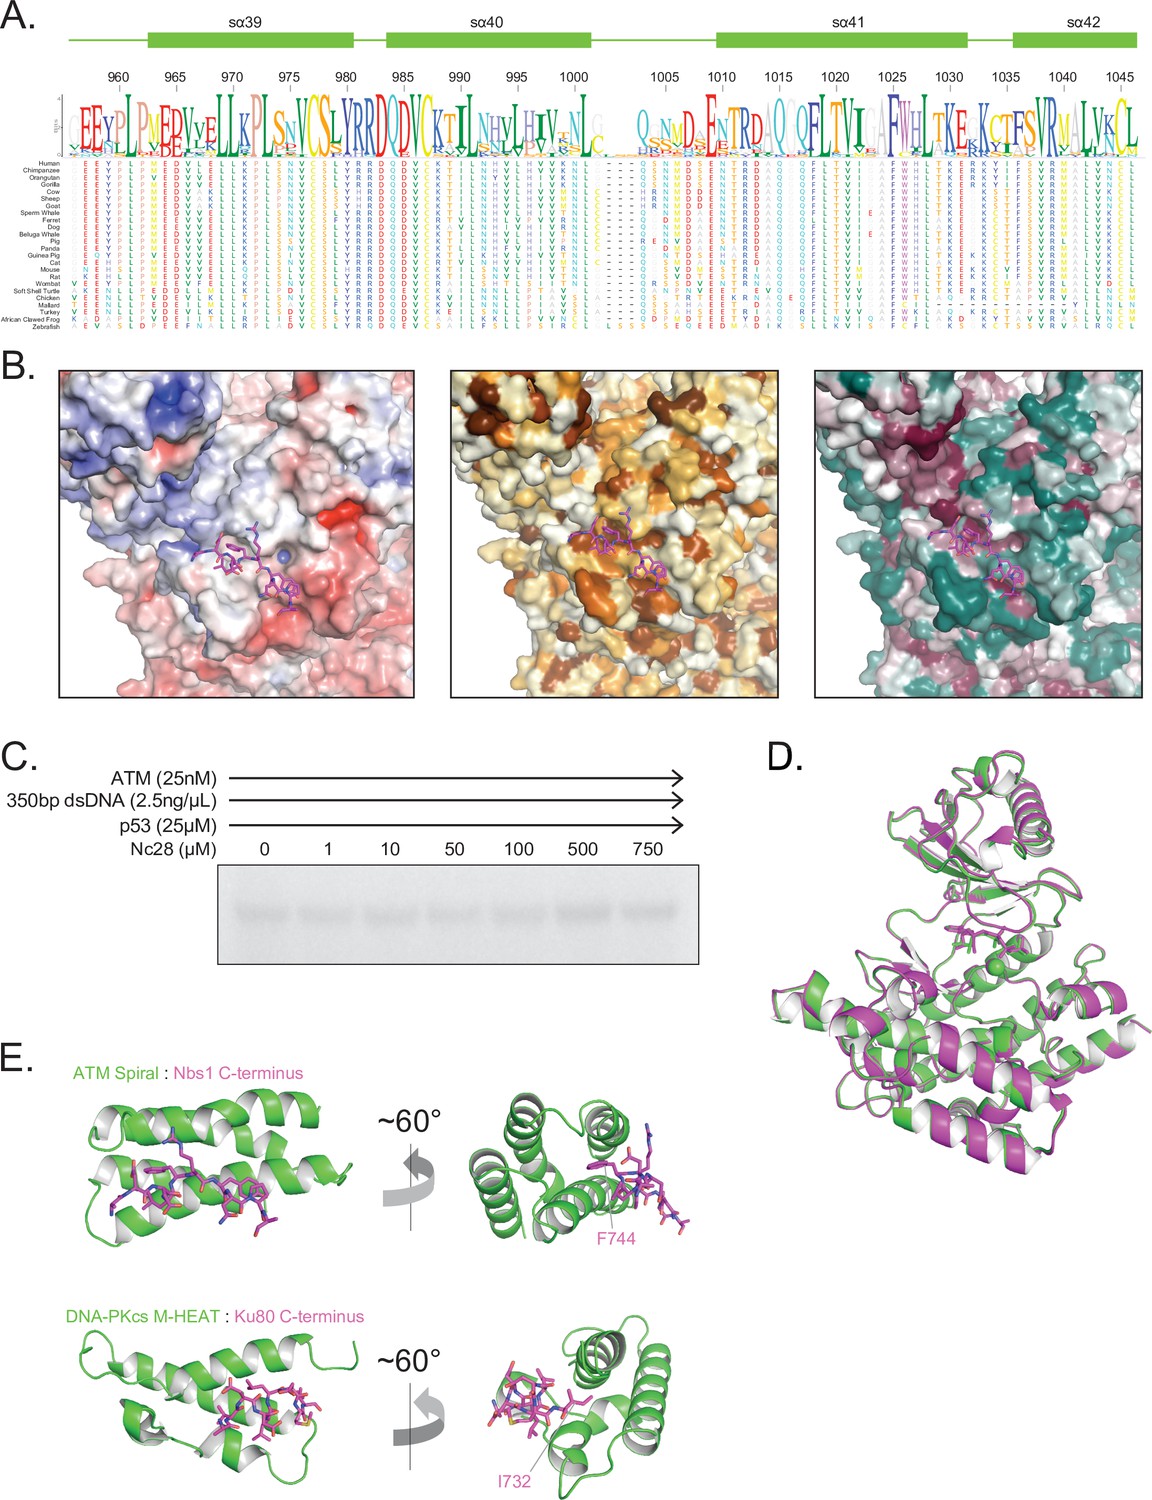
Structural assessment of ATM bound to the Nc28 peptide.
(A) Alignment and sequence conservation of ATM Spiral domain residues 956–1046 from 24 vertebrate species. Residue numbers and secondary structures are displayed according to the human ATM. (B) Nbs1 peptide binding site shown as surface representation colored by APBS-calculated surface potential (left), hydrophobicity (middle), or CONSURF score (right). Same coloring scheme used as in Figure S7. (C) Steady-state ATM kinase assay using 25 nM ATM, 2.5 ng/µL 350 bp dsDNA, 25 µM p53 substrate, and various concentrations of the Nc28 peptide showing no increase in catalytic activity. Reactions were performed three times with similar results. (D) Structural alignment of the kinase domains of apo (green) and Nc28-bound (magenta) ATM. Overall Cα positional RMSD = 0.29 Å. (E) Comparison of the structures of Nc28 bound to the ATM Spiral domain (top) and the C-terminus of Ku80 bound to the DNA-PKcs M-HEAT domain (bottom) (PDB: 7K0Y).
-
Figure 4—figure supplement 2—source data 1
Figure 4—figure supplement 2C ATM kinase assay with DNA and Nc28.
- https://cdn.elifesciences.org/articles/74218/elife-74218-fig4-figsupp2-data1-v2.zip
Figure 5 with 2 supplements
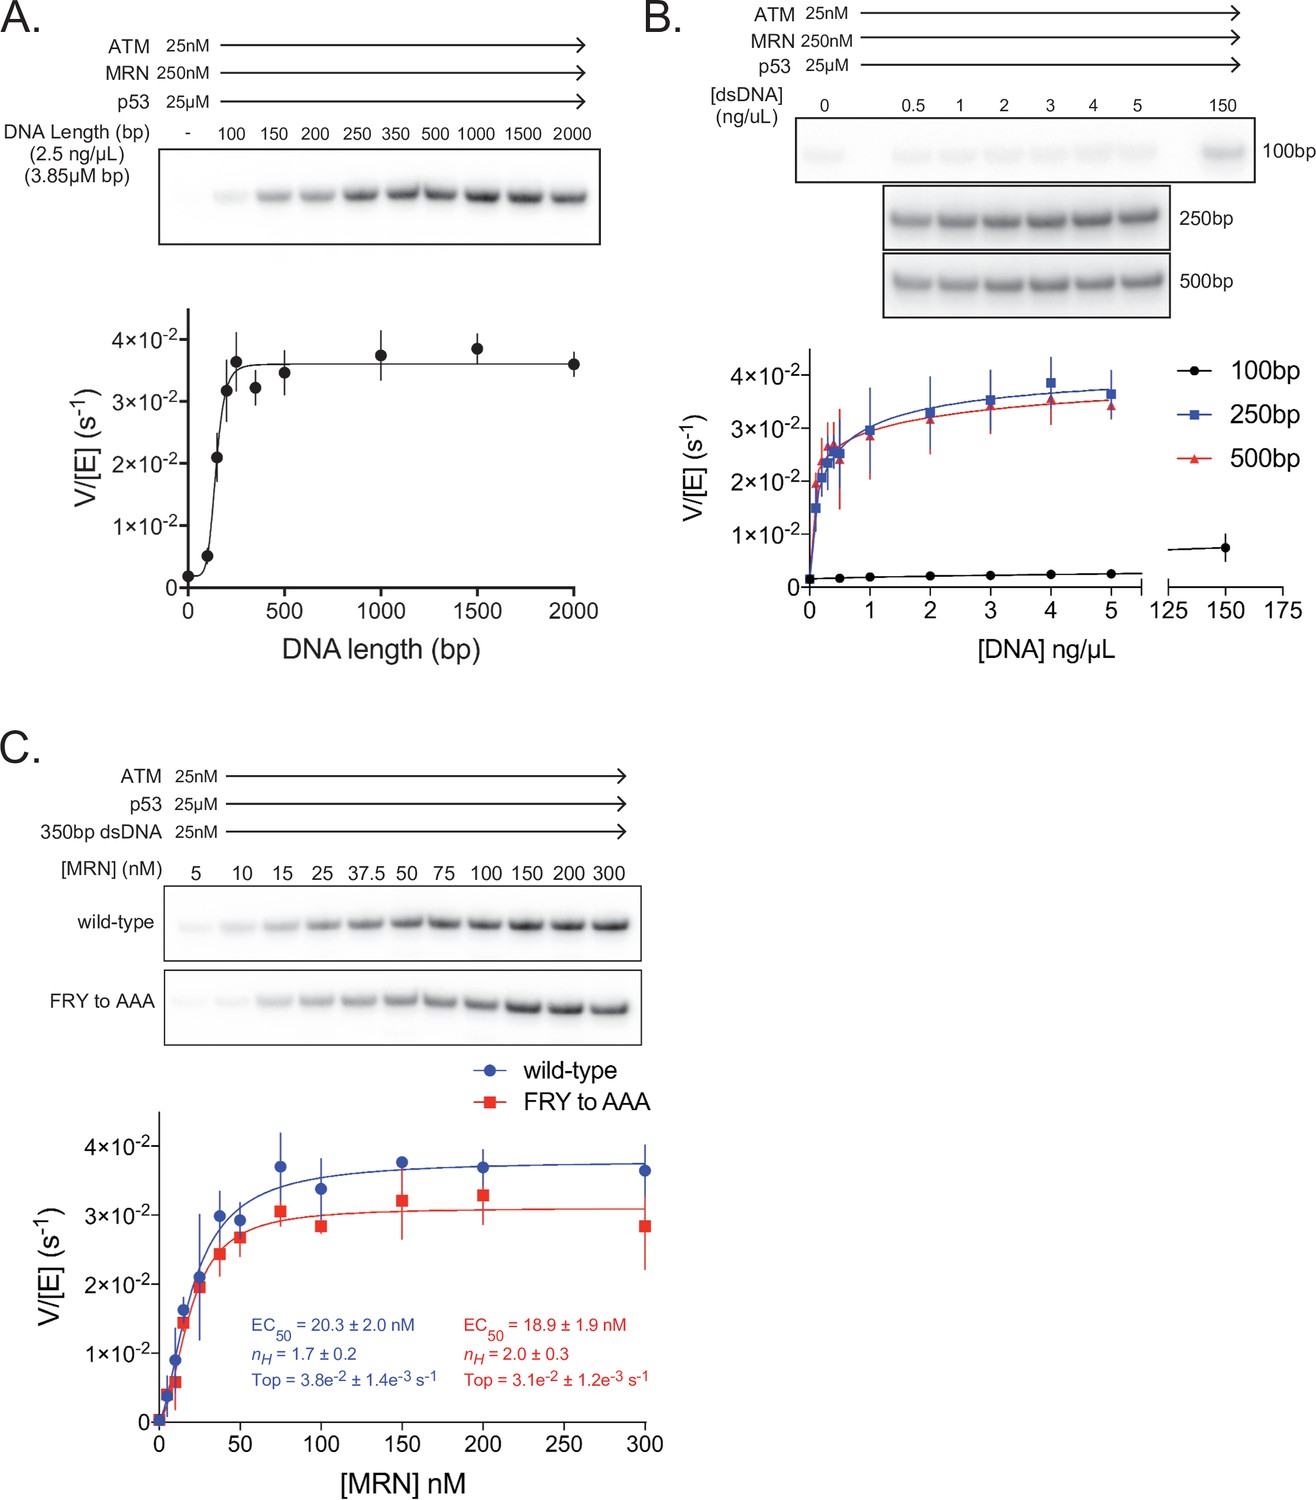
ATM activation requires MRN and long dsDNA, but not the FxF/Y motif of Nbs1.
(A) Top: Steady-state ATM kinase assay using 25 nM ATM, 250 nM MRN, and 25 µM p53 substrate with 2.5 ng/µL of dsDNA of various lengths added. Bottom: Quantification of ATM enzymatic velocity as a function of DNA length. Three biological replicates per point. Curve fit to the EC50 equation. (B) Top: Steady-state ATM kinase assay using 25 nM ATM, 250 nM MRN and 25 µM p53 substrate with various concentrations (0.5–5 ng/µL) of 100 bp, 250 bp, and 500 bp dsDNA fragments. 150 ng/µL 100 bp dsDNA is in the upper right lane. Bottom: Quantification of ATM enzymatic velocity as a function of DNA concentration. Three biological replicates per point, Curve fit to the EC50 equation. (C) Top: Steady-state ATM kinase assay using 25 nM ATM, 25 nM 350 bp dsDNA, and various concentrations of wild-type or FRY to AAA mutant MRN. Bottom: Quantification of ATM enzymatic velocity as a function of MRN concentration. Three to six biological replicates per point. Curves fit to the EC50 equation.
-
Figure 5—source data 1
Figure 5A ATM kinase assay with MRN and varying DNA length.
- https://cdn.elifesciences.org/articles/74218/elife-74218-fig5-data1-v2.zip
Figure 5—figure supplement 1
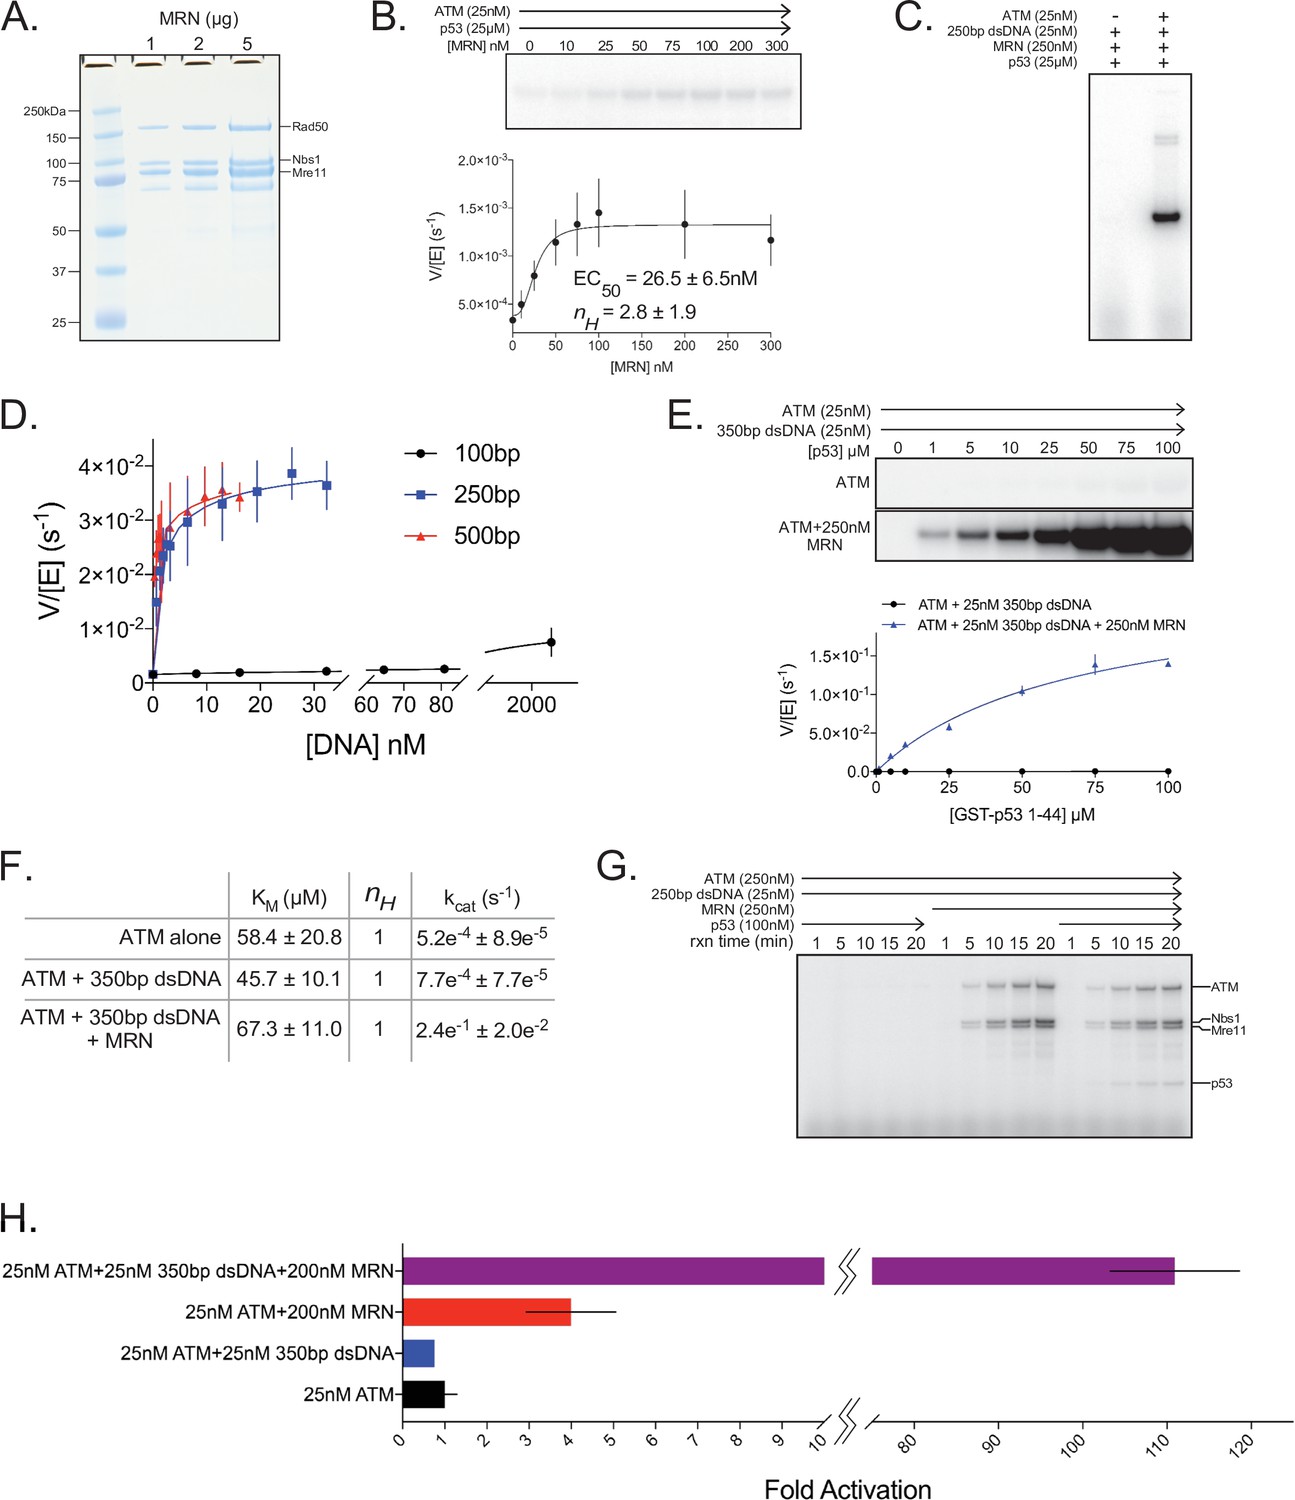
Quantitative ATM kinase assays.
(A) SDS-PAGE of purified FLAG-tagged MRN. One, 2, and 5 µg of protein were run on the gel. (B) Top: Steady-state kinase assay using 25 nM ATM, 25 µM p53 substrate, and various concentrations of MRN. Bottom: Quantification of ATM enzymatic velocity as a function of MRN concentration. Three biological replicates per point. Curve fit to the EC50 equation. (C) Steady-state kinase assay using 25 nM 250 bp dsDNA +250 nM MRN + 25 µM p53 substrate ±25 nM ATM showing ATM-dependent kinase activity toward the p53 substrate. Reactions were performed three times with similar results. (D) Quantification of ATM enzymatic velocity as a function of DNA concentration. Same data used as in Figure 5B with the x-axis rescaled to molar DNA concentration. Three biological replicates per point. Curve fit to the EC50 equation. (E) Top: Steady-state kinase assay using 25 nM ATM, 25 nM 350 bp dsDNA, and various concentrations of p53 substrate peptide without and with 250 nM MRN added. Bottom: Quantification of ATM enzymatic velocity as a function of substrate concentration without (black) and with (blue) MRN present. Three biological replicates per point. Curve fit to the Michaelis-Menten equation. (F) Quantification of enzymatic parameters (KM and kcat) of ATM under various conditions from data in Figure 1—figure supplement 1 and (E). (G) Time-course kinase assay run under single-turnover conditions using 250 nM ATM + 25 nM 250 bp dsDNA ±250 nM MRN ± 100 nM p53 substrate peptide. Phosphorylation products are labeled on the right. Reactions were performed three times with similar results. (H) Data from Figures S1B, S11B, and S11E rescaled to show fold activation relative to ATM alone at 25 µM substrate concentration. Three biological replicates per group.
-
Figure 5—figure supplement 1—source data 1
Figure 5—figure supplement 1A SDS-PAGE of purified MRN complex.
Figure 5—figure supplement 1B ATM kinase assay with MRN and without DNA. Figure 5—figure supplement 1C ATM kinase assay with DNA and MRN, without and with ATM. Figure 5—figure supplement 1E ATM kinase assay with DNA, without and with MRN. Figure 5—figure supplement 1G Single-turnover ATM kinase assay.
- https://cdn.elifesciences.org/articles/74218/elife-74218-fig5-figsupp1-data1-v2.zip
Figure 5—figure supplement 2
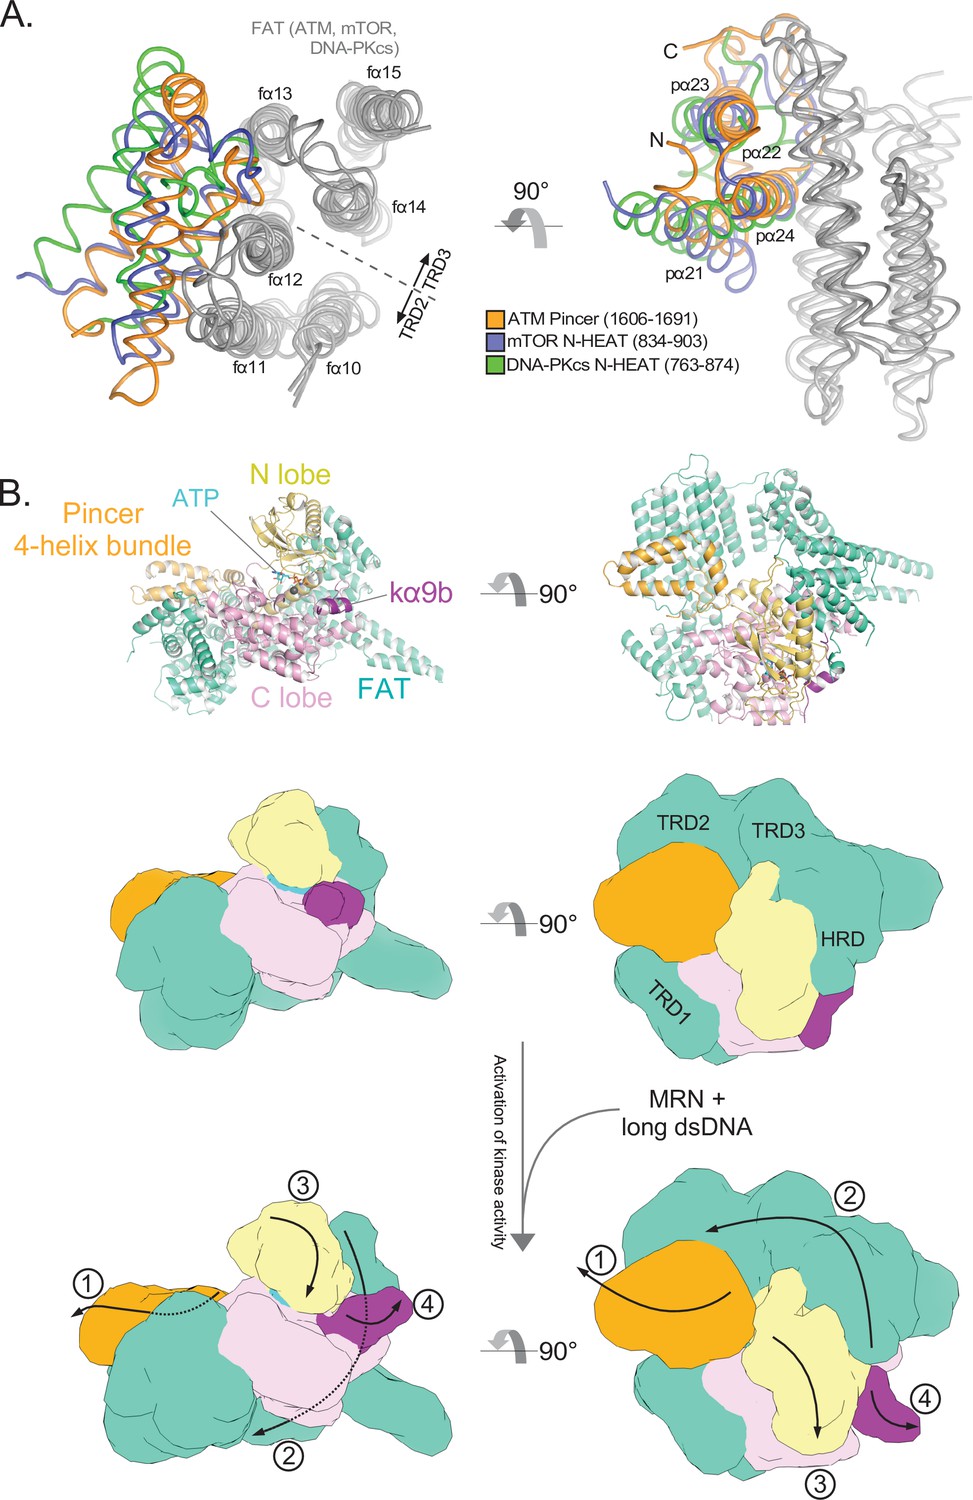
Structural conservation of the FAT domain anchor and model of FATKD activation.
(A) Alignment of the TRD2-TRD3 interface helices from ATM, mTOR, and DNA-PKcs inactive structures (gray). ATM FAT domain helices fα10 to fα15 are labeled on the left. ATM Pincer helices pα21 to pα24 labeled on the right. Four helix bundles from the mTOR and DNA-PKcs N-HEAT domains are shown in blue and green, respectively. (B) Top: Structure of the ATM protomer FATKD + Pincer 4-helix bundle (residues 1606–1691) in the inactive state. Middle: Cartoon model of the inactive structure shown above with approximate locations of FAT subdomains labeled. Bottom: Cartoon model of the likely structural changes that coincide with ATM activation. MRN-dsDNA binding is not shown, but most likely occurs in the Spiral domain. In this model, MRN-dsDNA binding to the Spiral domain causes a conformational change that is transmitted through the HEAT-repeats to ultimately pull on the Pincer 4-helix bundle (1). This motion, in turn, stretches and twists the TRD2, TRD3, and HRD subdomains of the FAT (2), whereas the TRD1 subdomain remains anchored on the C lobe. The motion alters the HRD-N lobe interface allowing the N lobe to undergo a slight conformational closure to realign critical catalytic residues (3), as detailed in Figure 3. This motion of the Kinase domain, alongside motions of the FAT domain of the symmetric protomer (not shown), also allow kα9b to vacate the substrate binding site (4). Both the realigning of catalytic residues within the cleft (3) and the removal of the substate block (4) are likely required for complete ATM activation.
Videos
Video 1
Conformational flexibility of the ATM spiral and pincer domains.
Additional files
-
Supplementary file 1
Cryo-EM data processing and refinement table.
- https://cdn.elifesciences.org/articles/74218/elife-74218-supp1-v2.xlsx
-
Transparent reporting form
- https://cdn.elifesciences.org/articles/74218/elife-74218-transrepform1-v2.pdf
-
Source data 1
Source data - original gel images.
- https://cdn.elifesciences.org/articles/74218/elife-74218-data1-v2.pdf
Download links
A two-part list of links to download the article, or parts of the article, in various formats.
Downloads (link to download the article as PDF)
Open citations (links to open the citations from this article in various online reference manager services)
Cite this article (links to download the citations from this article in formats compatible with various reference manager tools)
Structure of the human ATM kinase and mechanism of Nbs1 binding
eLife 11:e74218.
https://doi.org/10.7554/eLife.74218


