Quantitative MRI reveals differences in striatal myelin in children with DLD
- Wellcome Centre for Integrative Neuroimaging, Dept of Experimental Psychology, University of Oxford, United Kingdom
- Department of Psychology, Royal Holloway, University of London, Egham Hill, United Kingdom
- Department of Speech and Hearing Sciences, University of Washington, United States
- MRC Cognition and Brain Sciences Unit, University of Cambridge, United Kingdom
- Nuffield Department of Clinical Neurosciences, John Radcliffe Hospital, United Kingdom
- Department of Psychology, University of Cambridge, United Kingdom
- NeuroPoly Lab, Biomedical Engineering Department, Polytechnique Montreal, Canada
- Wellcome Centre for Integrative Neuroimaging, FMRIB Centre, Nuffield Department of Clinical Neuroscience, University of Oxford, United Kingdom
Figures
Figure 1 with 2 supplements
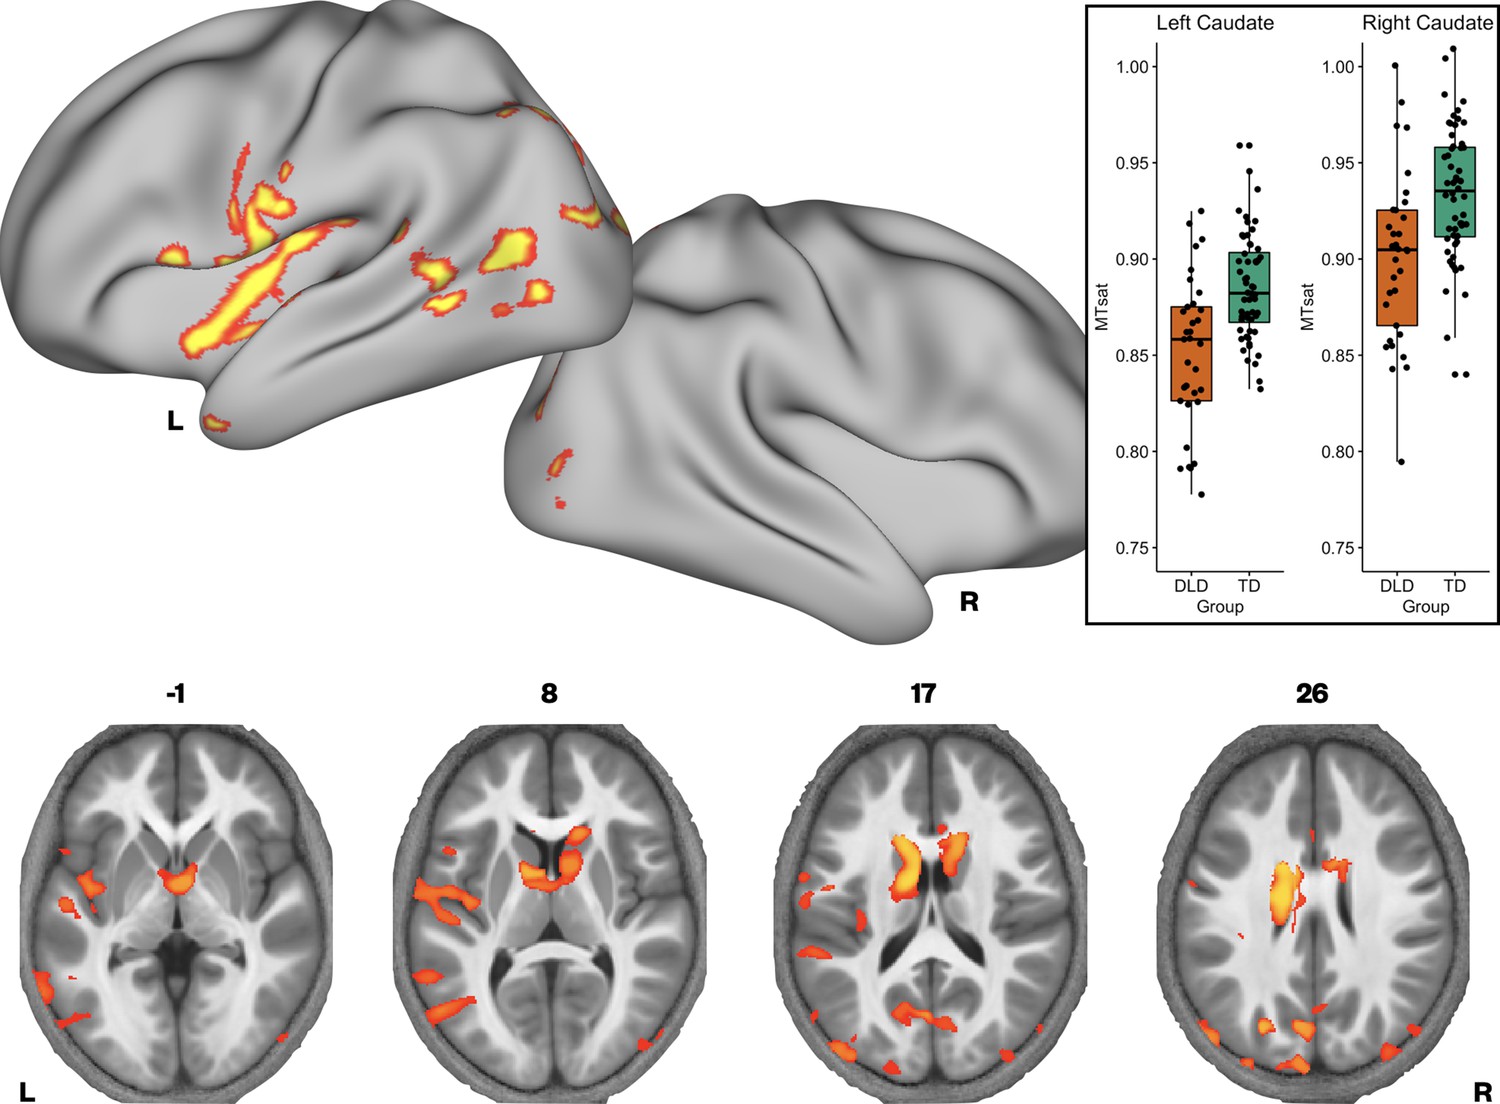
Brain areas showing reduced Magnetization Transfer saturation (MTsat) in developmental language disorder (DLD).
Coloured maps resampled and overlaid on the fsaverage surface (reconstructed using the HCP workbench) show TD > DLD differences in MTsat values (whole-brain corrected threshold p < 0.05). Axial slices (coloured maps are overlaid on an average MTsat image from all participants) show additional group differences subcortically in the caudate nuclei. The inset shows a boxplot of MTsat values drawn from the cluster in the caudate nuclei by group, with this cluster split into right and left using a hemispheric mask (orange – DLD, green – TD).
Figure 1—figure supplement 1

Whole-brain typically developing (TD) > developmental language disorder (DLD) differences (thresholded at p < 0.05) when excluding children with nonverbal IQs < 85 in Magnetization Transfer saturation (MTsat) values.
See legend to Figure 1 for details.
Figure 1—figure supplement 2
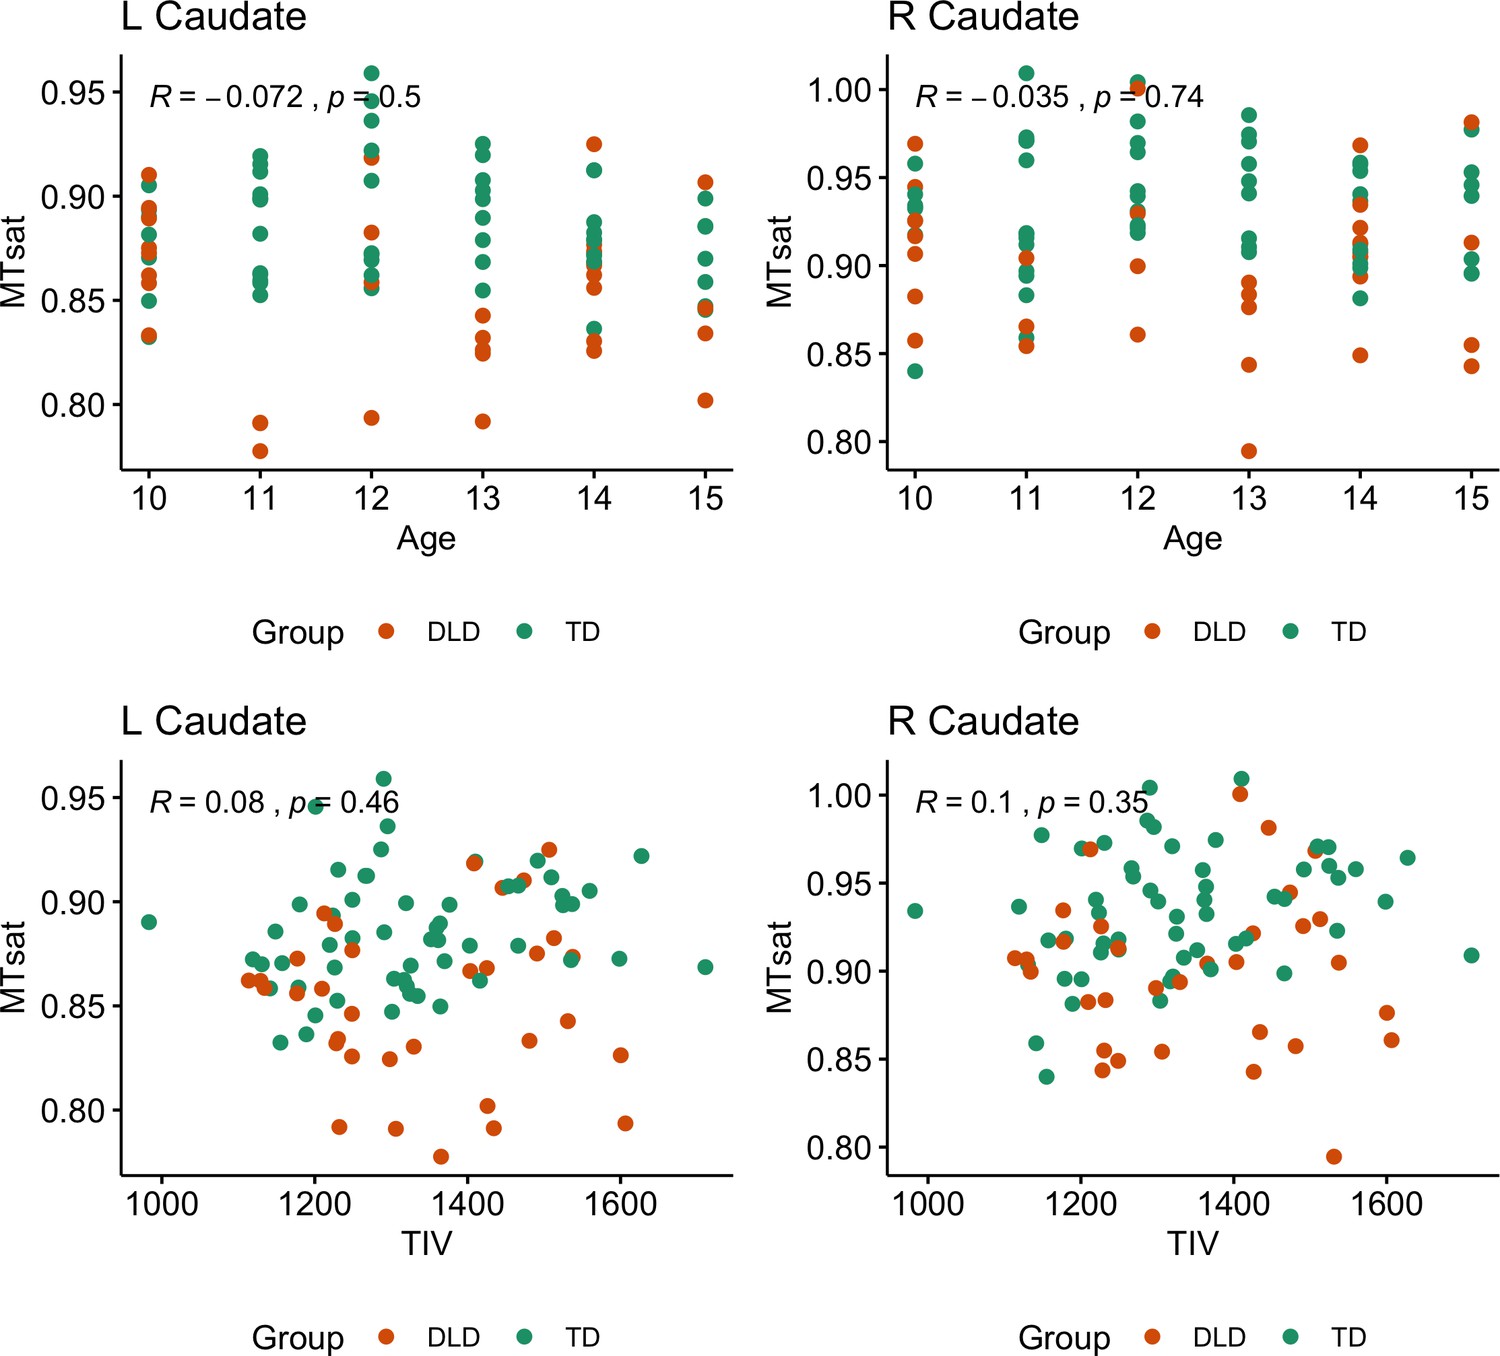
Relationship between MTsat values in the caudate nucleus by age and total intracranial volume (TIV) in typically developing (TD) children and those with developmental language disorder (DLD).
Average MTsat in the left and right caudate nucleus for individual participants are plotted against age or TIV. Dots show data for individual participants, colour represents group (orange - DLD, green - TD). All correlations are non-significant (p>.35), as shown by the statistics above.
Figure 2 with 1 supplement

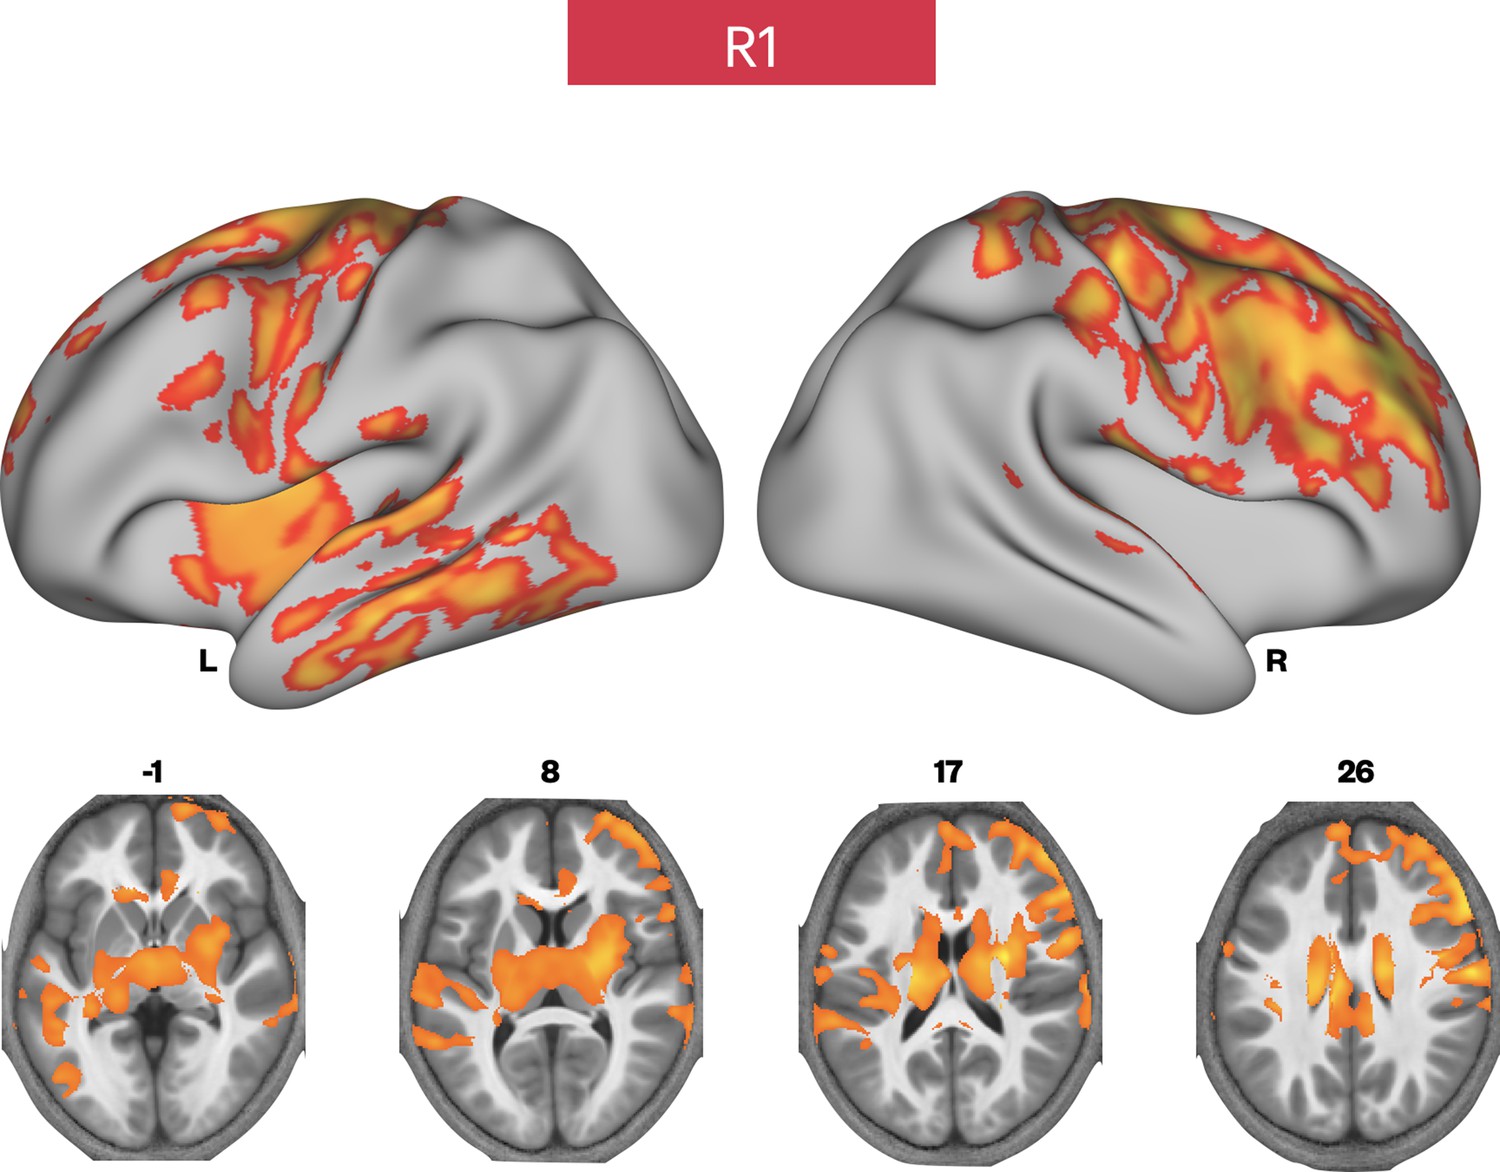
Brain areas showing reduced R1 in developmental language disorder (DLD).
Coloured maps resampled and overlaid on the fsaverage surface (reconstructed using the HCP workbench) show TD > DLD differences in R1 maps (whole-brain corrected threshold p < 0.05). Axial slices (coloured maps are overlaid on an average MTsat image from all participants) show additional subcortical group differences in the striatum and thalamus bilaterally.
Figure 2—figure supplement 1
Whole-brain typically developing (TD) > developmental language disorder (DLD) differences (thresholded at p < 0.05) when excluding children with nonverbal IQs <85 in R1 values.
See legend to Figure 2 for details.
Figure 3 with 1 supplement

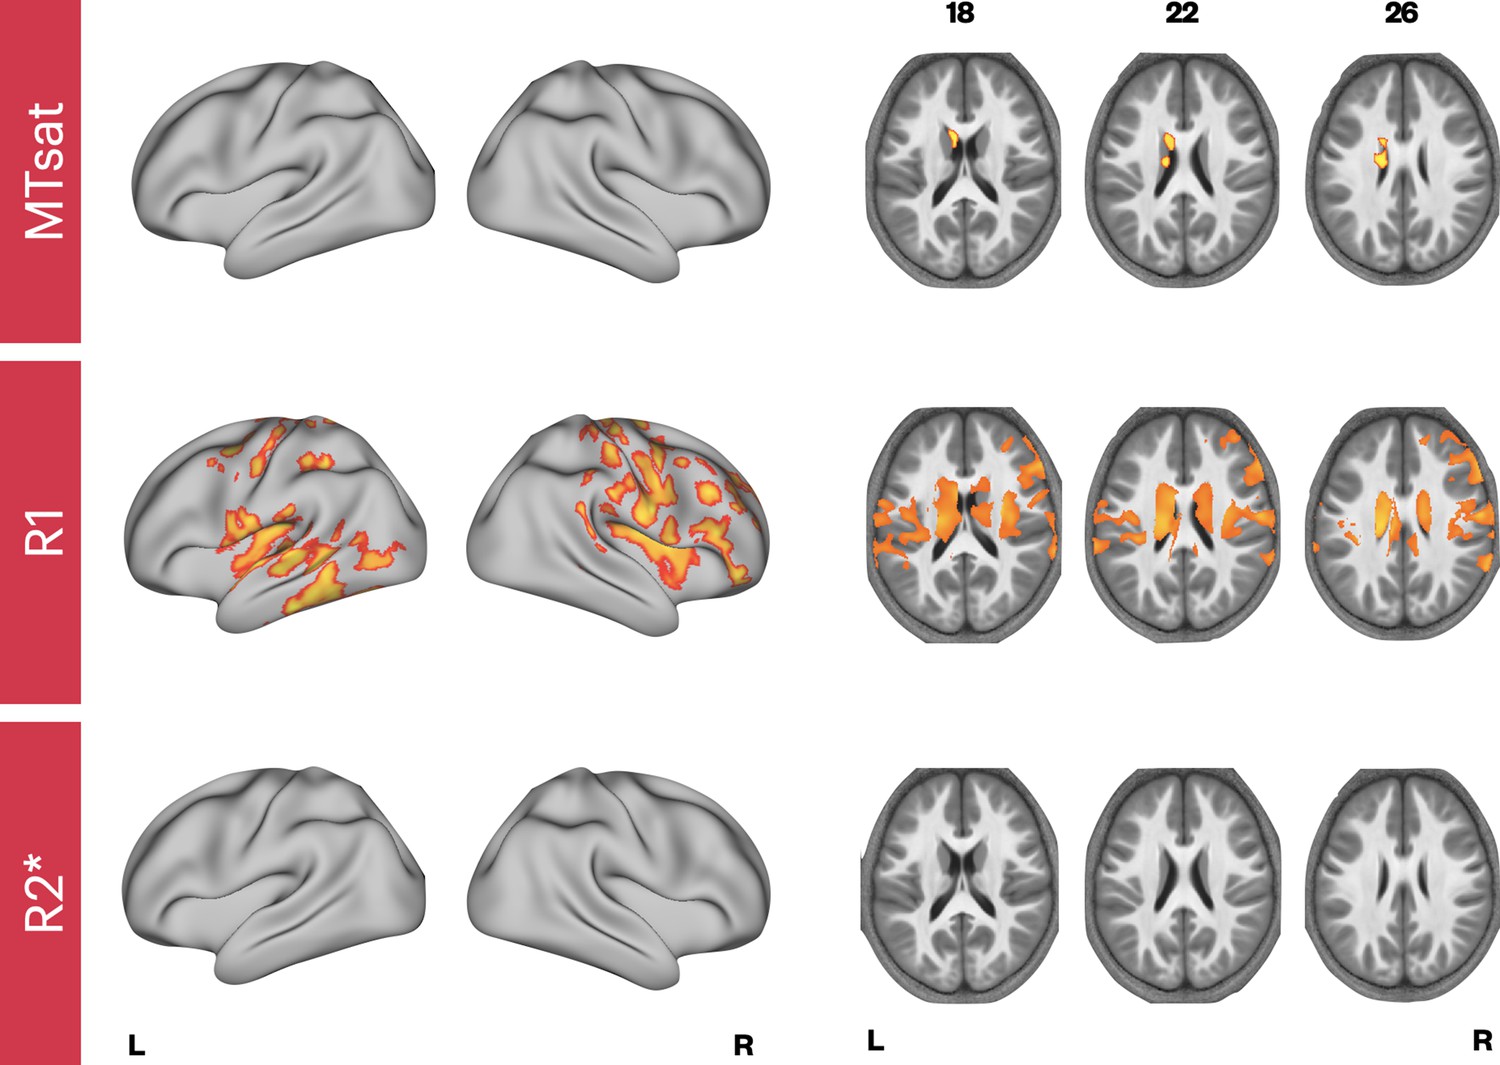
Brain areas showing conjoint reductions in MTsat and R1 in developmental language disorder (DLD).
Coloured maps resampled and overlaid on the fsaverage surface (reconstructed using the HCP workbench) show convergence of TD > DLD differences in MTsat and R1 maps thresholded at p < 0.05. Axial slices (coloured maps are overlaid on an average MTsat image from all participants) show the differences subcortically in the dorsal striatum in particular.
Figure 3—figure supplement 1
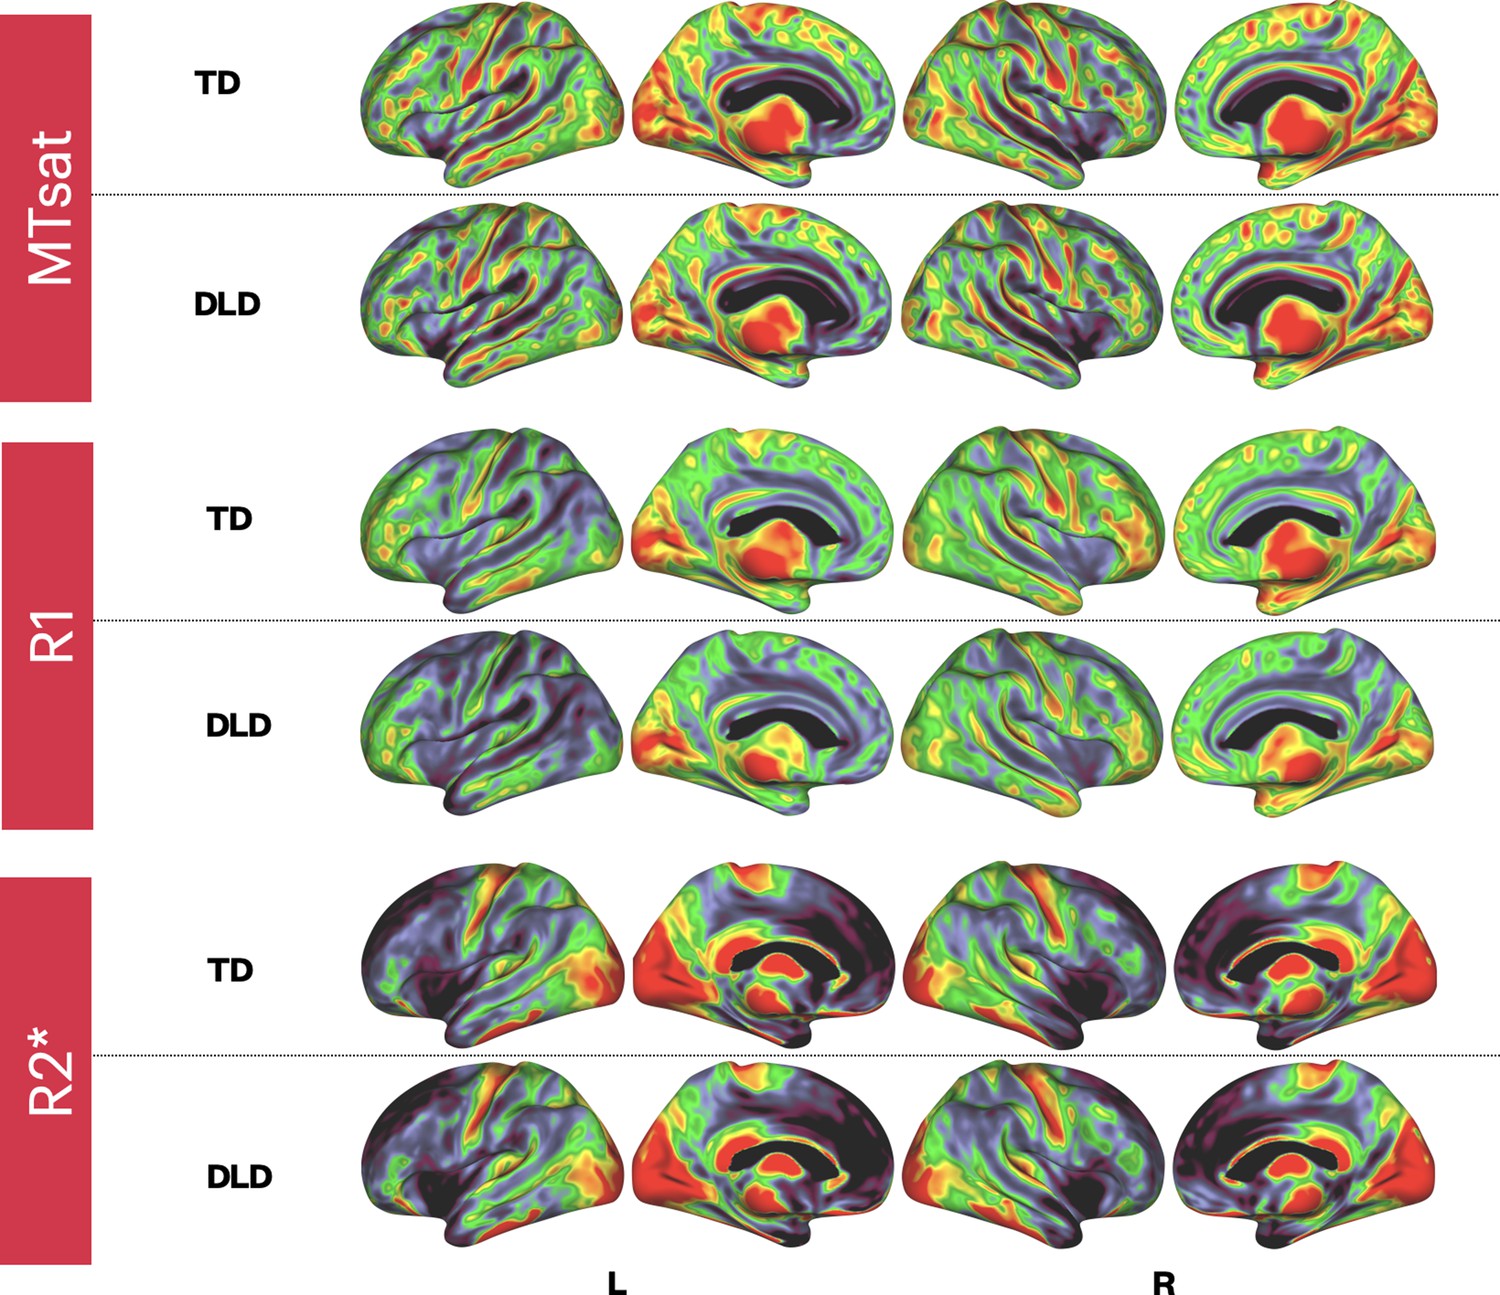
Average MTsat, R1, and R2* values in typically developing (TD) and developmental language disorder (DLD) groups are shown using a coloured heat map (hotter colours show higher values).
Maps are overlaid on the fsaverage surface reconstructed using the HCP workbench. Left (L) and right (R) lateral and medial surfaces are shown on the left and right side of the figure respectively.
Figure 4 with 1 supplement
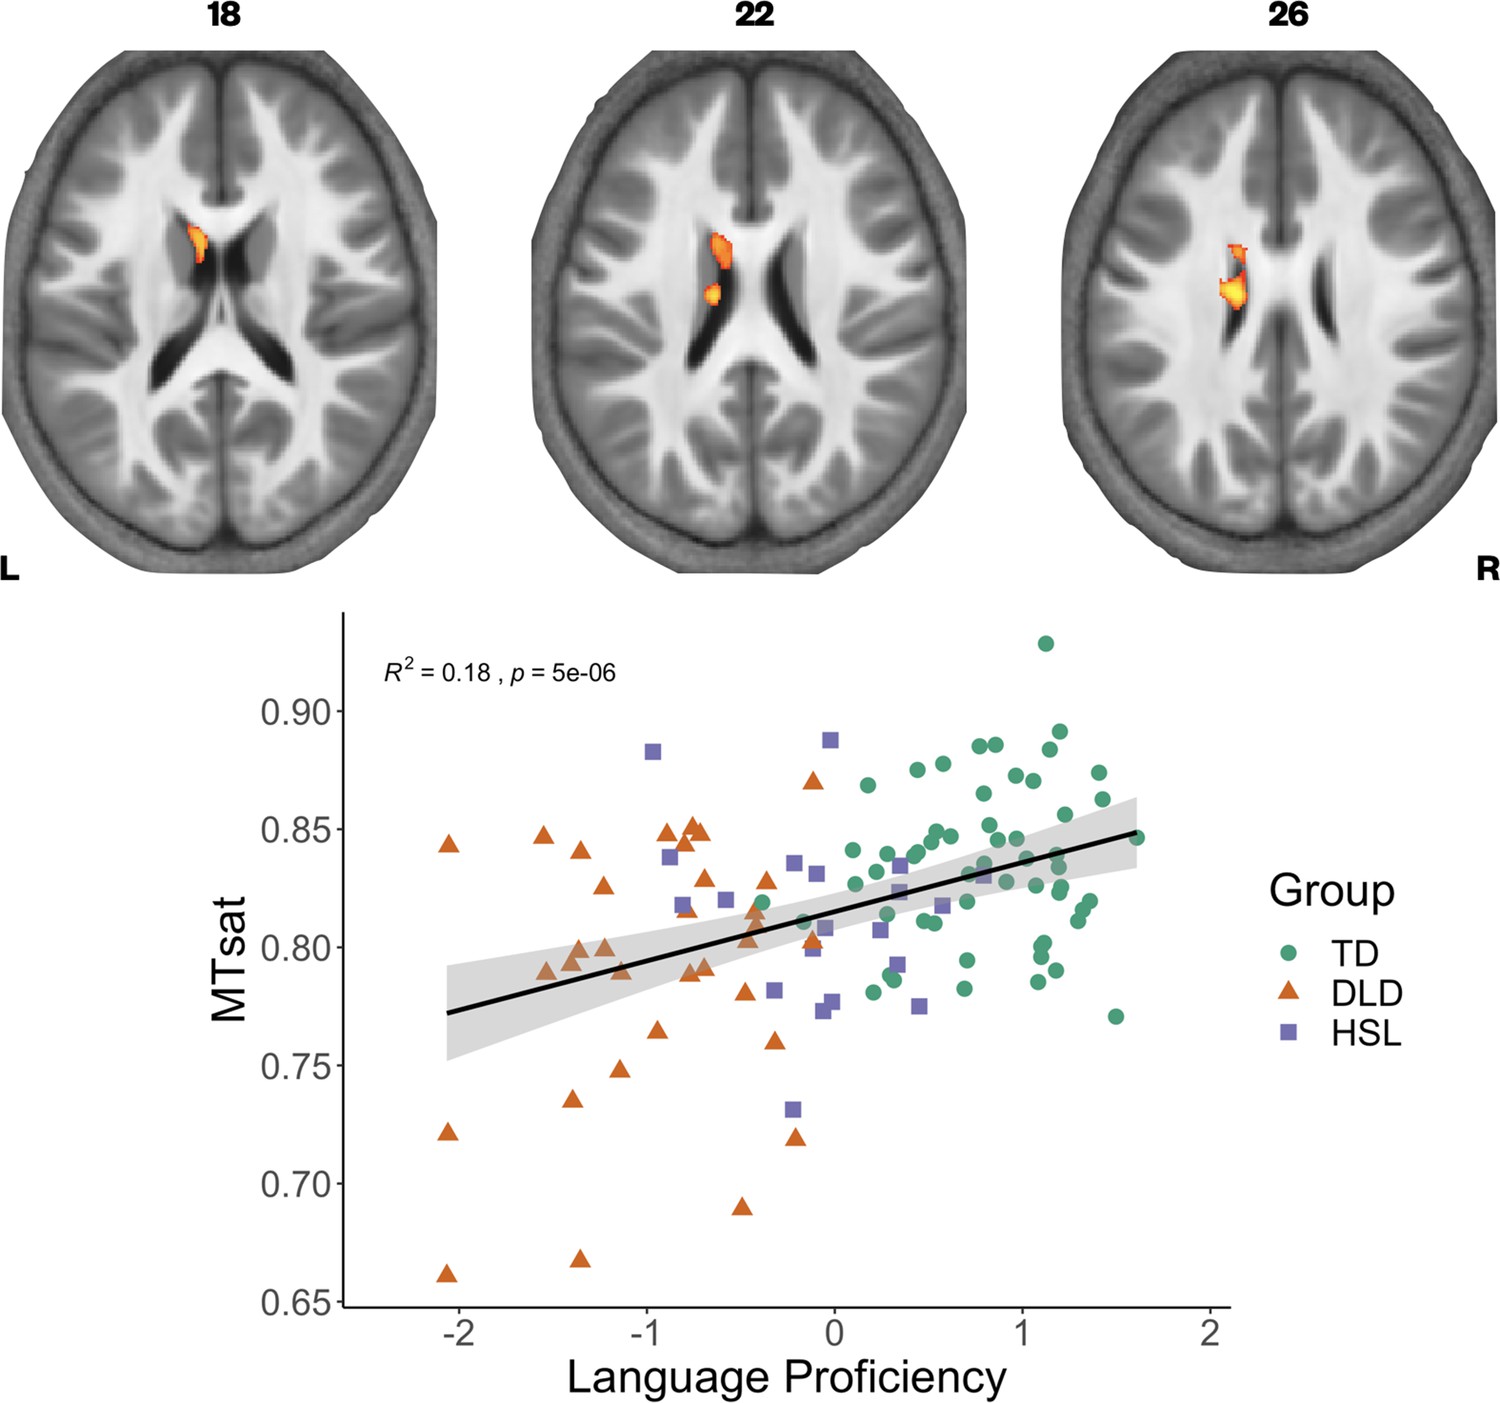
Correlation between language proficiency and Magnetization Transfer saturation (MTsat) values in the left caudate nucleus.
Coloured maps are overlaid on axial slices through the average MTsat image from all participants (top) showing significant relationship subcortically in the left caudate nucleus. Average MTsat values for the left caudate nucleus in individual participants are plotted against the Language Proficiency Factor score. The solid line is the regression line with shaded areas showing the 95% confidence interval. Groups are plotted in different colours (green - TD, orange - DLD. purple - HSL) for illustration.
Figure 4—figure supplement 1
Whole-brain correlation of multi-parameter mapping (MPM) values with language proficiency (thresholded at p < 0.05).
See legend to Figure 4 for details.
Tables
Table 1
Descriptive data for the typically developing (TD), developmental language disorder (DLD), and history of speech and language (HSL) difficulties groups.
Means are shown below, with standard deviations in parentheses. Language proficiency and memory factor scores are derived from a factor analysis (for a full description, see Krishnan et al., 2021). Nonverbal IQ is a scaled score (M = 10, SD = 3) representing an average of performance on block design and matrix reasoning tasks. The last column shows whether there were significant group differences when using t-tests (p < 0.05), no correction for multiple comparisons is applied.
| TD | DLD | HSL | Group differences | |
|---|---|---|---|---|
| Age (years) | 12.41 (1.62) | 12.48 (1.80) | 12.40 (1.67) | None |
| Gender | 28 F:28 M | 11 F:22 M | 3 F:17 M | N/A |
| Total intracranial volume (mm3) | 1329.24 (145.98) | 1345.39 (145.43) | 1411.51 (158.99) | None |
| Language proficiency | 0.8 (0.45) | −0.95 (0.55) | −0.06 (0.48) | TD > HSL > DLD |
| Memory | 0.58 (0.80) | −0.74 (0.79) | 0.07 (0.77) | TD > HSL > DLD |
| Nonverbal IQ | 12.3 (1.91) | 8.65 (2.09) | 11.0 (1.83) | TD > HSL > DLD |
Table 2
Group mean and standard deviation of parameter values in grey and white matter in children who were typically developing (TD), had developmental language disorder (DLD), and published mean and standard deviation in adults, mean 24.2 years, SD 1.6 years (Weiskopf et al., 2013).
Values in bold indicate a global difference between the TD and DLD groups (p < 0.05), uncorrected for multiple comparisons.
| TD | DLD | Published values | |
|---|---|---|---|
| Grey matter | |||
| MT | 0.828 (0.018) | 0.821 (0.019) | 0.794 (0.014) |
| R1 | 0.615 (0.012) | 0.608 (0.014) | 0.609 (0.008) |
| R2* | 15.192 (0.437) | 15.234 (0.544) | 15.200 (0.400) |
| White matter | |||
| MT | 1.720 (0.052) | 1.714 (0.053) | 1.764 (0.066) |
| R1 | 0.973 (0.025) | 0.962 (0.025) | 1.036 (0.036) |
| R2* | 20.672 (0.659) | 20.679 (0.704) | 21.000 (0.800) |
Additional files
-
Supplementary file 1
Supplementary information.
(a) Typically developing (TD) > developmental language disorder (DLD) differences in Magnetization Transfer saturation (MTsat) maps. Nonparametric randomisation analysis with threshold-free cluster enhancement was used to compare groups. A whole-brain corrected threshold of p < 0.05 was used.
(b) TD > DLD conjoint differences in R1 and MTsat.
(c) Differences in age and language scores between the selected and excluded children who were TD or had DLD.
- https://cdn.elifesciences.org/articles/74242/elife-74242-supp1-v1.docx
-
Transparent reporting form
- https://cdn.elifesciences.org/articles/74242/elife-74242-transrepform1-v1.docx
Download links
A two-part list of links to download the article, or parts of the article, in various formats.
Downloads (link to download the article as PDF)
Open citations (links to open the citations from this article in various online reference manager services)
Cite this article (links to download the citations from this article in formats compatible with various reference manager tools)
Quantitative MRI reveals differences in striatal myelin in children with DLD
eLife 11:e74242.
https://doi.org/10.7554/eLife.74242


