A helicase-tethered ORC flip enables bidirectional helicase loading
- Howard Hughes Medical Institute, Department of Biology, Massachusetts Institute of Technology, United States
- Department of Biochemistry, Brandeis University, United States
Figures
Figure 1 with 4 supplements
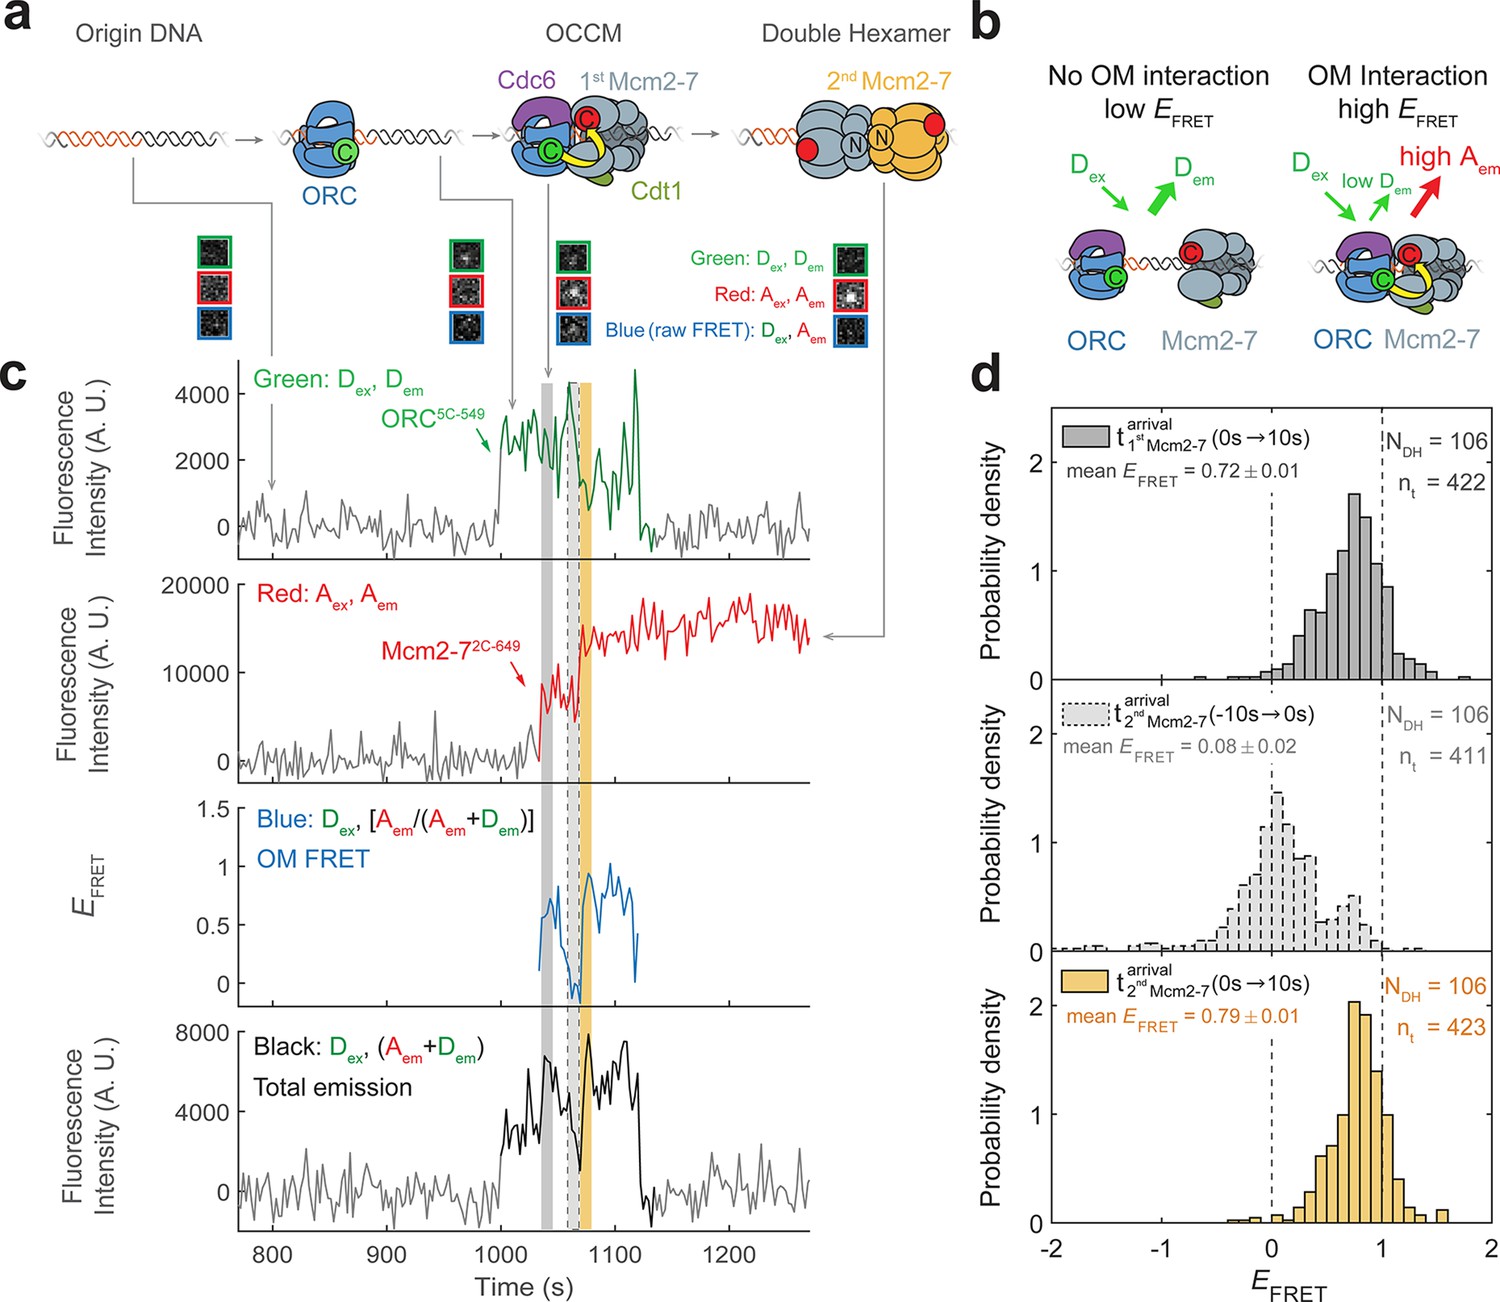
Origin–recognition complex (ORC) recruits two Mcm2-7 helicases through sequential OM interactions.
(a) A schematic of the molecular events during helicase loading. The ORC and Mcm2-7 proteins are labeled at their C-termini (C) which form an interface during first Mcm2-7 recruitment (Yuan et al., 2017). ORC5C-549 is labeled with a donor fluorophore (D; green circles) and Mcm2-72C-649 is labeled with an acceptor fluorophore (A; red circles). The associated fluorescence images show single frames of ORC, Mcm2-7, and raw FRET fluorescence spots at a single DNA molecule in green, red, and blue outlines, respectively. We use gray and yellow coloring to indicate the first and second Mcm2-7 hexamers, respectively. (b) Schematic of DNA-bound ORC5C-549 and Mcm2-72C-649 proteins. When ORC5C-549 and Mcm2-72C-649 are not associated, excitation of the donor (Dex) only yields emission from the donor fluorophore (Dem). However, when ORC5C-549 and Mcm2-72C-649 are in proximity, we observe emission from the acceptor (Aem) on donor excitation due to FRET, and corresponding lower emission from the donor fluorophore (Dem). (c) A representative trace showing ORC and Mcm2-7 associations with DNA and ORC–Mcm2-7 (OM) interactions during helicase loading. Donor-excited fluorescence record shows ORC5C-549 association (green: Dex, Dem panel) and acceptor-excited fluorescence record shows Mcm2-72C-649 association (red: Aex, Aem panel). Gray arrows link to the corresponding molecular events shown in (a). Interaction between ORC and Mcm2-7 decreases the distance between the donor and acceptor fluorophores and results in increased apparent FRET efficiency (EFRET, blue: Dex, [Aem/ (Aem + Dem)] panel). EFRET values are calculated using donor-excited emission from the donor and acceptor fluorophores (see Materials and methods) and they are therefore shown only at times when both a donor and acceptor fluorophore are present on the DNA molecule. The black: Dex, (Aem + Dem) panel shows donor-excited total emission (see Figure 1—figure supplement 3). An objective image-analysis algorithm (Friedman and Gelles, 2015) detects a spot of fluorescence at time points shown in green, red, and black on the time records. Gray, gray-dash, and yellow highlight three 10-s time intervals referenced in (d). A.U., arbitrary units. Concentrations of labeled proteins in the reaction are 0.5 nM ORC5C-549, 15 nM Cdt1–Mcm2-72C-649. Figure 1—figure supplement 2a shows additional records. (d) Histogram plots of EFRET values for 106 single-ORC-mediated, double-hexamer formation events during three 10-s time intervals: immediately after the first (top) or second Mcm2-7 (bottom) arrives or before the second Mcm2-7 arrives (middle). Examples of these intervals are indicated in (c) with gray, yellow, and gray-dash, respectively. The two dashed lines indicate EFRET values of 0 and 1. NDH, number of double-hexamer formation events and nt, number of signal points. Rare EFRET values below −2 and above +2 were excluded (2/428, 13/428, and 1/428 signal points from the top, middle, and bottom histograms, respectively).
-
Figure 1—source data 1
Primary data for histograms in Figure 1d.
- https://cdn.elifesciences.org/articles/74282/elife-74282-fig1-data1-v3.xlsx
Figure 1—figure supplement 1
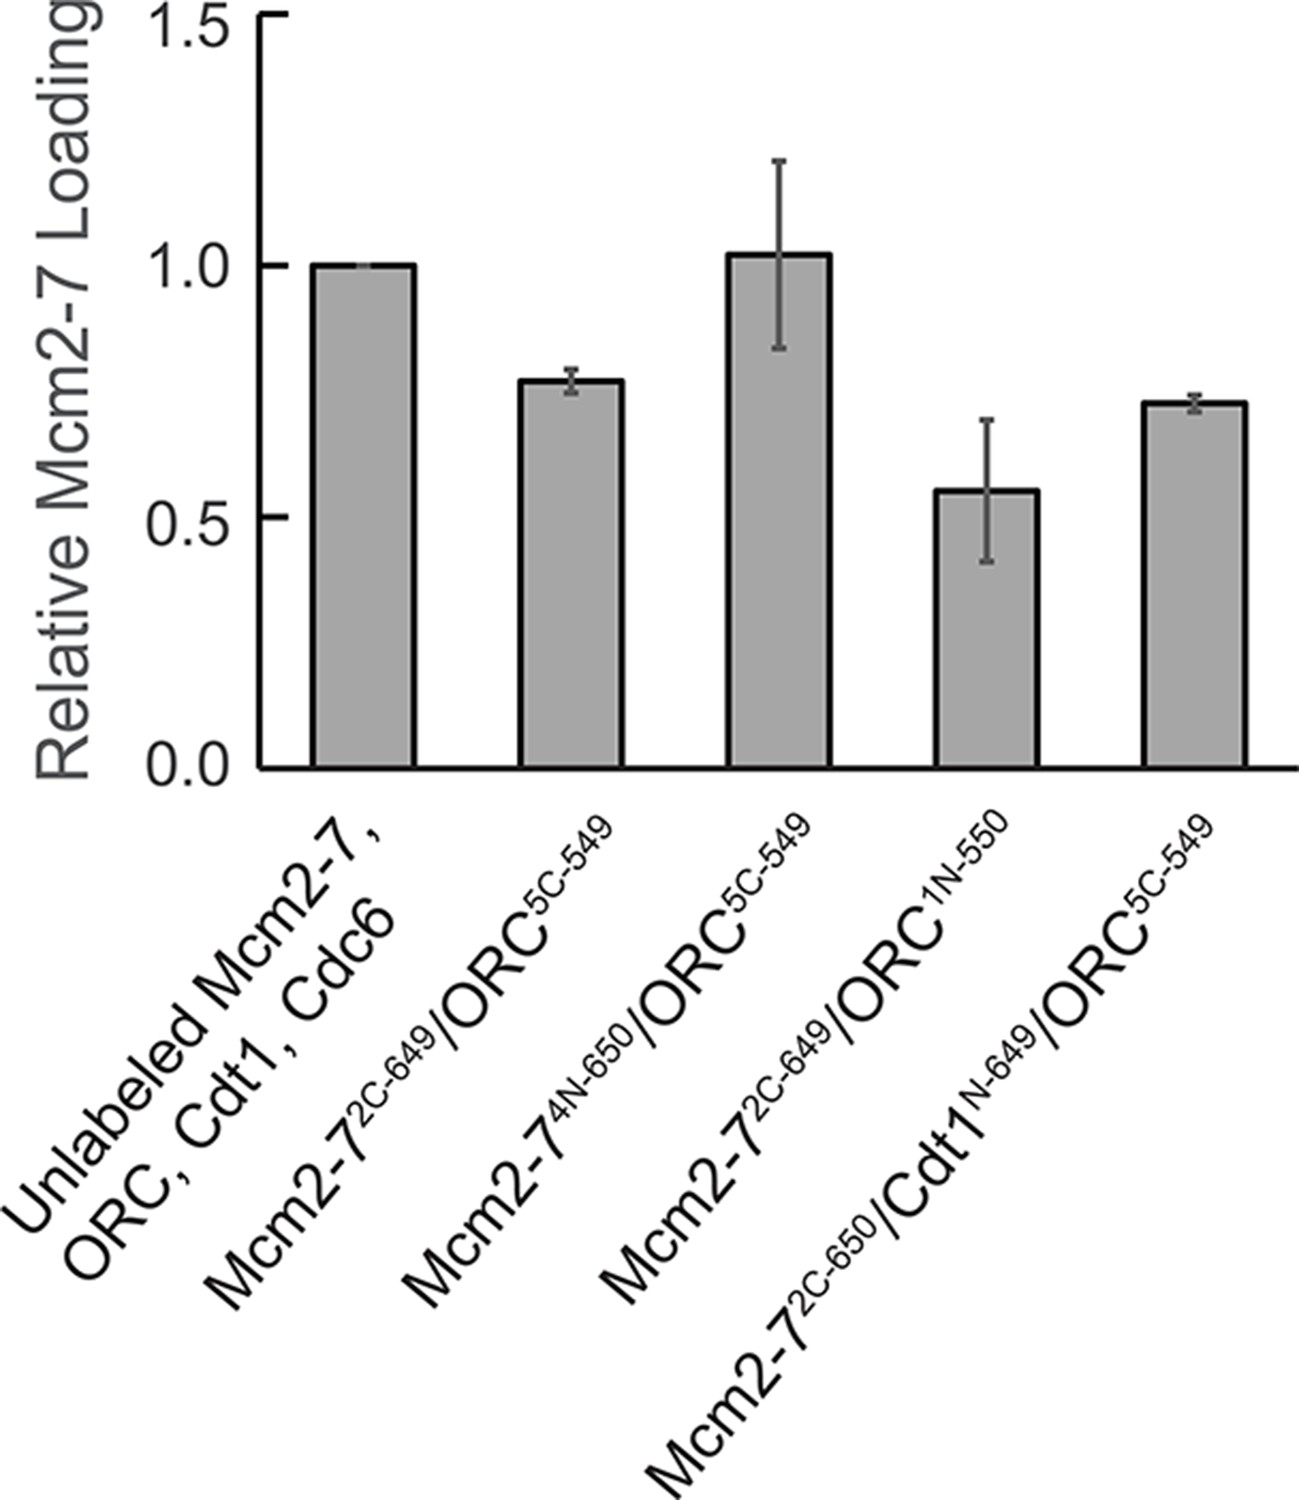
Fluorescently labeled proteins function in ensemble helicase-loading assays.
Bulk helicase-loading assays were used to measure the activity of the fluorescently labeled proteins relative to their unlabeled counterparts. All samples were subjected to a high-salt wash, separated by sodium dodecyl sulfate–polyacrylamide gel electrophoresis (SDS–PAGE), stained with Krypton protein stain, and quantified. Reactions were performed in duplicate and error bars indicate the standard deviation.
-
Figure 1—figure supplement 1—source data 1
Primary data and quantification for graph in Figure 1—figure supplement 1.
- https://cdn.elifesciences.org/articles/74282/elife-74282-fig1-figsupp1-data1-v3.xlsx
Figure 1—figure supplement 2
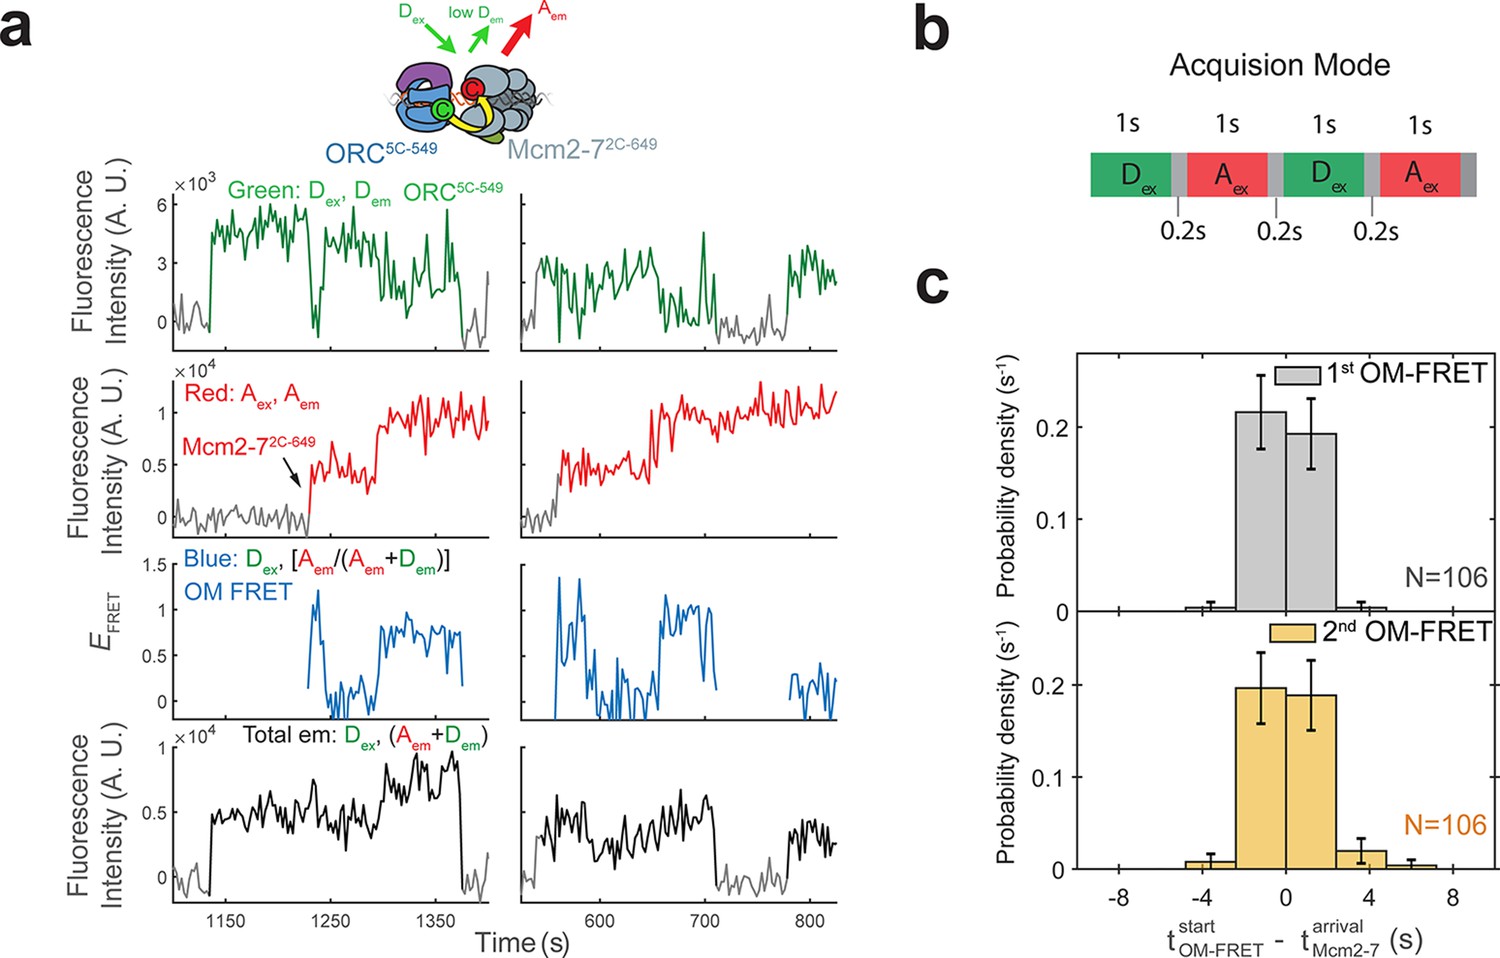
Each Mcm2-7 arrival is associated with an OM interaction.
(a) Additional fluorescence intensity traces from the experiment in Figure 1c. (b) In our sm-FRET experiments, we acquired 1-s duration frames alternately exciting the donor and acceptor fluorophores with the 532 and 633 nm lasers, respectively. Gray boxes indicate dead time (average 0.2 s) between consecutive frames. (c) OM interactions begin when the corresponding Mcm2-7 associates with DNA. The time to OM-FRET after the corresponding Mcm2-7 arrival is plotted as a histogram. Top panel shows first OM interaction relative to first Mcm2-7 arrival and bottom panel shows second OM interaction relative to second Mcm2-7 arrival. OM-FRET start times within ±2.4 s of Mcm2-7 arrival are simultaneous within the time resolution of our experiment. Negative values indicate instances where OM-FRET is detected in the donor-excited channel (Dex) before Mcm2-7 arrival is detected in the acceptor-excited channel (Aex); bin width is 2.4 s.
Figure 1—figure supplement 3
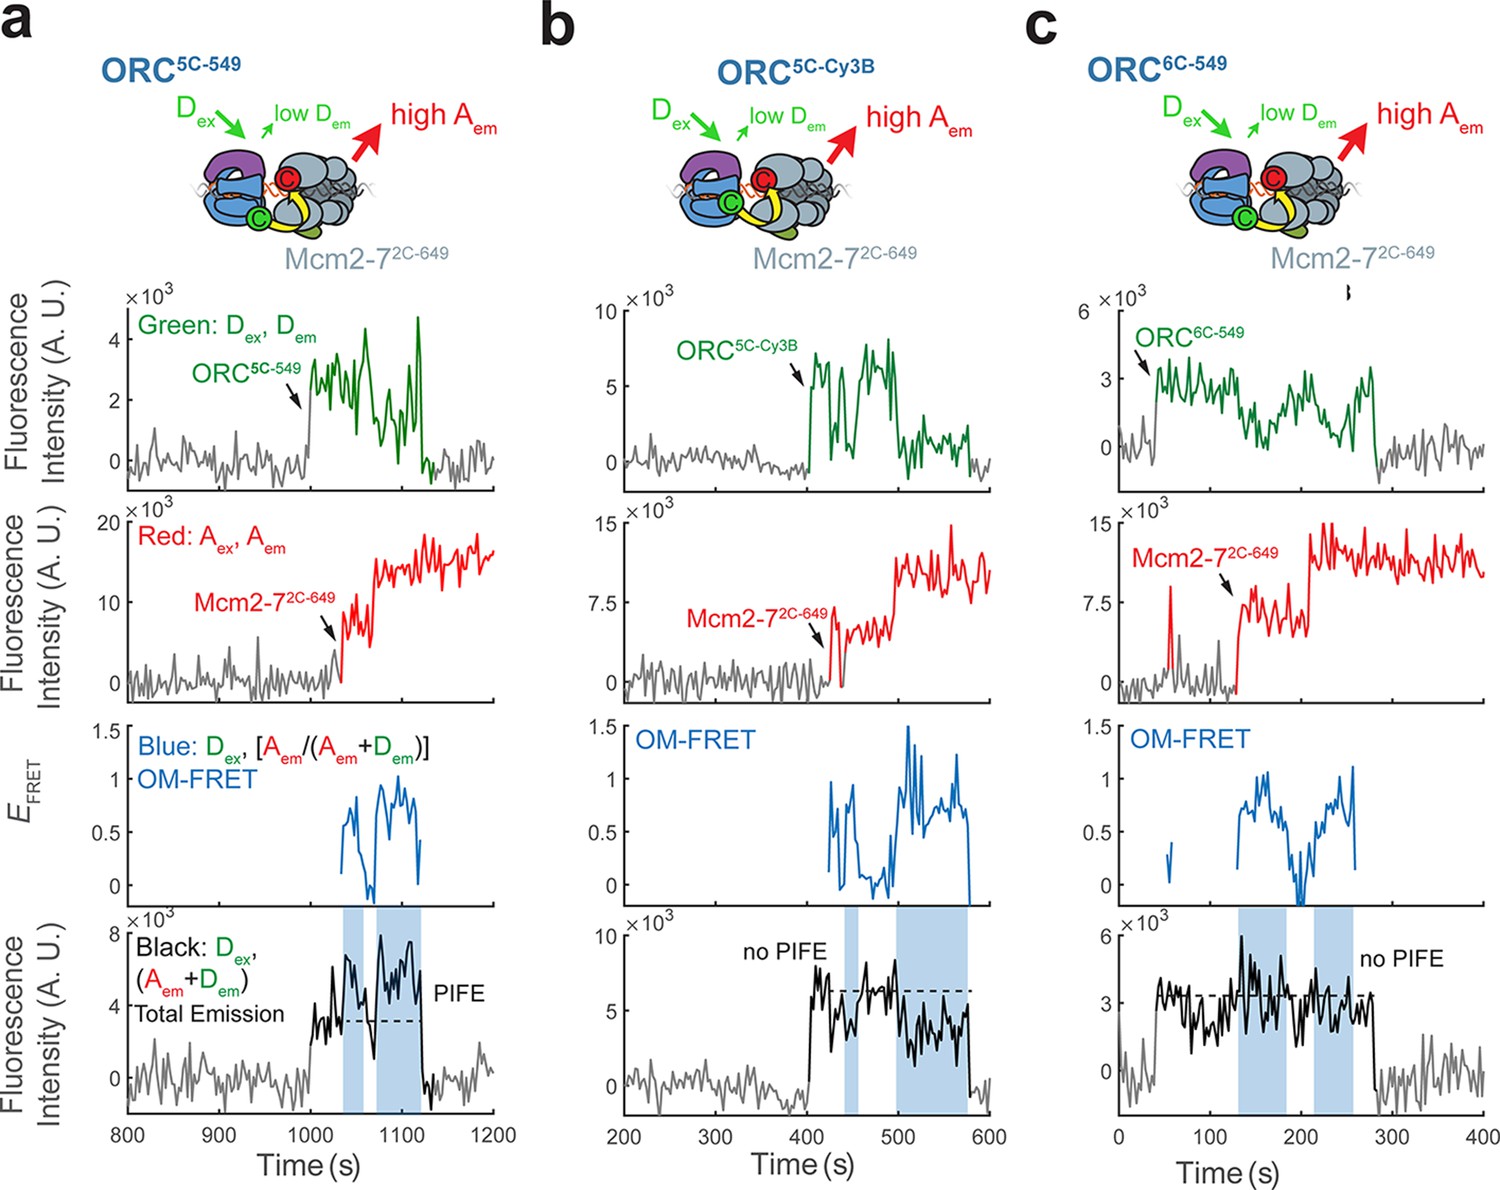
Enhancement of total emission upon donor excitation during OM interactions is due to protein-induced fluorescence enhancement (PIFE) exhibited by ORC5C-549.
(a) Total emission on donor excitation is enhanced during periods of high EFRET in experiments with ORC5C-549 and Mcm2-72C-649 (Figure 1c). The fluorescence intensity traces in Figure 1c are shown. Blue shaded areas on the total donor-excited emission panel (black: Dex, (Dem + Aem)) indicate the times with OM-FRET during double-hexamer formation. The dashed line on the total donor-excited emission panel indicates the approximate total emission intensity when only origin–recognition complex (ORC) is bound to DNA. We infer the increase in intensity over this value is due to PIFE of the Dy-549 fluorophore. (b) The enhancement in total emission in (a) is eliminated by the use of an alternative fluorophore, Cy3B. Cy3B has a rigidified scaffold that does not exhibit PIFE (Hwang et al., 2011; Myong et al., 2009). Fluorescence intensity traces with ORC5C-Cy3B show that when ORC is labeled at the same position as ORC5C-549 with the Cy3B fluorophore, total emission during OM-FRET is modestly reduced (compare with the total emission panels in Figure 1c and Figure 1—figure supplement 2a). Blue shaded areas indicate the times with OM-FRET during double-hexamer formation. (c) Enhanced total emission on donor excitation in experiments with ORC5C-549 (inferred to be due to PIFE) is specific to the position of the label at the Orc5 C-terminus. When the position of the C-terminal label on ORC is changed from Orc5 to Orc6 but the same Dy549 dye is used we observe little or no PIFE. Fluorescence intensity traces with ORC6C-549 show that the increase in total emission during OM-FRET is lost. Blue shaded areas indicate intervals with OM-FRET.
Figure 1—figure supplement 4
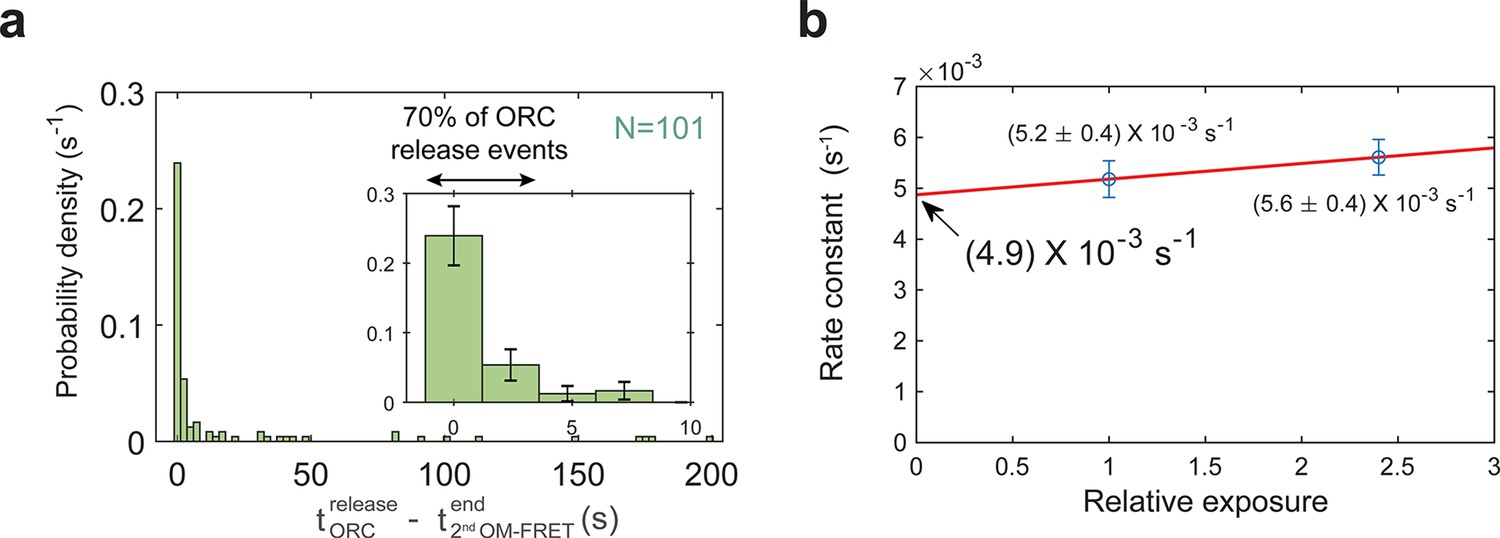
The end of the second OM interaction is concomitant with origin–recognition complex (ORC) departure in a majority of helicase-loading events.
(a) Histogram of time to ORC release after the second OM-FRET ends. In 70% of the double-hexamer formation events, ORC releases within 3.6 s of the end of the second OM-FRET. Five long ORC release events are not shown (dwell times of 241, 266, 268, 382, and 417 s). Inset shows expanded x-axis and 74% of total events; bin size 2.4 s for both plots. (b) ORC5C-549 photobleaching rate measurement. The calculated dwell times for ORC5C-549 in a helicase-loading reaction were measured for different relative laser exposures and fit to single exponential functions. Data for the experiments shown throughout the manuscript were acquired at a relative laser exposure of 1. To measure the effect of photobleaching, the relative exposure was modulated by changing the exposure time to the laser. The relative exposure (horizontal axis) is plotted against the off-rate constant (vertical axis ± standard error of the mean [SEM]). ORC5C-549 photobleaching rate (under experimental conditions with relative exposure of 1 is (3.0 ± 3.6) × 10−4 s−1 which corresponds to a half-life of ~2300 s). The mean dwell time of ORC5C-549 after second Mcm2-7 arrival is 88 ± 9 s. Because the photobleaching lifetime is much longer than the mean ORC dwell time (>26-fold longer), photobleaching does not appreciably contribute to the loss of ORC fluorescence observed in Figure 1c and Figure 1—figure supplement 2a.
Figure 2 with 2 supplements
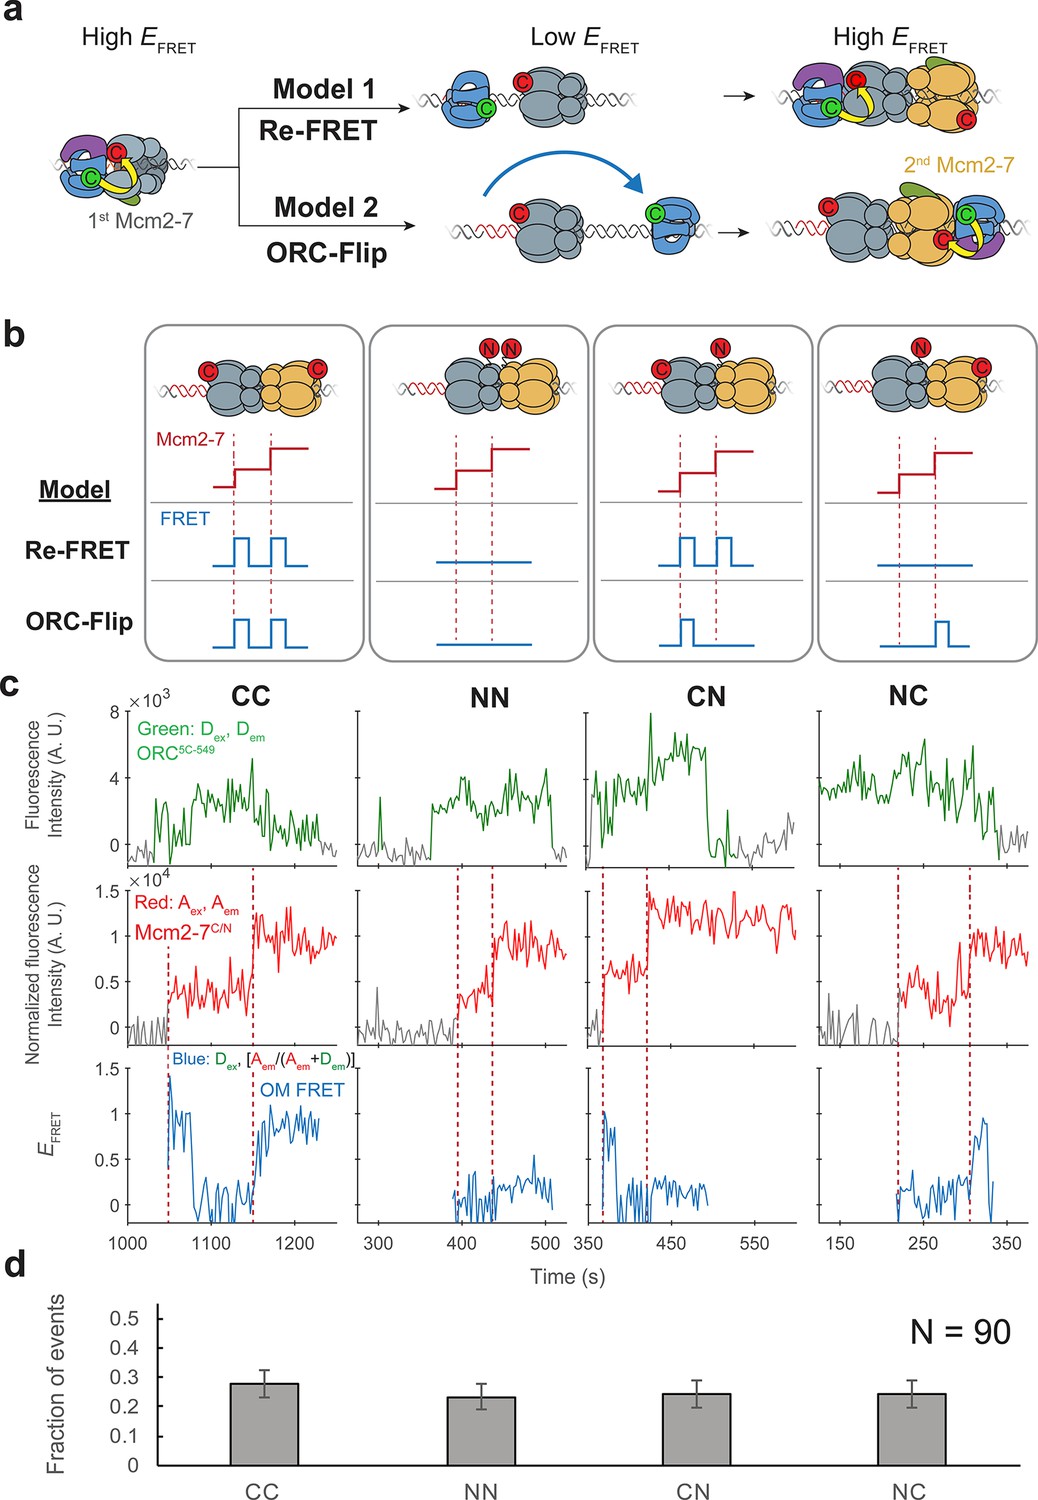
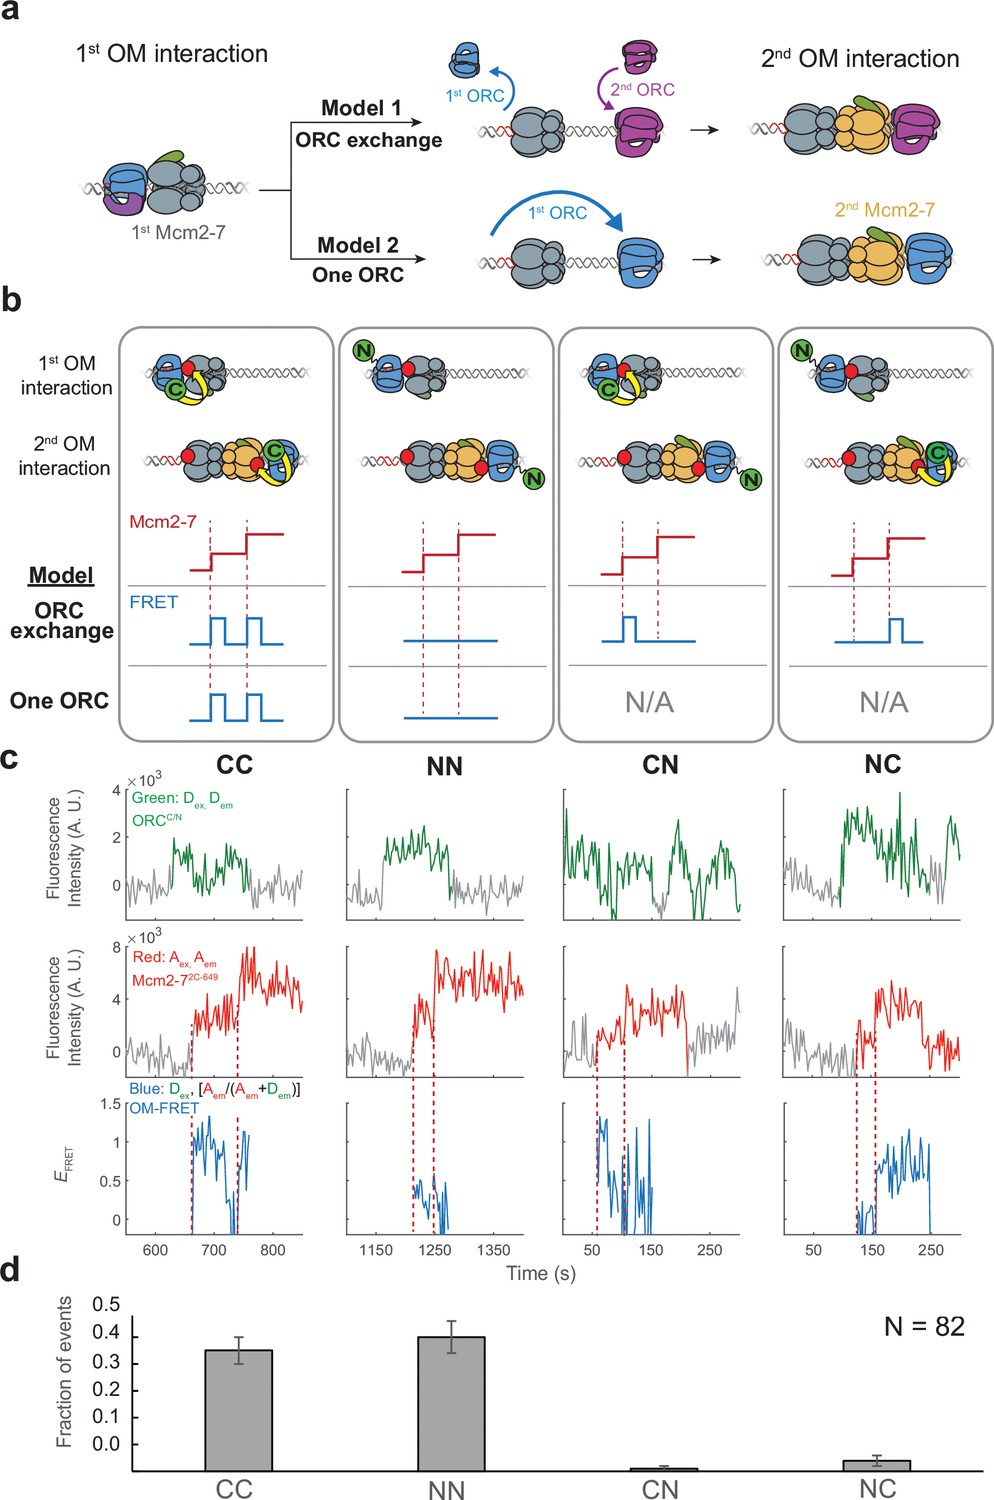
ORC makes OM interactions sequentially with the first and second Mcm2-7 helicases.
(a) Two models to explain an OM-FRET interaction accompanying each Mcm2-7 arrival in an experiment (Figure 1) in which both ORC and Mcm2-7 are C-terminally labeled. Both models begin with ORC recruiting the first Mcm2-7 via the first OM interaction (high EFRET). In the Re-FRET model, ORC separates from the first Mcm2-7 (resulting in low EFRET) followed by reinteracting with the first Mcm2-7. In the ORC-flip model, ORC releases from its original binding site and rebinds the DNA at a second inverted binding site on the other side of Mcm2-7, resulting in lower EFRET. The flipped ORC then recruits the second Mcm2-7 via a second OM interaction. (b) Experimental setup to distinguish between the Re-FRET and ORC-Flip models. Acceptor-labeled Mcm2-72C-649 (C; red circles) and Mcm2-74N-650 (N; red circles) are mixed in an equimolar ratio, resulting in four subpopulations of double hexamers – CC, NN, CN, and NC. Red dashed lines indicate Mcm2-7 arrival times during double-hexamer formation. Only the C-terminally labeled Mcm2-72C-649 molecules exhibit high FRET with donor-labeled ORC5C-549. The Re-FRET and ORC-flip models predict distinct FRET profiles for the four double-hexamer populations generated. Importantly, the observation of single FRET peaks is unique to the ORC-flip model. (c) Representative double-hexamer formation events from an experiment with mixed Mcm2-72C-649 and Mcm2-74N-650. Concentrations of labeled proteins in the reaction are 0.5 nM ORC5C-549, 7.5 nM Cdt1–Mcm2-72C-649 and 7.5 nM Cdt1–Mcm2-74N-650. Figure 2—figure supplement 2 shows additional records of CN and NC double hexamers. (d) The fraction of observed events (± standard error, SE) corresponding to the type of FRET profile shown above in (c).
-
Figure 2—source data 1
Primary data for graph in Figure 2d.
- https://cdn.elifesciences.org/articles/74282/elife-74282-fig2-data1-v3.xlsx
Figure 2—figure supplement 1
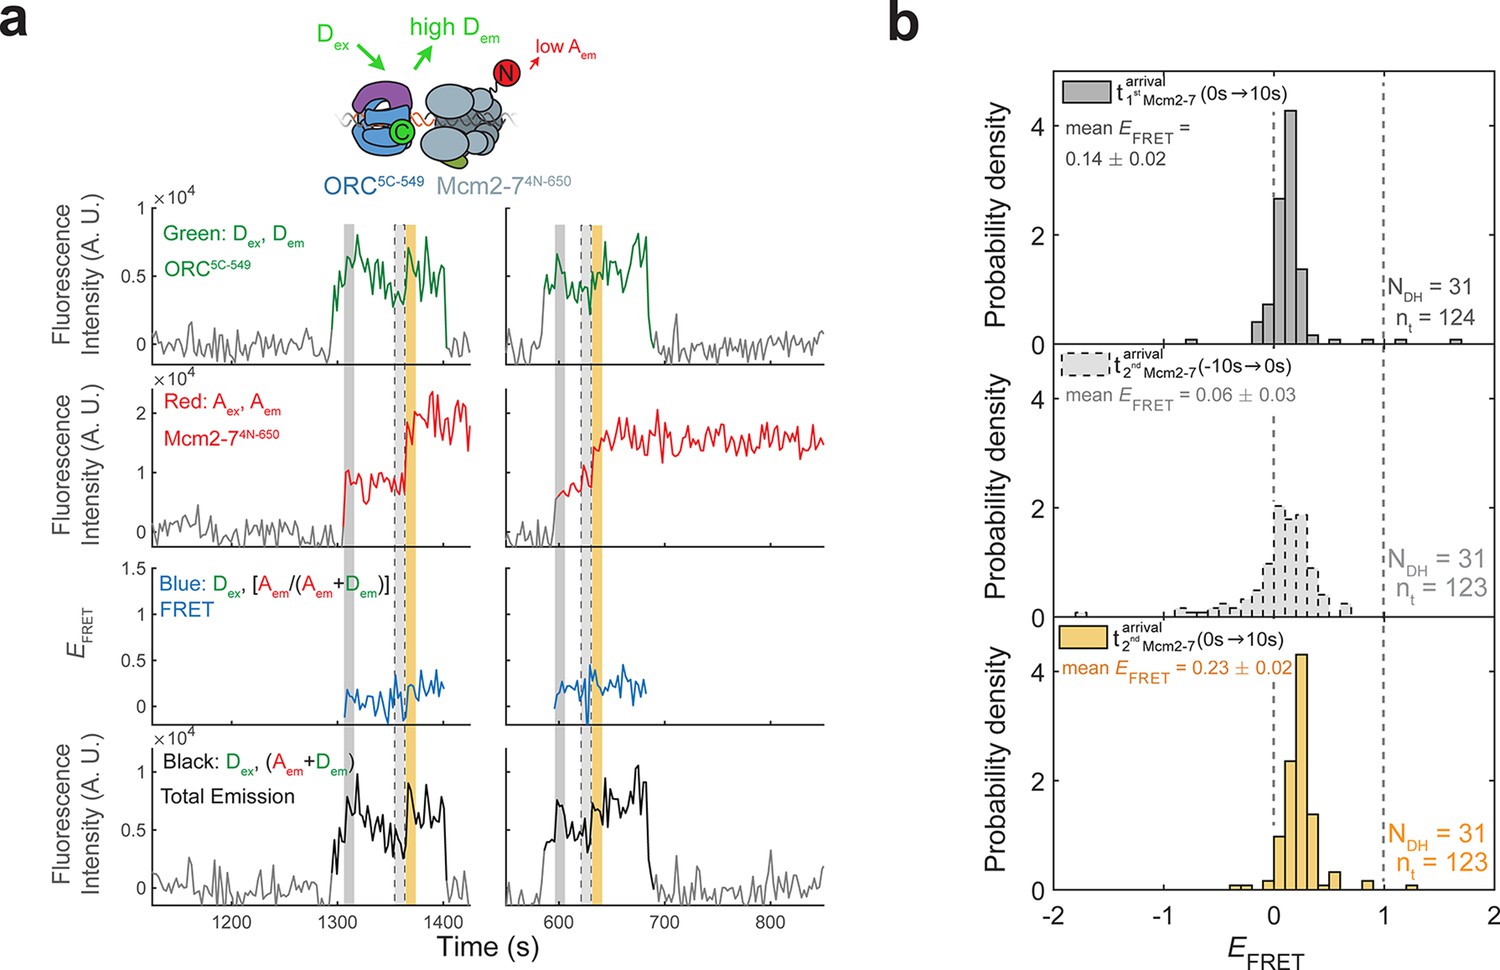
Mcm2-74N-650 does not exhibit high EFRET with ORC5C-549.
(a) Fluorescence intensity traces from an experiment with ORC5C-549 (donor) and Mcm2-74N-650 (acceptor). Note the lower EFRET values observed for this site of Mcm2-7 modification compared to those in Figure 1c. (b) Histogram plots of EFRET values for 31 successful double-hexamer formation events with Mcm2-74N-650 during the same three 10-s time intervals described in Figure 1d: immediately after the first (top) or second Mcm2-7 (bottom) arrives or before the second Mcm2-7 arrives (middle). Examples of these intervals are indicated in (a) highlighted with gray, yellow, and gray-dash, respectively. NDH, number of double-hexamer formation events and nt, number of signal points.
Figure 2—figure supplement 2
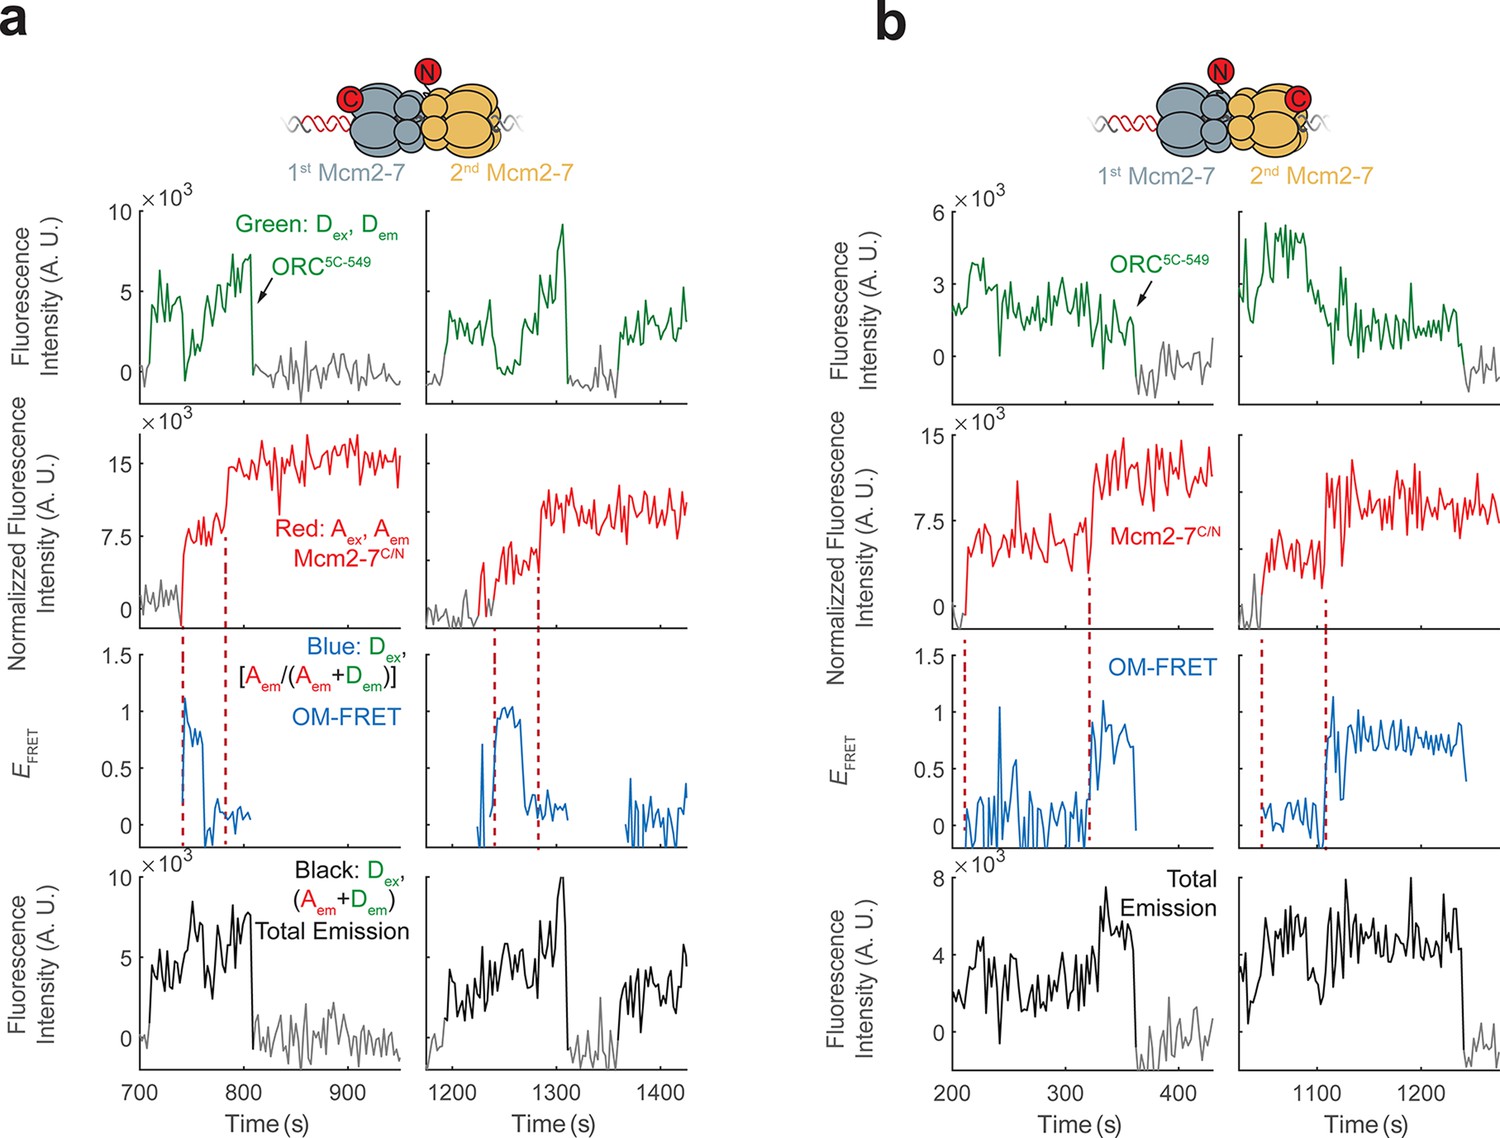
Additional fluorescence intensity traces for the mixed double-hexamer populations with single OM-FRET peaks observed in Figure 2c.
(a) Two examples of CN double hexamers where only the first Mcm2-7 arrival is accompanied by an OM interaction. (b) Two examples of NC double hexamers in which only the second Mcm2-7 arrival is accompanied by an OM interaction.
Figure 3 with 1 supplement
The same ORC molecule interacts with both Mcm2-7 helicases.
(a) Two models that can explain how ORC interacts with both Mcm2-7 helicases. Both models are consistent with the observation of uninterrupted fluorescence of a single ORC throughout both helicase recruitment events. In the ‘ORC-exchange’ model, what appears to be a single, continuously present ORC is in fact rapid and coordinated exchange of two ORC molecules that recruit the first and second Mcm2-7 helicases, respectively. In the ‘one-ORC’ model, the same ORC recruits both helicases. (b) Experimental setup to distinguish between the ORC-exchange and one-ORC models. A mixture of donor-labeled ORC5C-549 (C; green circles) and ORC1N-550 (N; green circles) is added to a reaction with acceptor-labeled Mcm2-72C-649. Only ORC5C-549 (C-terminally labeled) can FRET with Mcm2-72C-649 (Figure 3—figure supplement 1). Red dashed lines indicate Mcm2-7 arrival times. The predicted FRET results are illustrated for each model. There are four possible types of ORC pairs and corresponding FRET results when two ORC molecules mediate first and second OM interactions – CC, NN, CN, and NC. However, in the one-ORC model only the CC and NN pairs are possible resulting in only two possible FRET results. N/A, not applicable. (c) Representative double-hexamer formation events in an experiment with mixed ORC5C-549 and ORC1N-550. Concentrations of labeled proteins in the reaction are 0.25 nM ORC5C-549, 0.25 nM ORC1N-550, and 15 nM Cdt1-Mcm2-72C-649. (d) The fraction of events that correspond to each type of FRET profile shown above in (c).
-
Figure 3—source data 1
Primary data for graph in Figure 3d.
- https://cdn.elifesciences.org/articles/74282/elife-74282-fig3-data1-v3.xlsx
Figure 3—figure supplement 1
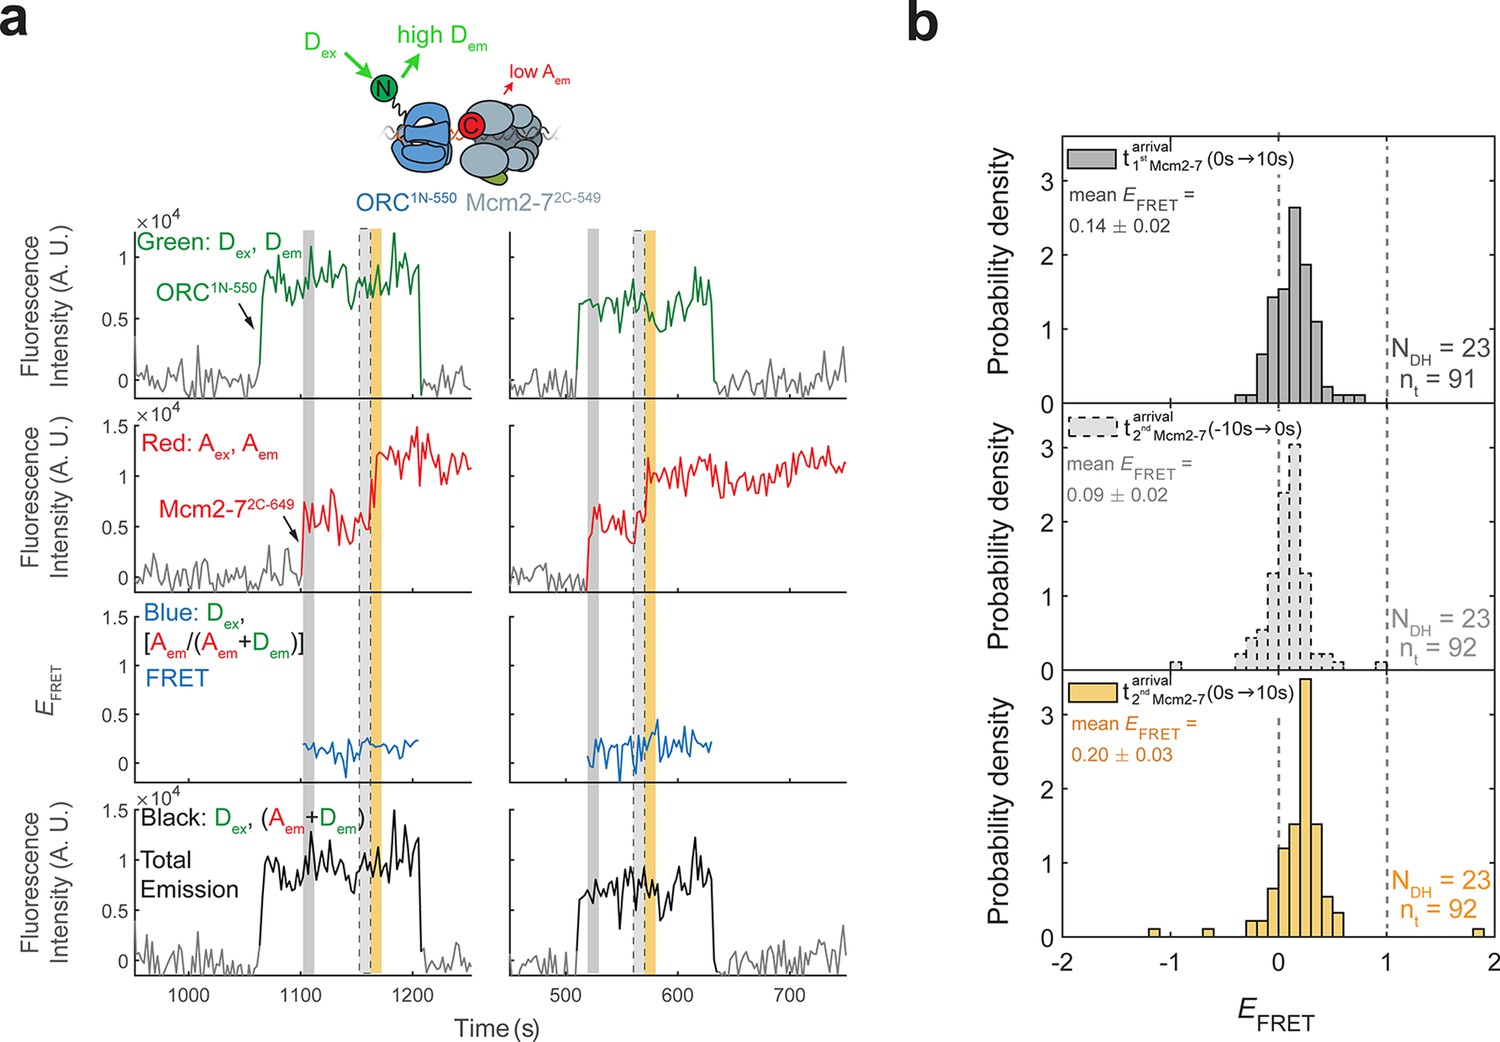
ORC1N-550 does not exhibit high EFRET with Mcm2-72C-649.
(a) Fluorescence intensity traces from an experiment with ORC1N-550 which is labeled at the N-terminus of Orc1 with a donor fluorophore and Mcm2-72C-649 (acceptor fluorophore). Note the low EFRET values observed for this site of ORC modification compared to those in Figure 1c. (b) Histogram plots of EFRET values for 23 successful double-hexamer formation events with ORC1-550 during the same three 10-s time intervals as in Figure 1d: immediately after the first (top) or second Mcm2-7 (bottom) arrives or before the second Mcm2-7 arrives (middle). Examples of these intervals are indicated in (a) highlighted with gray, yellow, and gray-dash, respectively. NDH, number of double-hexamer formation events and nt, number of signal points.
Figure 4 with 4 supplements
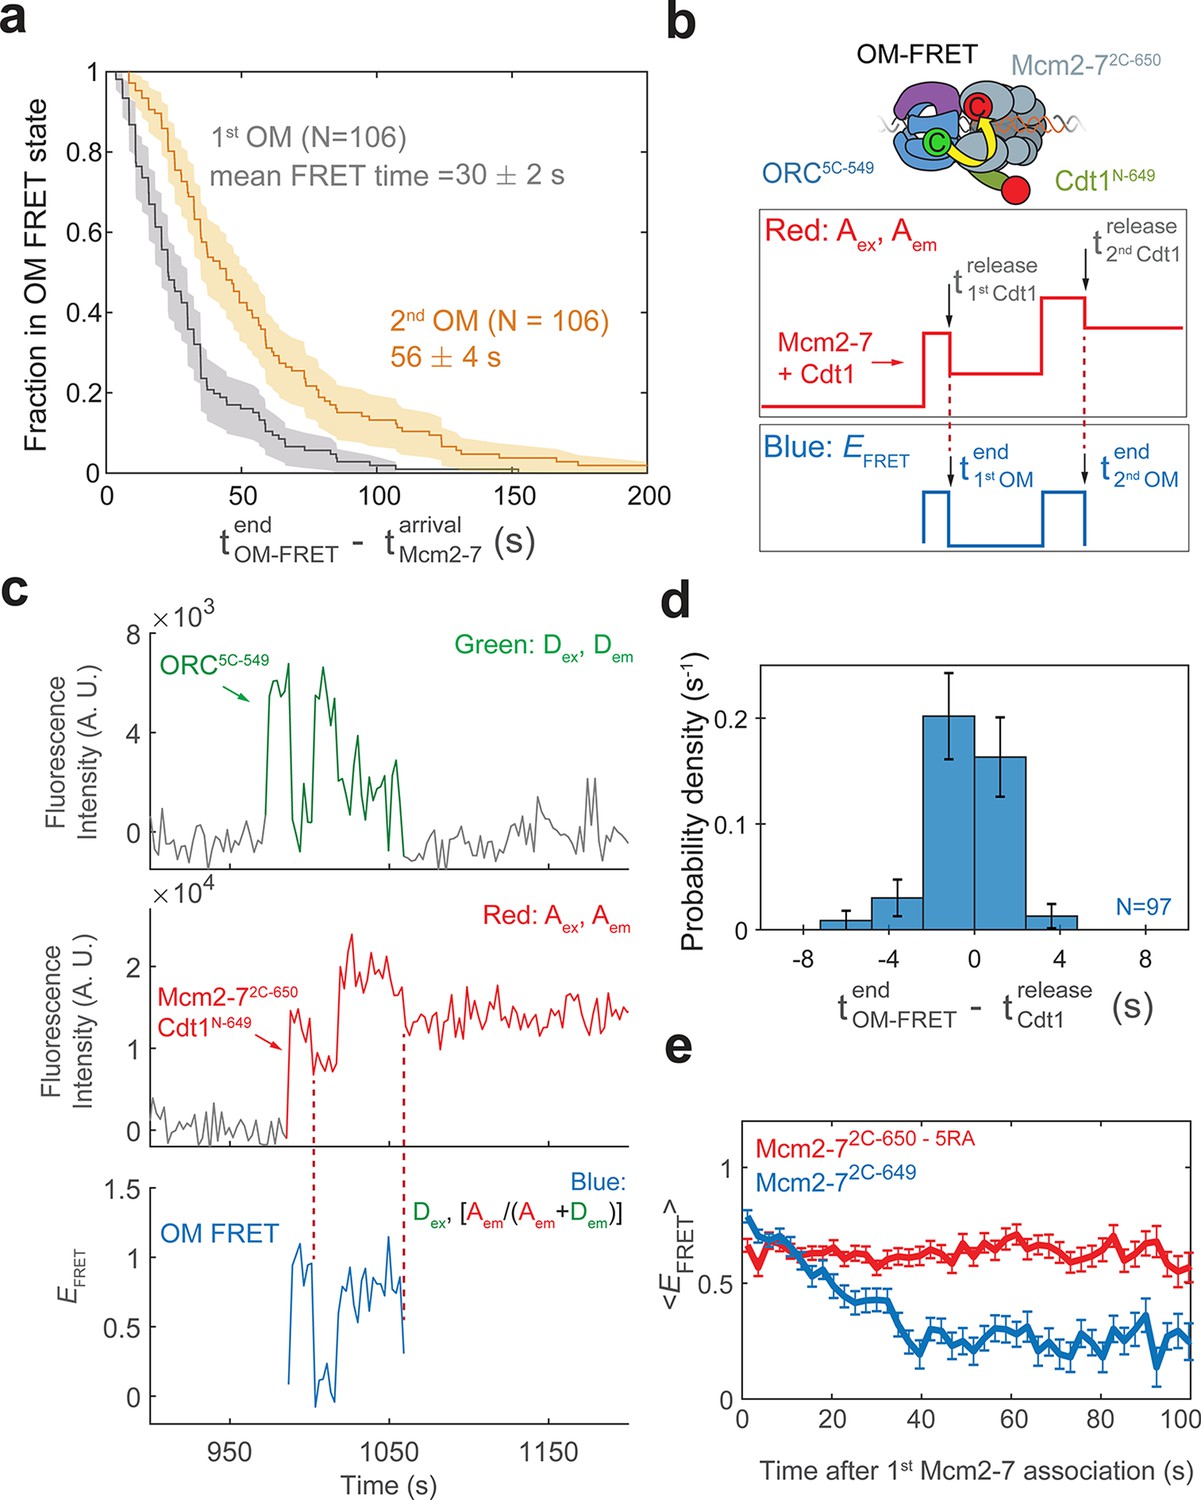
Cdt1 release is concomitant with the end of each OM interaction on individual DNAs.
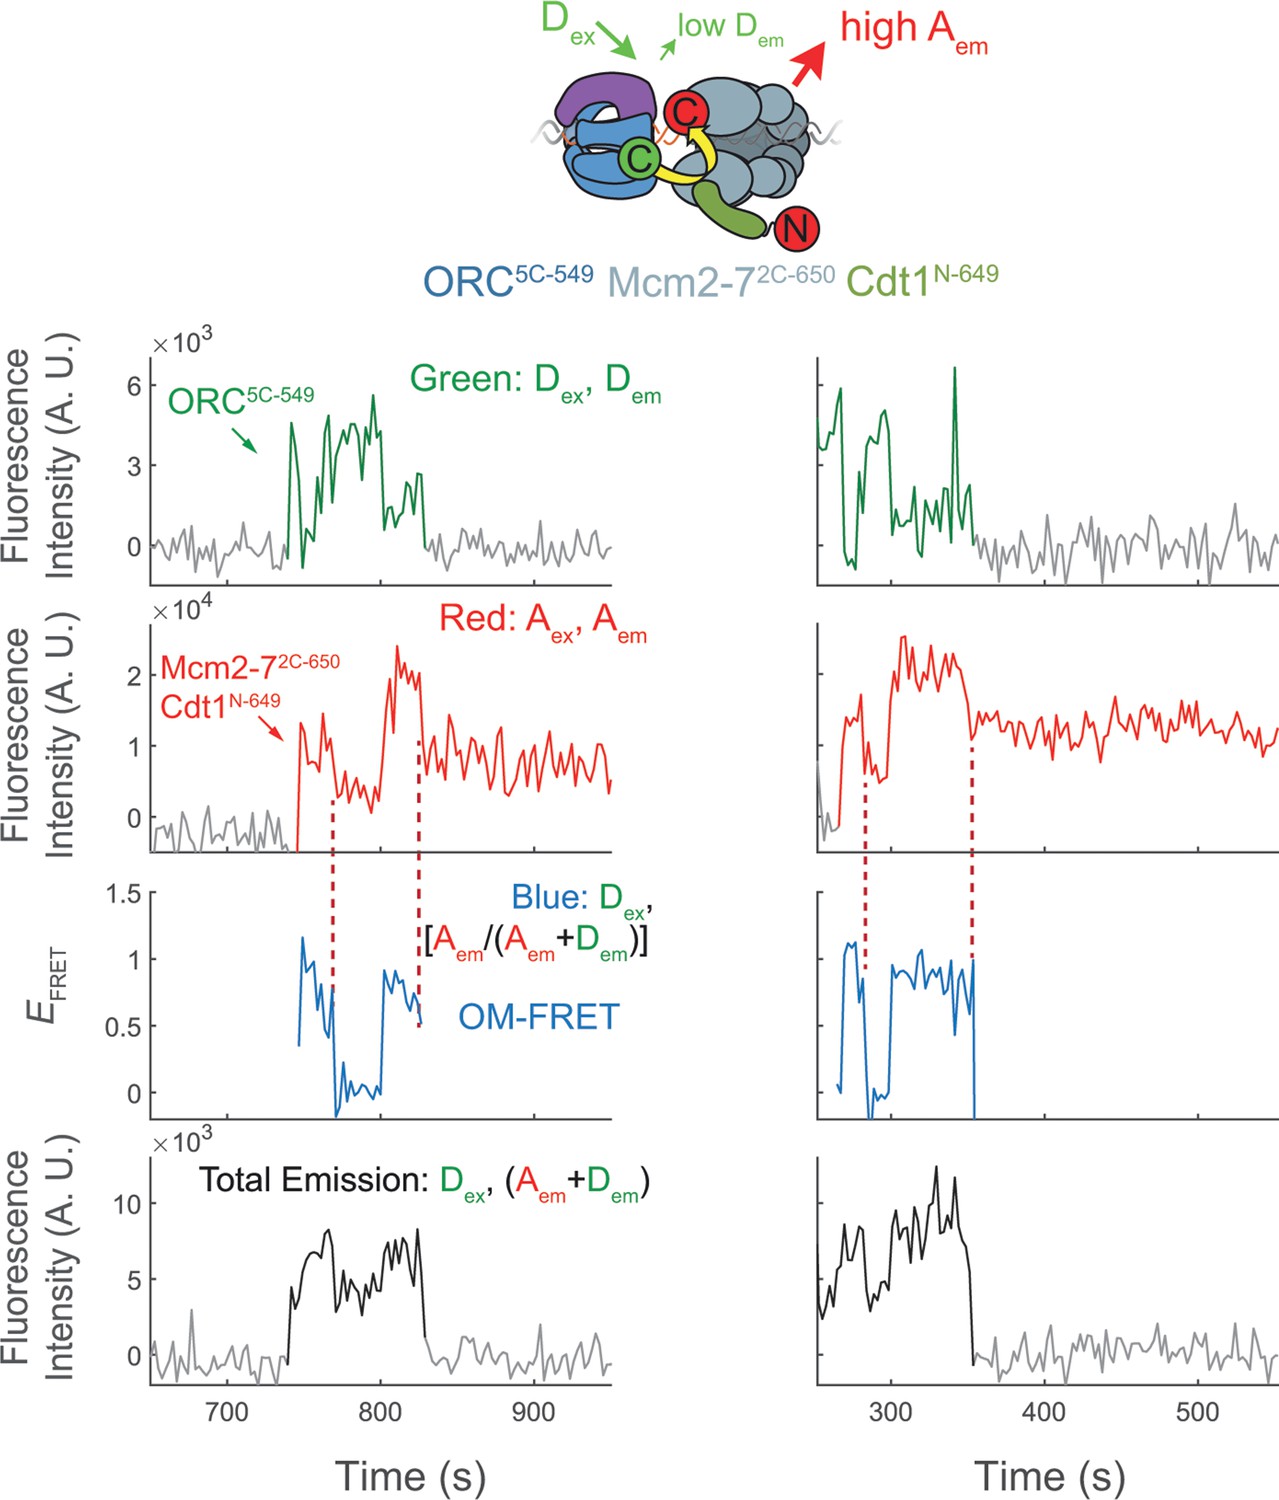
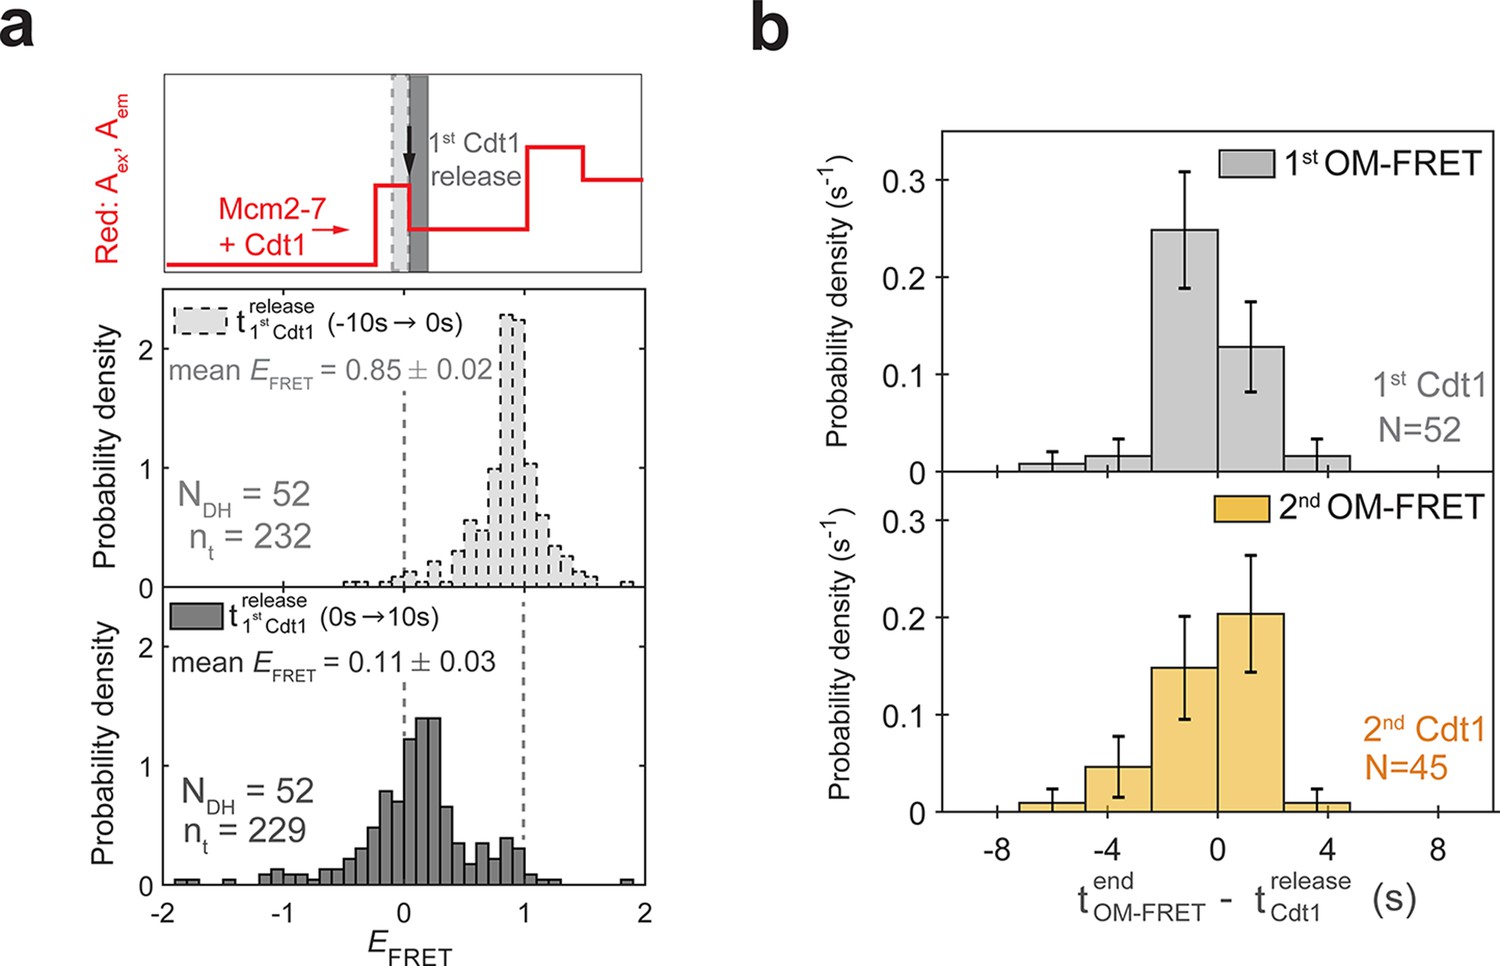
(a) Duration of the first (gray) and second (yellow) OM interactions after the association of the corresponding Mcm2-7 (from experiment in Figure 1) are plotted as survival functions. Shaded areas represent the 95% confidence intervals for each curve. (b) Experimental setup for observation of Cdt1 release and OM interactions in the same recording. Origin–recognition complex (ORC) and Mcm2-7 are labeled using the OM-FRET pair at ORC5C-549 (donor) and Mcm2-72C-650 (acceptor). Cdt1N-649 is also labeled with an acceptor fluorophore, but at a position that exhibits low EFRET with ORC5C-549 (Figure 4—figure supplement 1). The example traces show the expected results if Cdt1 release is simultaneous with the end of the OM interaction. Each Mcm2-72C-650/Cdt1N-649 association results in an increase in fluorescence in the acceptor-excited fluorescence record (red: Aex, Aem panel). Black arrows indicate the Cdt1N-649 release, which results in loss of roughly half of the acceptor fluorescence. Each Mcm2-72C-650/Cdt1N-649 arrival is accompanied by high EFRET due to OM interaction (blue: EFRET panel). The black arrows indicate the end of OM-FRET if Cdt1 release is concomitant with the end of OM interactions. (c) A representative trace showing the sequential association of two Mcm2-72C-650/Cdt1N-649 molecules and OM-FRET. The red dashed lines indicate Cdt1-release times. Concentrations of labeled proteins in the reaction are 0.5 nM ORC5C-549, 10 nM Mcm2-72C-649, and 10 nM Cdt1N-649. Figure 4—figure supplement 3 shows additional records. (d) Cdt1 release is correlated with the end of OM interactions. The duration of OM-FRET after Cdt1 release (± standard error [SE]) is plotted as a histogram. Data from the first and second Cdt1 releases are combined and plotted with a bin width of 2.4 s. We could observe Cdt1 association and release in 99/114 Mcm2-7 association events (Cdt1 was unlabeled in 15/114 events). Not shown are 2/99 events where OM interactions persisted much longer after the corresponding Cdt1 was released (56.8 and 179.8 s). (e) OM interaction times are extended when Cdt1 release is disrupted. Comparison of the population-average OM interaction EFRET values (± standard error of the mean [SEM]) at indicated times after the first Mcm2-7 association for Mcm2-72C-650,5RA (which is defective in Cdt1 release; N = 128) and Mcm2-72C-649 (N = 106). In the experiment with Mcm2-72C-650,5RA, sample size was limited to the first half of the DNA locations (174/348), which had 128 Mcm2-7 association events with OM-FRET.
-
Figure 4—source data 1
Primary data for histogram in Figure 4d.
- https://cdn.elifesciences.org/articles/74282/elife-74282-fig4-data1-v3.xlsx
Figure 4—figure supplement 1
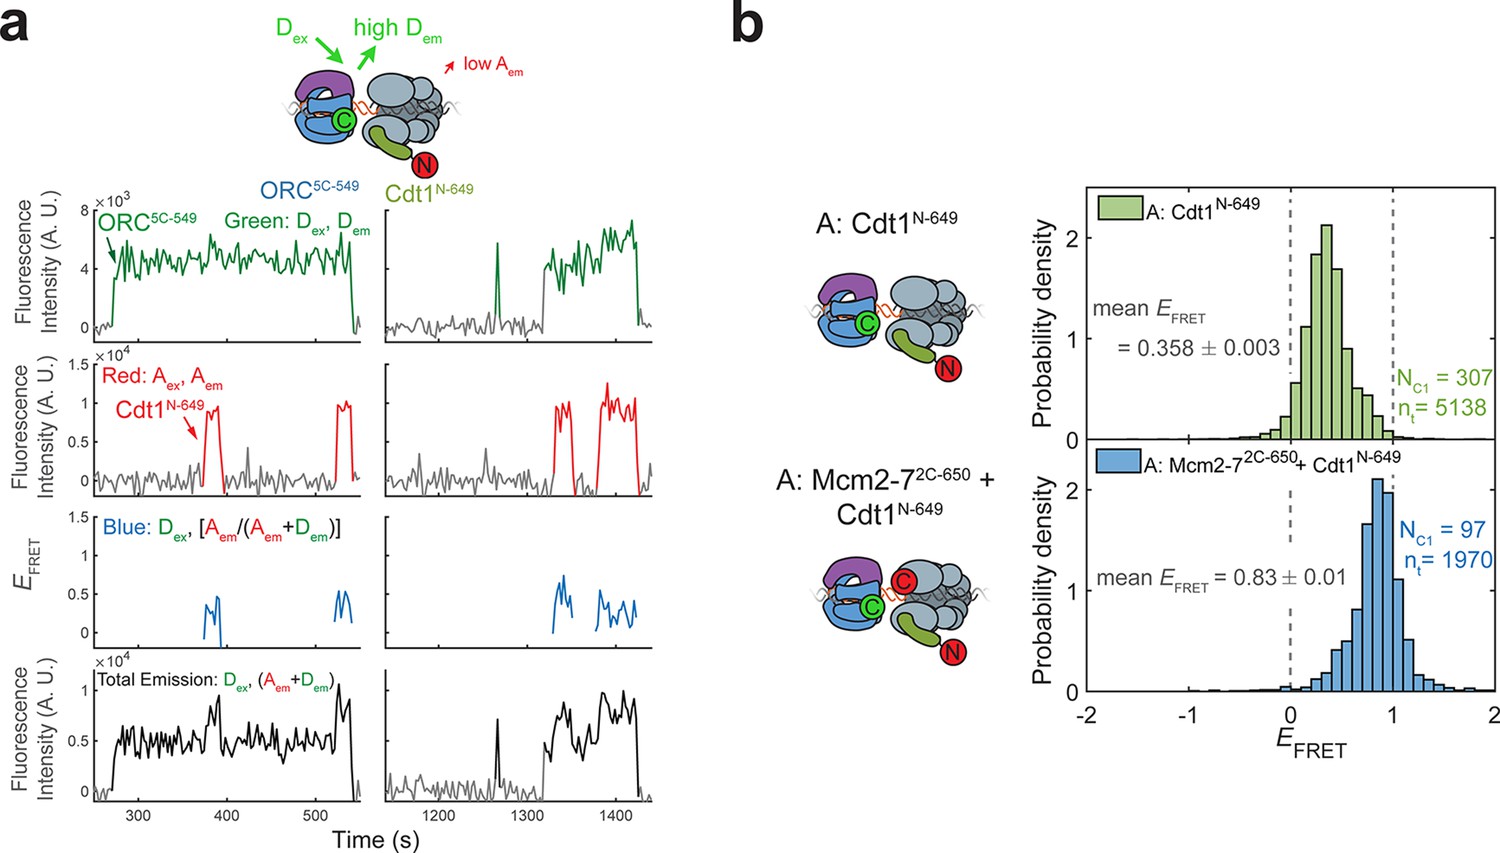
Cdt1N-649 does not exhibit high EFRET with ORC5C-549.
(a) Fluorescence intensity traces for an experiment with ORC5C-549 (donor), Cdt1N-649 (acceptor), and unlabeled Mcm2-7. Although FRET is observed when Cdt1 is present, the values are consistently lower than that observed between ORC5C-549 and Mcm2-72C-649 (see Figure 1c,d) (b) Histograms of EFRET values with ORC5C-549, Cdt1N-649, and unlabeled Mcm2-7 (top) compared with reactions in which Mcm2-7 is also labeled with an acceptor fluorophore at the Mcm2 C-terminus (Mcm2-72C-650, bottom). The two dashed lines indicate EFRET values of 0 and 1. NC1, number of Cdt1-binding events and nt, number of signal points.
Figure 4—figure supplement 2
Disappearance of Cdt1N-649 fluorescence in the experiment in Figure 4b, c cannot be explained by photobleaching.
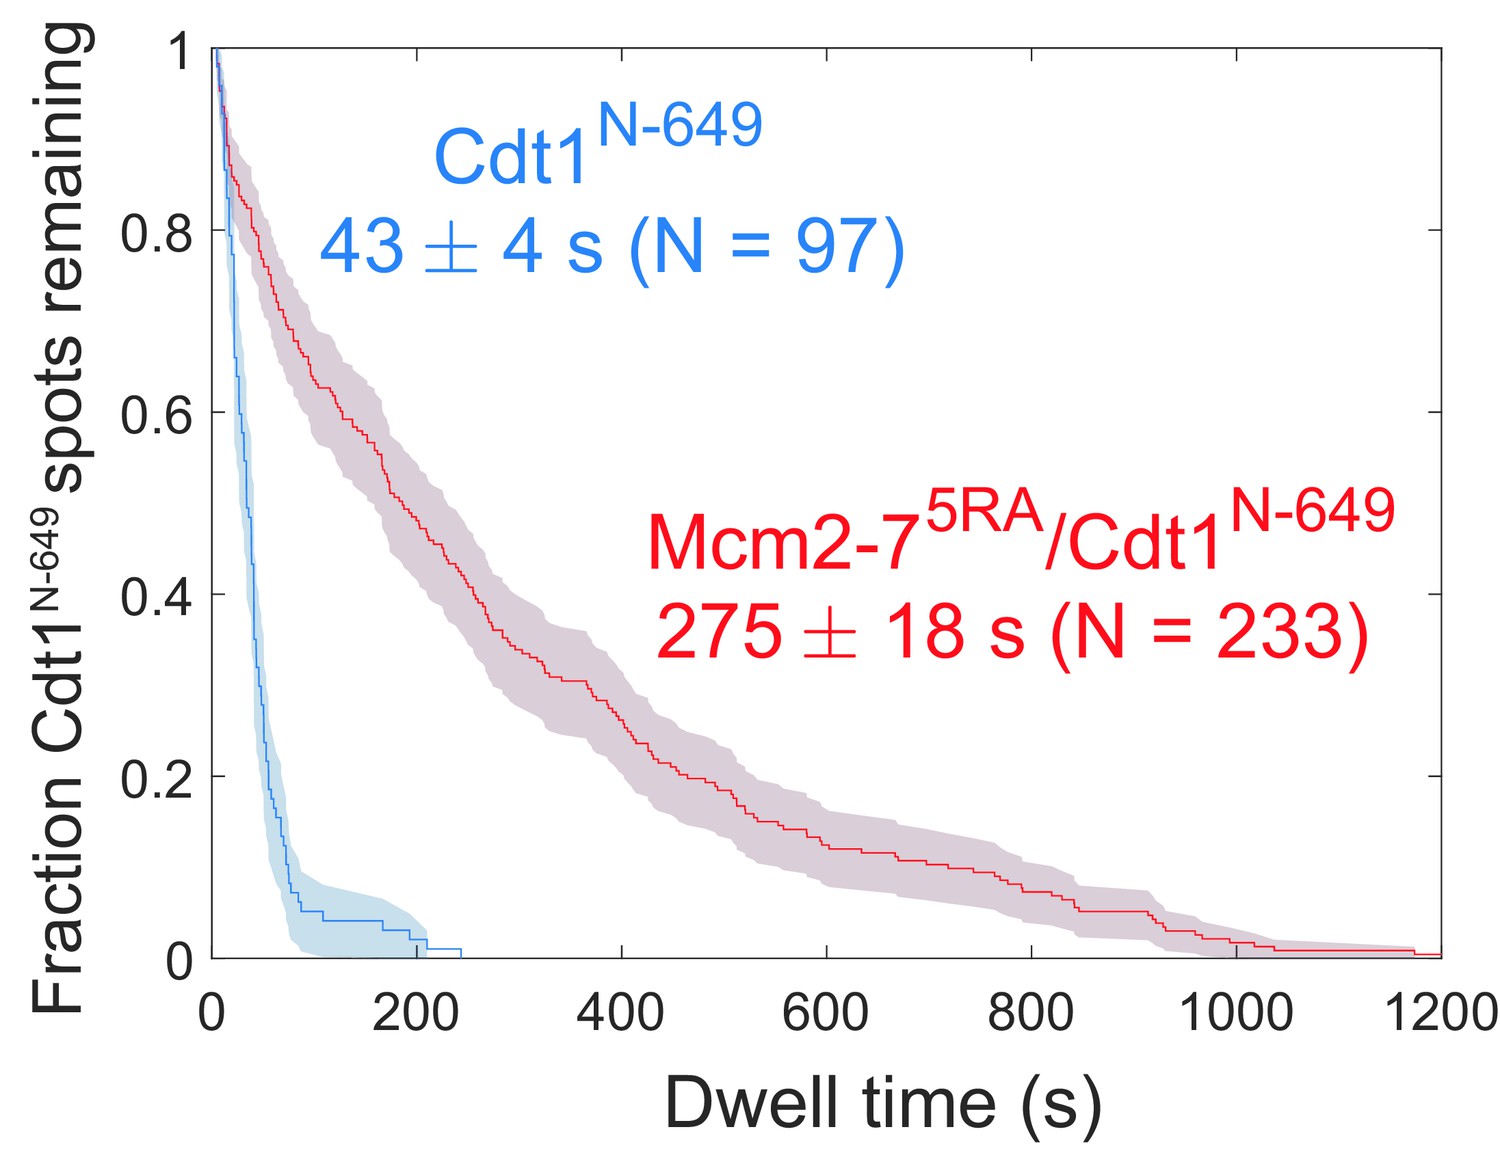
Comparison between the distribution of Cdt1N-649 dwell times after the first Mcm2-7 arrival from the experiment in Figure 4c (wild type) and an otherwise identical experiment with the Mcm2-75RA mutant that does not release Cdt1. The mean Cdt1 dwell time seen with the mutant sets a lower limit on the photobleaching lifetime. The mean Cdt1 dwell time in the wild-type experiment is >six-fold shorter, demonstrating that photobleaching does not appreciably contribute to the acceptor fluorescence decrease in the wild-type experiment.
Figure 4—figure supplement 3
Representative traces show Cdt1 release corresponds with the end of OM interactions on individual DNAs.
Additional fluorescence intensity traces from the experiments shown in Figure 4b, c.
Figure 4—figure supplement 4
Cdt1 release is concomitant with loss of OM EFRET.
(a) Distributions of EFRET values from the experiment in Figure 4b, c. Top: schematic of predicted red: Aex, Aem signal for two Mcm2-72C-650/Cdt1N-649 association events followed by Cdt1N-649 release that result in double-hexamer formation. The black arrow indicates the first Cdt1N-649 release, which results in loss of half the acceptor fluorescence. Middle, bottom: histograms of EFRET values for the two 10-s time intervals immediately before (middle) or after (bottom) 52 first Cdt1-release events. The two dashed lines indicate EFRET values of 0 and 1. NDH, number of double-hexamer formation events and nt, number of signal points. (b) Most first and second Cdt1-release events end at the same time as the corresponding OM interactions. The time of OM-FRET end after the corresponding Cdt1 release (± standard error [SE]) is plotted as a histogram. Top panel shows first OM interaction relative to first Cdt1 release and bottom panel shows second OM interaction relative to second Cdt1 release.
Figure 5 with 3 supplements
ORC forms a new ‘MO’ interaction interface with the first Mcm2-7 before recruiting the second Mcm2-7 helicase.
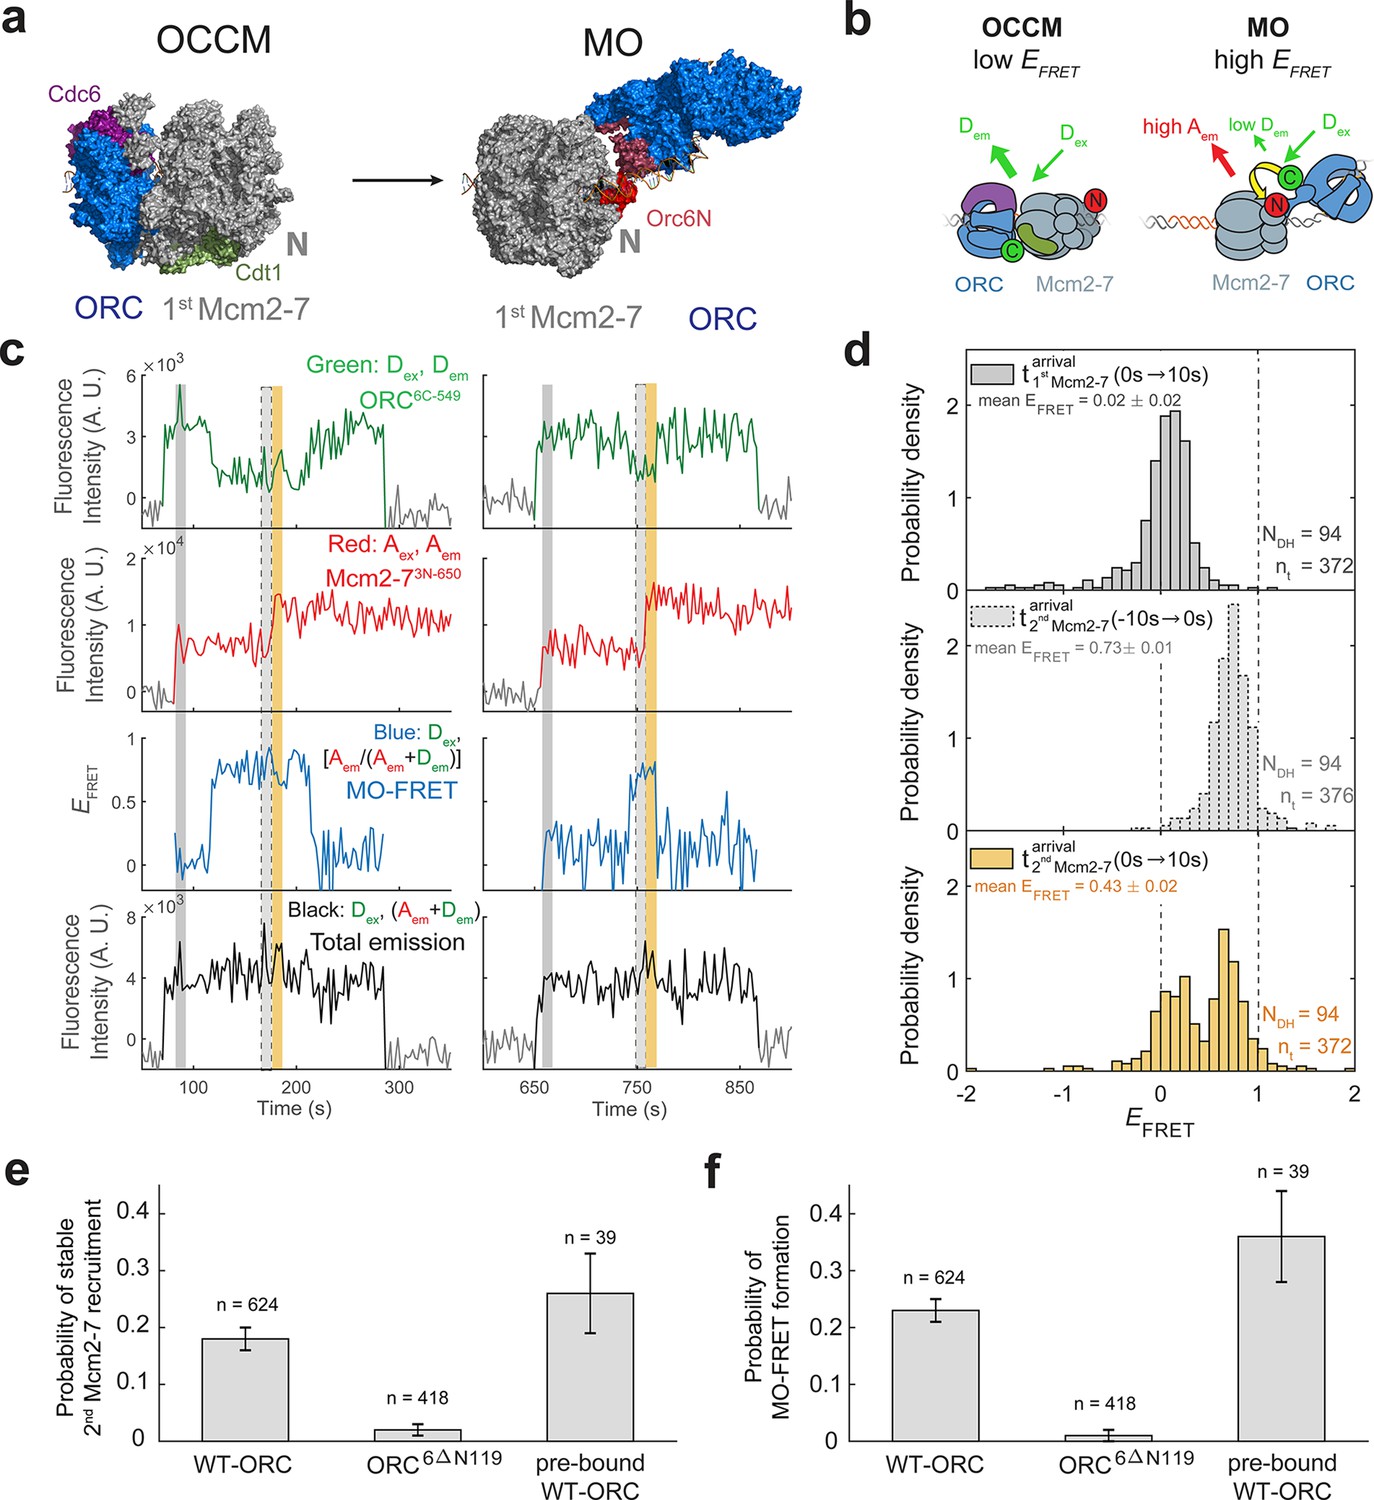
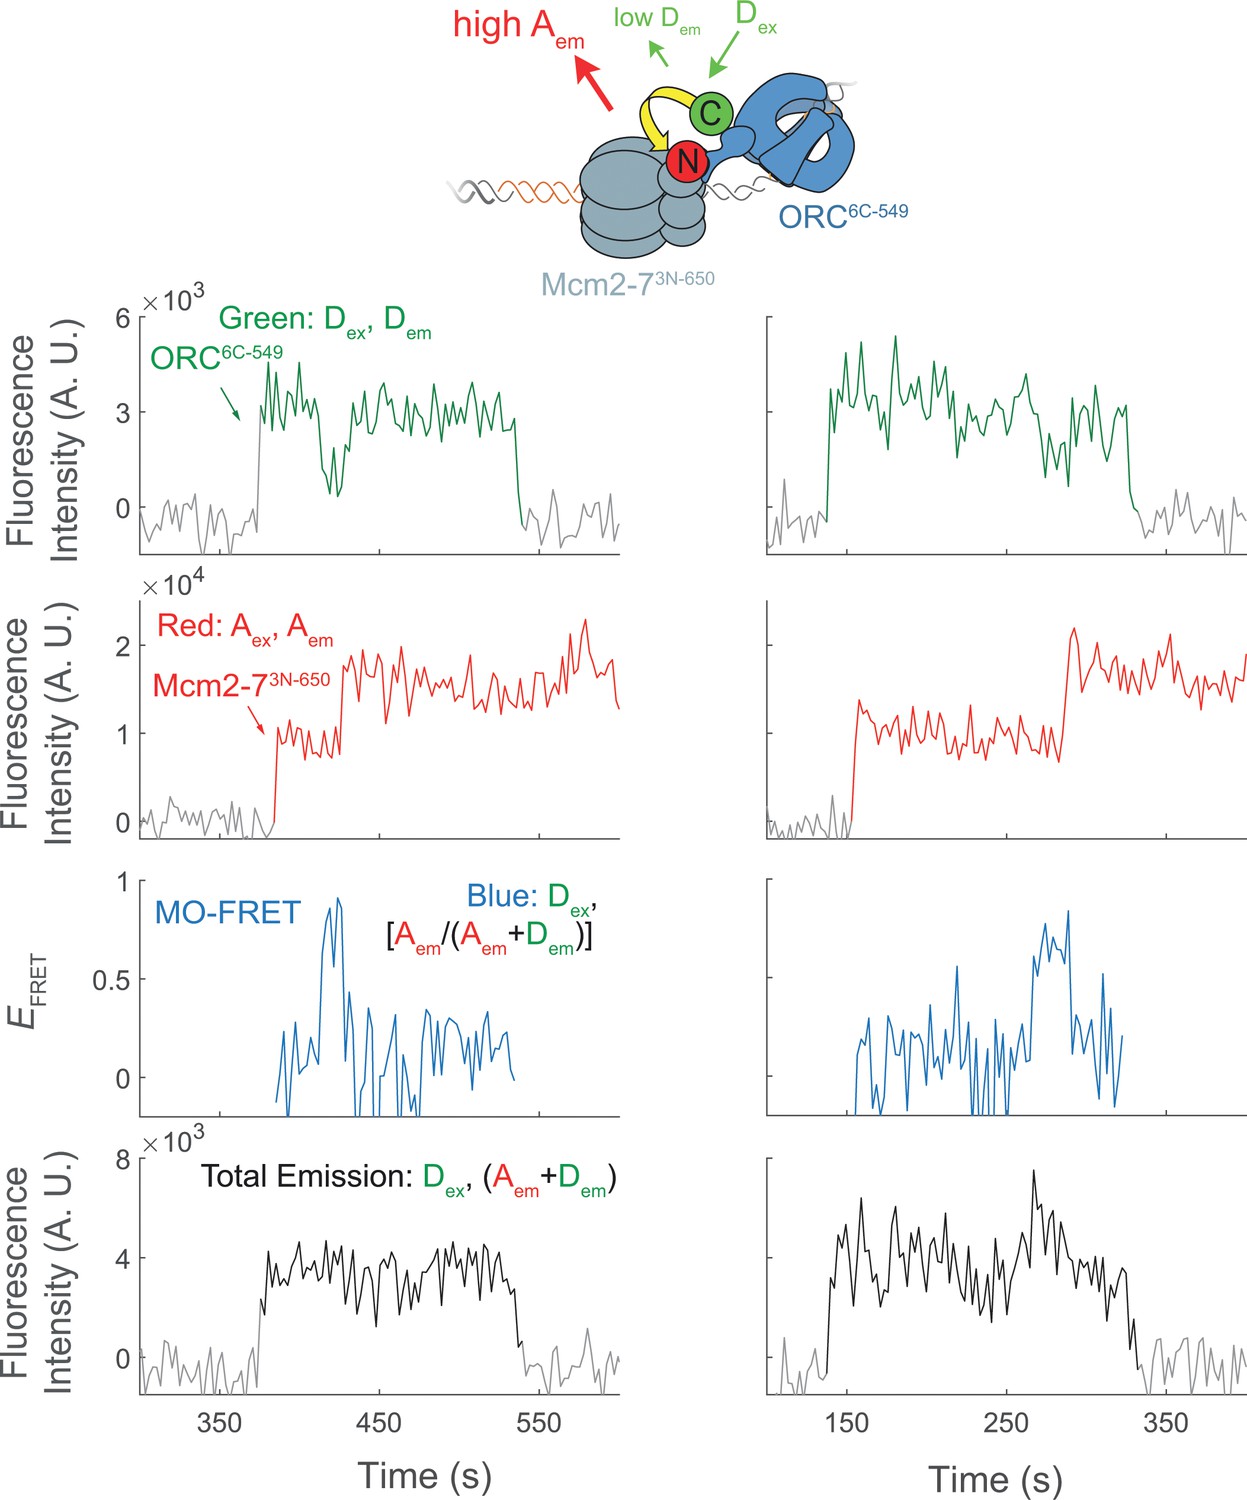
(a) Cryo-EM structures of the OCCM (OM) and MO (PDB: 5V8F and 6RQC) show the inversion of ORC relative to the first Mcm2-7 helicase. (b) Schematic of ORC6C-549 and Mcm2-73N-650 proteins in the context of the OCCM (left) and MO (right) structures. We predict that we would observe substantial FRET only in the MO but not the OCCM structure. (c) Representative traces showing ORC and Mcm2-7 associations with DNA and MO interaction EFRET during helicase loading. Donor-excited fluorescence record shows ORC6C-549 association (green: Dex, Dem panel) and acceptor-excited fluorescence record shows Mcm2-73N-650 association (red: Aex, Aem panel). Formation of the MO interaction brings the donor and acceptor fluorophores in proximity resulting in increased FRET efficiency (EFRET, blue: Dex, [Aem/ (Aem + Dem)] panel). The black: Dex, (Aem + Dem) panel shows donor-excited total emission. Gray, gray-dash, and yellow highlight the three 10-s time intervals referenced in (d). Concentrations of proteins in the reaction are 0.5 nM ORC6C-549, 15 nM Mcm2-73N-650, and 20 nM unlabeled Cdt1. Figure 5—figure supplement 2 shows additional records. (d) Histograms of MO interaction EFRET values during three 10-s time intervals during helicase loading: 10 s after the first (top) and second (bottom) Mcm2-7 arrived and 10 s before the second Mcm2-7 arrived (middle). Examples of these intervals corresponding to the region highlighted in gray, yellow, and gray-dash in (c). The two dashed lines indicate EFRET values of 0 and 1. NDH, number of double-hexamer formation events and nt, number of signal points. EFRET values below −2 and above +2 were excluded (4/376, 0/376, and 4/376 signal points from the top, middle, and bottom histograms, respectively). (e) The N-terminal domain of ORC6 is required for second Mcm2-7 recruitment. The fraction (± standard error [SE]) of n first Mcm2-73N-650-binding events that resulted in stable recruitment of a second Mcm2-73N-650 is plotted for WT-ORC6C-549, ORC6C-549,6∆N119, and an experiment in which WT-ORC6C-549/Cdc6 proteins are prebound to origin DNA. (f) The N-terminal domain of ORC6 is required for MO interaction. The fraction (± standard error [SE]) of n first Mcm2-73N-650-binding events that exhibited MO-FRET is plotted for WT-ORC6C-549, ORC6C-549,6∆N119, and prebound WT-ORC6C-549/Cdc6 proteins.
-
Figure 5—source data 1
Primary data for histogram in Figure 5d and graphs in Figure 5e, f.
- https://cdn.elifesciences.org/articles/74282/elife-74282-fig5-data1-v3.xlsx
Figure 5—figure supplement 1
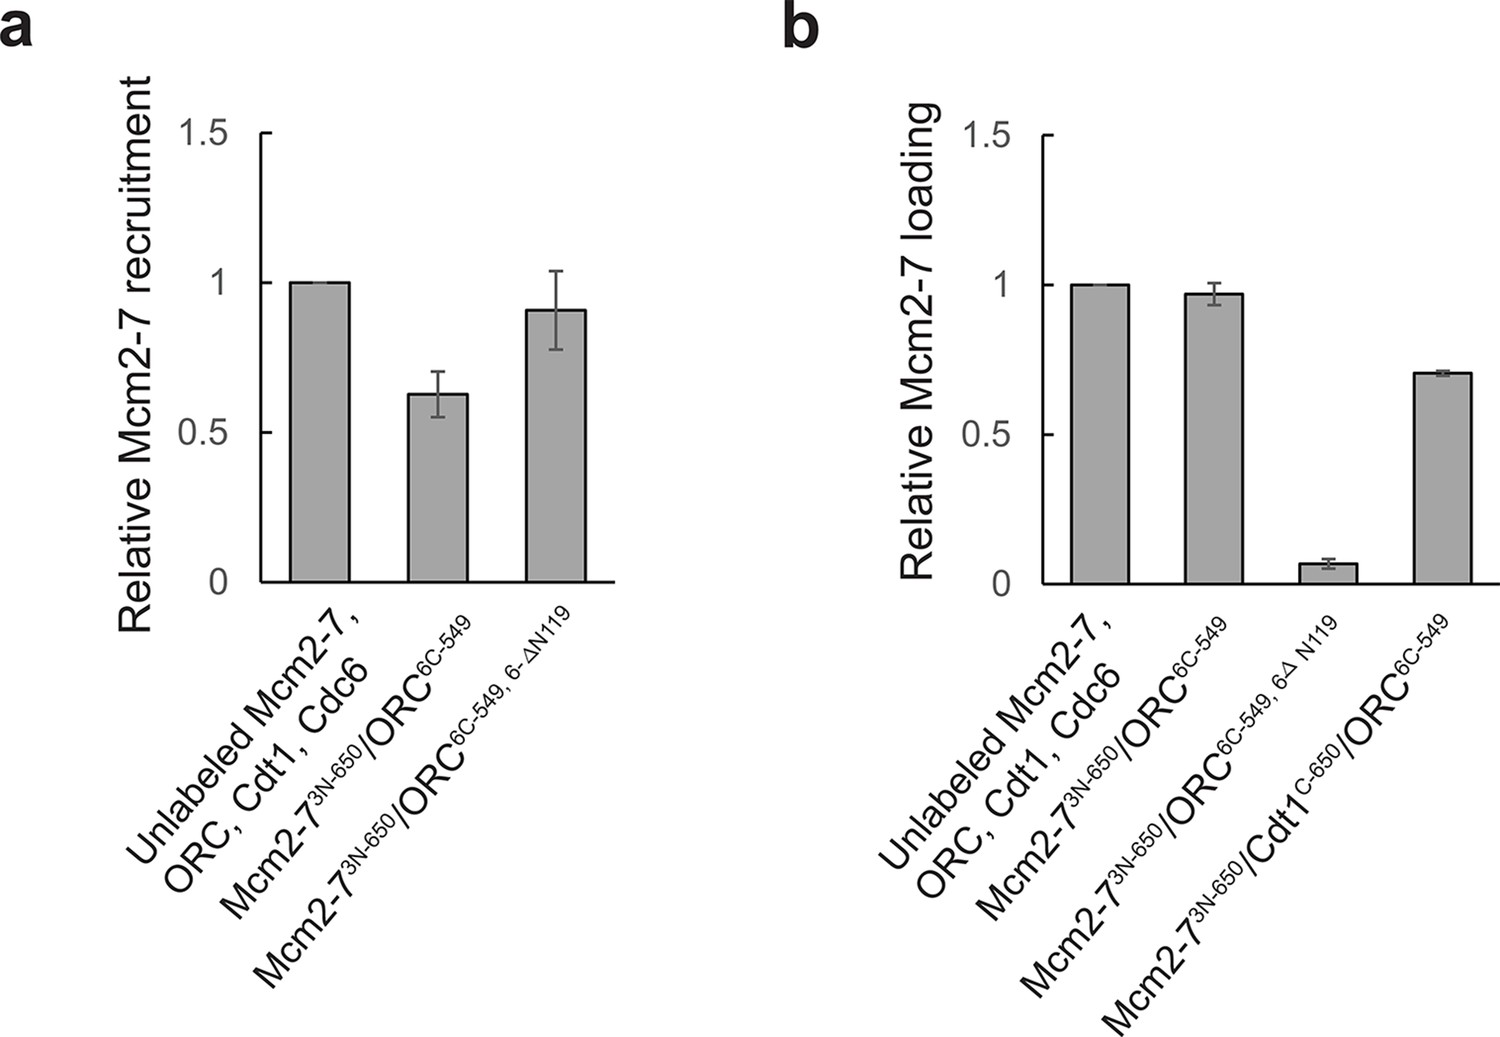
Fluorescent proteins used for detecting the MO interaction function in ensemble helicase-loading assays.
Activity of fluorescently labeled proteins relative to the unlabeled proteins in (a) ensemble helicase recruitment and (b) ensemble helicase-loading assays. Helicase recruitment assay was performed in the same manner as the helicase-loading assay except ATP was replaced with the slowly hydrolyzed ATP-analog ATPγS, and samples were not subjected to a high-salt wash. All samples were separated by sodium dodecyl sulfate–polyacrylamide gel electrophoresis (SDS–PAGE), stained with Krypton protein stain, and quantified. Reactions were performed in duplicate and error bars indicate the standard deviation. Note that, as expected, ORC6C-549,6-∆N119 has a helicase-loading defect, but is not defective for helicase recruitment (Miller et al., 2019).
-
Figure 5—figure supplement 1—source data 1
Primary data and quantification for graph in Figure 5—figure supplement 1.
- https://cdn.elifesciences.org/articles/74282/elife-74282-fig5-figsupp1-data1-v3.xlsx
Figure 5—figure supplement 2
Representative traces showing MO interactions during helicase loading.
Additional fluorescence intensity traces from the experiment in Figure 5c.
Figure 5—figure supplement 3
First Mcm2-7 helicases that do not form MO complexes are rapidly released.
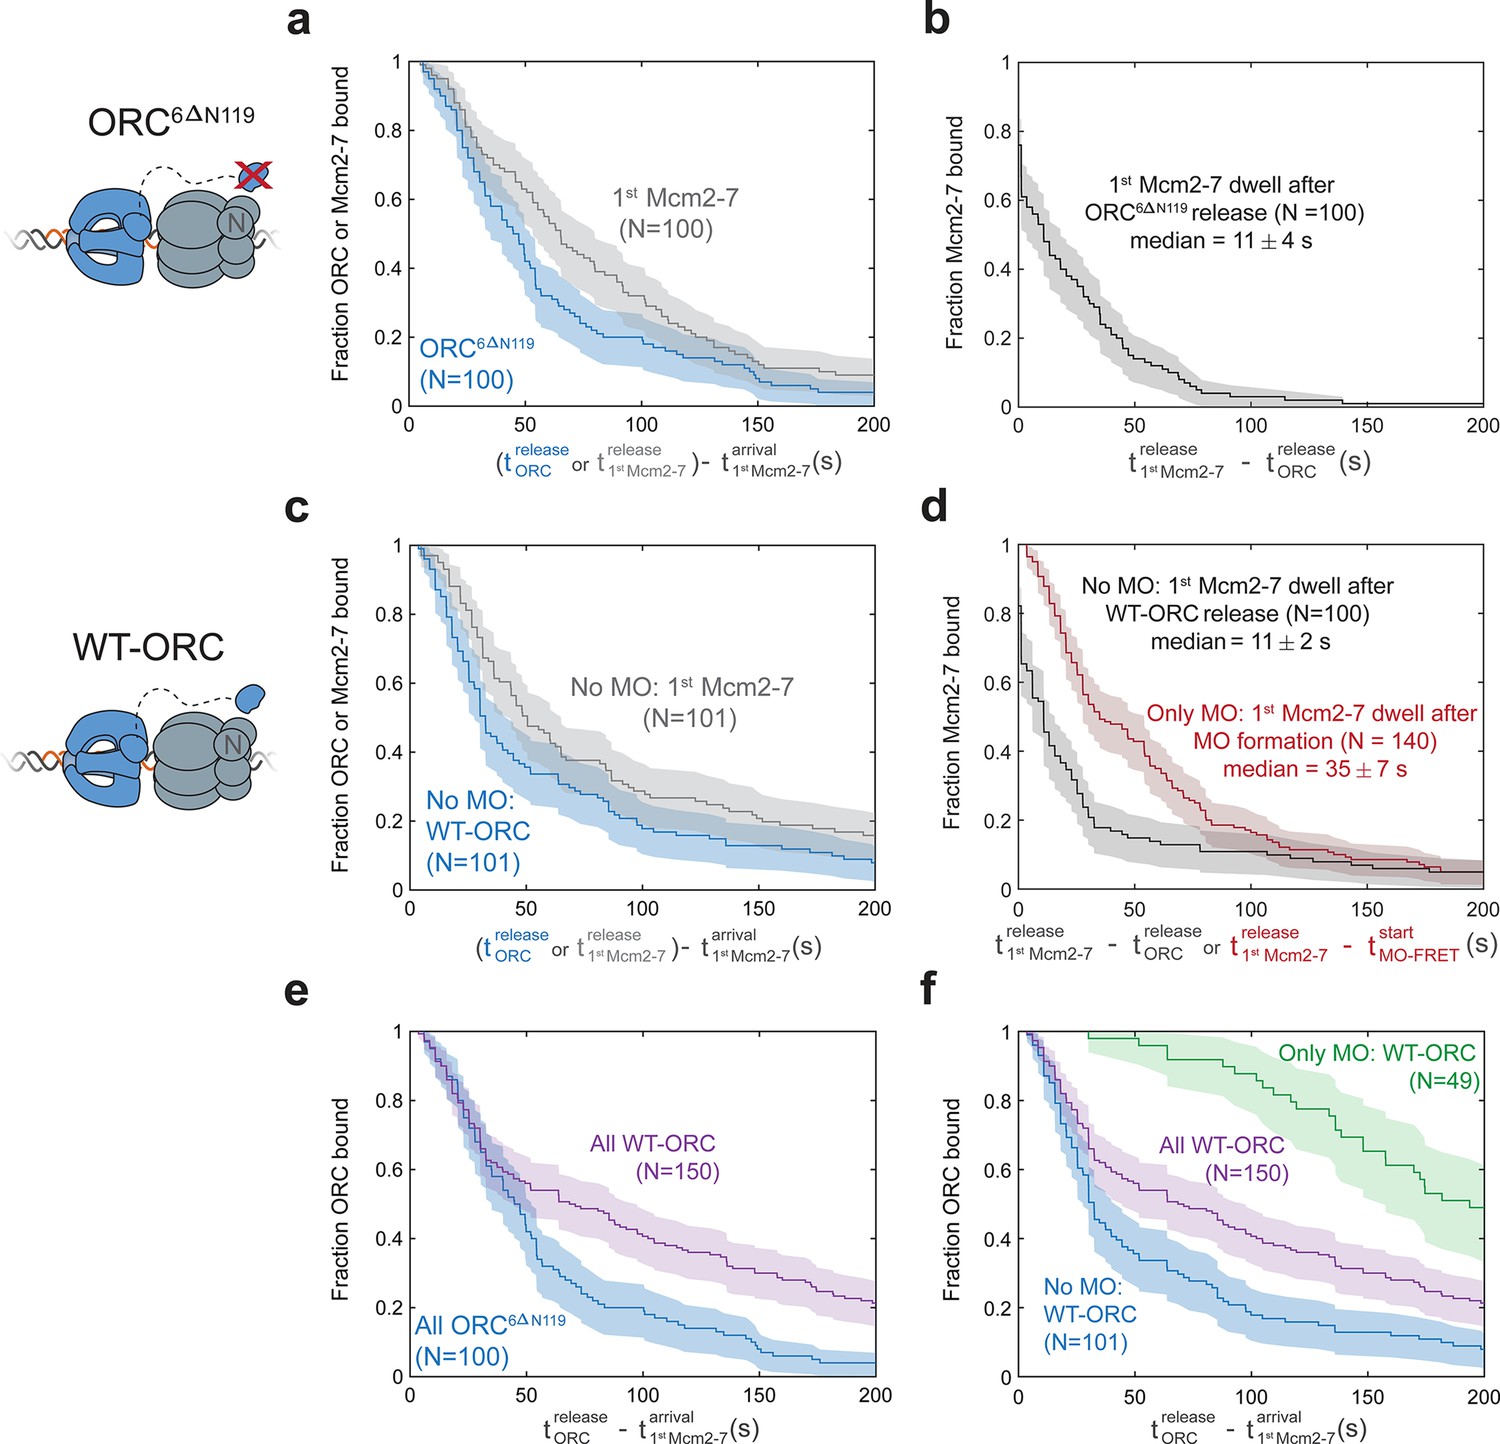
(a, b) In the context of the ORC6C-549,6∆N119 mutant, the first Mcm2-7 dissociates rapidly after origin–recognition complex (ORC) is released. (a) Dwell times of ORC6C-549,6∆N119 (blue; ORC6∆N119) and Mcm2-73N-650 (gray) after first Mcm2-7 arrival are plotted as survival functions. (b) Dwell times of Mcm2-73N-650 after ORC6C-549,6∆N119 is released from the DNA are plotted as a survival function. (c, d) In the context of wild-type ORC6C-649, first Mcm2-7 helicases that do not form an MO complex dissociate rapidly after ORC is released. (c) Dwell times of ORC6C-549 (blue; No MO: WT-ORC) and Mcm2-73N-650 (gray) after first Mcm2-7 arrival for loading events that do not form MO interactions (from experiment in Figure 5c) are plotted as survival functions. (d) Dwell times of the Mcm2-73N-650 molecules that do (red) or do not (black) form MO interactions are plotted. First Mcm2-7 dwell times that do not form MO interactions are plotted relative to release of ORC from the DNA (black). First Mcm2-7 dwell times in cases where MO interactions are formed are plotted relative to time of MO-FRET initiation (only MO: red). In events where a first Mcm2-7 goes on to recruit a second Mcm2-7, time of second Mcm2-7 arrival is used as a lower bound on the time the first Mcm2-7 is released. Sample size was limited to 100/410 Mcm2-7 associations in ORC6C-549,6∆N119 data (a, b), and to 101/509 Mcm2-7 associations with no MO-FRET in wild-type ORC6C-649 data (c, d). (e) The ORC6∆N119 mutant has shorter ORC dwell times on DNA compared to WT-ORC. Dwell times of ORC6C-549,6∆N119 (blue; ORC6∆N119, same data as in (a)) and ORC6C-549 (purple; all WT-ORC) after first Mcm2-7 arrival for all helicase-loading events are plotted as survival functions. (f) Establishing MO interactions extends ORC dwell times during helicase loading. Dwell times of the ORC6C-549 molecules that do (green) or do not (blue; same data as in (c)) form MO interactions are plotted. Dwell times of ORC6C-549 (purple; all WT-ORC) after first Mcm2-7 arrival for all helicase-loading events are also plotted (same data as in (e)). Sample size for the ‘All WT-ORC’ dataset was limited to one of three replicates of the reaction with 101/150 Mcm2-7-binding events showing no MO-FRET, and 49/150 events where MO-FRET is established. Shaded areas represent the 95% confidence intervals for each.
Figure 6 with 4 supplements
Cdt1 release occurs before MO formation.
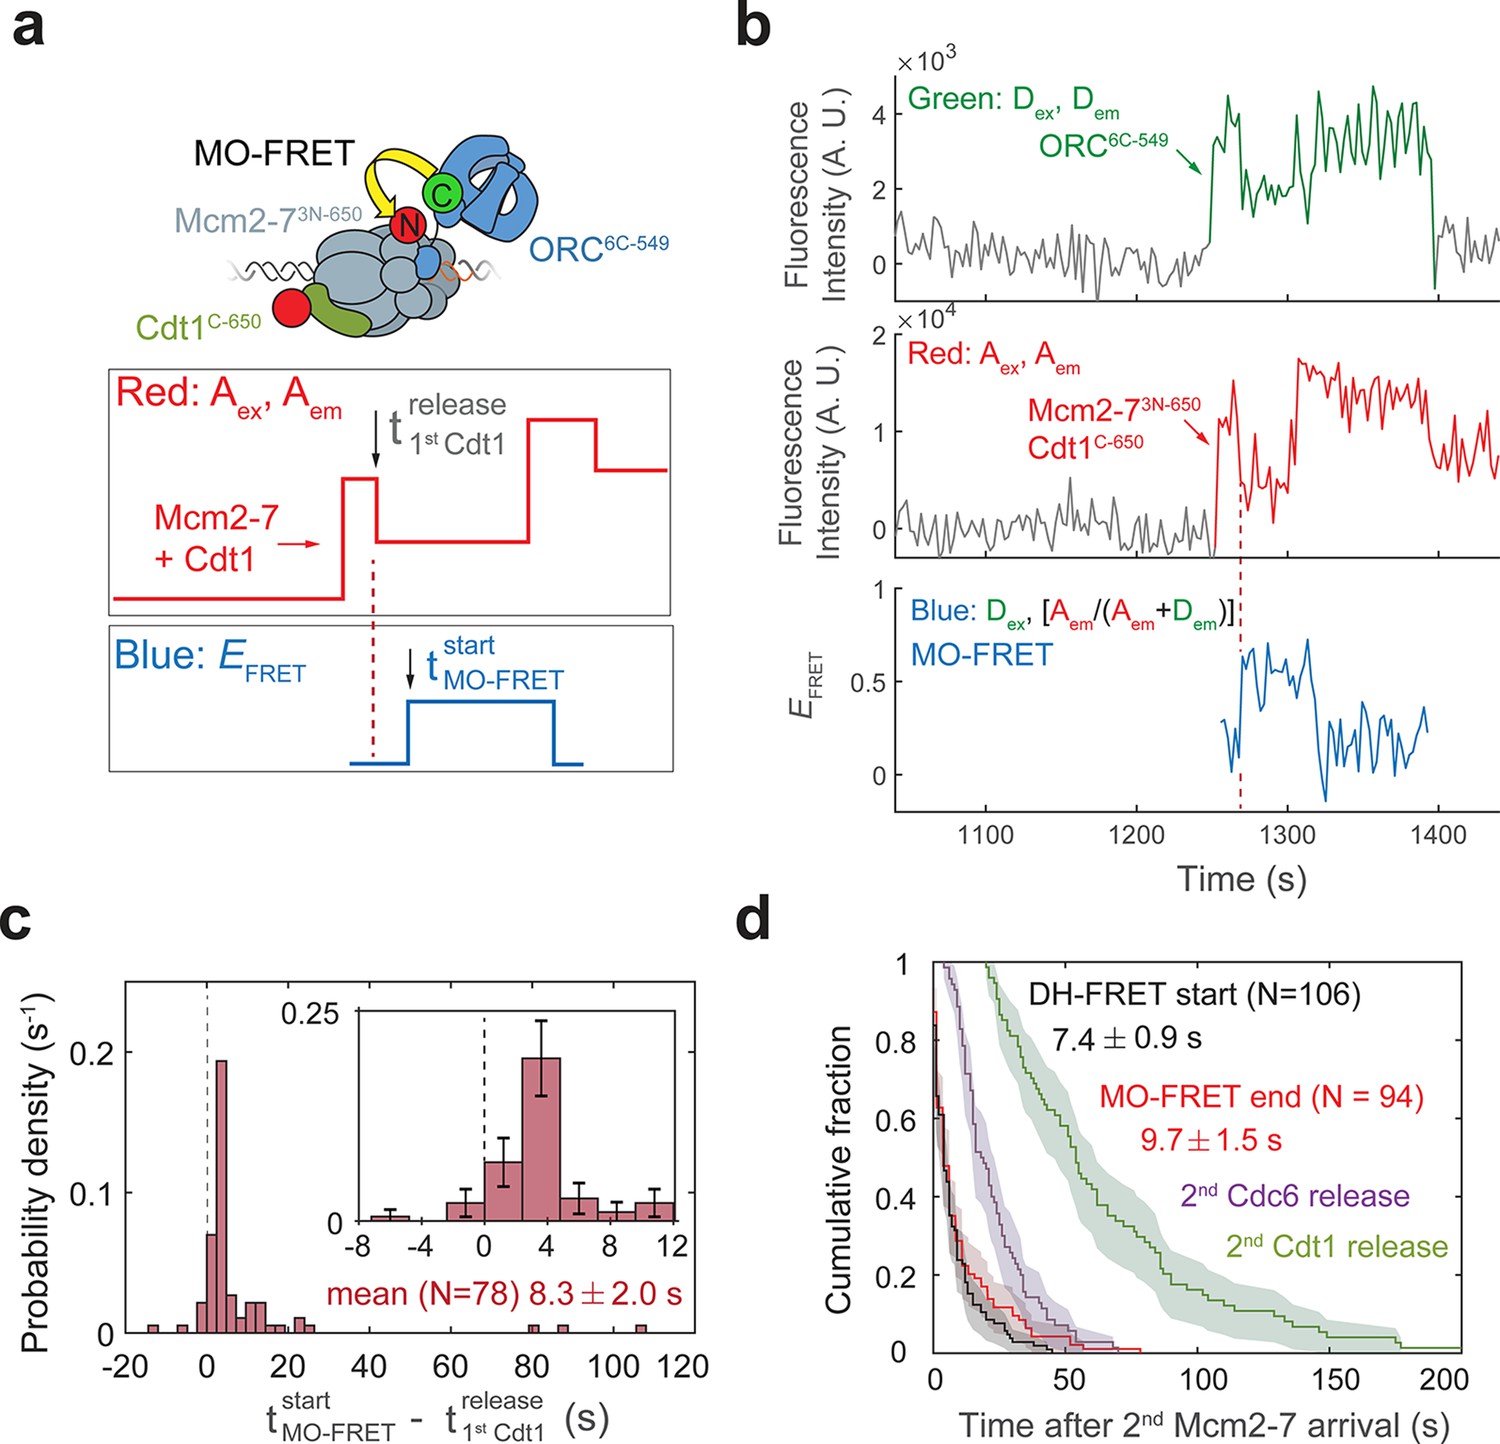
(a) Experimental setup for observation of Cdt1 release and MO interactions on the same DNA molecule. Origin–recognition complex (ORC) and Mcm2-7 are labeled using the MO-FRET pair ORC6C-549 (donor) and Mcm2-73N-650 (acceptor), respectively. Cdt1C-650 is also labeled with an acceptor fluorophore, but at a position that exhibits low EFRET with ORC6C-549 (Figure 6—figure supplement 1). The panels below show the predicted traces if Cdt1 release occurs before MO formation during a helicase-loading event. Each Mcm2-73N-650/Cdt1C-650 association results in an increase in fluorescence in the acceptor-excited fluorescence record (red: Aex, Aem panel). The black arrow indicates the release of Cdt1C-650 that results in a decrease in acceptor-excited fluorescence roughly half the size of the prior increase. (b) A representative trace showing the sequential association of two Mcm2-73N-650/Cdt1C-650 molecules and MO-FRET. The red dashed line indicates the first Cdt1-release time. Figure 6—figure supplement 3a shows additional records. Concentrations of proteins in the reaction are 0.5 nM ORC6C-549, 10 nM Mcm2-73N-650, and 20 nM Cdt1C-650. (c) Release of the first Cdt1 anticipates the onset of MO interactions. The start time of MO-FRET after the first Cdt1 release is plotted as a histogram with bin size of 2.4 s. Dashed line indicates a time difference of zero between first Cdt1 release and MO-FRET start time. Inset: magnified view (± standard error [SE]). (d) MO interactions end rapidly after arrival of the second Mcm2-7 with a timing that matches that of double-hexamer formation. Cumulative distributions of four events after second Mcm2-7 arrival are plotted: the time to end of MO interaction (red), start of double-hexamer interactions detected via FRET (black) (Ticau et al., 2015), and release of the second sets of Cdc6 and Cdt1 molecules (Ticau et al., 2015). Shaded areas represent the 95% confidence intervals for each curve. Mean ± SE are given for the red and black datasets.
-
Figure 6—source data 1
Primary data for histogram in Figure 6c.
- https://cdn.elifesciences.org/articles/74282/elife-74282-fig6-data1-v3.xlsx
Figure 6—figure supplement 1
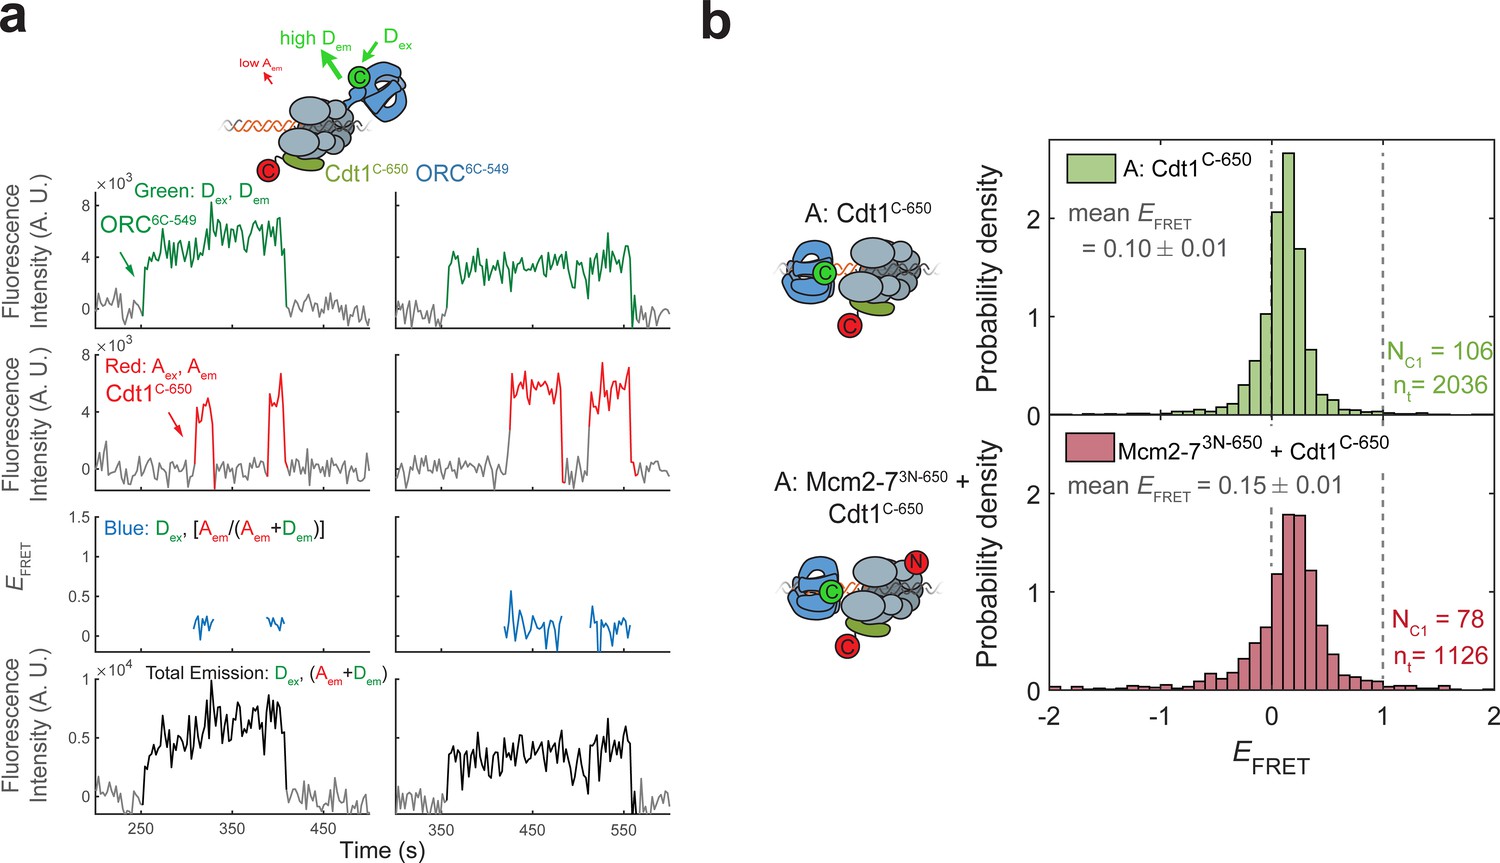
Cdt1C-650 does not exhibit high EFRET with ORC6C-549.
(a) Fluorescence intensity traces from an experiment with ORC6C-549 (donor), Cdt1C-650 (acceptor), and unlabeled Mcm2-7. (b) Histogram plots of EFRET values for the duration that Cdt1 is associated in experiments with ORC6C-549. Top panel: Cdt1C-650 and unlabeled Mcm2-7; bottom panel: Cdt1C-650 and Mcm2-73N-650 are both labeled. Note that MO-EFRET is low when Cdt1 is associated because MO-FRET is initiated after Cdt1 release (compare with Figure 6—figure supplement 3b). NC1, number of Cdt1-binding events and nt, number of signal points.
Figure 6—figure supplement 2
Disappearance of Cdt1C-650 fluorescence in the experiment in Figure 6a, b cannot be explained by photobleaching.
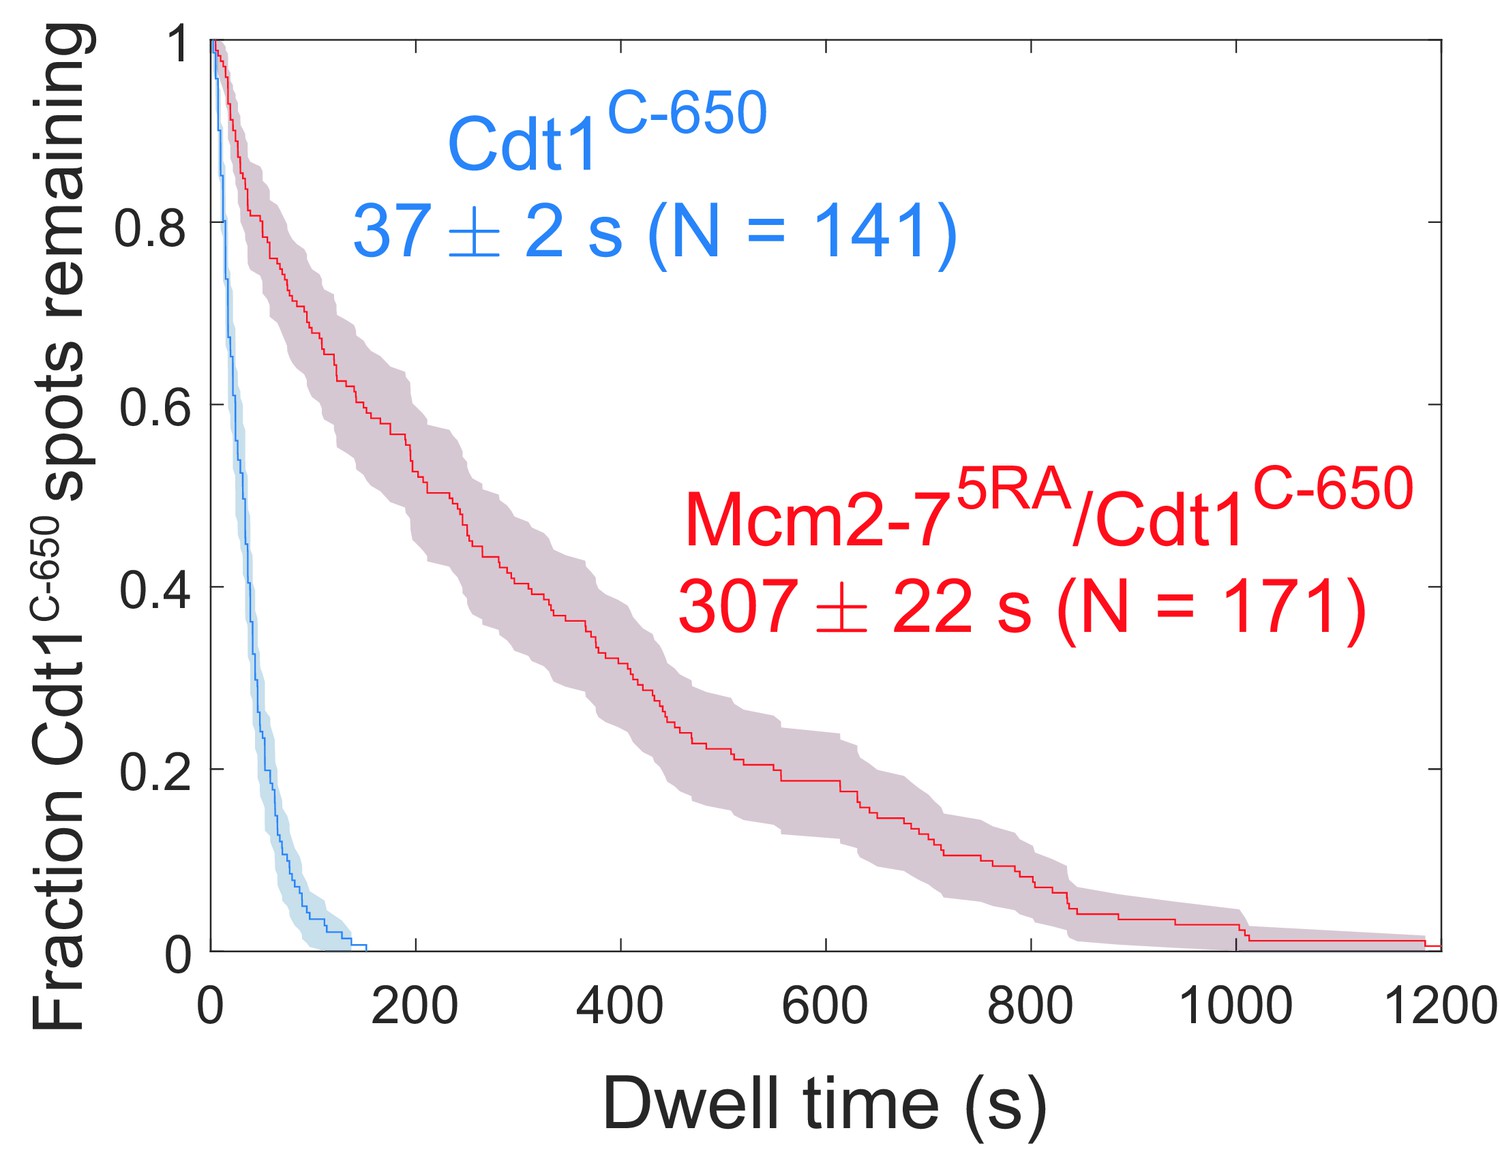
Comparison between the distribution of Cdt1C-650 dwell times after the first Mcm2-7 arrival from the experiment in Figure 6b (wild type) and an otherwise identical experiment with the Mcm2-75RA mutant that does not release Cdt1. The mean Cdt1 dwell time seen with the mutant sets a lower limit on the photobleaching lifetime. The mean Cdt1 dwell time in the wild-type experiment is >8-fold lower, demonstrating that photobleaching does not appreciably contribute to the acceptor fluorescence decrease in the wild-type experiment.
Figure 6—figure supplement 3
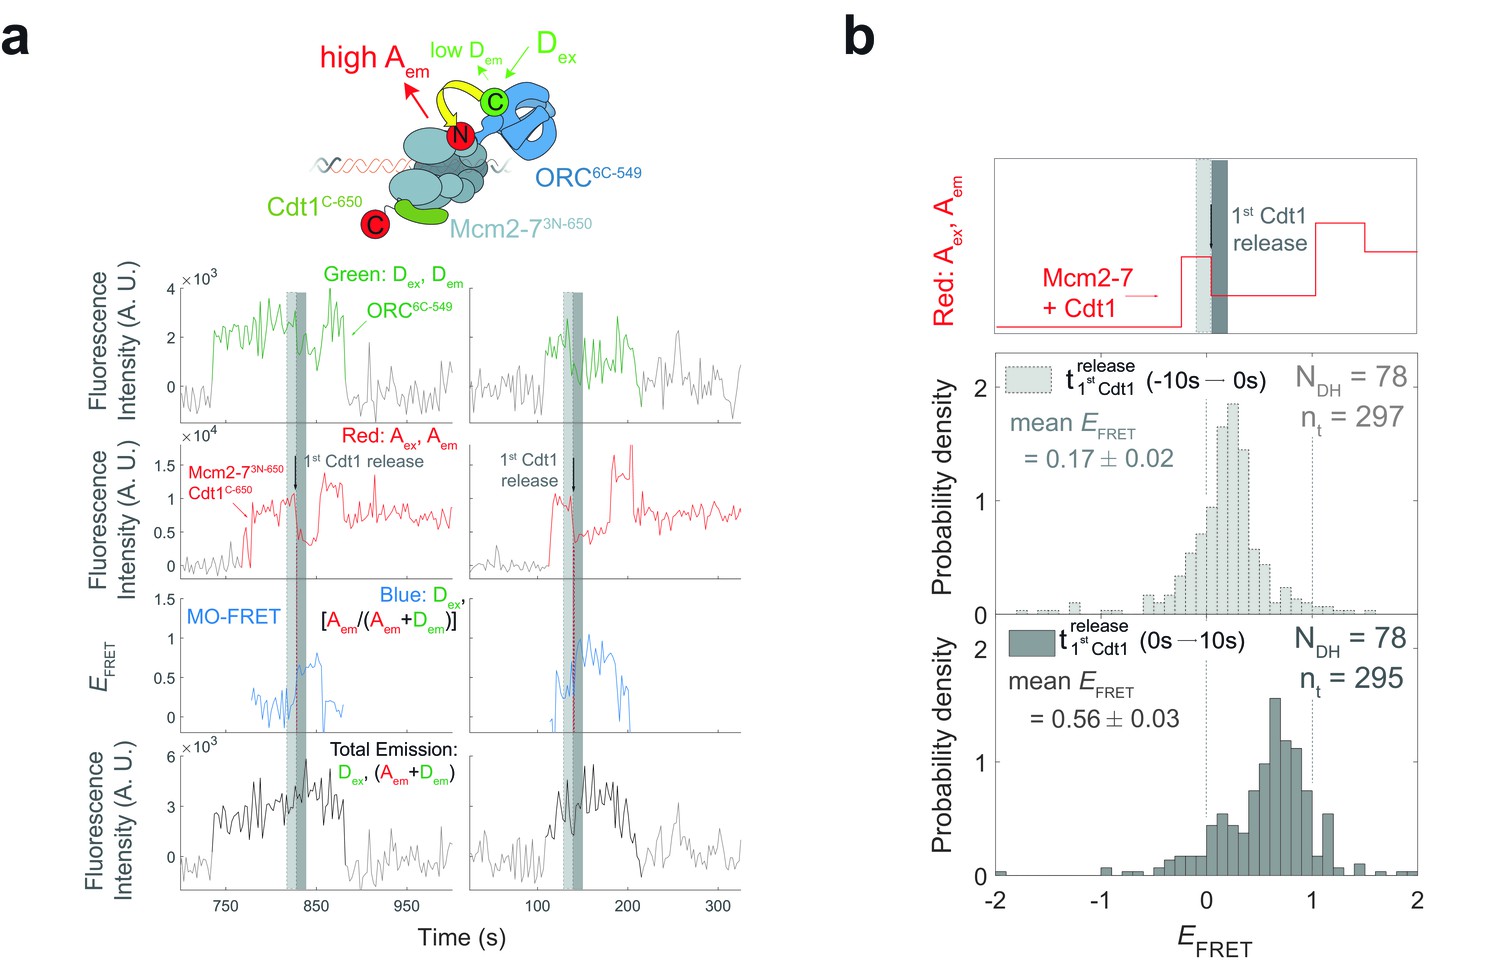
The high MO EFRET state is established rapidly after the first Cdt1 is released.
(a) Additional examples of fluorescence intensity traces for the experiment in Figure 6b. (b) EFRET values in 10-s intervals on either side of first Cdt1 release in the experiment shown in Figure 6a,b. The example trace (red: Aex, Aem panel on top) shows two Mcm2-73N-650/Cdt1C-650 association events each followed by Cdt1C-650 release that result in double-hexamer formation. The black arrow indicates the first Cdt1C-650 release, which results in loss of half the acceptor fluorescence. Histogram plots of EFRET values for two 10-s time intervals prior to (middle) or after (bottom) 78 first Cdt1-release events. Examples of these intervals are indicated in the top panel highlighted with gray-dash and gray, respectively. The two dashed lines indicate EFRET values of 0 and 1. NDH, number of double-hexamer formation events and nt, number of signal points.
Figure 6—figure supplement 4
The first Cdt1 release anticipates formation of the MO interaction.
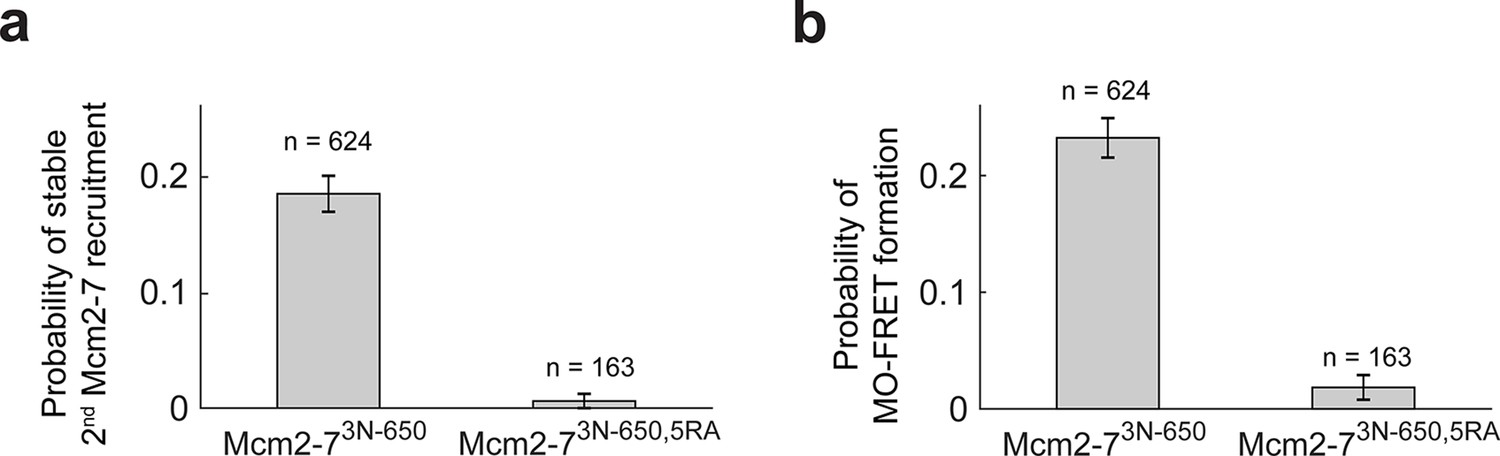
(a) Preventing first Cdt1 release interferes with second Mcm2-7 recruitment. The fraction (± standard error [SE]) of n first Mcm2-73N-650-binding events that resulted in stable recruitment of a second Mcm2-73N-650 is plotted for WT Mcm2-7 and Mcm2-75RA proteins. (b) Prevention of first Cdt1 release interferes with the establishment of the MO interaction. The fraction (± standard error [SE]) of n first Mcm2-73N-650-binding events that resulted in MO-FRET formation is plotted for WT-Mcm2-7 and Mcm2-75RA proteins.
Figure 7 with 1 supplement
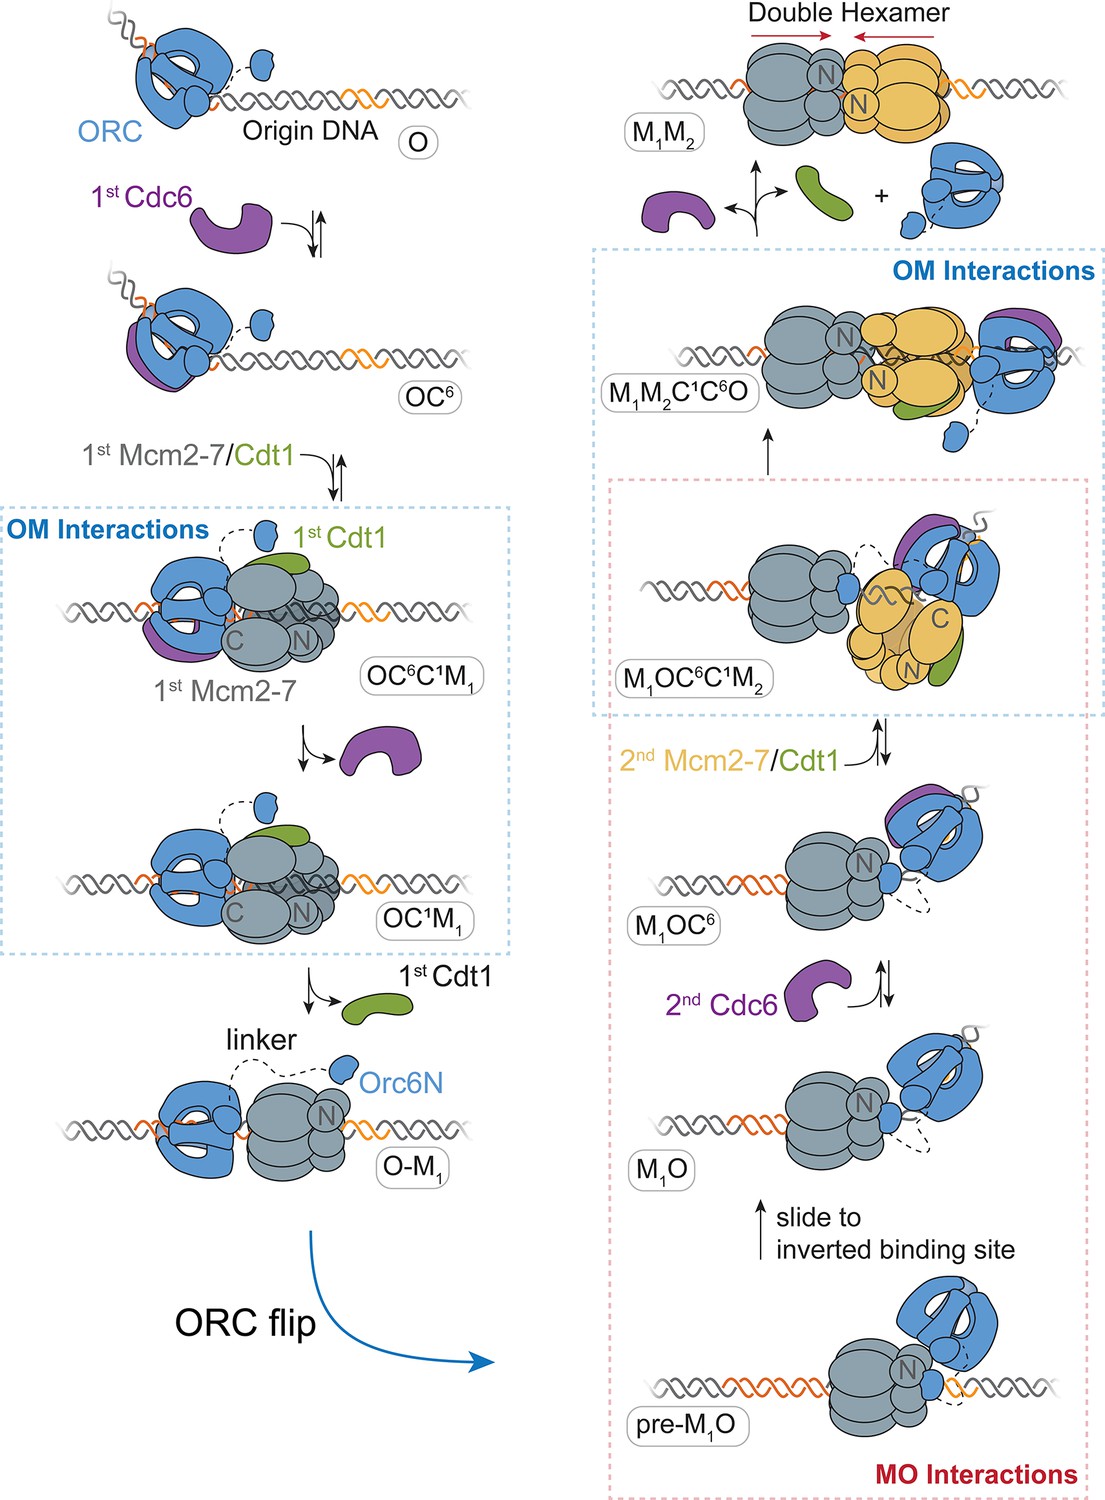
A model for helicase loading mediated by one ORC molecule.
Designations in ovals are unique names for each intermediate using the abbreviations O, ORC; C6, Cdc6; C1, Cdt1; M1, first Mcm2-7; and M2, second Mcm2-7. Dashed curve represents the linker that connects the N- and C-terminal domains of Orc6. Orange and yellow DNA segments are sequence-specific ORC-binding sites, see text for details. Note that the ORC and Mcm2-7 proteins are not interacting in the O–M1 complex.
Figure 7—figure supplement 1
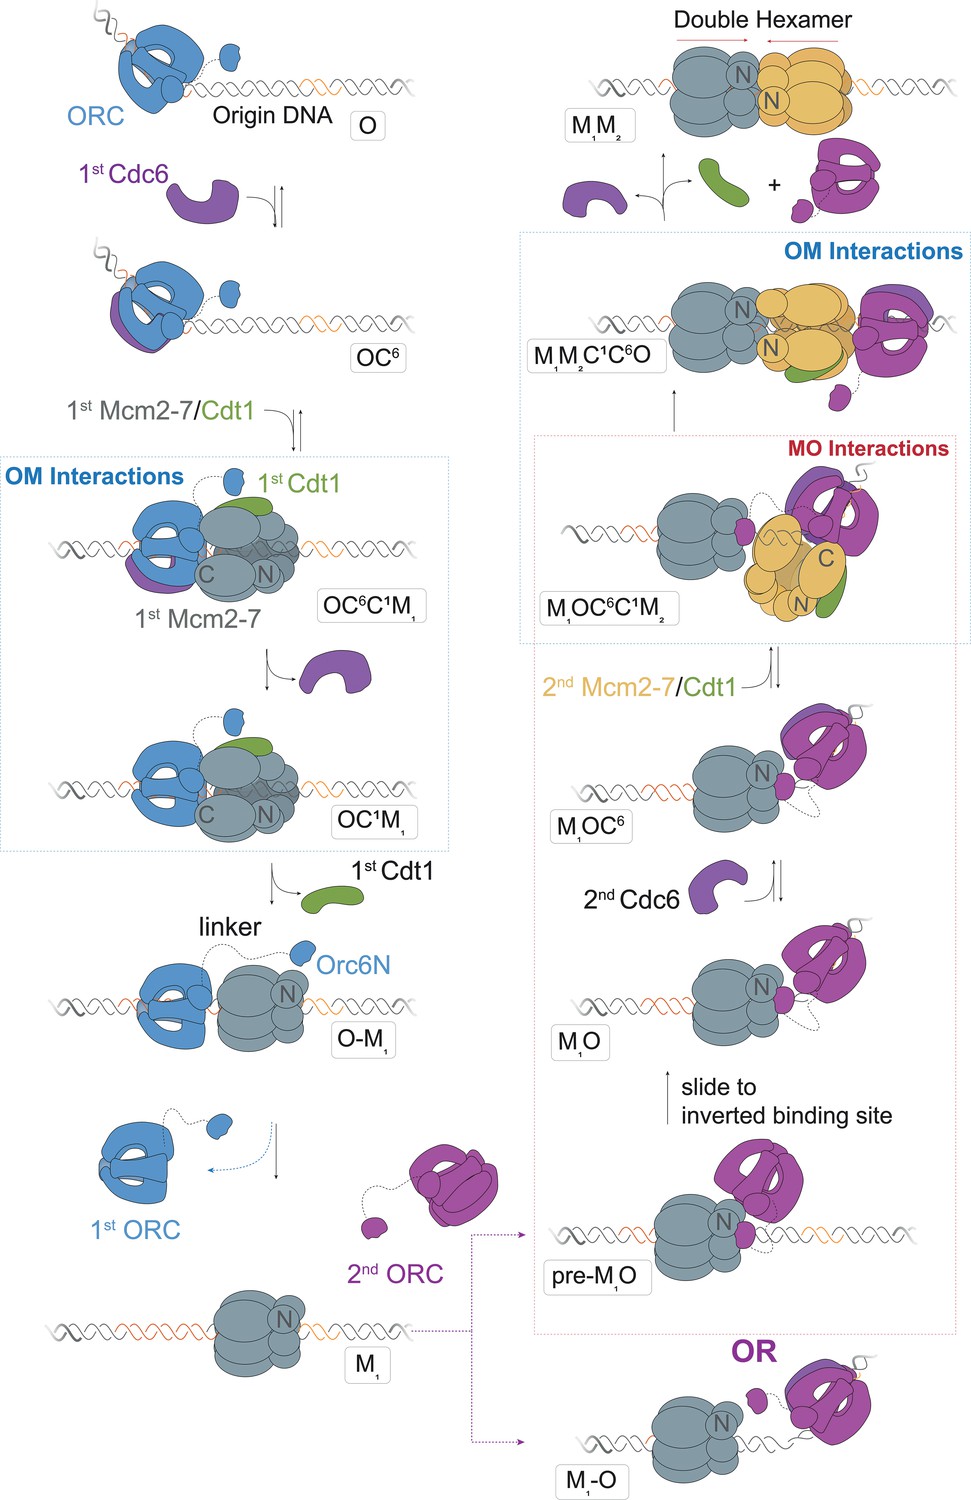
A model for helicase loading mediated by two separate ORC molecules.
Designations in ovals are unique names for each intermediate using the abbreviations O, ORC; C6, Cdc6; C1, Cdt1; M1, first Mcm2-7; and M2, second Mcm2-7. Blue and purple coloring distinguishes the ORC molecules that guide the first and second helicase recruitments, respectively. Note that O1–M and M1–O are states where the ORC and Mcm2-7 are DNA bound but not interacting.
Tables
Author response table 1
Figure numbers from main text and the corresponding number of replicates.
| Figure number | Number of experimental instances |
|---|---|
| Figure 1 and Figure 4a | 4 |
| Figure 2 | 2 |
| Figure 3 | 4 |
| Figure 4d | 3 |
| Figure 5c-f (wild-type) | 3 |
| Figure 6 | 5 |
Author response table 2
Fraction of events (± S.E). for each instance broken down by the associated FRET profile.
| CC | NN | CN | NC | |
|---|---|---|---|---|
| Fig. 3 Instance 1 (N = 17) | 0.47 ± 0.12 | 0.47 ± 0.12 | 0.00 ± 0.00 | 0.06 ± 0.06 |
| Fig. 3 Instance 2 (N = 22) | 0.41 ± 0.10 | 0.59 ± 0.10 | 0.00 ± 0.00 | 0.00 ± 0.00 |
| Fig. 3 Instance 3 (N = 25) | 0.48 ± 0.10 | 0.48 ± 0.10 | 0.04 ± 0.04 | 0.00 ± 0.00 |
| Fig. 3 Instance 4 (N = 18) | 0.44 ± 0.12 | 0.44 ± 0.12 | 0.00 ± 0.00 | 0.11 ± 0.07 |
| Total (N = 82) | 0.45 ± 0.05 | 0.50 ± 0.06 | 0.01 ± 0.01 | 0.04 ± 0.02 |
Additional files
Download links
A two-part list of links to download the article, or parts of the article, in various formats.
Downloads (link to download the article as PDF)
Open citations (links to open the citations from this article in various online reference manager services)
Cite this article (links to download the citations from this article in formats compatible with various reference manager tools)
A helicase-tethered ORC flip enables bidirectional helicase loading
eLife 10:e74282.
https://doi.org/10.7554/eLife.74282


