Octopamine drives honeybee thermogenesis
- Behavioral Physiology and Sociobiology, Julius Maximilian University of Würzburg, Germany
- Institute for Pharmacy and Food Chemistry, Julius Maximilian University of Würzburg, Germany
- Institute of Pharmacology, Research Core Unit Metabolomics, Hannover Medical School, Germany
Figures
Figure 1 with 1 supplement
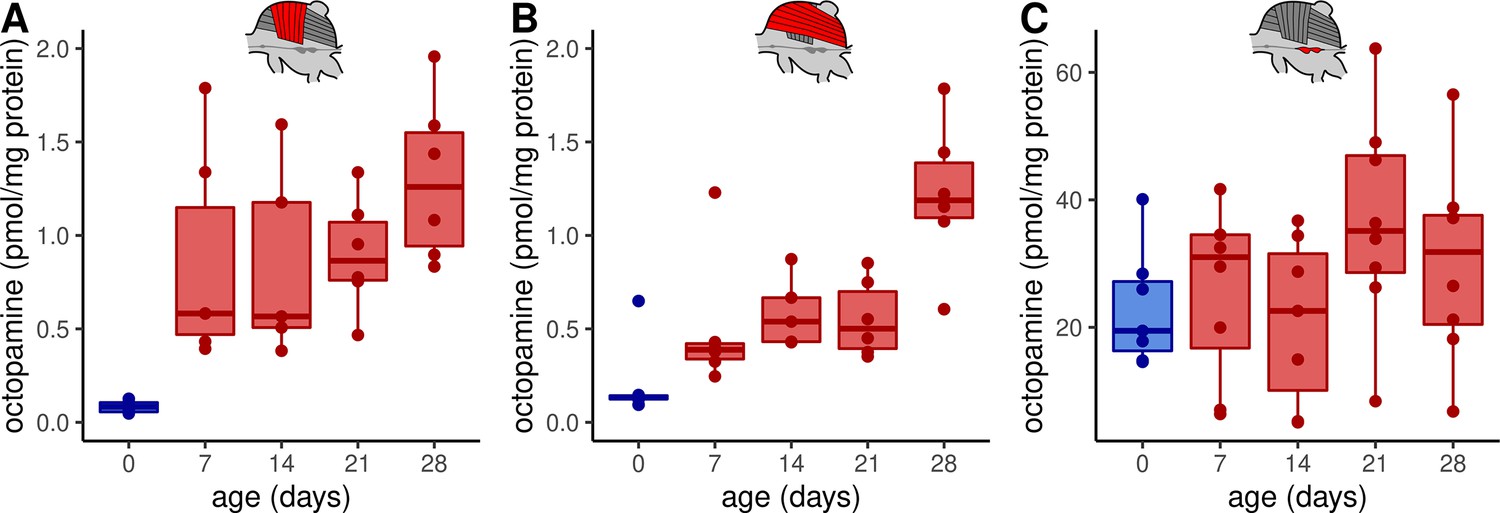
Octopamine concentrations in thoracic tissues across age.
Octopamine concentrations differ significantly between different workerbee age groups in DV (A) and DL (B) but not in the MMTG (C). blue = no active heating, red = active heating. Shown is median ± interquartile range (IQR). For statistics see Table 1.
Figure 1—figure supplement 1
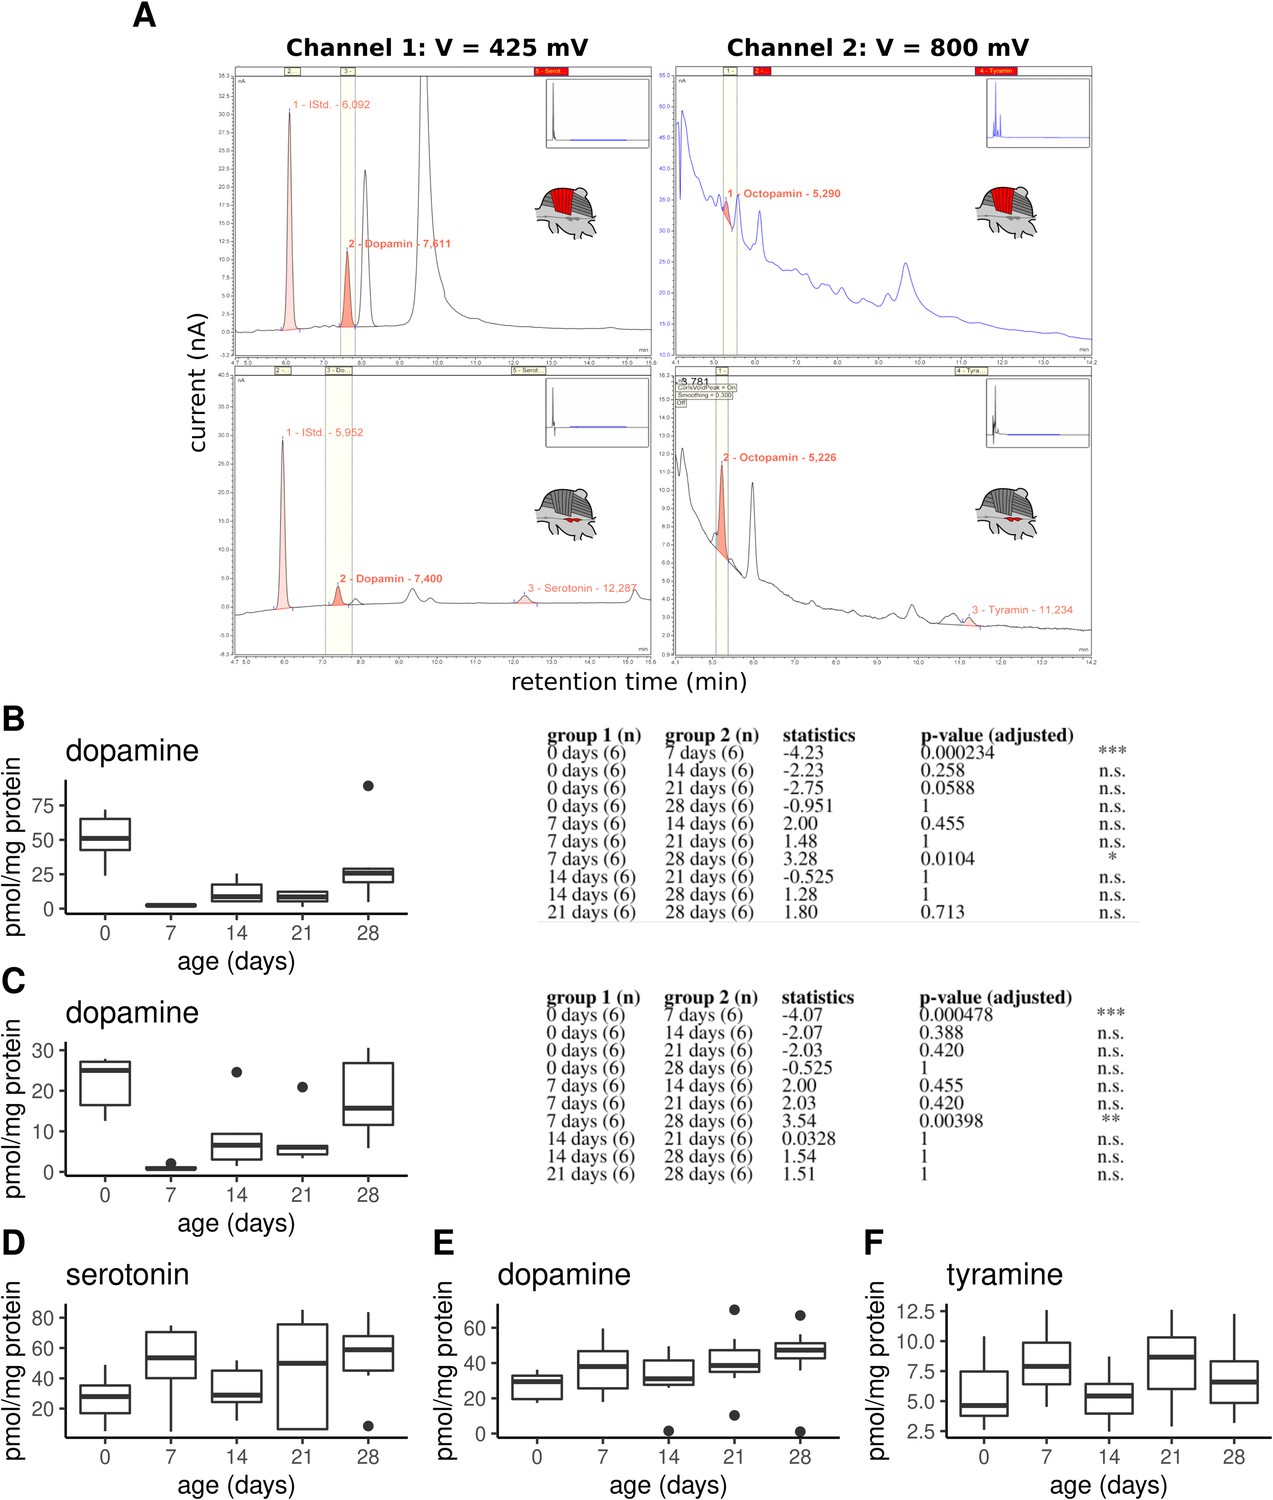
Monoamine quantification in workerbee thoracic tissues.
(A) Example chromatograms of individual DV (top) and MMTG samples (bottom). (B–F) Dopamine concentrations in dorsoventral (B; Kruskal-Wallis test: X2 = 21.381, df = 4, p = 0.0003) and dorsal-longitudinal flight muscles (C; X2 = 20.215, df = 4, p = 0.0005) are high in newly emerged bees and dramatically decrease until the age of 7 days. Afterwards, dopamine concentrations increases with aging. Group comparison results (Dunns test) are shown to the right of each graph. Additionally, serotonin (D; X2 = 6.489, df = 4, p = 0.166), dopamine (E; X2 = 7.4, df = 4, p = 0.116), and tyramine (D; X2 = 6.226, df = 4, p = 0.183) are detectable in the mesometa-thoracic ganglia, wheras no age-related differences are observable. Shown is median ± IQR.
Figure 2
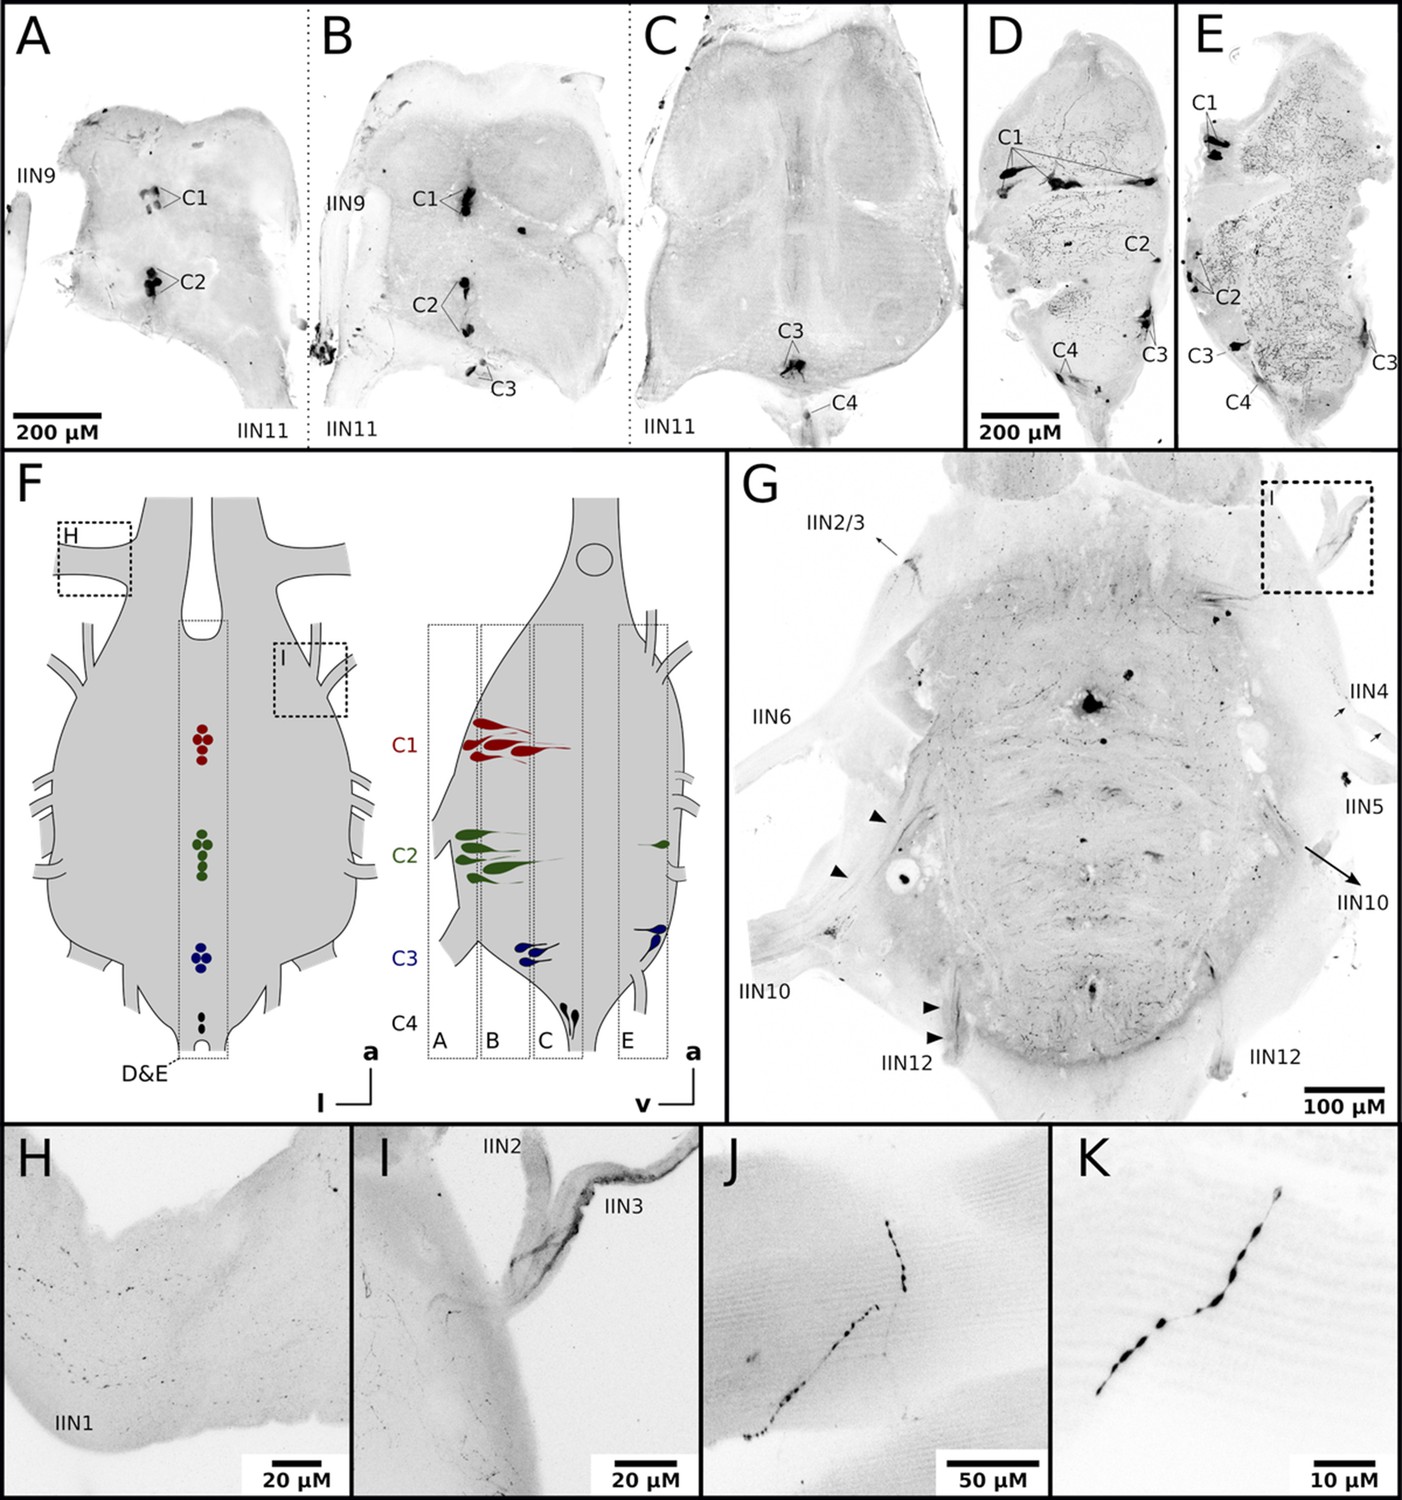
Honeybee flight muscles are innervated by octopaminergic neurons.
(A–E) Different cell clusters with OA-IR are observable. Consecutive frontal sections of the MMTG of the same workerbee (A–C) beginning with the most ventral section (A) showing clusters of OA-IR positive cells (C1–C4). Sagital sections (D–E) in the midline area of the MMTG of two individual bees display the same OA-IR positive cell clusters. (F) Schematic interpretation of the location of the cell clusters found in A-E. Additionally, the approximate location of frontal sections (A–C, G), the sagital sections (D–E), and the detailed images (H–I) are indicated by dashed boxes. (G) Dorsally located frontal section of the MMTG in showing several nerves which are leaving the ganglion. Strong OA-IR-positive fibers run into the nerves IIN3, IIN10, and IIN12 (arrowheads). (H) Within the nerve IIN1 fine varicose structures with OA-IR are observable. (I) An OA-IR-positive axon bundle runs through the nerve IIN3. (J–K) Flight muscle preparations reveal fine varicose structures with OA-IR closely attached to muscle fibers.
Figure 3
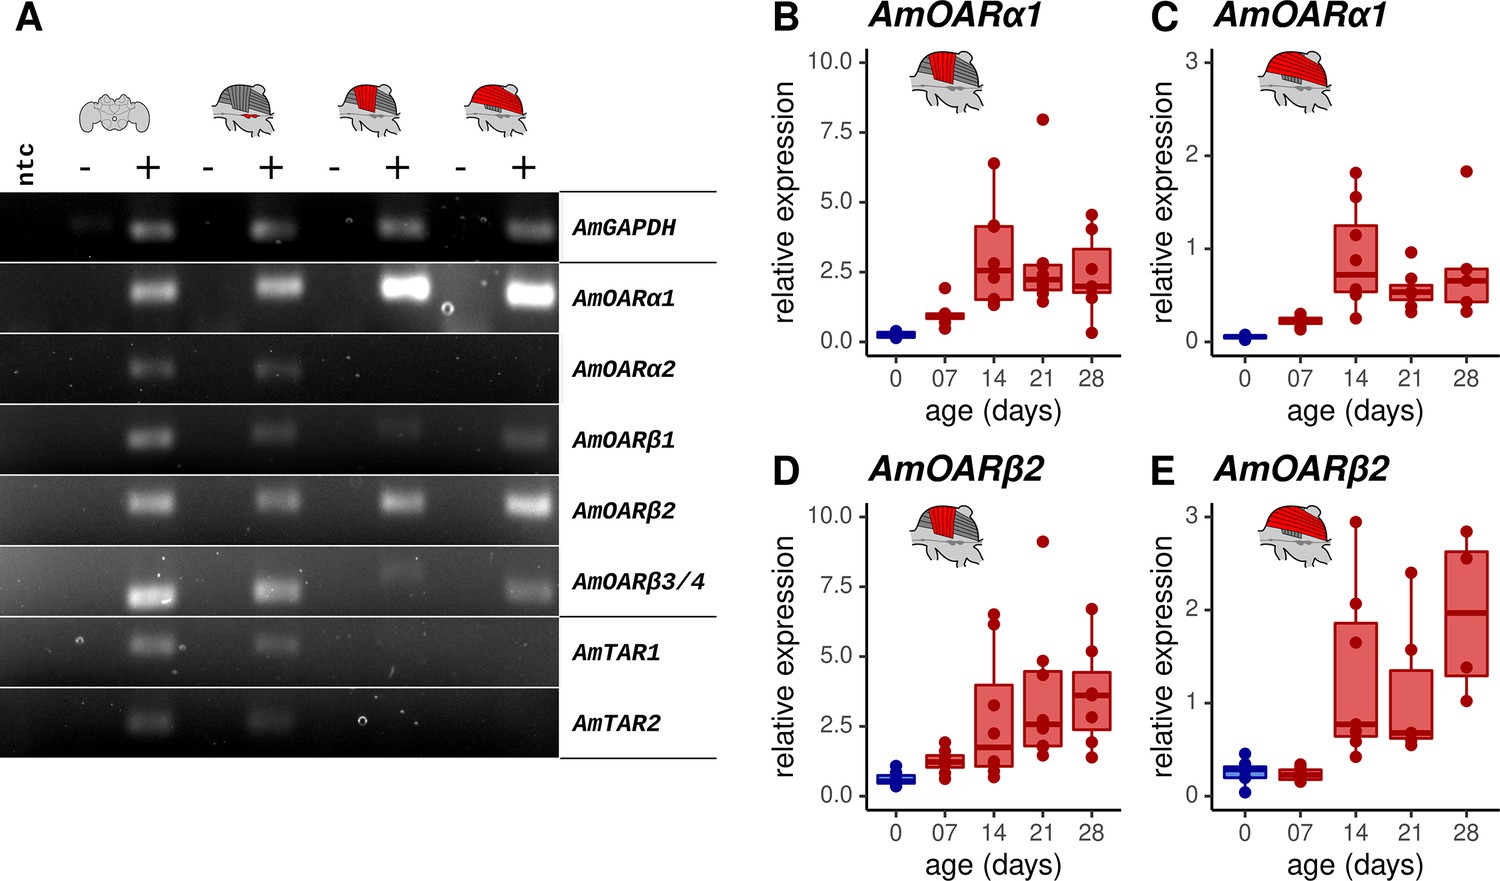
Octopamine receptor expression in the flight muscles.
(A) Brain, MMTG, DV, and DL were manually dissected from workerbees and underwent subsequent RNA isolation, cDNA synthesis and PCR analysis (+). The reverse transcriptase was omitted during cDNA synthesis for negative controls (-). RNase free water serves as no template (ntc) and AmGAPDH as loading control. (B–E) AmOARα1 and AmOARβ2 expression in DV and DL of differential aged workerbees with (red) or without (blue) the capability for thermogenesis. Data are represented as boxplots. Shown is median ± IQR. For statistic see Table 2.
-
Figure 3—source data 1
Labelled original files of the full raw unedited PCR gels.
- https://cdn.elifesciences.org/articles/74334/elife-74334-fig3-data1-v1.zip
-
Figure 3—source data 2
Unlabelled original files of the full raw unedited PCR gels.
- https://cdn.elifesciences.org/articles/74334/elife-74334-fig3-data2-v1.zip
Figure 4 with 4 supplements

Octopaminergic control of honeybee thermogenesis.
(A–C) Octopamine concentrations are decreased in DV and DL but not MMTG of reserpinezed workerbees. Data are represented as boxplots. Shown is median ± IQR. Mann-Whitney U test, DV(A): W = 105, z = –3.70, p < 0.001; DL(B): W = 102, z = –3.37, p < 0.001; MMTG(C): W = 56, z = –0.94, p = 0.1728. (D) Reserpinezed bees show hypothermia when compared with control. An injection of octopamine into the flight muscle helps the bees to recover, as no differences are observable between the control group and the recovered bees. The solid line represents the mean difference between TTHX and TA and the shaded area represents the 95% confidence interval. For statistic see Table 3. (E) Similar experiment as in (D) but bees were frozen in liquid N2 after 5 min for cAMP quantification. For statistic see Table 3. (F) The tissue cAMP concentrations in the flight muscles differ significantly due the treatment (Kruskal-Wallis test, X2 = 52.636, df = 2, p < 0.001). Reserpinezed bees has the lowest tissue cAMP concentrations in the flight muscles when compared with controls (Dunns test, Z = 2.6383, padj = 0.025) and recovered bees (Z = 7.117, padj= < 0.001). Controls also differ from the recovered bees (Z = –4.7998, padj <0.001). Data are represented as boxplots. Shown is median ± IQR.
Figure 4—figure supplement 1
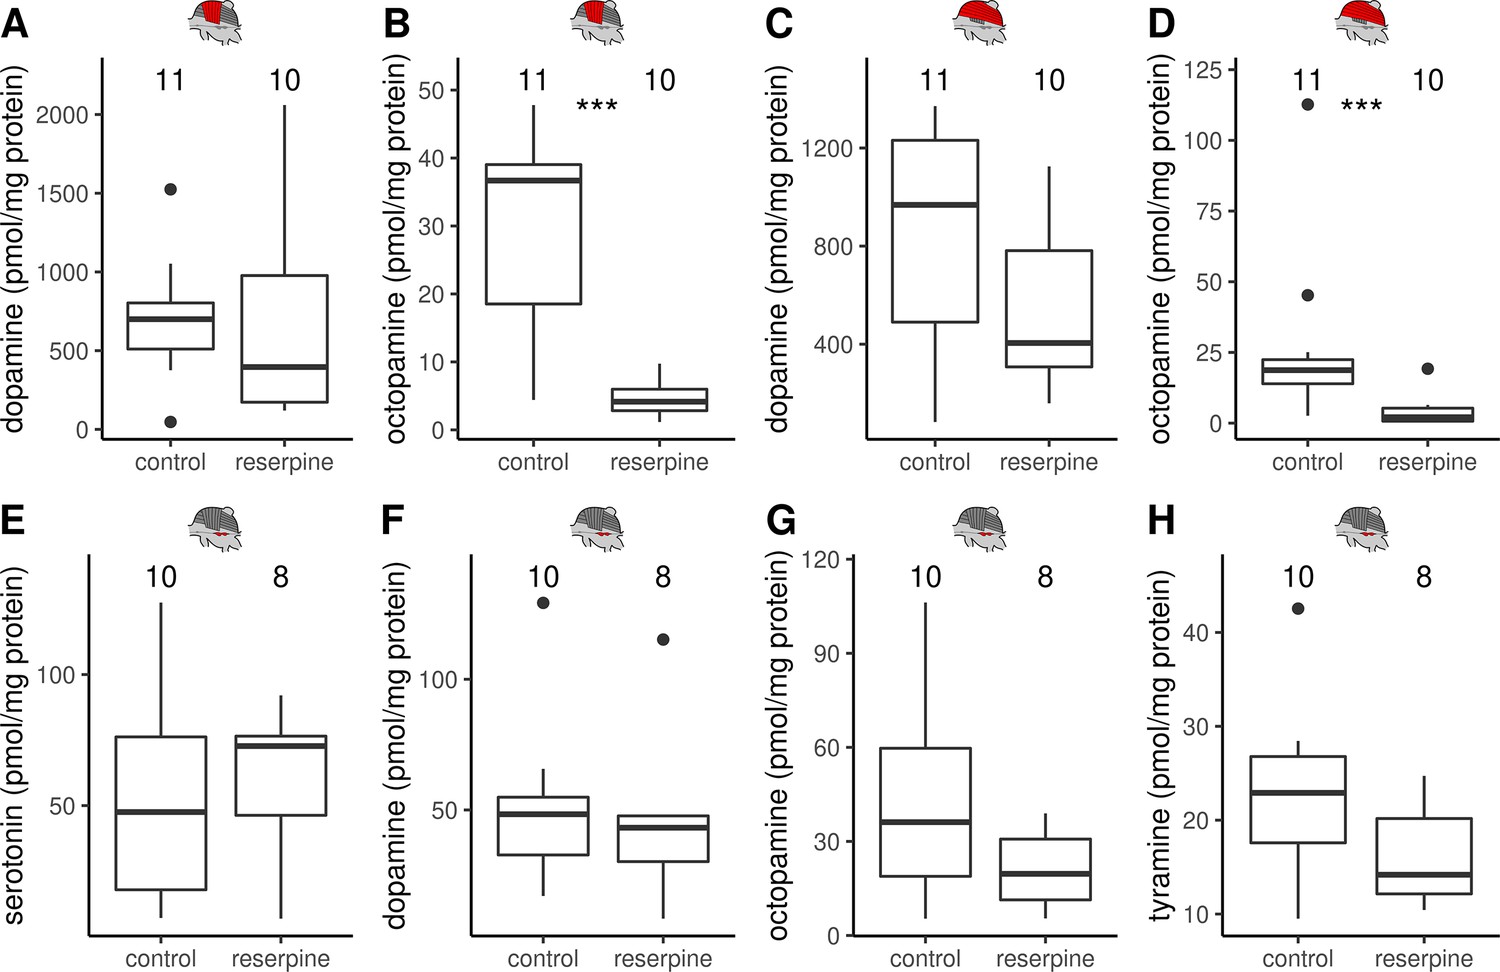
The effect of reserpine on monoamine concentrations in DV, DL and MMTG.
(A–H) Monoamine concentrations in the thoracic tissues quantified by HPLC-ECD. Reserpinezed bees have significant lower octopamine (B,D) but not dopamine concentrations (A,C) than control animals in both dorsoventral (A–B) and dorsal-longitudinal flight muscles (C–D). In the mesometa-thoracic ganglia serotonin (E), dopamine (F), octopamine (G), and tyramine (H) were detectable but no reserpine effect was observable. Mann-Whitney U test: DV & octopamine, W = 105, z = –3.70, p < 0.001; DL & octopamine:, W = 102, z = –3.37, p < 0.001; all others: p > 0.05. Shown is median ± IQR.
Figure 4—figure supplement 2
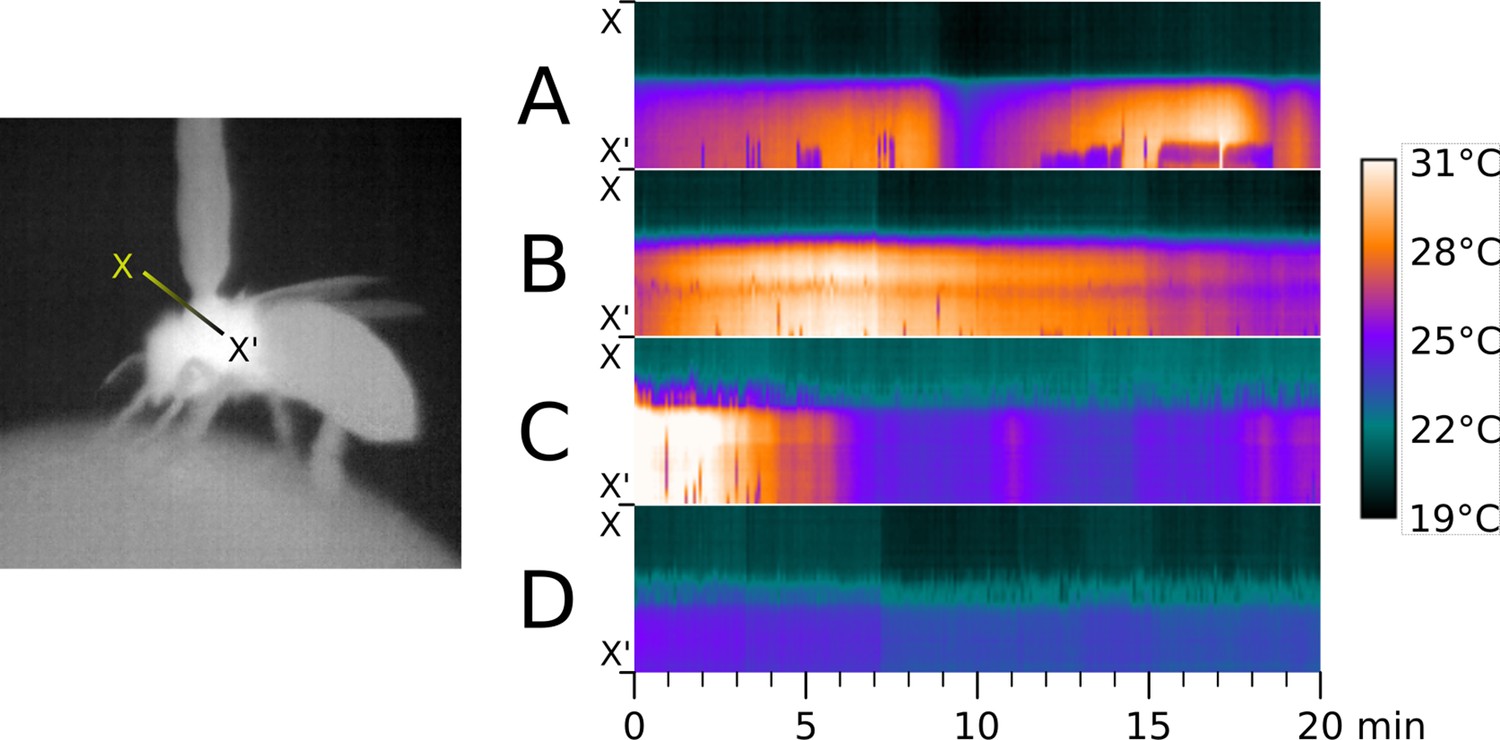
Time series of thermographic recordings of thoraces of selected workerbees.
To show differences in individual heating patterns, the thermographically determined temperatures along the line X - X’ (left) were plotted over time and exemplied for four bees (right, A-D).
Figure 4—figure supplement 3
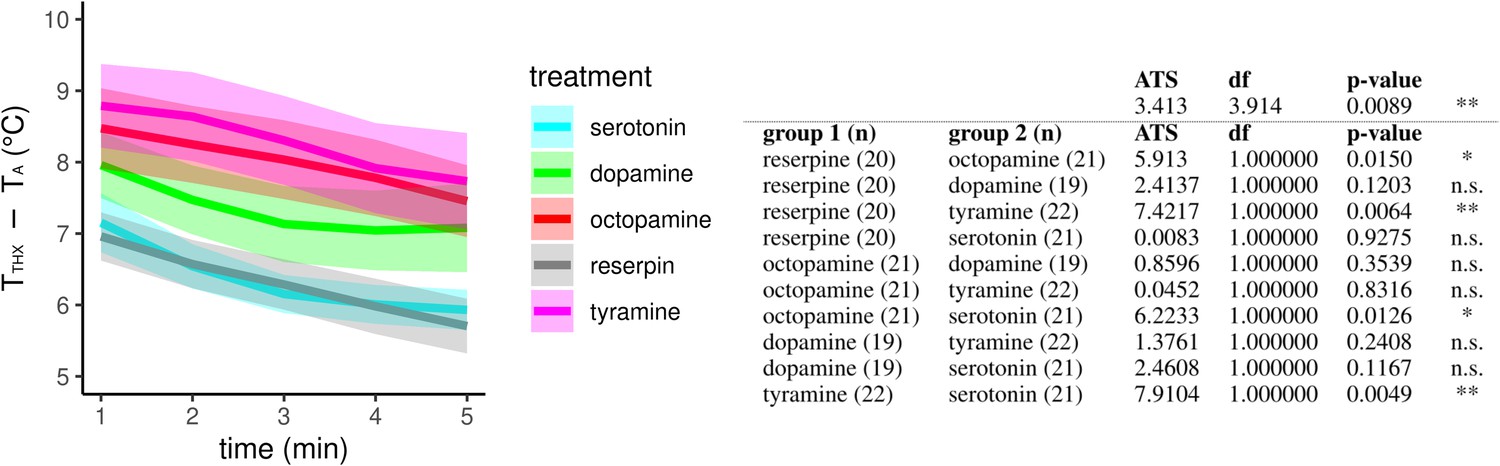
The effect of different monoamines on thermogenesis of reserpinized bees.
Screen for monoamines that are able to equalize the negative impact of reserpine on the workerbee thermogenesis. Injection of octopamine and tyramine lead to significantly increased thorax temperatures of reserpine-fed bees, wheres serotonin and dopamine does not. The solid line represents the mean difference between the thorax temperature (TTHX) and ambient temperature (TA) and the shaded area represents the 95% confidence interval.
Figure 4—figure supplement 4
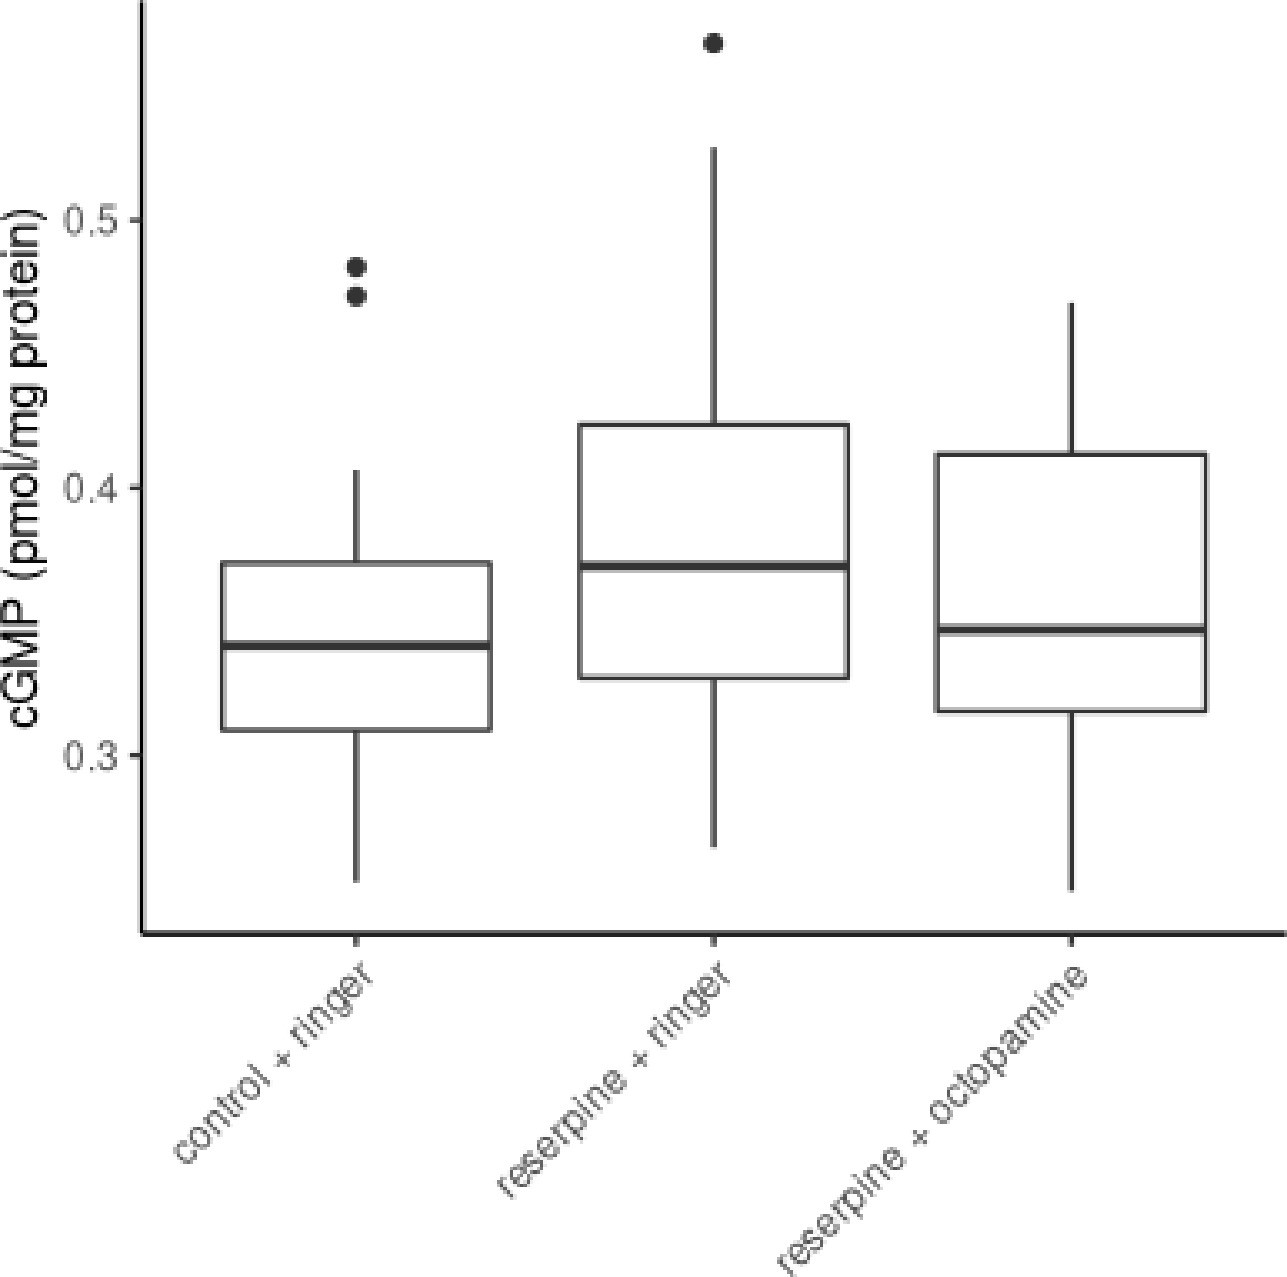
The effect of reserpine on flight muscle cGMP concentrations.
Control bees, reserpinized bees and recovered reserpinized bees does not differ in their tissue cGMP concentrations of their flight muscles (Kruskal-Wallis test, x2 = 2.212, df = 2, p = 0.331).
Figure 5
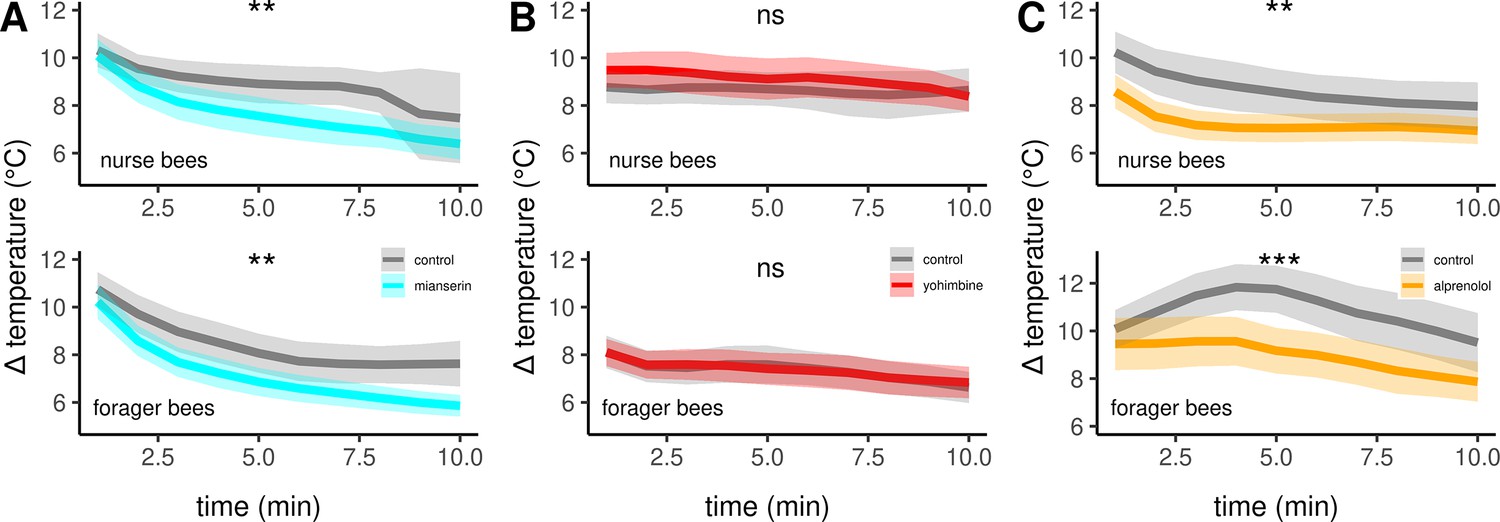
The effects of different antagonists on workerbee thermogenesis.
Mianserin (A) and alprenolol (C) cause hypothermia in workerbees but not yohimbine (B). The solid line represents the mean difference between TTHX and TA and the shaded area represents the 95% confidence interval. For statistic see Table 3.
Figure 6
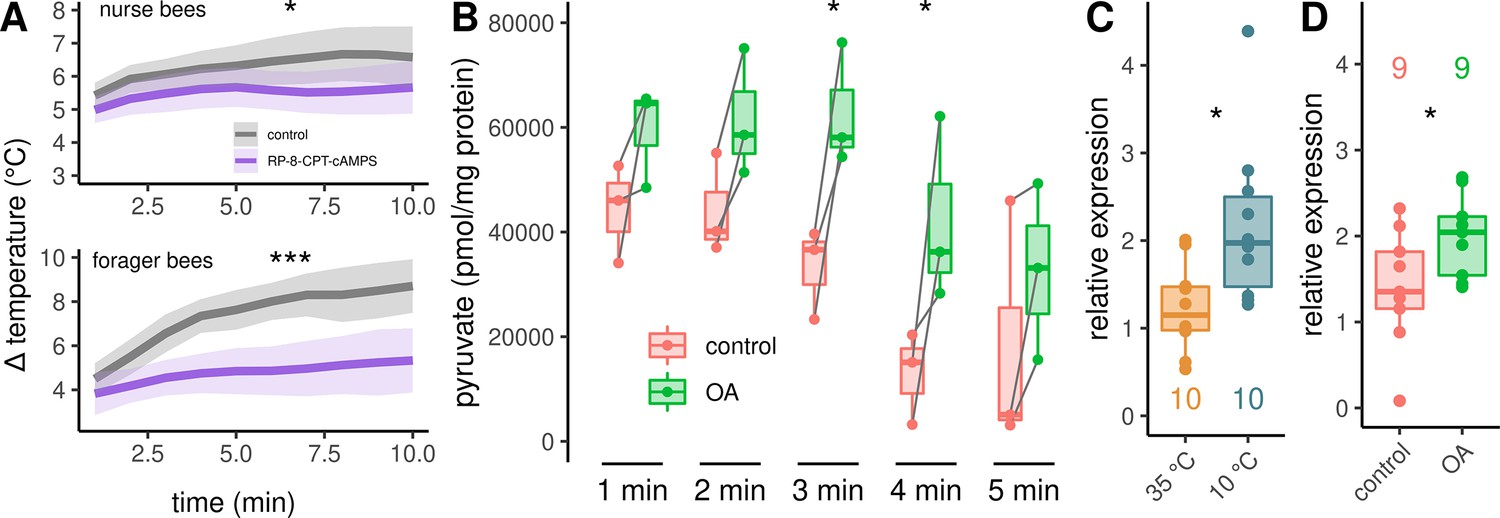
Analysis of the downstream pathway.
(A) The PKA inhibitor Rp-8-CPT-cAMPS causes hypothermia in nurse bees and forager bees. The solid line represents the mean difference between TTHX and TA and the shaded area represents the 95% confidence interval. For statistic see Table 3. (B) DL muscles were separated into two mirror-similar parts and treated differently. Bath application of octopamine (B) leads to an difference in the mean pyruvate concentration when compared with control (two-way RM ANOVA, F(1)=38.28, p < 0.001). The simple main effect of treatment becomes significant after 3 and 4 min (Sidaks multiple comparisons test, 3 min: p = 0.016, 4 min: p = 0.017). Shown is median ± IQR. Data points of the same individual are connected by gray lines. (C–D) AmGAPDH expression in DV and DL is upregulated due to cold stress (C, Mann-Whitney U test, W = 83, z = –2.24, p = 0.01261). This result can be mimicked by an injection of octopamine directly into the flight muscles (D, Mann-Whitney U test, W = 18, z = –1.68, p = 0.04694). Shown is median ± IQR.
Figure 7
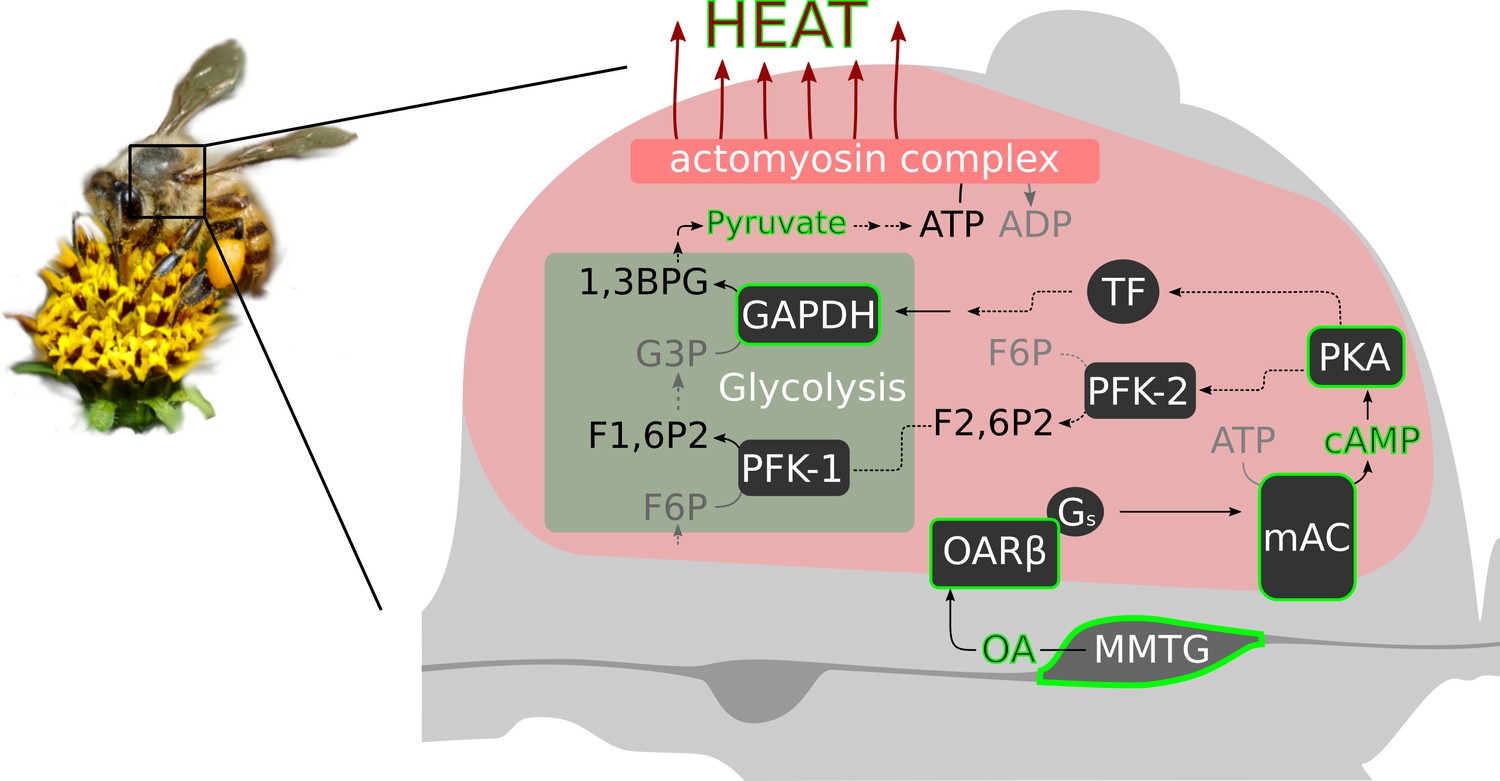
Octopamine and honeybee thermogenesis.
The scheme summarizes our findings, with the solid lines and green borders representing interpretations supported by our results and the dashed lines representing hypothetical pathways. Muscle innervating neurons in the MMTG release octopamine (OA) directly to the flight muscles. By this, AmOARβ two receptors are activated which in turn activate the membrane-bound adenylyl cyclase (mAC) via Gs proteins. The resulting increase in the intracellular cAMP concentration leads to the activation of Proteinkinase A (PKA) which phosphorylates and by this activates phosphofructokinase 2 (PFK-2). Consequently, this enzyme produces fructose-2,6-bisphosphate (F2,6P2) which increases the activity of phosphofructokinase 1 (PFK-1). An alternative pathway is the PKA mediated activation of transcription factors (TF) which might enhance expression of GAPDH which encodes glyceraldehyde 3-phosphate dehydrogenase (GAPDH). This enzyme converts glyceraldehyde 3-phosphate (G3P) into 1,3-bisphosphoglyceric acid (1,3BPG). All together, this increases the glycolysis rate so that a greater amount of pyruvate is available for ATP production. Finally, heat is generated in the actomyosin complex under ATP consumption.
Tables
Table 1
Statistical analysis of HPLC analysis of the octopamine content.
ns = not significant.
| Analysis | Test | Groups (n) | Result | |
|---|---|---|---|---|
| HPLCoctopamineDVFigure 1A | Kruskal-Wallis test | χ2 = 15.772, df = 4, p = 0,0033 | ** | |
| Dunns test | 0 days (6) vs. 7 days (6) | Z = –2.4593, padj = 0.1392 | ns | |
| 0 days (6) vs. 14 days (6) | Z = –2.8856, padj = 0.0391 | * | ||
| 0 days (6) vs. 21 days (6) | Z = –2.7217, padj = 0.065 | ns | ||
| 0 days (6) vs. 28 days (6) | Z = –3.7382, padj = 0.0017 | ** | ||
| 7 days (6) vs. 14 days (6) | Z = 0.4263, padj = 1.0 | ns | ||
| 7 days (6) vs. 21 days (6) | Z = 0.2623, padj = 1.0 | ns | ||
| 7 days (6) vs. 28 days (6) | Z = 1.2789, padj = 1.0 | ns | ||
| 14 days (6) vs. 21 days (6) | Z = 0.164, padj = 1.0 | ns | ||
| 14 days (6) vs. 28 days (6) | Z = –0.8526, padj = 1.0 | ns | ||
| 21 days (6) vs. 28 days (6) | Z = –1.0165, padj = 1.0 | ns | ||
| HPLCoctopamineDLFigure 1B | Kruskal-Wallis test | χ2 = 16.292, df = 4, p = 0.0027 | ** | |
| Dunns test | 0 days (6) vs. 7 days (6) | Z = –1.3117, padj = 1.0 | ns | |
| 0 days (6) vs. 14 days (6) | Z = –2.6561, padj = 0.0791 | * | ||
| 0 days (6) vs. 21 days (6) | Z = –1.9019, padj = 0.5718 | ns | ||
| 0 days (6) vs. 28 days (6) | Z = –3.8038, padj = 0.0014 | ** | ||
| 7 days (6) vs. 14 days (6) | Z = 1.3444, padj = 1.0 | ns | ||
| 7 days (6) vs. 21 days (6) | Z = 0.5902, padj = 1.0 | ns | ||
| 7 days (6) vs. 28 days (6) | Z = 2.4921, padj = 0.127 | ns | ||
| 14 days (6) vs. 21 days (6) | Z = 0.7542, padj = 1.0 | ns | ||
| 14 days (6) vs. 28 days (6) | Z = –1.1477, padj = 1.0 | ns | ||
| 21 days (6) vs. 28 days (6) | Z = –1.9019, padj = 0.5718 | ns | ||
| HPLCoctopamineMMTGFigure 1C | Kruskal-Wallis test | χ2 = 5.4912, df = 4, p = 0.2405 | ns | |
| groups (n): 0 days (7), 7 days (8), 14 days (7), 21 days (8), 28 days (8) | ||||
Table 2
Statistical analysis of the flight muscle gene expression analysis.
ns = not significant.
| Analysis | Test | Groups (n) | Result | |
|---|---|---|---|---|
| qPCR AmOARα1 DV Figure 3D | Kruskal-Wallis test | χ2 = 25.734, df = 4, p = 0.00004 | *** | |
| Dunns test | 0 days (8) vs. 7 days (8) | Z = –1.6253, padj = 1.0 | ns | |
| 0 days (8) vs. 14 days (8) | Z = –3.9776, padj = 0.0007 | *** | ||
| 0 days (8) vs. 21 days (8) | Z = –3.9135, padj = 0.0009 | *** | ||
| 0 days (8) vs. 28 days (8) | Z = –3.8493, padj = 0.0012 | ** | ||
| 7 days (8) vs. 14 days (8) | Z = –2.3523, padj = 0.1866 | ns | ||
| 7 days (8) vs. 21 days (8) | Z = –2.2882, padj = 0.2213 | ns | ||
| 7 days (8) vs. 28 days (8) | Z = –2.224, padj = 0.2615 | ns | ||
| 14 days (8) vs. 21 days (8) | Z = 0.0642, padj = 1.0 | ns | ||
| 14 days (8) vs. 28 days (8) | Z = 0.1283, padj = 1.0 | ns | ||
| 21 days (8) vs. 28 days (8) | Z = 0.0642, padj = 1.0 | ns | ||
| qPCR AmOARα1 DL Figure 3C | Kruskal-Wallis test | χ2 = 28.163, df = 4, p = 0.00001 | *** | |
| Dunns test | 0 days (8) vs. 7 days (8) | Z = –1.5661, padj = 1.0 | ns | |
| 0 days (8) vs. 14 days (8) | Z = –4.4373, padj = 0.0001 | *** | ||
| 0 days (8) vs. 21 days (7) | Z = –3.6548, padj = 0.0026 | ** | ||
| 0 days (8) vs. 28 days (5) | Z = –3.7128, padj = 0.002 | ** | ||
| 7 days (8) vs. 14 days (8) | Z = –2.8712, padj = 0.0409 | * | ||
| 7 days (8) vs. 21 days (7) | Z = –2.1418, padj = 0.322 | ns | ||
| 7 days (8) vs. 28 days (5) | Z = –2.3392, padj = 0193 | ns | ||
| 14 days (8) vs. 21 days (7) | Z = 0.6320, padj = 1.0 | ns | ||
| 14 days (8) vs. 28 days (5) | Z = 0.179, padj = 1.0 | ns | ||
| 21 days (7) vs. 28 days (5) | Z = –0.3844, padj = 1.0 | ns | ||
| qPCR AmOARβ2 DV Figure 3D | Kruskal-Wallis test | χ2 = 24.54, df = 4, p = 0.00006 | *** | |
| Dunns test | 0 days (8) vs. 7 days (8) | Z = –1.6894, padj = 0,911 | ns | |
| 0 days (8) vs. 14 days (8) | Z = –2.8228, padj = 0.0476 | * | ||
| 0 days (8) vs. 21 days (8) | Z = –3.8707, padj = 0.0011 | ** | ||
| 0 days (8) vs. 28 days (8) | Z = –4.3412, padj = 0.0001 | *** | ||
| 7 days (8) vs. 14 days (8) | Z = –1.1334, padj = 1.0 | ns | ||
| 7 days (8) vs. 21 days (8) | Z = –2.1813, padj = 0.292 | ns | ||
| 7 days (8) vs. 28 days (8) | Z = –2.6517, padj = 0.0801 | ns | ||
| 14 days (8) vs. 21 days (8) | Z = –1.0479, padj = 1.0 | ns | ||
| 14 days (8) vs. 28 days (8) | Z = –1.5183, padj = 1.0 | ns | ||
| 21 days (8) vs. 28 days (8) | Z = –0.4705, padj = 1.0 | ns | ||
| qPCR AmOARβ2 DL Figure 3E | Kruskal-Wallis test | χ2 = 24.737, df = 4, p = 0.00006 | *** | |
| Dunns test | 0 days (8) vs. 7 days (8) | Z = 0.5429, padj = 1.0 | ns | |
| 0 days (8) vs. 14 days (7) | Z = –2.9652, padj = 0.0302 | * | ||
| 0 days (8) vs. 21 days (6) | Z = –2.4814, padj = 0.130 | ns | ||
| 0 days (8) vs. 28 days (4) | Z = –3.1454, padj = 0.0166 | * | ||
| 7 days (8) vs. 14 days (7) | Z = –3.4897, padj = 0.0048 | ** | ||
| 7 days (8) vs. 21 days (6) | Z = –2.9841, padj = 0.0284 | * | ||
| 7 days (8) vs. 28 days (4) | Z = –3.5887, padj = 0.0033 | ** | ||
| 14 days (7) vs. 21 days (6) | Z = 0.3496, padj = 1.0 | ns | ||
| 14 days (7) vs. 28 days (4) | Z = –0.6246, padj = 1.0 | ns | ||
| 21 days (6) vs. 28 days (4) | Z = –0.9079, padj = 1.0 | ns |
Table 3
Statistical analysis of the thermogenesis dependent on the pharmacological treatment.
c = control, r = reserpine, ATS = ANOVA type statistic, ns = not significant.
| Experiment | Groups (n) | ATS | Df | p | |
|---|---|---|---|---|---|
| ReserpineNurse beesFigure 4D | 9.3635 | 1.9854 | 0.00009 | *** | |
| c + ringer (21) vs. r + ringer(23) | 13.9618 | 1.0 | 0.0002 | *** | |
| c + ringer (21) vs. r + octopamine (23) | 0.0952 | 1.0 | 0.7577 | ns | |
| r + ringer(23) vs. r + octopamine (23) | 14.2223 | 1.0 | 0.0002 | *** | |
| ReserpineForager beesFigure 4D | 14.5704 | 1.9437 | 0.0000006 | *** | |
| c + ringer (29) vs. r + ringer(28) | 126.5492 | 1.0000 | 0.0000003 | *** | |
| c + ringer (29) vs. r + octopamine (29) | 0.0753 | 1.0 | 0.7838 | ns | |
| r + ringer(28) vs. r + octopamine (29) | 21.1833 | 1.0000 | 0.000004 | *** | |
| ReserpinecAMPQuantificationFigure 4E | 22.8759 | 1.8981 | 0,0000000003 | *** | |
| c + ringer (26) vs. r + ringer(21) | 39.9913 | 1.0000 | 0.0000000003 | *** | |
| c + ringer (26) vs. r + octopamine (23) | 0.1155 | 1.0 | 0.734 | ns | |
| r + ringer(21) vs. r + octopamine (23) | 37.3015 | 1.0000 | 0.000000001 | *** | |
| MianserinNurse beesForager beesFigure 5A | |||||
| control (30) vs. mianserin (30) | 9.2737 | 1.0000 | 0.0023 | ** | |
| control (30) vs. mianserin (30) | 8.4638 | 1.0000 | 0.0036 | ** | |
| YohimbineNurse beesForager beesFigure 5B | |||||
| control (30) vs. yohimbine (30) | 0.8011 | 1.0000 | 0.3708 | ns | |
| control (32) vs. yohimbine (33) | 0.0584 | 1.0000 | 0.8091 | ns | |
| AlprenololNurse beesForager beesFigure 5C | |||||
| control (30) vs. alprenolol (30) | 7.5516 | 1.0000 | 0.0059 | ** | |
| control (34) vs. alprenolol (33) | 10.9721 | 1.0000 | 0.0009 | *** | |
| CarvedilolNurse beesForager bees | |||||
| control (30) vs. carvedilol (30) | 0.1235 | 1.0000 | 0.7252 | ns | |
| control (36) vs. carvedilol (34) | 0.2650 | 1.0000 | 0.6067 | ns | |
| MetoprololNurse beesForager bees | |||||
| control (30) vs. metoprolol (30) | 0.1031 | 1.0000 | 0.7481 | ns | |
| control (36) vs. metoprolol (36) | 0.2029 | 1.0000 | 0.6524 | ns | |
| Rp-8-CPT-cAMPSNurse beesForager beesFigure 6A | |||||
| control (25) vs. Rp-8-CPT-cAMPS (23) | 4.062 | 1.0000 | 0.044 | * | |
| control (15) vs. Rp-8-CPT-cAMPS (14) | 27.7439 | 1.0000 | 0.0000001 | *** | |
Additional files
Download links
A two-part list of links to download the article, or parts of the article, in various formats.
Downloads (link to download the article as PDF)
Open citations (links to open the citations from this article in various online reference manager services)
Cite this article (links to download the citations from this article in formats compatible with various reference manager tools)
Octopamine drives honeybee thermogenesis
eLife 11:e74334.
https://doi.org/10.7554/eLife.74334


