Unbiased proteomics, histochemistry, and mitochondrial DNA copy number reveal better mitochondrial health in muscle of high-functioning octogenarians
- Intramural Research Program, National Institute on Aging, National Institutes of Health, United States
- Research Institute, Children's Hospital of Eastern Ontario, Canada
- Research Institute of the McGill University Health Centre, McGill University, Canada
- Department of Physical Therapy, University of Florida, United States
- Department of Physiology and Functional Genomics, University of Florida, United States
Figures
Figure 1 with 1 supplement
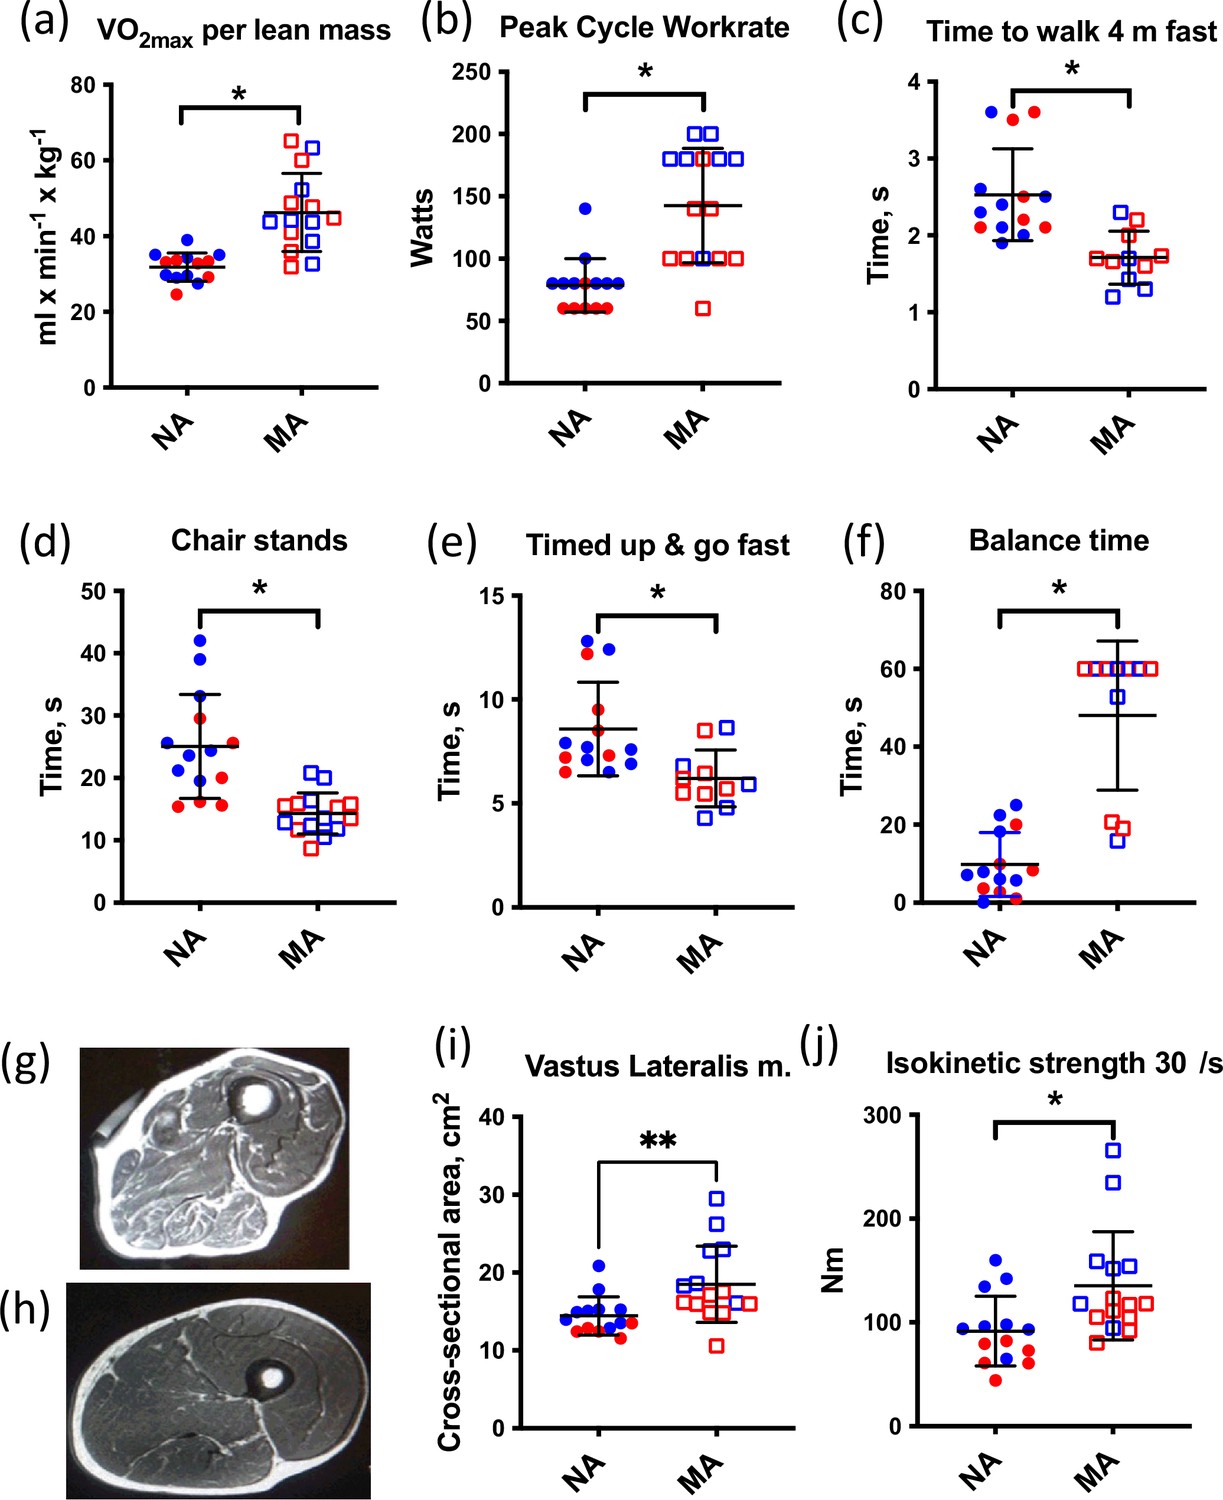
Muscle characteristics of master athletes (MA) and non-athletes (NA).
(a–f) Clinical function tests in NA and MA. (g) Thigh cross-sectional image of an 80-year-old male NA (h) and an 83-year-old male MA. (i) Vastus lateralis muscle cross-sectional area (CSA) was greater in MA than NA. (j) Maximal isokinetic strength during knee extension was greater in MA than NA. Graphs show means and standard deviations. Groups were compared by a two-tailed Student’s t-test, with <0.05.
Figure 1—figure supplement 1
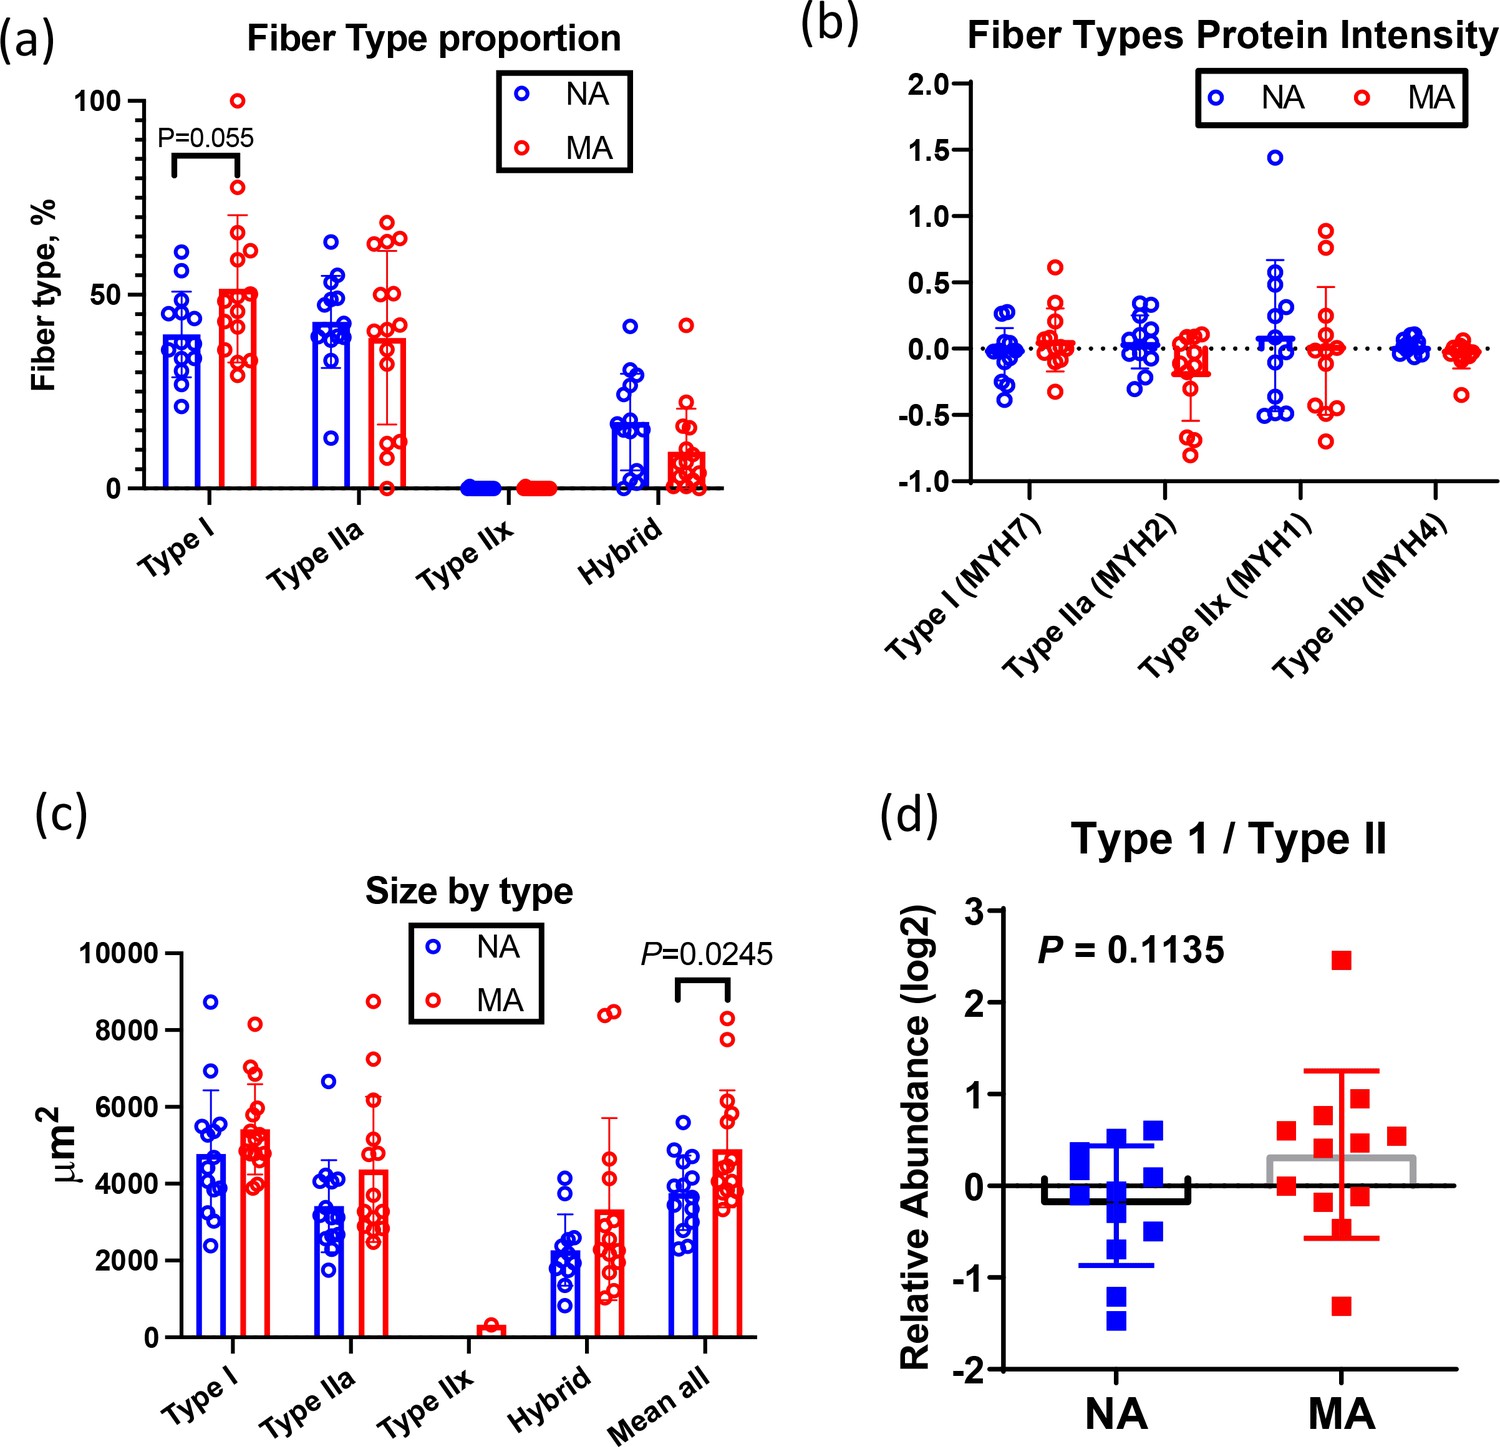
Fiber type and fiber size quantification.
(a) Fiber type quantification. Fiber type proportion is quantified using immunofluorescence labeling in non-athlete (NA) and master athlete (MA) subjects. (b) Myosin isoform quantification from the proteomics results from the same subjects. (c) Fiber size by type and (d) type I to type II myosin protein expression ratio.
Figure 2 with 1 supplement
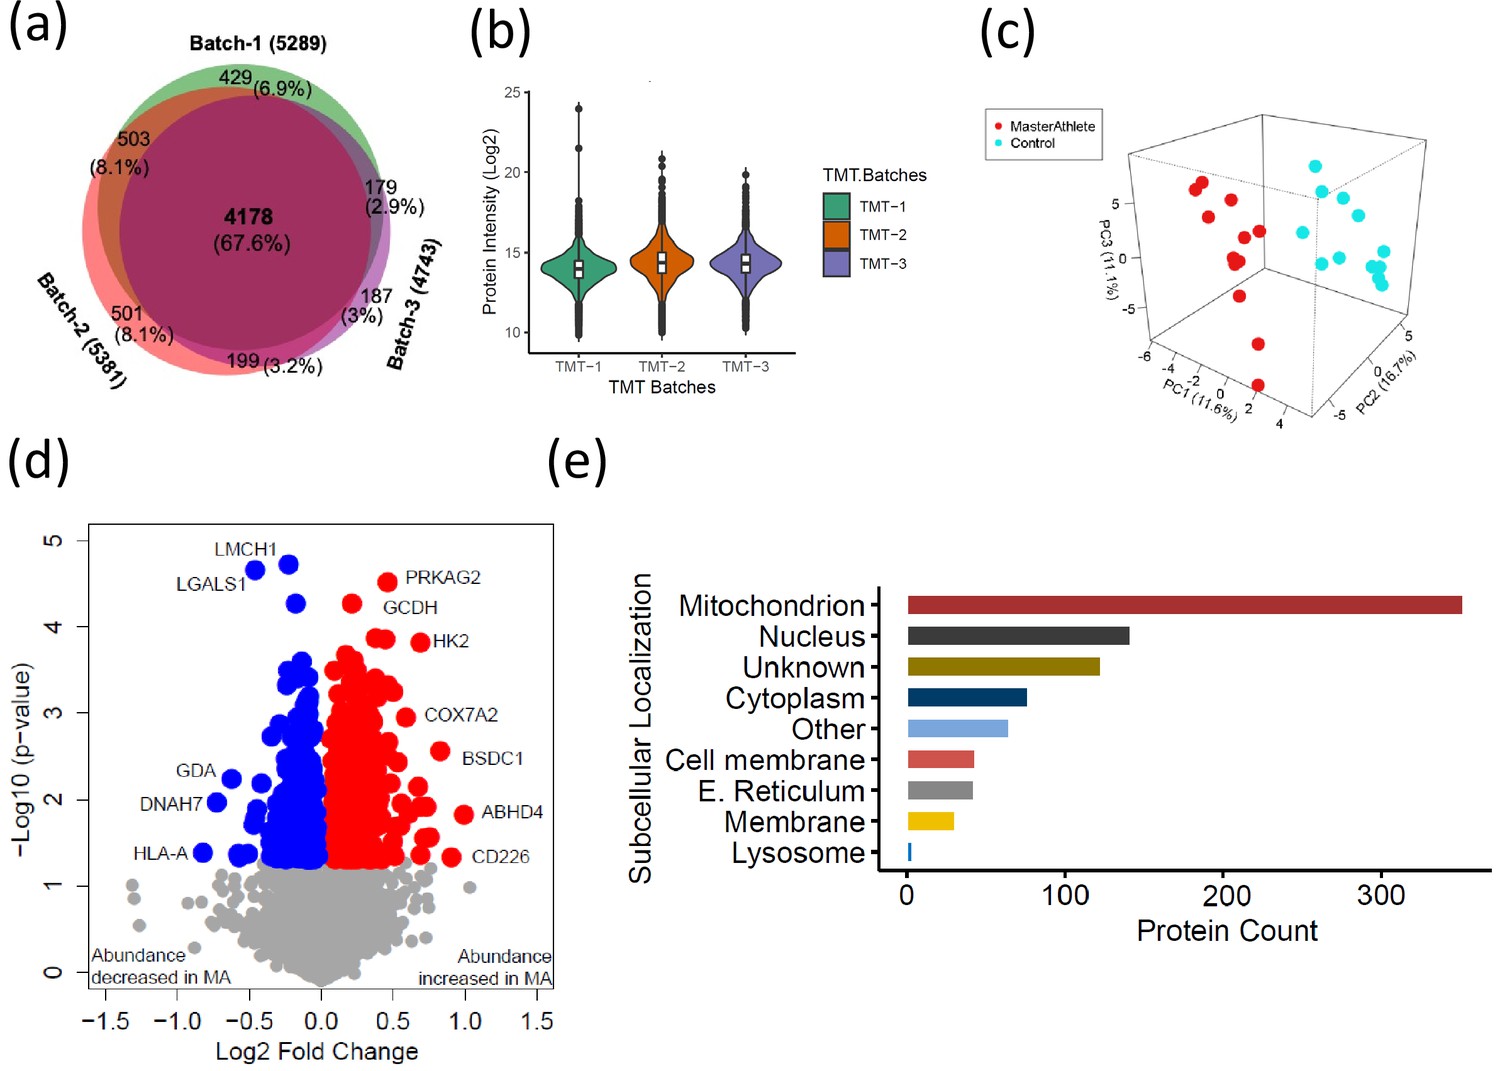
The quantitative proteome reveals temporal proteome changes between master athletes (MA) and non-athletes (NA).
(a) Number of proteins quantified among three tandem mass tag (TMT) batches. (b) Quantitative protein expression between three TMT batches. (c) Partial least square (PLS) plot of MA and NA donors. Red circles are MA donors, and cyan circles are NA donors. (d) Proteins differentially expressed between MA and NA. Each circle is a protein, red circles are proteins increased in abundance in MA, and blue circles are proteins decreased in abundance in MA. (e) Cellular location of the differentially expressed proteins in MA and the number of proteins encoded for each component are shown (X-axis).
Figure 2—figure supplement 1
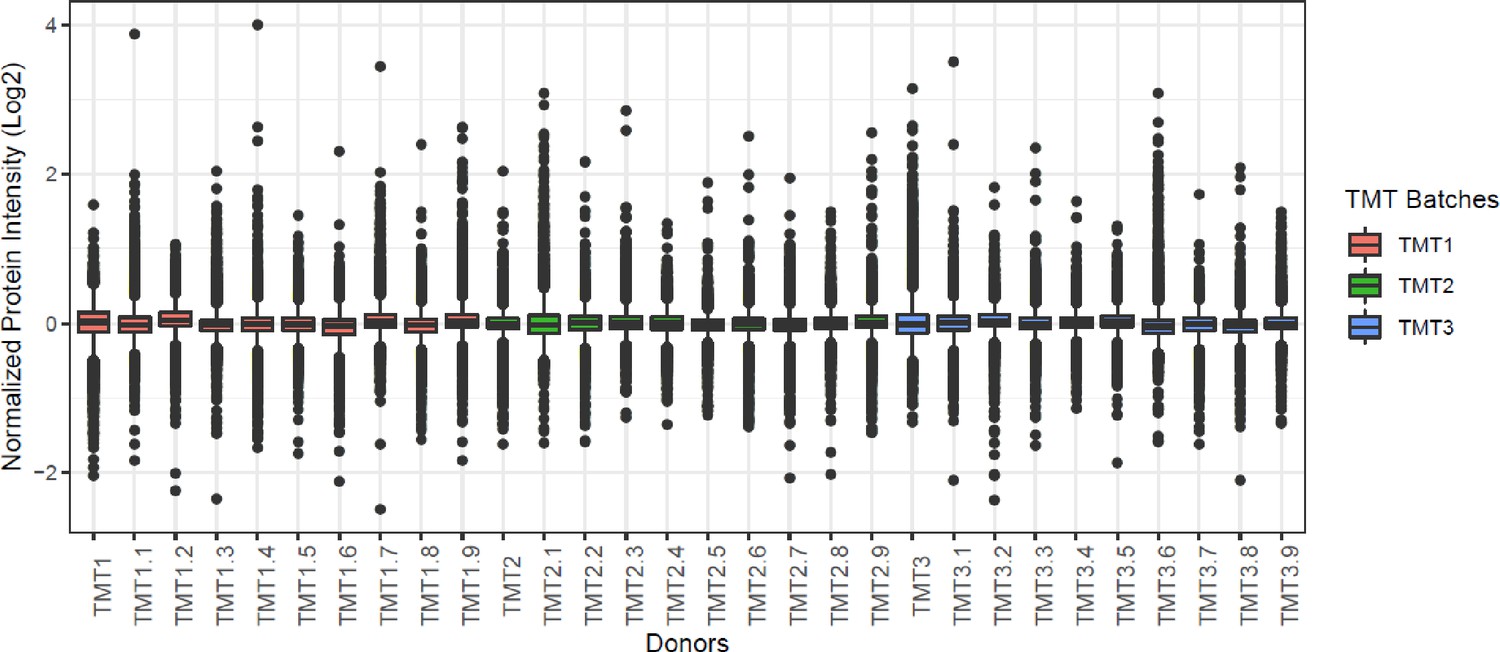
Normalized tandem mass tag (TMT) batches.
Boxplot of all donors from three TMT batches. X-axis shows all the donors including repeats, and y-axis shows the median normalized log2 protein intensity. Each batch is color coded.
Figure 3 with 6 supplements
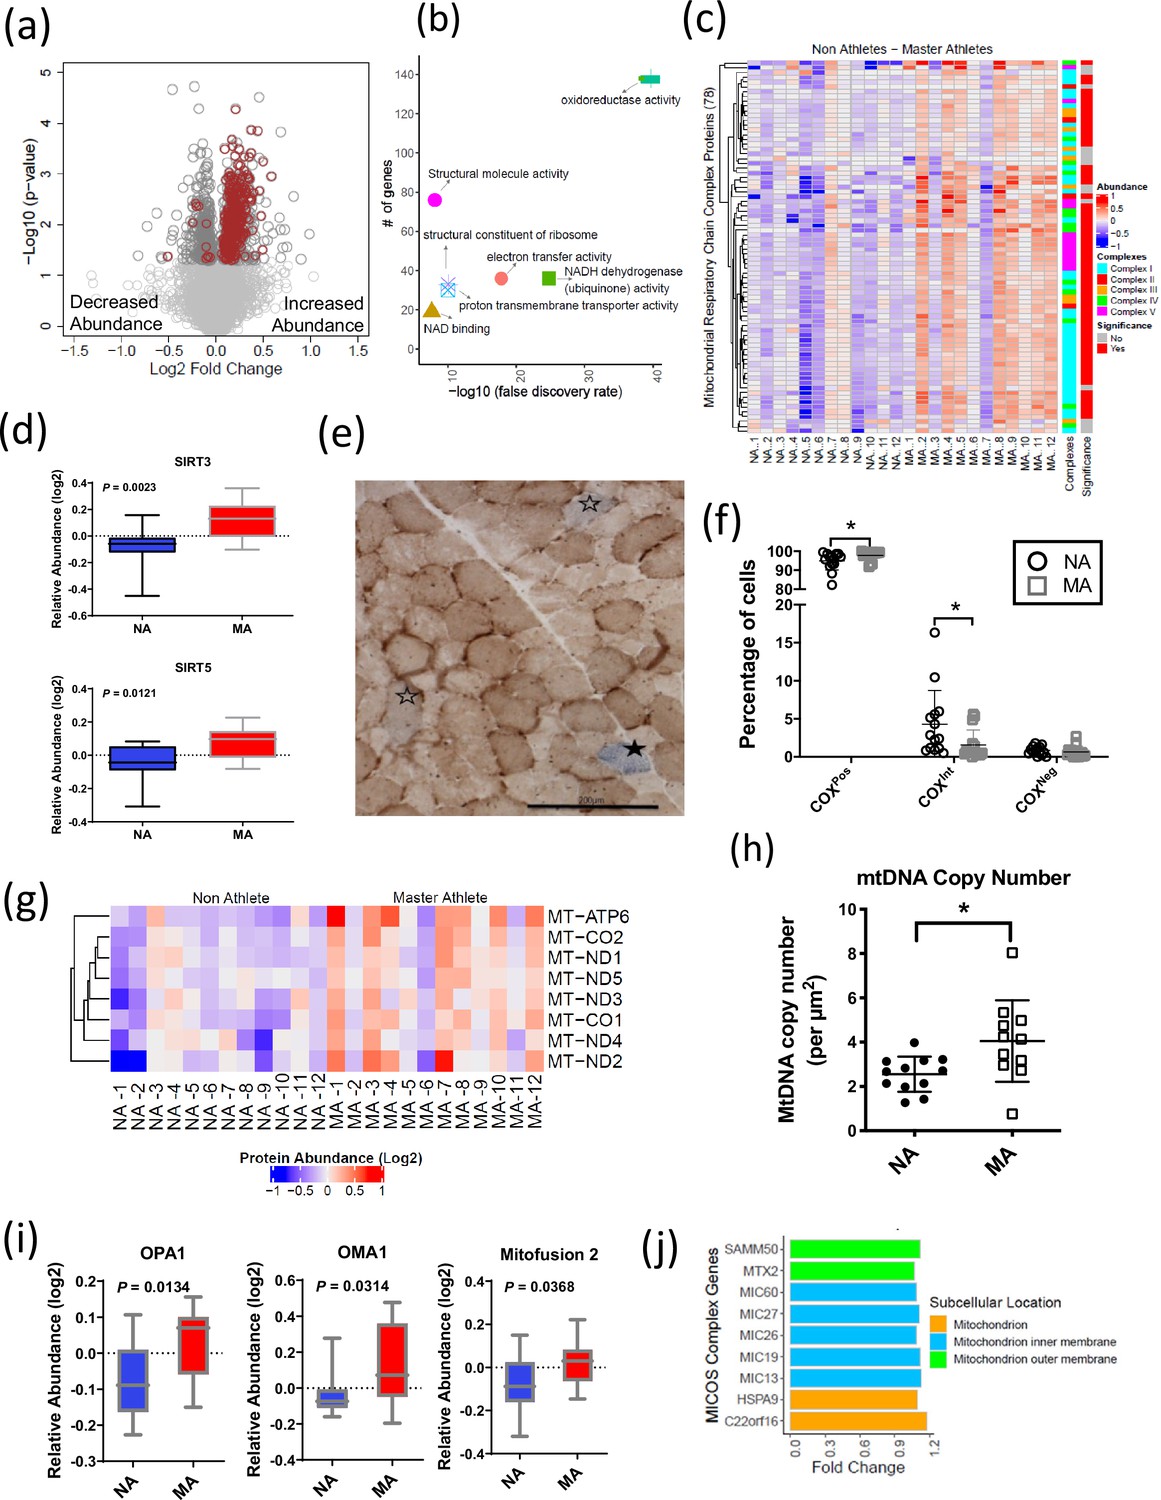
Mitochondrial protein enrichment in octogenarian master athletes (MA).
(a) Dysregulation of significant mitochondrial proteins shown as red circles. (b) Functional classification of mitochondrial proteins with protein-protein interaction enrichment p-value<1.0e-16. (c) Heatmap showing upregulated respiratory chain complex proteins in MA. 71 complex proteins on y-axis. X-axis shows donors. (d) Enrichment of mitochondrial sirtuins SIRT5 and SIRT3 in muscle of MA versus non-athletes (NA). (e) Respiratory chain compromised fibers in skeletal muscle. COX/SDH image showing the identification of COXPos (brown cells), COXInt (empty stars), and COXNeg muscle fibers (solid star). COXNeg fibers have lost complex IV activity relative to SDH and appear blue, COXInt retain small amounts of COX activity relative to SDH and appear gray, and COXPos fibers have normal COX activity relative to SDH and appear brown. Scale = 200 μm. (f) Quantification revealed a significantly higher abundance of healthy COXPos fibers (*p=0.0291) and fewer respiratory chain compromised (COXInt) myofibers (*p=0.0448) in MA compared to NA. (g) Upregulation of mitochondrial DNA (mtDNA) in MA. MA and NA donors are shown on X-axis; quantified mtDNA proteins are shown on Y-axis. (h) Increased mtDNA copy number in MAs. Absolute mtDNA copy number was determined using a standard curve constructed from known amounts of mtDNA. MA had significantly more copies of mtDNA than NA (*p=0.0177; t-test). Graph shows the means and standard deviation. (i) Protein groups that maintain the functional integrity of mitochondria were higher in MA. (j) Upregulated MA proteins in MICOS complex system and the fold change of the proteins. Cellular location of the proteins is color coded.
Figure 3—figure supplement 1
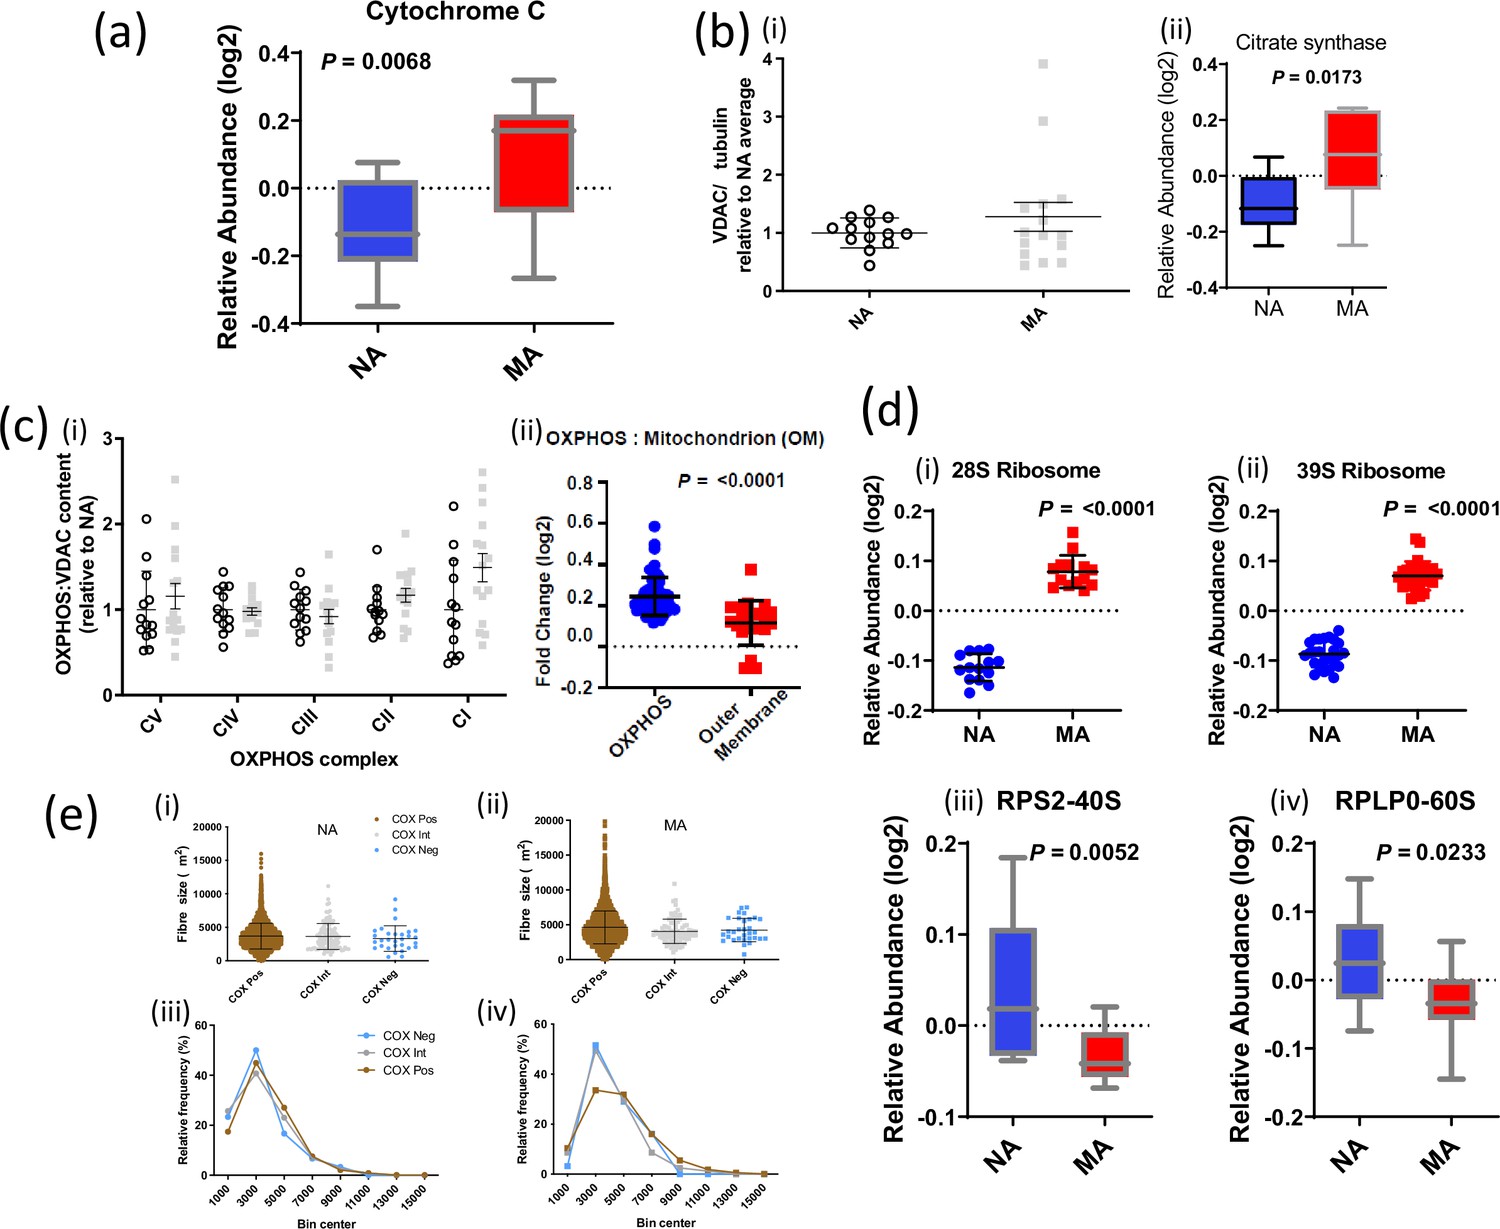
Abundance of mitochondrial proteins, VDAC, and subunits of the oxidative phosphorylation (OXPHOS) chain assessed by Western blot and mass spectrometry (MS) in master athletes (MA) versus non-athletes (NA).
(a) Higher abundance of cytochrome c in MA. (b) Abundance of mitochondrial proteins. (i) There was no significant difference in VDAC assessed by Western blot between MA (n = 15) and NA (n = 13, insufficient tissue form one subject). Removal of the MA outlier made no difference to significance values (Wilcoxon rank-sum). (ii) Citrate synthase protein content by proteomics was higher in MA. (c) (i) There was a significant main effect (p=0.046) indicating higher OXPHOS complexes relative to VDAC in MA (gray squares). Western blot values are expressed relative to NA average (empty circles). Graphs show means and standard deviations. (ii) Consistent with these Western blot analyses, Log2 fold change (FC) expression of 64 significant OXPHOS complex proteins versus 21 VDAC proteins was higher in MA than NA. (d) Ribosomal proteins. Mitochondrial ribosomes are overrepresented in MA, and cytoplasmic ribosomes are underrepresented in MA. (i) 12 28S ribosomal proteins were averaged and (ii) 24 39S ribosomes are averaged and shown, respectively. (iii) 40S ribosomal protein RPS2 is significantly lower in MA versus NA, and similarly (ii) the abundance of RPLP0 60S protein was higher in MA. (e) Size distribution of respiratory chain compromised fibers: range of observations in (i) NA and (ii) MA, along with the frequency distributions in (iii) NA and (iv) MA. There was no significant difference in the average fiber size between COXPOS, COXInt, or COXNeg cells in either NA or MA subjects, and there was no significant increase in the frequency of COXNeg cells in the smallest size bin. Circles are NA and squares are MA, brown symbols are COXPos fibers,.
Figure 3—figure supplement 2
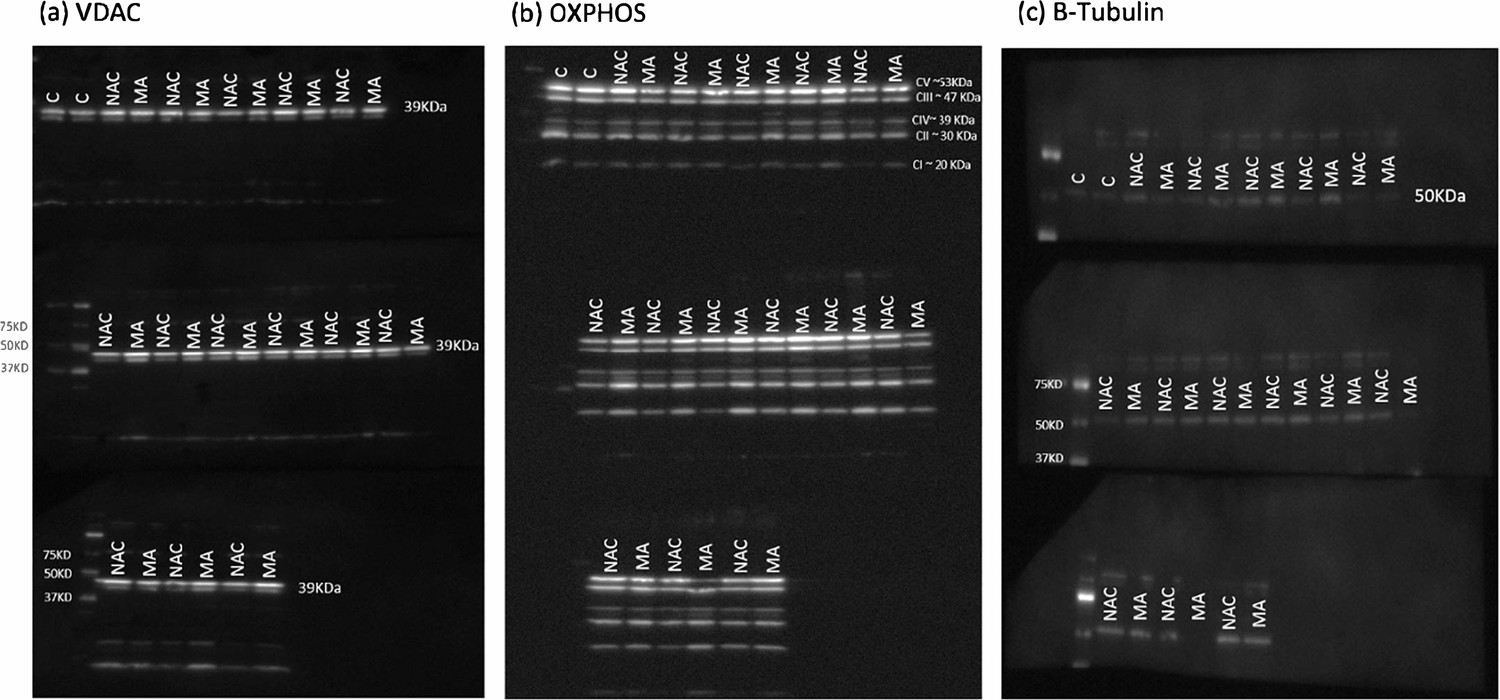
Mitochondrial protein quantification.
Mitochondrial protein quantification was performed by immunoblotting of the mitochondrial proteins VDAC (a) and the components of the oxidative phosphorylation (OXPHOS) system (b). The samples were loaded alternatively, that is, one master athletes (MA) and one non-athletes (NA). Gels held 12 samples plus a pre stained protein standard (161-0375 Bio-Rad). Quantification was performed on images taken with all three gels present. The gels were probed for tubulin (c), stripped, then probed for VDAC, stripped again, and then probed for the OXPHOS subunits. C = samples of protein from subjects not included in this study.
-
Figure 3—figure supplement 2—source data 1
Uncut blots for VDAC and oxidative phosphorylation (OXPHOS) subunits.
- https://cdn.elifesciences.org/articles/74335/elife-74335-fig3-figsupp2-data1-v2.xlsx
-
Figure 3—figure supplement 2—source data 2
Source data for the Western blotting of oxidative phosphorylation (OXPHOS) subunit and VDAC proteins are found in Figure 3—figure supplement 2.
- https://cdn.elifesciences.org/articles/74335/elife-74335-fig3-figsupp2-data2-v2.pdf
Figure 3—figure supplement 3
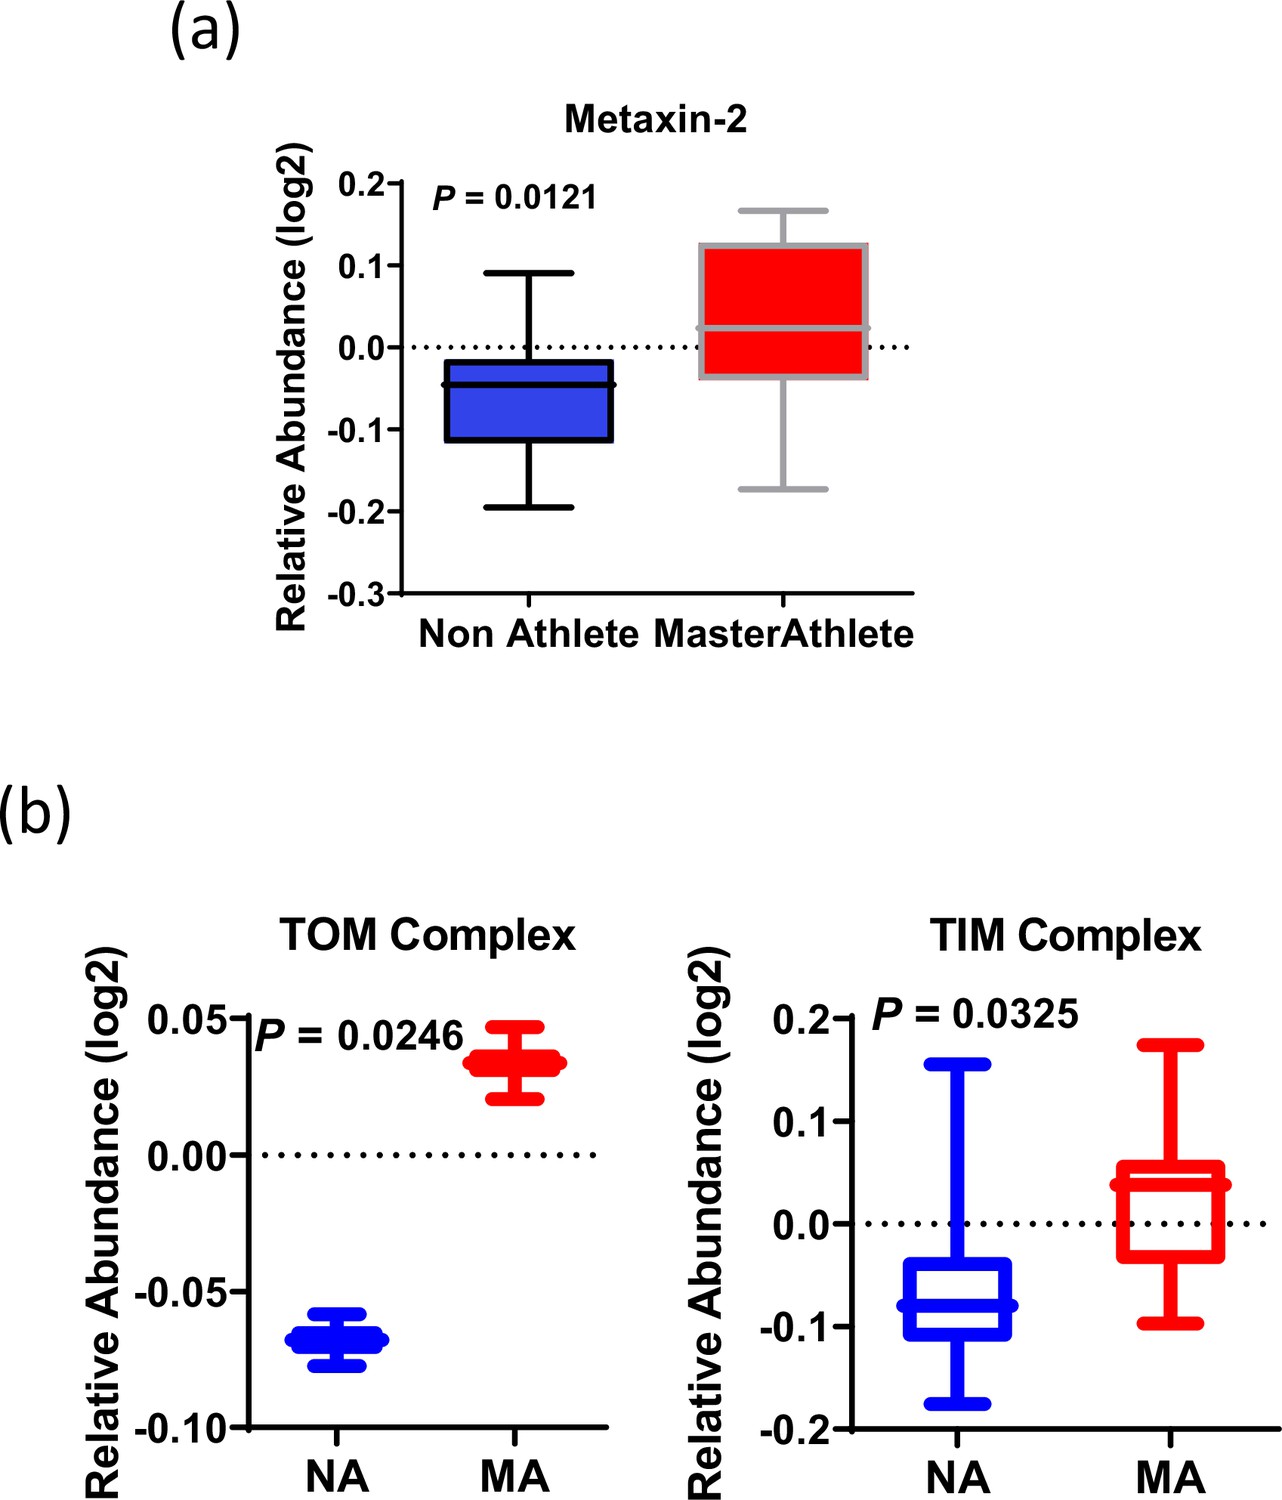
Mitochondrial DNA (mtDNA) enrichment analysis and cristae formation.
(a) Relative protein abundance of metaxin. (b) TOM complex and TIM complex. The average expression of all the proteins quantified for TOM complex (TOM22 and TOMM40) and nine TIM complex proteins is given on the bottom figure panel.
Figure 3—figure supplement 4
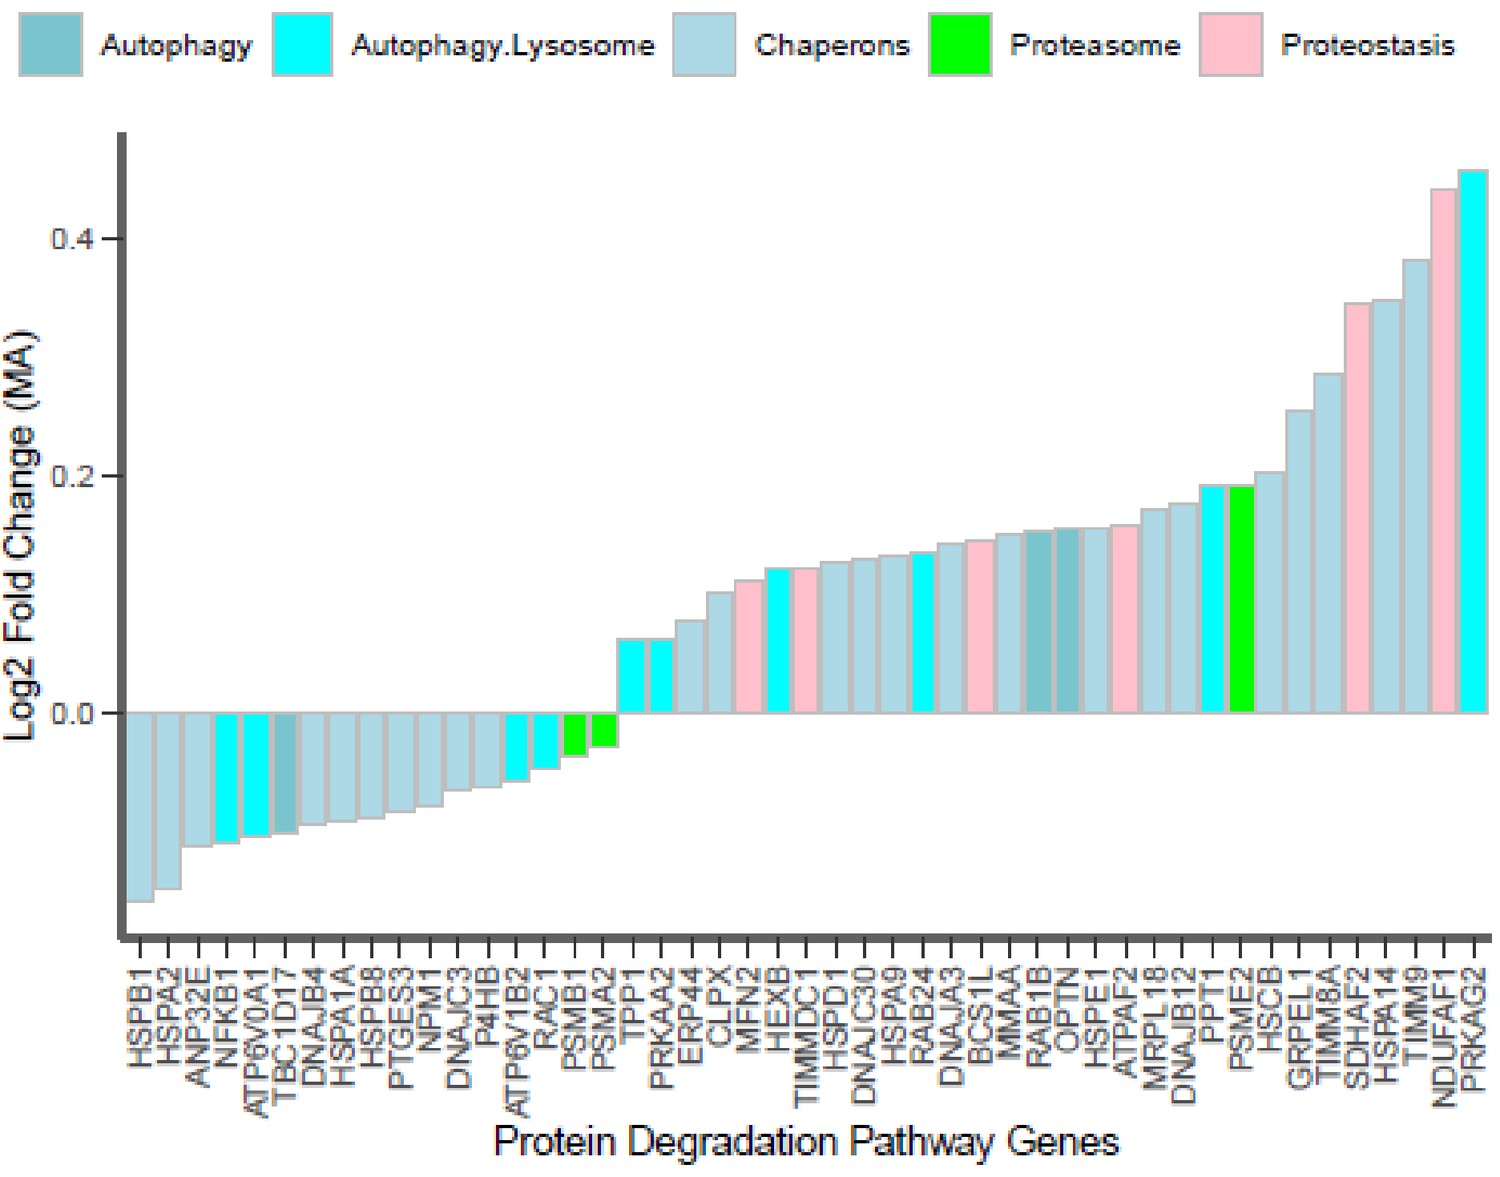
Autophagy lysosomal system and ubiquitin proteasome pathway proteins.
Expression of significant proteins from autophagy and proteasome pathways is shown for master athletes (MA) vs. non-athletes (NA). Each bar is a protein with the corresponding gene name showing decrease in abundance to increase in abundance (left to right). X-axis is the protein, and Y-axis is the log2 fold change (FC) of the MA proteins. Different categories of the autophagy, proteostasis proteins are color coded.
Figure 3—figure supplement 5
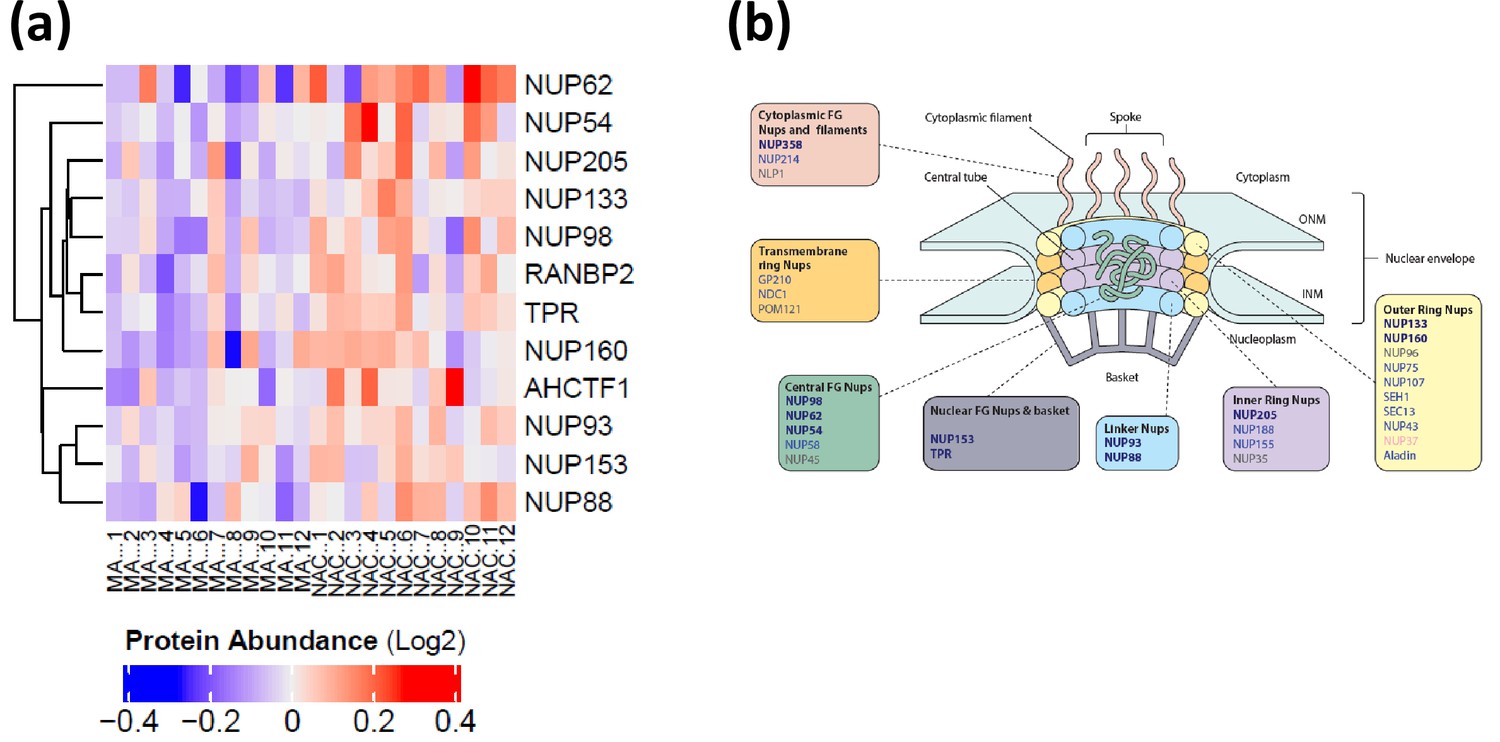
Nuclear pore membrane proteins.
(a) Expression of significant nuclear pore proteins for all donors. The first 12 columns are master athlete (MA) donors followed by non-athletes (NA), The abundance of protein expression is lower in MA versus NA. (b) Underrepresented MA proteins in the nuclear pore structure. Structure of nuclear pore complex (NPC) and the proteins underrepresented showing significant protein coverage for all classes of NPC. Bold blue gene names are significantly underrepresented proteins (p<0.05), blue gene names are quantified but not significant (p>0.05), and gray gene names are not detected in the dataset.
Figure 3—figure supplement 6
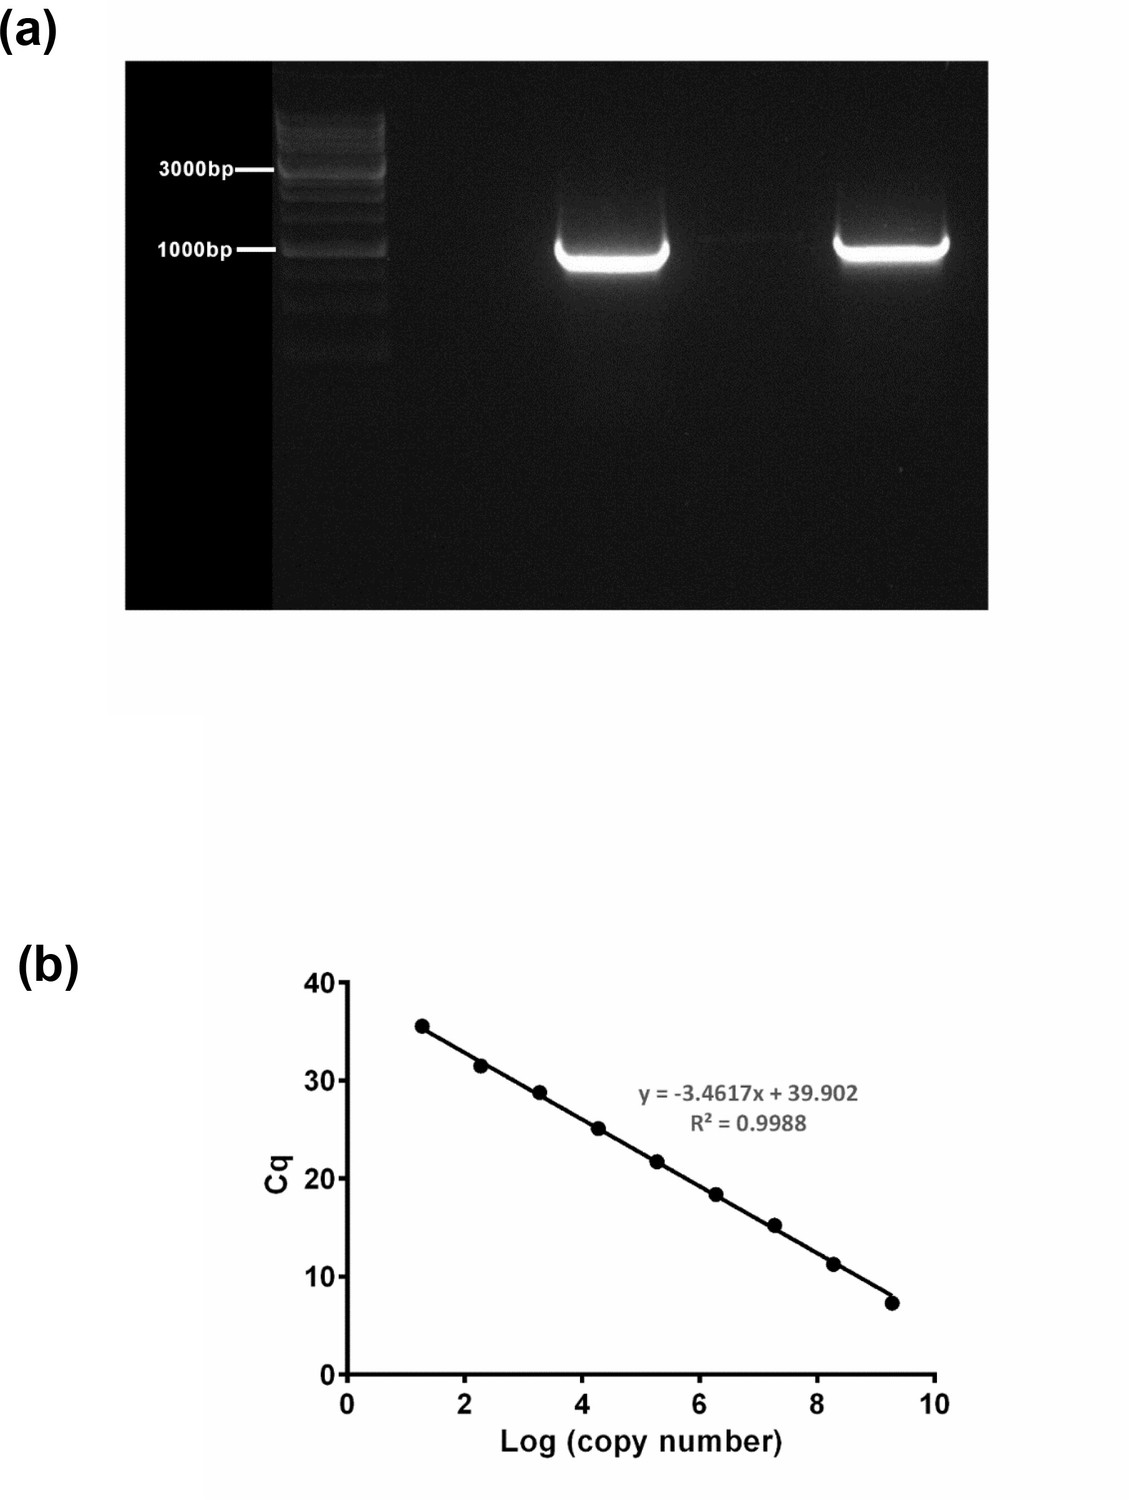
Generating a standard curve in order to determine absolute mitochondrial DNA (mtDNA) copy number.
A 1011 bp fragment (a) containing the MTND1 region was amplified and then run (both visible lanes) with a 25K ladder (Diamed). Following separation on a 1% gel, the band was extracted using a QIAquick Gel Extraction Kit (QIAGEN) and the product quantified using a spectrophotometer. (b) The mtDNA fragment was then serially diluted down to generate a standard curve, which was then run on an MTND1 TaqMan qPCR assay multiple times to generate a consistent line and equation. All subject samples were run at the same time along with the curve in order that their mtDNA copy number could be determined.
-
Figure 3—figure supplement 6—source data 1
Mitochondrial DNA copy number determination blots.
- https://cdn.elifesciences.org/articles/74335/elife-74335-fig3-figsupp6-data1-v2.xlsx
Figure 4
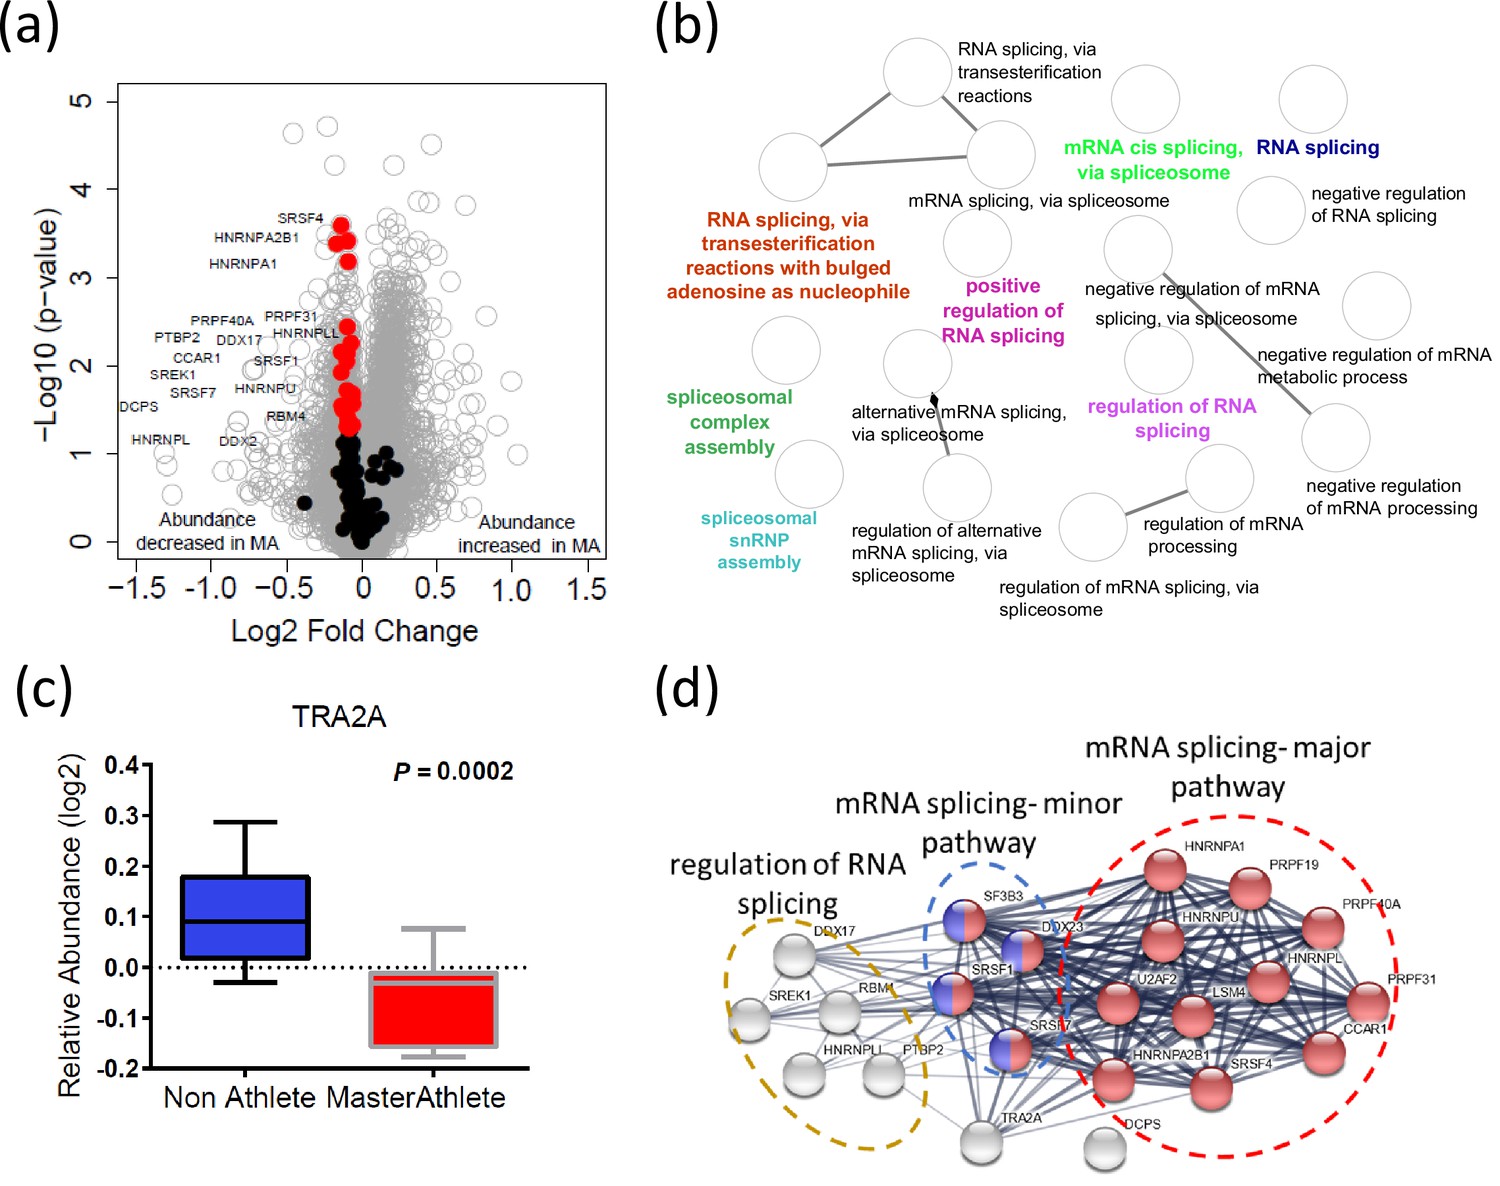
Dysregulation of spliceosome pathway proteins in octogenarian master athletes (MA).
(a) Underrepresentation of spliceosome pathway proteins. Significant spliceosome proteins (22) underrepresented in MA are marked as red circles, and all other proteins are marked as gray circle. X-axis shows log2 fold expression of the proteins in MA versus non-athletes (NA). (b) The functional characteristics of the spliceosome proteins are shown. Each GO annotation cluster is color coded. (c) Downregulation of TRA2 protein in MA donors. Y-axis shows the log2 relative protein abundance. (d) Interaction partners of TRA2 protein; with RNA splicing regulation proteins, mRNA major splicing pathway, and mRNA minor splicing pathway proteins.
Figure 5
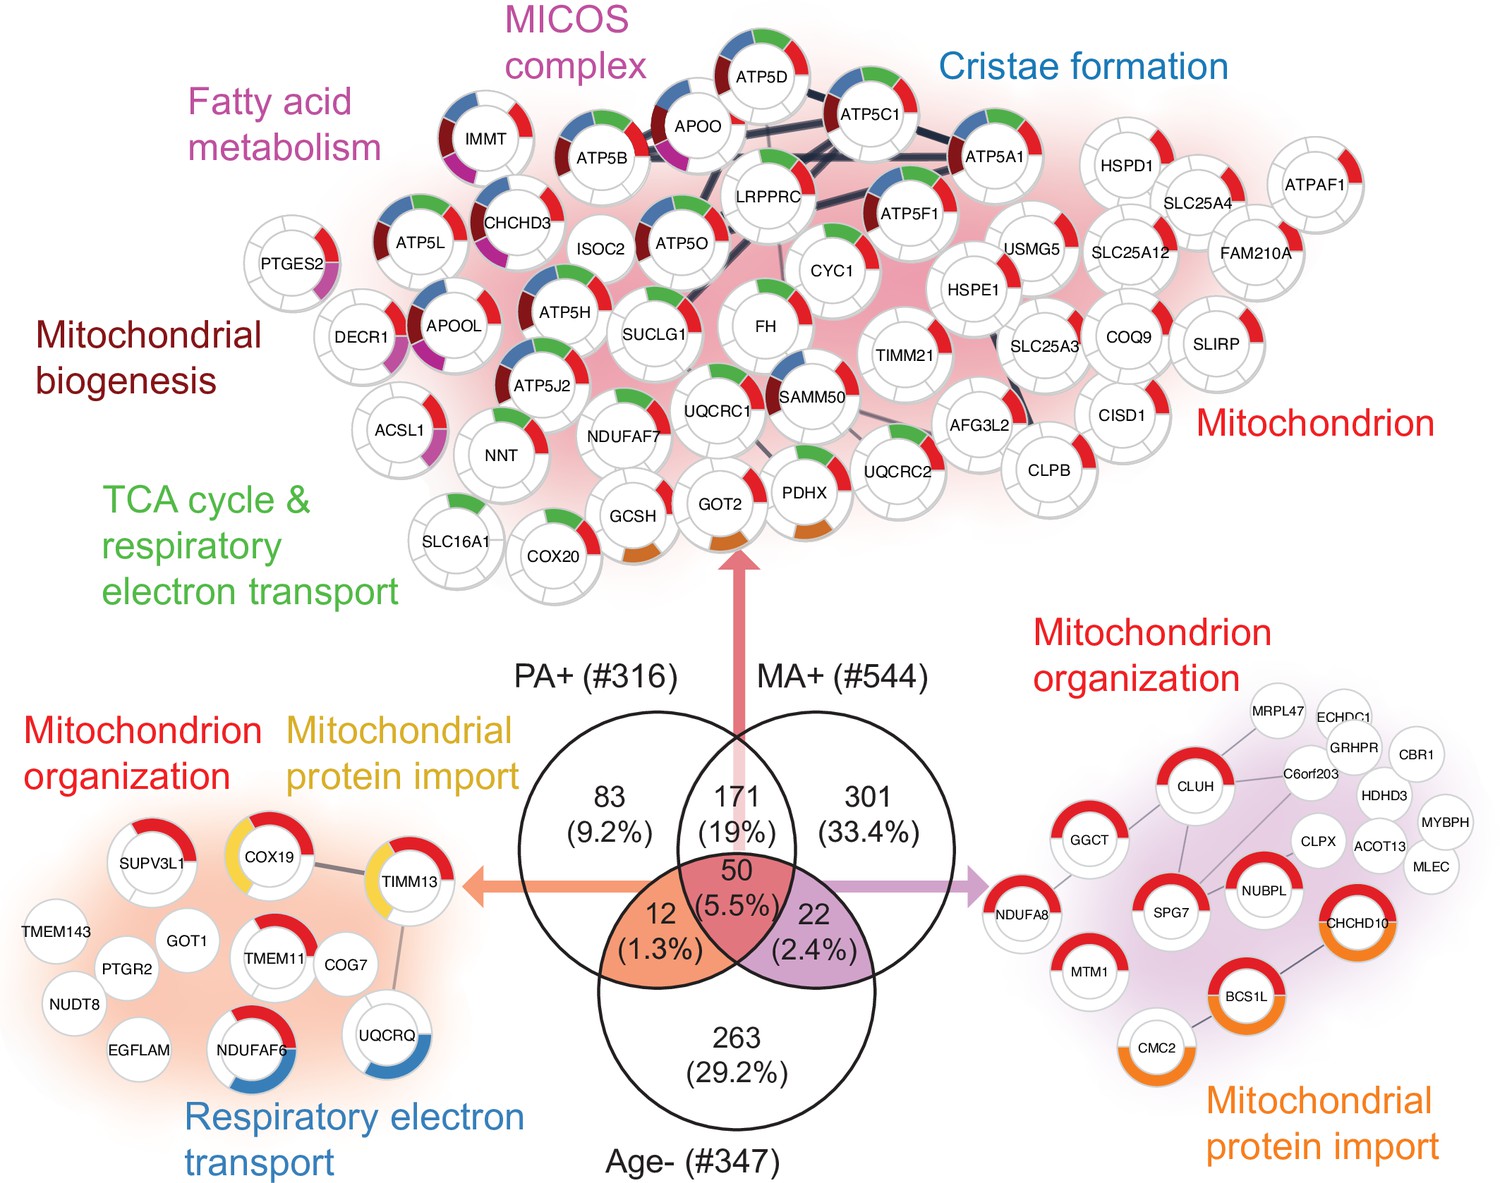
Aging proteins countered by physical activity (PA) and master athletes (MA).
Proteins that decline with aging but are antagonized in physically active subjects (GESTALT, n = 58) and MA group. Enriched pathways from 50 proteins that increase with PA and MA and decrease with Age are shown (top), and pathways from 12 proteins are are in common between PA and Age (left) and enriched pathways from 22 proteins that are in common between MA and Age (right). Top enriched pathways are color coded (significance threshold false discovery rate [FDR] < 0.05). Proteins without interaction partners are omitted from visualization.
-
Figure 5—source data 1
Baseline characteristics of the GESTALT skeletal muscle participants.
The participants are classified into five different age groups. Gender: the number of donors is represented in numeric, M is male, F is female. Age in years as mean and standard deviation (SD±) for each age group. Race: number of donors is shown in left and race is shown in italics, C is Caucasian, AA is African American, and A is Asian. Body mass index (BMI) expressed as mean and SD (±) for each group. p-Value is calculated by one-way ANOVA with Kruskal–Wallis test. *p-Value calculated from linear regression model, gender adjusted. ± knee extension isokinetic strength (KEIS) (300/s; Nm). †Physical activity is calculated from the sum of weight circuit, vigorous exercise, brisk walking and casual walking, and summed as high-intensity physical activity per week. This is further categorized into 0 (not active), 1 (moderately active), 2 (active), and 3 (highly active) and expressed as mean of categorical variables (0, 1, 2, 3) ± SD.
- https://cdn.elifesciences.org/articles/74335/elife-74335-fig5-data1-v2.zip
Figure 6
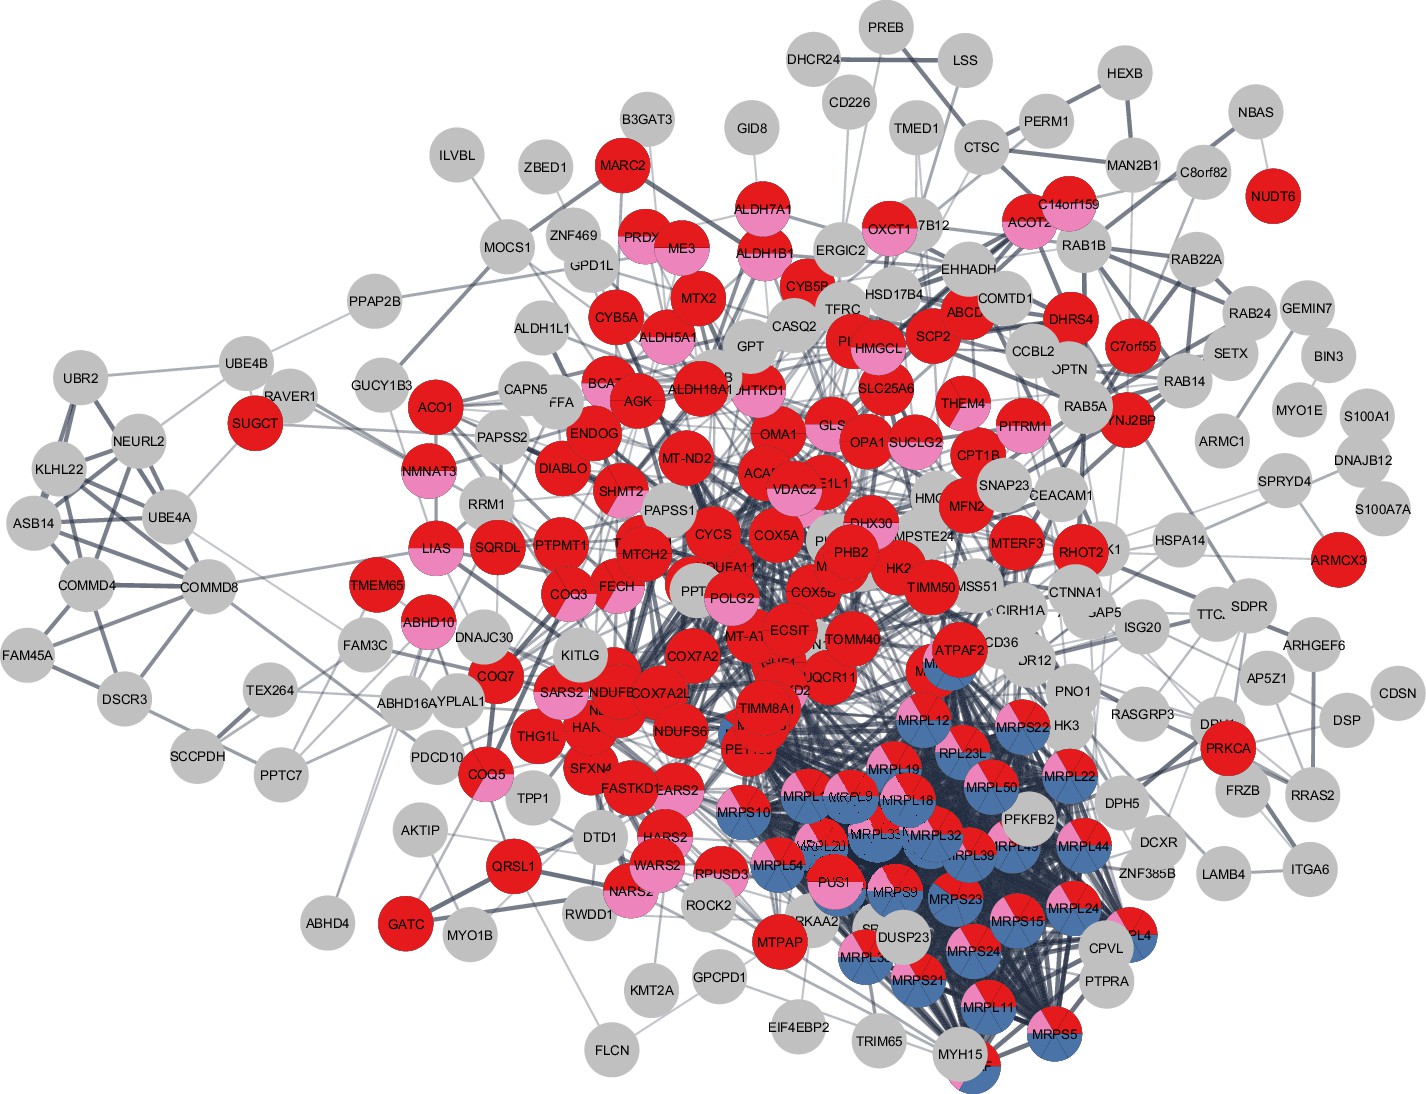
Master athletes (MA)-exclusive overrepresented proteins.
The subset of 301 MA+ proteome represents clusters of mitochondrial translation pathway enrichment (blue circles, 36 proteins), mitochondrial inner membrane (red circles, 75 proteins), and mitochondrial matrix proteins (pink, 65 proteins). Mitochondrial translation pathway proteins are localized either as inner membrane proteins or as matrix proteins. Each circle node is a protein exclusive to MA from (MA+, PA+, and Age-) analysis, Nodes without any interaction are excluded from the enrichment analysis.
Figure 7
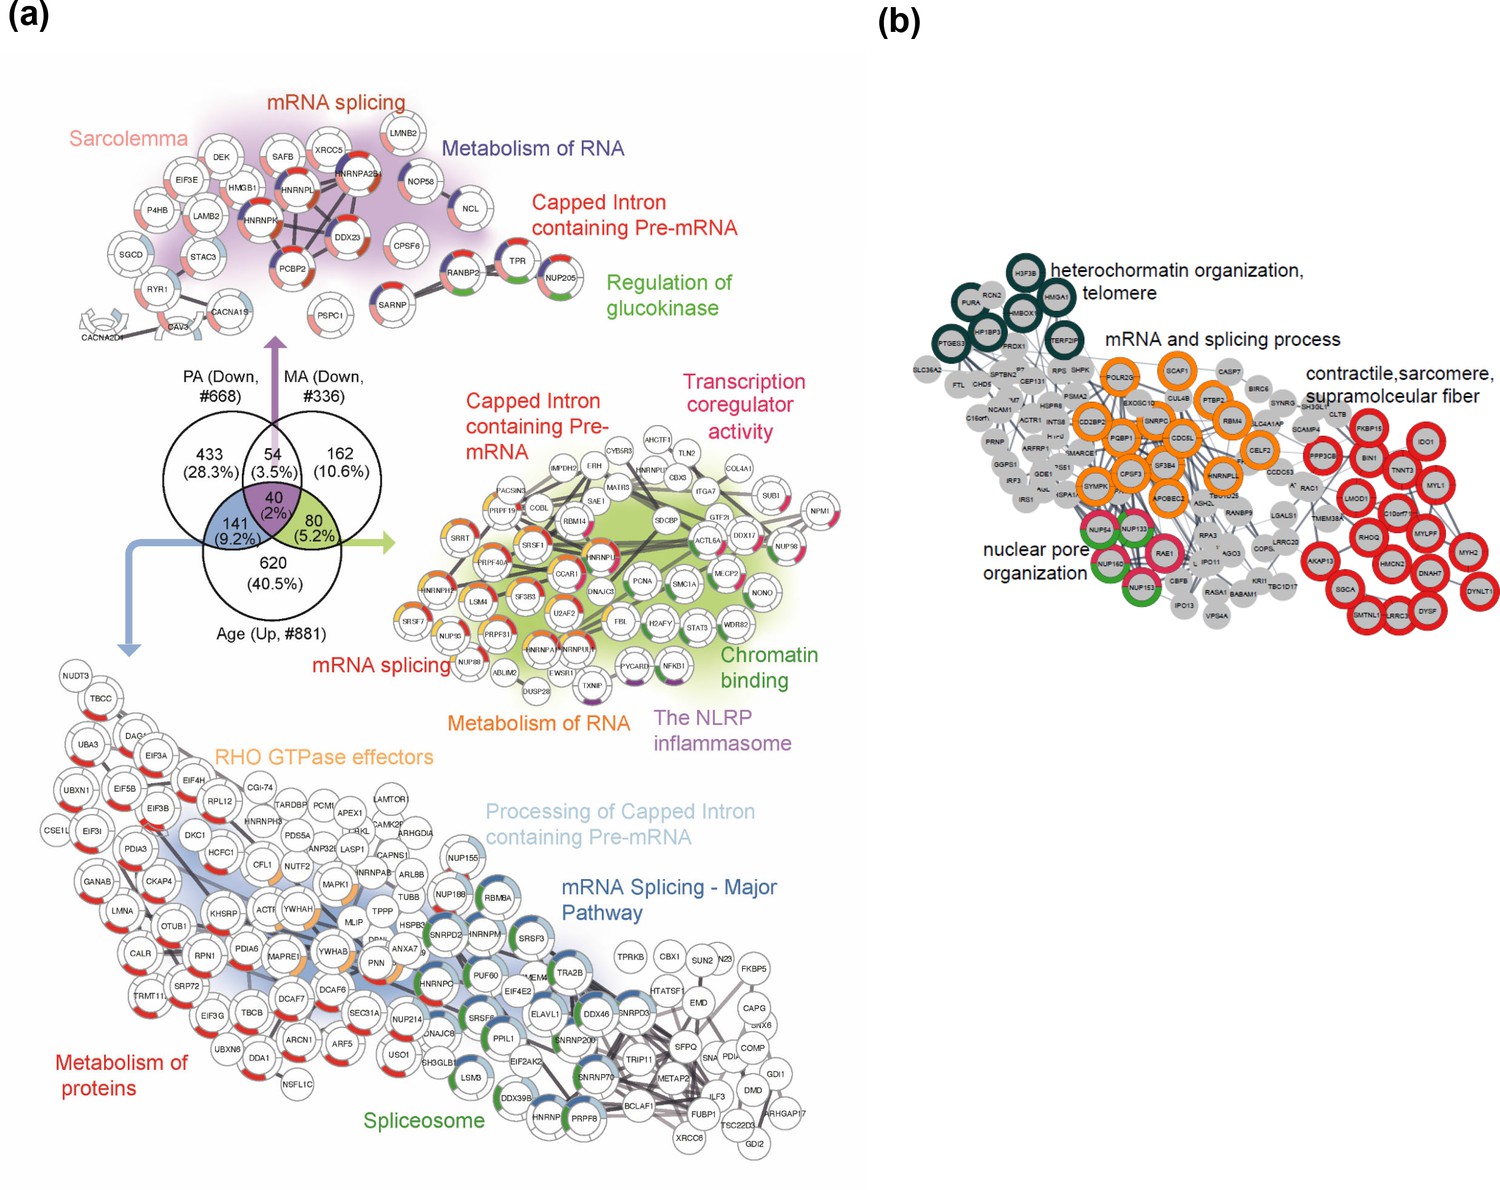
Master athletes (MA)-exclusive underrepresented proteins.
(a) Proteins that increase with aging but are antagonized in physically active subjects (GESTALT, n = 58) and MA group. Enriched pathways from 40 proteins that decrease with PA and MA and increase with Age are shown (top), and pathways from 141 proteins that are in common between PA and Age (left) and enriched pathways from 80 proteins that are in common between MA and Age (right) are shown. Network analysis and enrichment analysis are performed using STRING analysis tool; the top enriched pathways are color coded (p<0.05). Proteins without interaction partners are omitted from visualization. (b) The subset of 162 MA- proteome represents cluster of chromatin organization, nuclear pore, mRNA splicing process, and contractile fiber proteins. This cluster of proteins appear unrelated to physical activity and may reflect unique biology in the MA group. Protein-protein interaction pathways and GO cellular components shown here are significantly enriched (p<1.0e-16).
Tables
Table 1
Characteristics of non-athletes (NA) and master athletes (MA).
| NA (n = 14) | MA (n = 15) | p-Value | |
|---|---|---|---|
| Age (years) | 80.9 ± 4.5 | 80.1 ± 4.8 | |
| Sex | |||
| Male | 7 | 7 | |
| Female | 8 | 8 | |
| Body mass (kg) | 72.1 ± 11.4 | 62.2 ± 10.7 | 0.04 |
| Body fat (%) | 36.0 ± 6.6 | 21.9 ± 5.0 | <0.00 |
-
Values are mean ± SD.
Table 2
Training and competition history of octogenarian master athletes (MA).
| n | Age (years) | Training per week (hr) | Years competing | |
|---|---|---|---|---|
| Sprint, power | 8 (4F) | 79.9 ± 6.1 | 16 ± 3 | 16.6 ± 6.2 |
| Endurance | 7 (4F) | 80.3 ± 3.4 | 14 ± 3 | 26.6 ± 9.4 |
-
Values are mean ± SD.
Additional files
-
Transparent reporting form
- https://cdn.elifesciences.org/articles/74335/elife-74335-transrepform1-v2.pdf
-
Supplementary file 1
MA Protein List and Fold Change Statistics.
- https://cdn.elifesciences.org/articles/74335/elife-74335-supp1-v2.xlsx
-
Supplementary file 2
Underrepresented and Overrepresented Proteins in MA.
- https://cdn.elifesciences.org/articles/74335/elife-74335-supp2-v2.xlsx
-
Supplementary file 3
MA Exclusive Proteome.
- https://cdn.elifesciences.org/articles/74335/elife-74335-supp3-v2.xlsx
Download links
A two-part list of links to download the article, or parts of the article, in various formats.
Downloads (link to download the article as PDF)
Open citations (links to open the citations from this article in various online reference manager services)
Cite this article (links to download the citations from this article in formats compatible with various reference manager tools)
Unbiased proteomics, histochemistry, and mitochondrial DNA copy number reveal better mitochondrial health in muscle of high-functioning octogenarians
eLife 11:e74335.
https://doi.org/10.7554/eLife.74335


