Endoplasmic reticulum stress activates human IRE1α through reversible assembly of inactive dimers into small oligomers
- Department of Biochemistry and Biophysics, University of California, San Francisco, United States
- Cancer Immunology, Genentech, Inc, United States
- Howard Hughes Medical Institute, University of California, San Francisco, United States
Figures
Figure 1 with 3 supplements
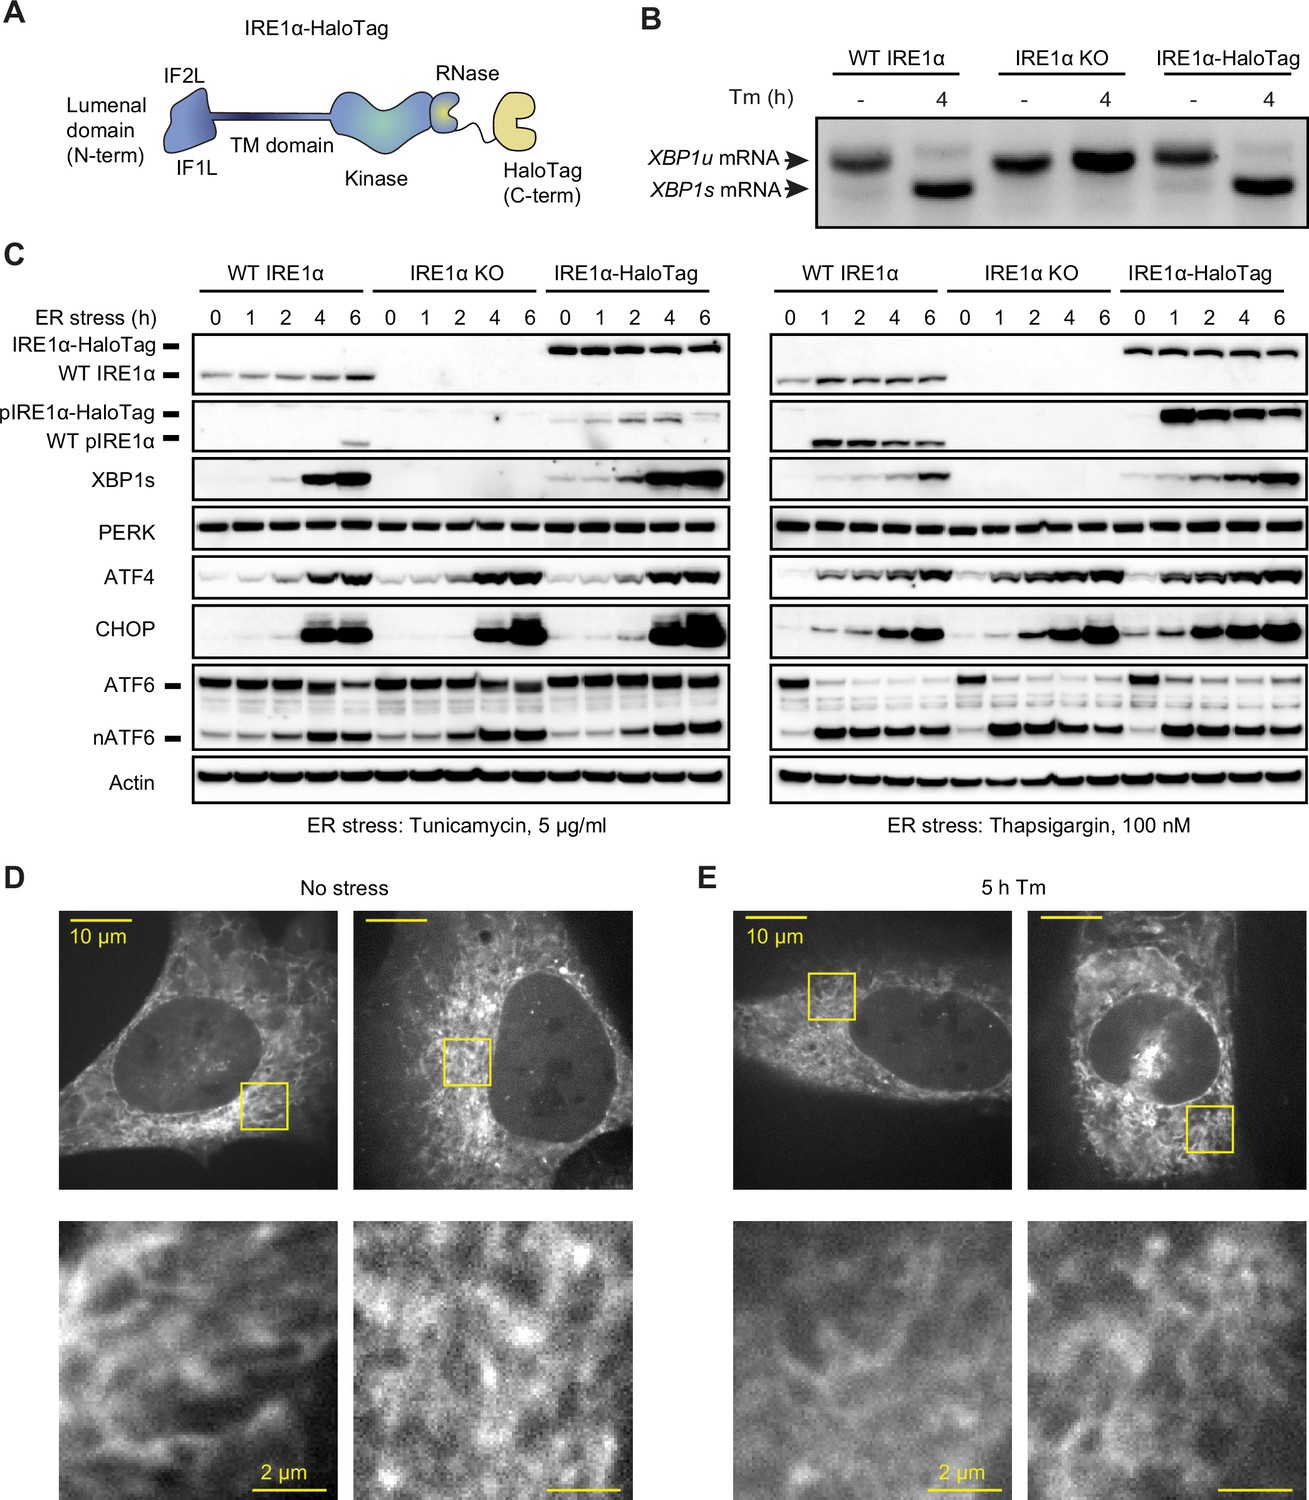
Endogenously tagged IRE1α is fully active despite not forming large clusters.
(A) Schematic representation of IRE1 with a C-terminal HaloTag, the construct used for tagging IRE1 at the endogenous locus. IF1L and IF2L refer to the primary dimerization and oligomerization interfaces of the lumenal domain, respectively. (B) RT-PCR analysis of stress-dependent XBP1 mRNA splicing in WT U-2 OS cells, IRE1 knock-out (KO) U-2 OS cells, and U-2 OS cells in which IRE1 has been fully edited with a C-terminal HaloTag. Tm indicates treatment with 5 μg/ml tunicamycin. (C) Immunoblot of UPR activation in response to 5 μg /ml tunicamycin (left) and 100 nM thapsigargin (right) treatments in the three cell lines shown in panel B. (D) Maximum intensity projections of representative spinning-disk confocal images of live cells expressing endogenously tagged IRE1-HaloTag, labeled with the JF549 dye. Regions shown with yellow boxes are enlarged below. (E) Same as D, except the cells have been treated with 5 μg/ml tunicamycin for 5 hr.
-
Figure 1—source data 1
Annotated uncropped gel used to generate Figure 1B.
- https://cdn.elifesciences.org/articles/74342/elife-74342-fig1-data1-v1.zip
-
Figure 1—source data 2
Raw uncropped gel used to generate Figure 1B.
- https://cdn.elifesciences.org/articles/74342/elife-74342-fig1-data2-v1.zip
-
Figure 1—source data 3
All annotated uncropped gels used to generate Figure 1C.
- https://cdn.elifesciences.org/articles/74342/elife-74342-fig1-data3-v1.zip
-
Figure 1—source data 4
Raw uncropped gel of immunoblot against IRE1 and phospho-IRE1 in Figure 1C.
- https://cdn.elifesciences.org/articles/74342/elife-74342-fig1-data4-v1.zip
-
Figure 1—source data 5
Raw uncropped gel of immunoblot against XBP1 in Figure 1C.
- https://cdn.elifesciences.org/articles/74342/elife-74342-fig1-data5-v1.zip
-
Figure 1—source data 6
Raw uncropped gel of immunoblot against PERK and actin in Figure 1C.
- https://cdn.elifesciences.org/articles/74342/elife-74342-fig1-data6-v1.zip
-
Figure 1—source data 7
Raw uncropped gel of immunoblot against ATF4 in Figure 1C.
- https://cdn.elifesciences.org/articles/74342/elife-74342-fig1-data7-v1.zip
-
Figure 1—source data 8
Raw uncropped gel of immunoblot against ATF6 in Figure 1C.
- https://cdn.elifesciences.org/articles/74342/elife-74342-fig1-data8-v1.zip
-
Figure 1—source data 9
Raw uncropped gel of immunoblot against CHOP in Figure 1C.
- https://cdn.elifesciences.org/articles/74342/elife-74342-fig1-data9-v1.zip
Figure 1—figure supplement 1
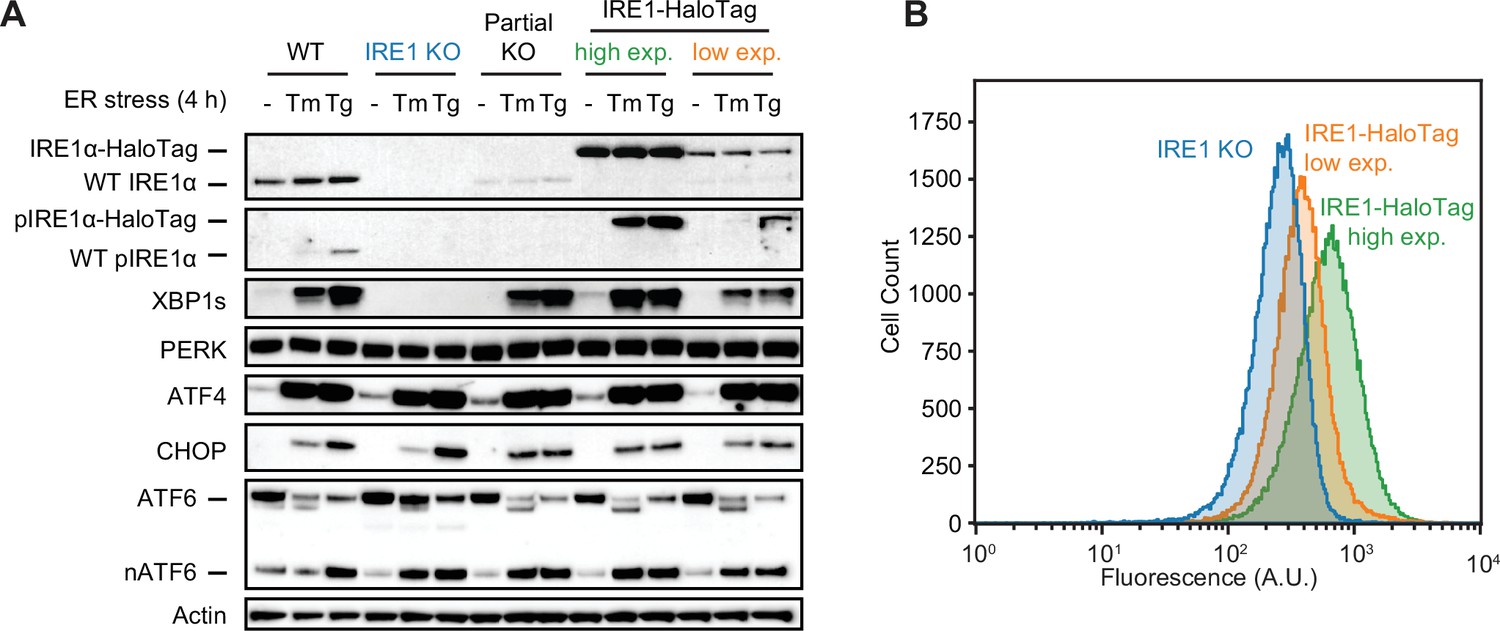
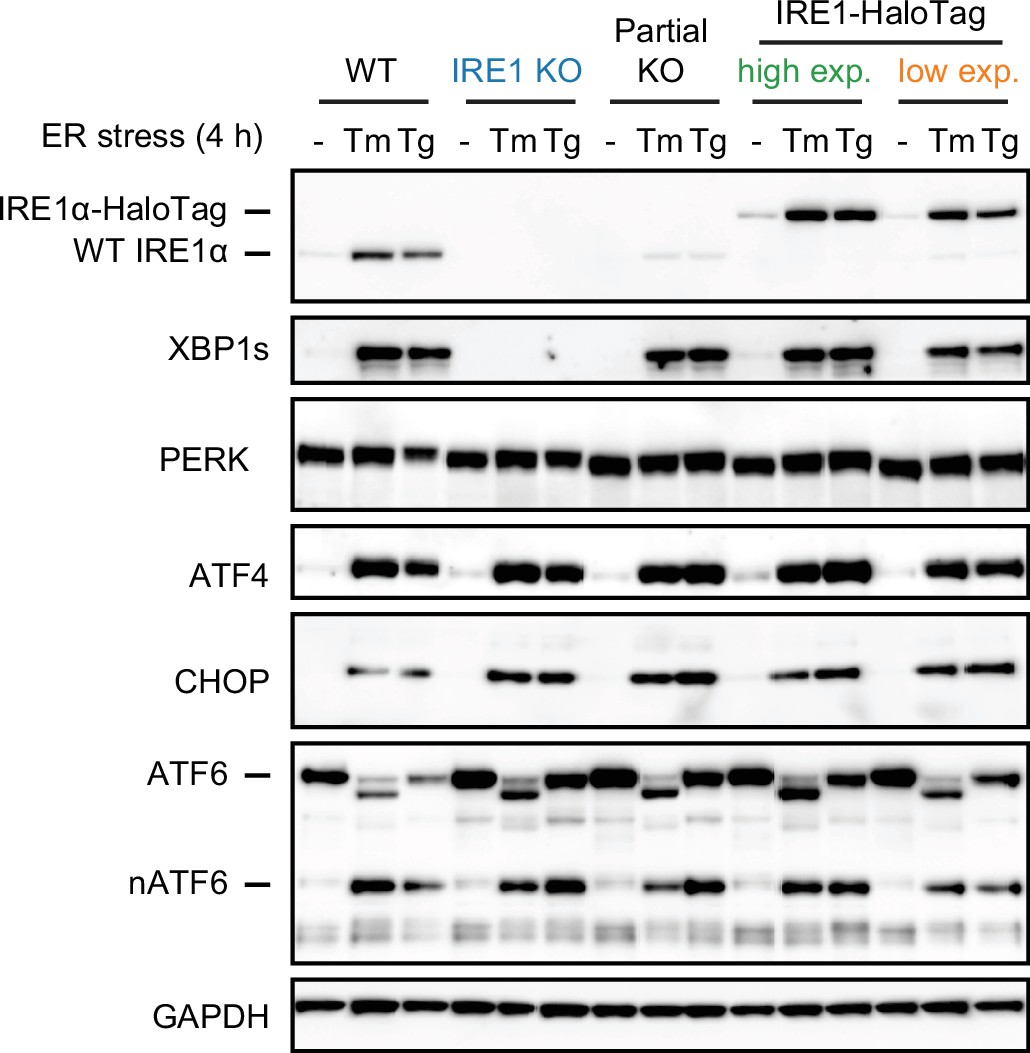
Comparison of high- and low-expression clones.
(A) Immunoblot showing IRE1 expression levels and UPR activation in WT U-2 OS cells, IRE1 KO U-2 OS cells, partial KO cells used as the parental cell line for generating HaloTag knock-ins, and two clones of endogenously labeled HaloTag (with high and low IRE1 expression levels). Note the shift in protein size due to the addition of the HaloTag and the absence of a WT IRE1 band in the two clones on the right. (B) Flow cytometry analysis of the low-and high-expressing clones shown in panel A. Cells were labeled with 5 nM JF549-HaloTag dye for 1 hr prior to the start of the flow cytometry experiment. Note the unimodal intensity distributions of both clones, ruling out the possibility that the lower-expressing clone simply contains a bimodal mixture of low- and high-expressing cells. Error bars represent 95% confidence intervals.
-
Figure 1—figure supplement 1—source data 1
Annotated uncropped gel used to generate Figure 1—figure supplement 1A and C.
- https://cdn.elifesciences.org/articles/74342/elife-74342-fig1-figsupp1-data1-v1.zip
-
Figure 1—figure supplement 1—source data 2
Raw uncropped gel of immunoblot against IRE1 and phospho-IRE1 in Figure 1—figure supplement 1A.
- https://cdn.elifesciences.org/articles/74342/elife-74342-fig1-figsupp1-data2-v1.zip
-
Figure 1—figure supplement 1—source data 3
Raw uncropped gel of immunoblot against XBP1 in Figure 1—figure supplement 1A.
- https://cdn.elifesciences.org/articles/74342/elife-74342-fig1-figsupp1-data3-v1.zip
-
Figure 1—figure supplement 1—source data 4
Raw uncropped gel of immunoblot against PERK in Figure 1—figure supplement 1A.
- https://cdn.elifesciences.org/articles/74342/elife-74342-fig1-figsupp1-data4-v1.zip
-
Figure 1—figure supplement 1—source data 5
Raw uncropped gel of immunoblot against ATF4 and CHOP in Figure 1—figure supplement 1A.
- https://cdn.elifesciences.org/articles/74342/elife-74342-fig1-figsupp1-data5-v1.zip
-
Figure 1—figure supplement 1—source data 6
Raw uncropped gel of immunoblot against ATF6 in Figure 1—figure supplement 1A.
- https://cdn.elifesciences.org/articles/74342/elife-74342-fig1-figsupp1-data6-v1.zip
-
Figure 1—figure supplement 1—source data 7
Raw uncropped gel of immunoblot against actin in Figure 1—figure supplement 1A.
- https://cdn.elifesciences.org/articles/74342/elife-74342-fig1-figsupp1-data7-v1.zip
Figure 1—figure supplement 2
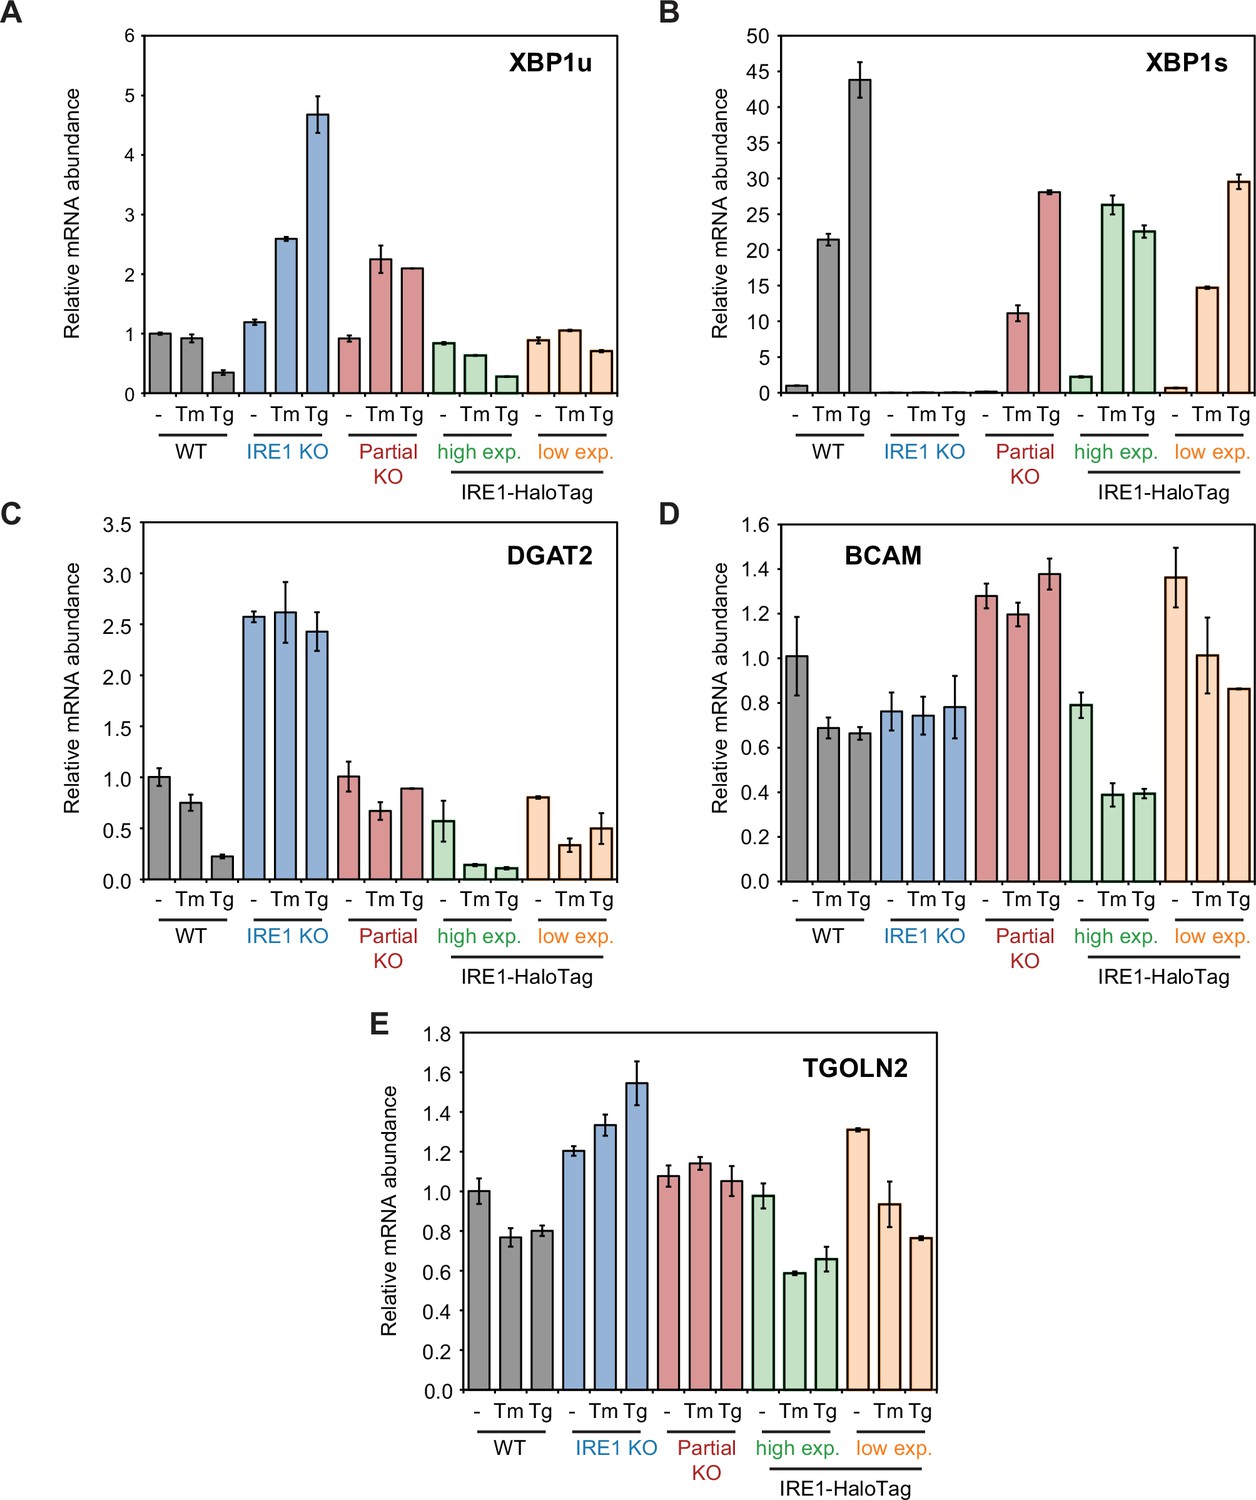
qPCR analysis of of XBP1 splicing, RIDD, and RIDDLE activity in IRE1-HaloTag cells.
Relative abundance of XBP1u (A), XBP1s (B), DGAT2 (C), BCAM (D) and TGOLN2 (E) mRNA. HPRT1 mRNA expression was used as housekeeping gene. All values are normalized to the amount of mRNA present in unstressed WT cells.
Figure 1—figure supplement 3
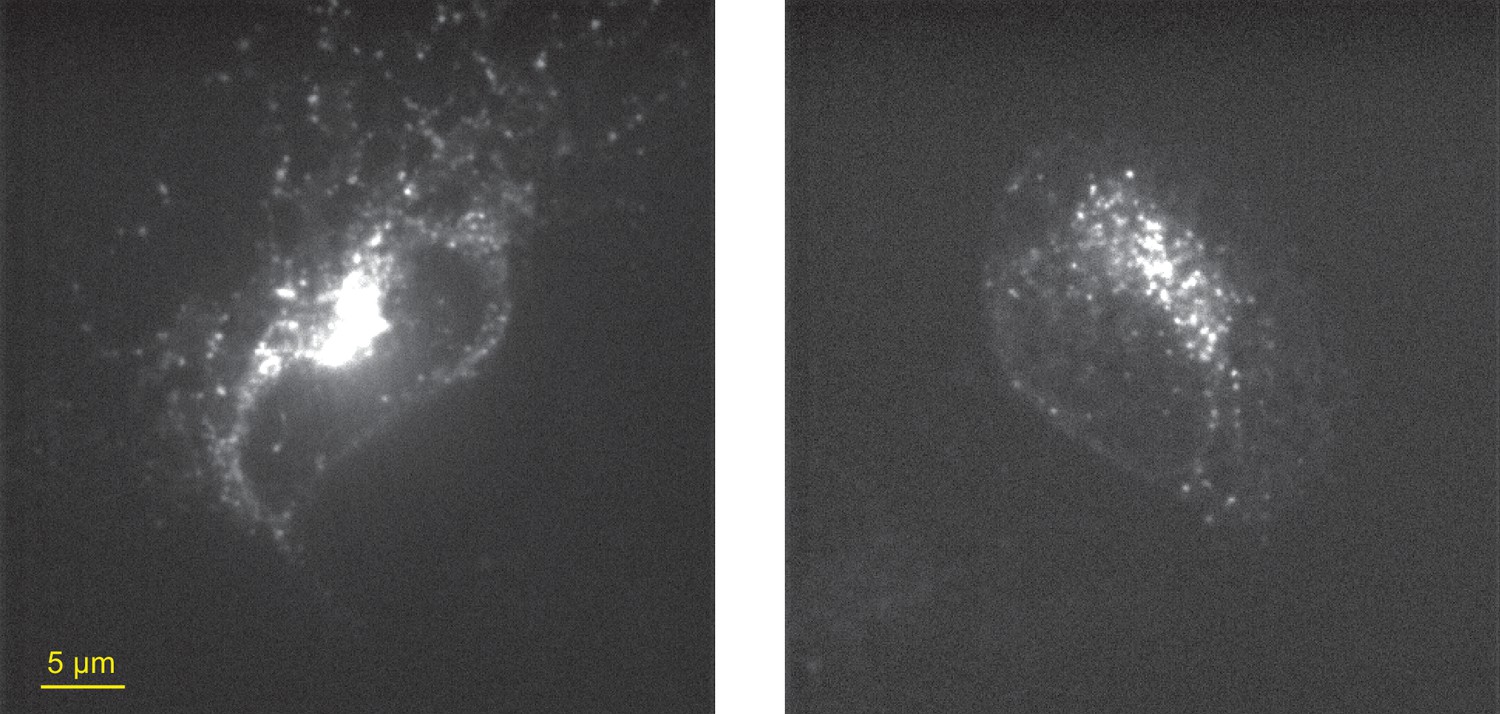
Examples of stress-induced clustering of IRE1-HaloTag in the context of overexpression.
Representative confocal microscopy images of IRE1 KO U-2 OS cells transiently transfected with IRE1-HaloTag (the same construct used throughout this study) and treated with 5 µg/ml tunicamycin for 4 hr. Expression levels following transient transfections are highly variable, and cells expressing visibly high amounts of IRE1-HaloTag readily form clusters detectable by confocal microscopy in response to pharmacologically induced ER stress.
Figure 2 with 3 supplements

Single-particle tracking approach for detection of small oligomers.
(A) Schematic depiction of the assay. Cells expressing low levels of HaloTag-conjugated proteins are labeled with a mixture of HaloTag-conjugated dyes and imaged by oblique angle illumination. (B) Principle behind the analysis of single-particle data. Fluorescent spots are independently tracked in two channels, and correlated trajectories are identified computationally. (C) Design of the 1 x and 2 x HaloTag controls. (D) Representative frame from a movie of a cell expressing an ER-tethered 2 x tandem HaloTag and labeled with a mixture of JF549 (cyan) and JF646 (red) dyes. (E) Several frames of the boxed region in panel D, with co-localizing spots identified with arrows. (F) Percentage of correlated trajectories from cells expressing the 1 x and 2 x HaloTag controls, comparing data collected in 10 independent experimental replicates. Each data point represents a single cell, typically comprising several hundred trajectories. Error bars represent 95% confidence intervals.
-
Figure 2—source data 1
Pairwise significance test values (permutation test with 10,000 iterations and two-tailed t-test) for conditions plotted in Figure 2F.
- https://cdn.elifesciences.org/articles/74342/elife-74342-fig2-data1-v1.xlsx
Figure 2—figure supplement 1
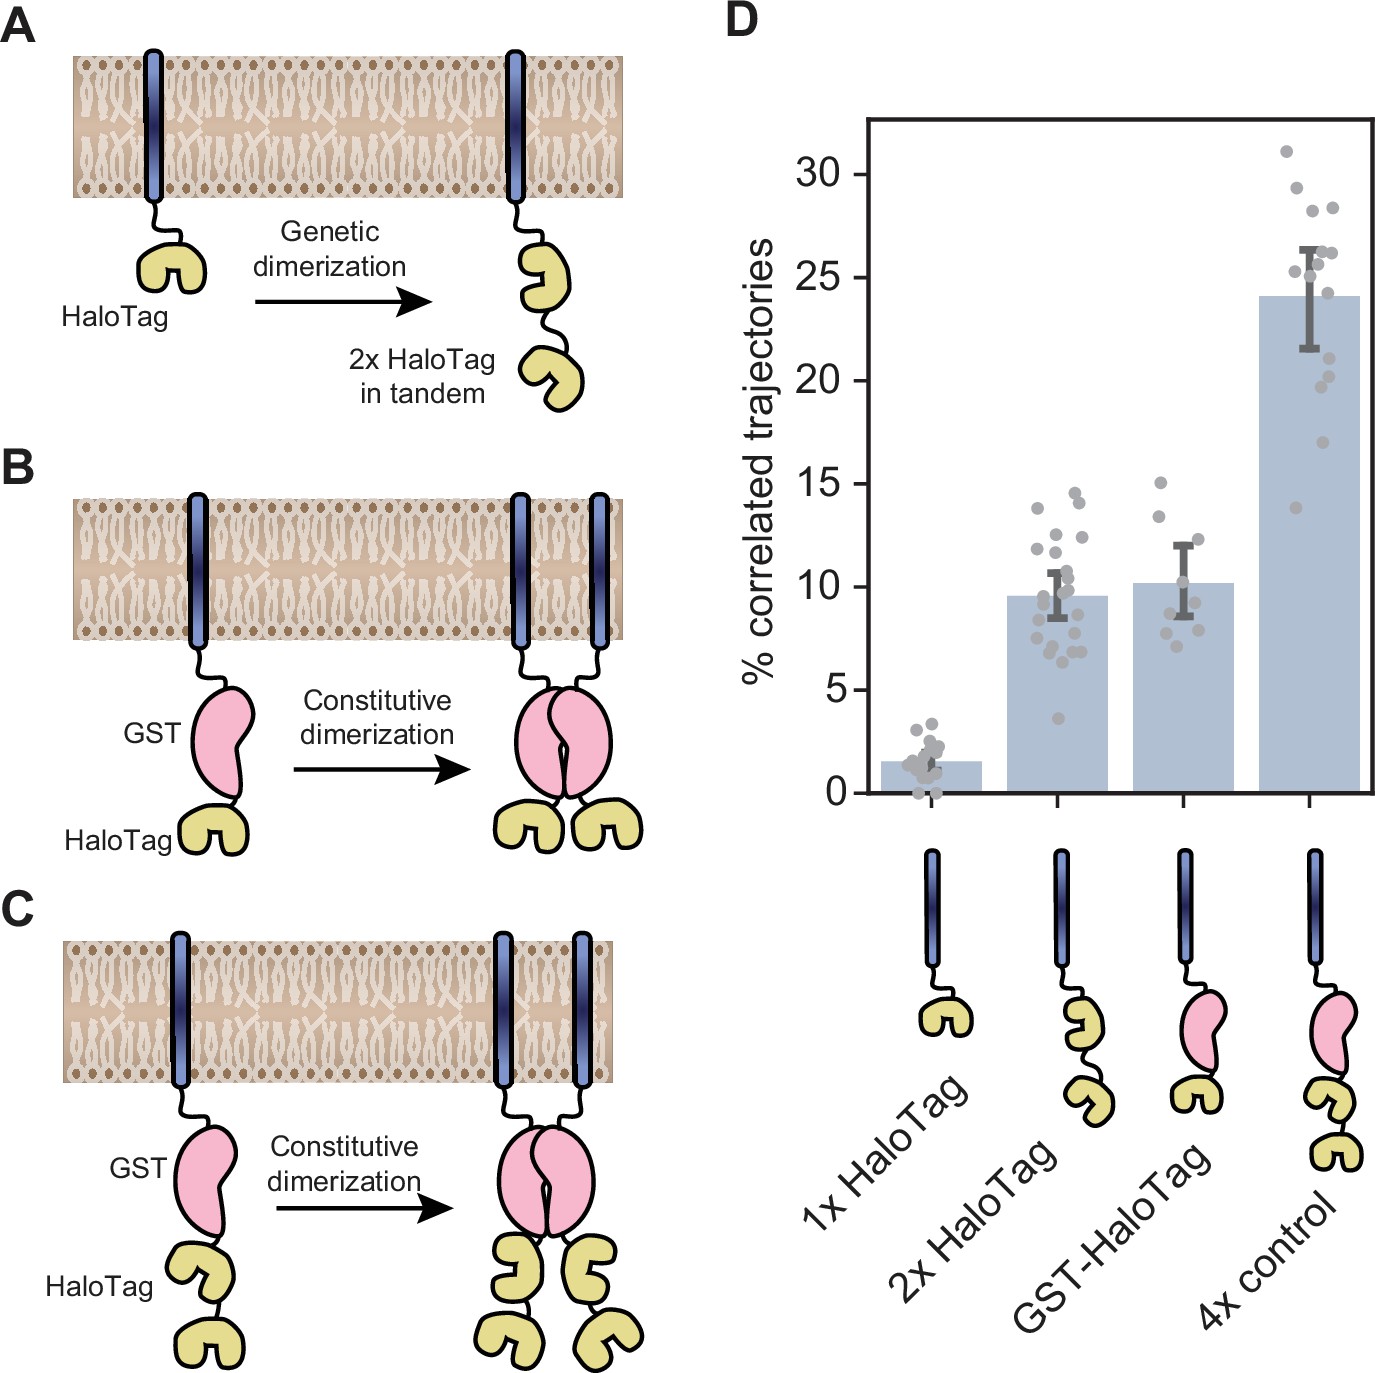
Orthogonal oligomerization controls.
(A) Schematic representation of the genetic dimerization strategy used as a primary control throughout the manuscript. A dual-HaloTag construct is engineered by fusing two HaloTag proteins in tandem, separated by a flexible GS linker, to the C-terminus of a single transmembrane helix targeted to the ER membrane. (B) Orthogonal dimerization control used to rule out the possibility that the internal and C-terminal HaloTags of the construct shown in panel A may have different labeling efficiencies. In this control, ER membrane-tethered HaloTag proteins assemble into constitutive dimers via an internal GST tag. (C) Tetramerization control created by combining the genetic and constitutive dimerization approaches (D) Single-particle tracking results comparing the fraction of correlated trajectories for the constructs shown in panels A, B, and C. Each data point represents a single cell. Error bars represent 95% confidence intervals.
-
Figure 2—figure supplement 1—source data 1
Pairwise significance test values (permutation test with 10,000 iterations and two-tailed t-test) for all plotted conditions.
- https://cdn.elifesciences.org/articles/74342/elife-74342-fig2-figsupp1-data1-v1.xlsx
Figure 2—figure supplement 2
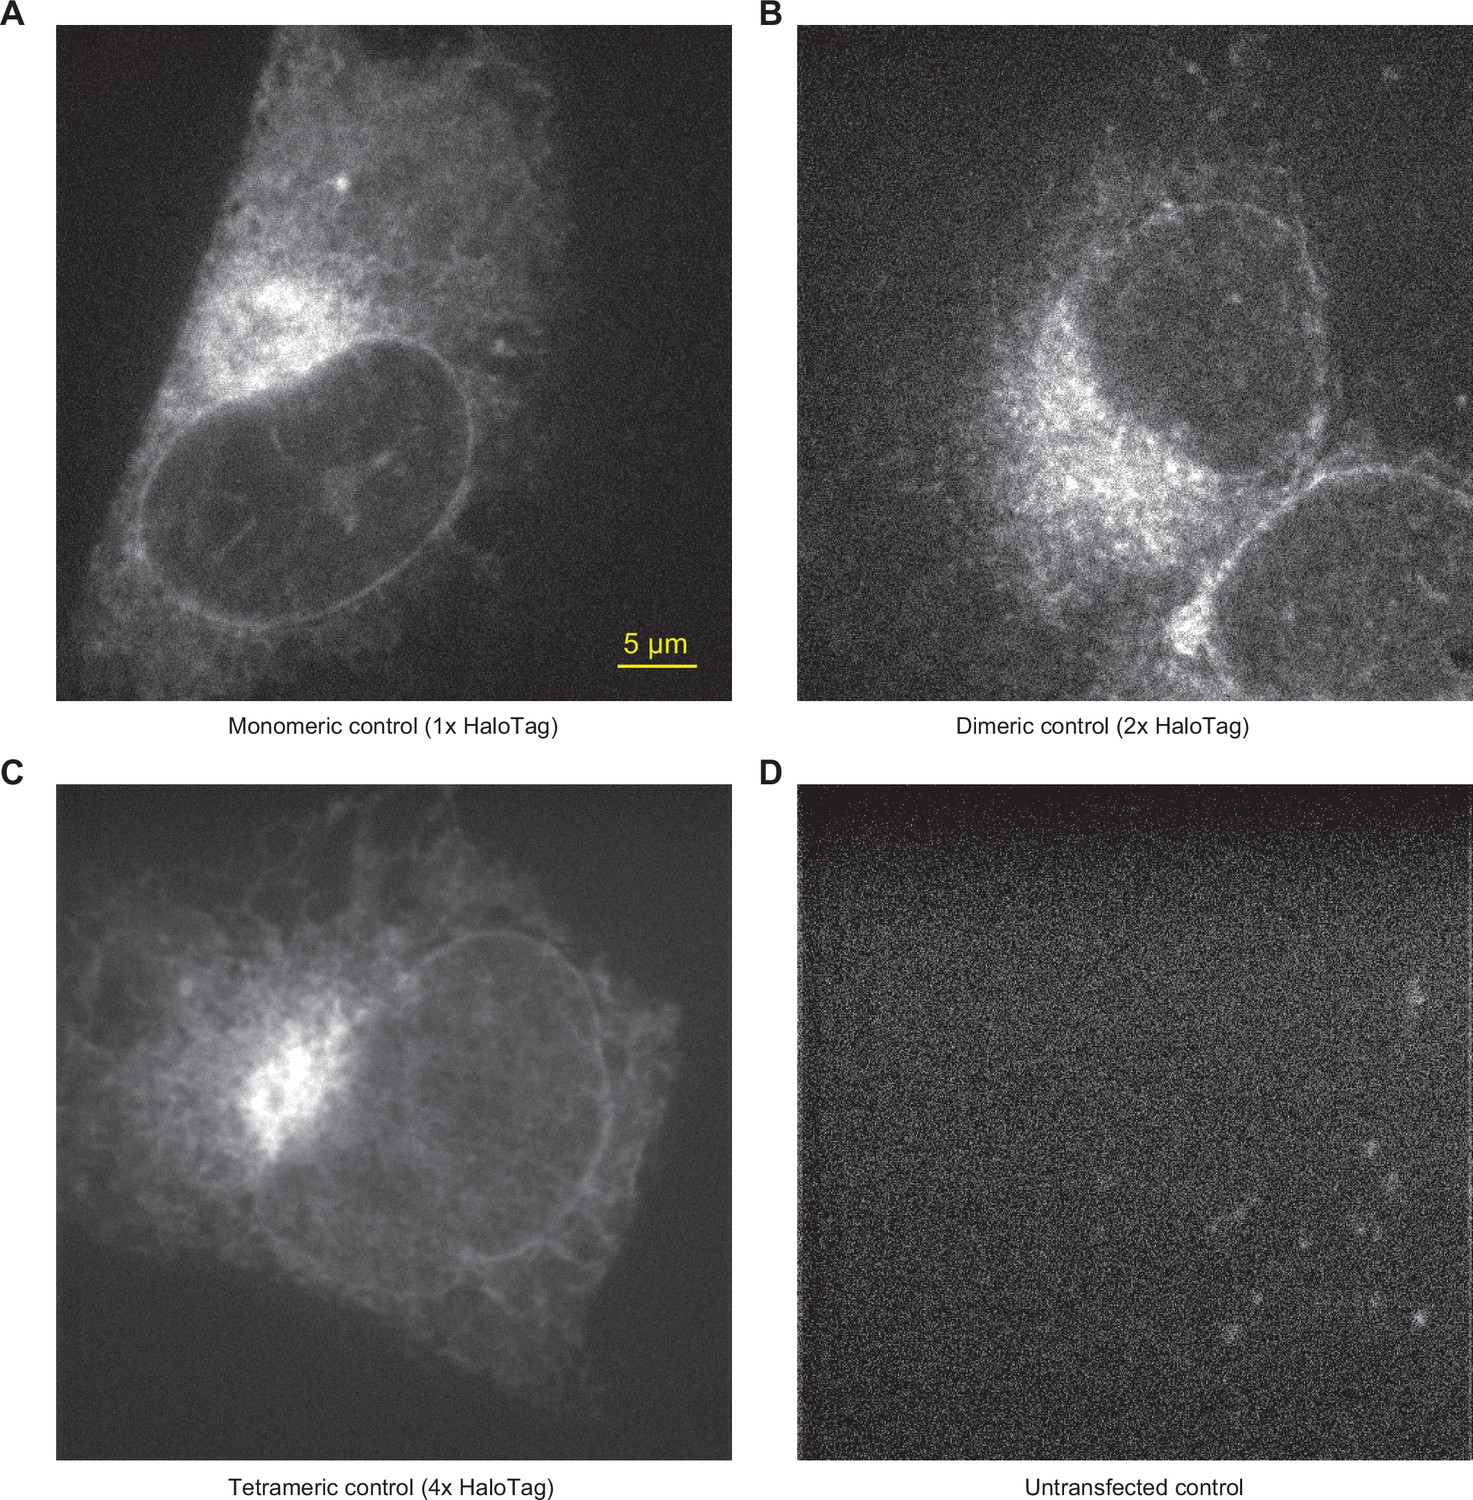
Confocal microscopy images of HaloTag controls.
Representative IRE1 KO cells transiently transfected with the 1 x HaloTag control (A), 2 x HaloTag control (B), 4 x HaloTag control (C), and untransfected (D), labeled with JF549 and JF646 dyes and imaged by spinning-disk confocal microscopy in the JF549 channel. Note the faint ‘clusters’ visible in the untransfected cell in panel D; these are common and illustrate the autofluorescent background that contributes to small apparent ‘clusters’ in cells expressing HaloTag controls of IRE1-HaloTag.
Figure 2—figure supplement 3
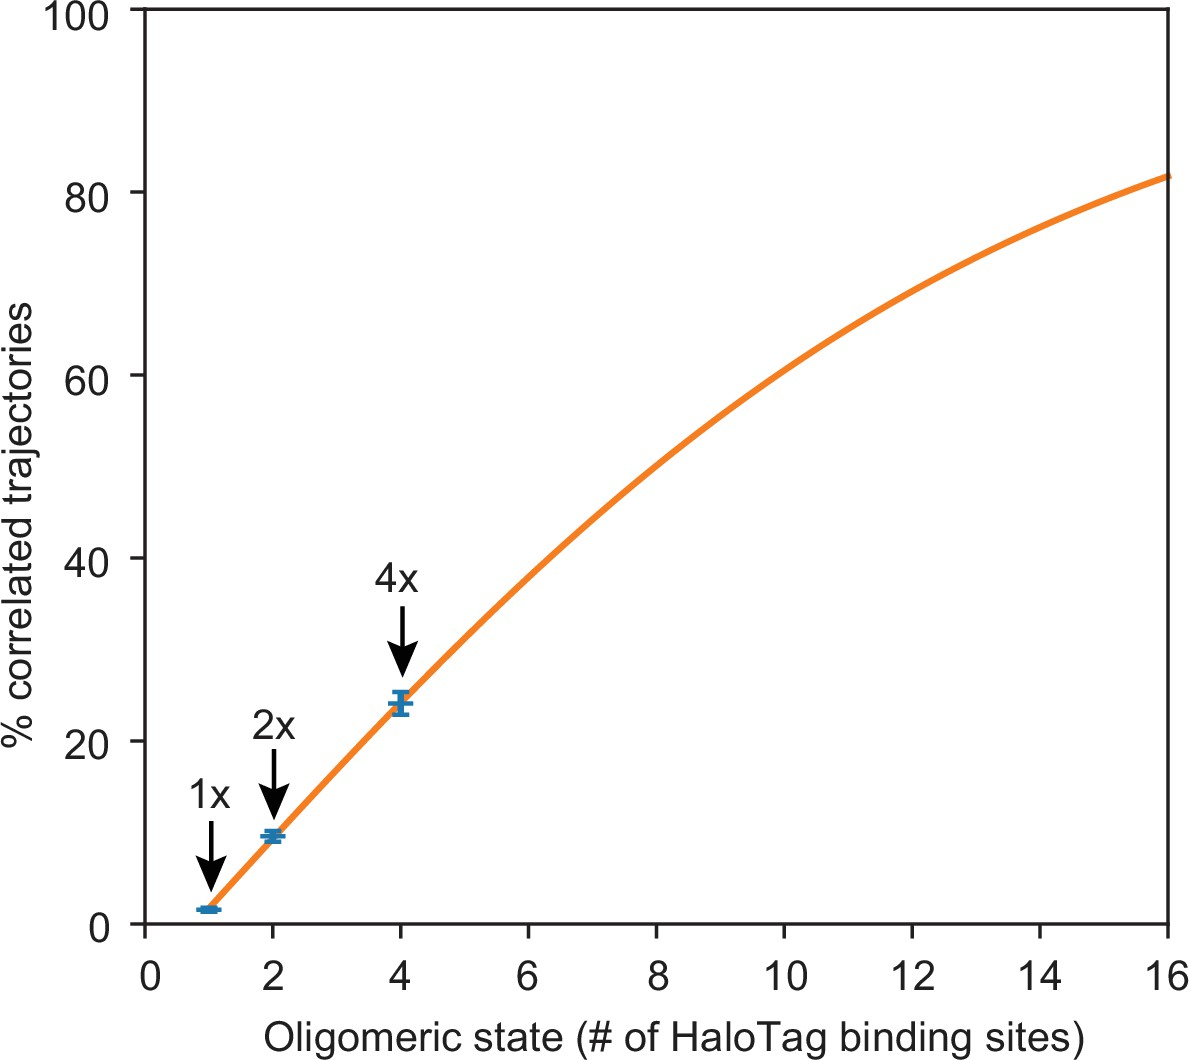
Model for fraction of observed % correlated trajectories as a function of true oligomeric state.
Data points represent mean observed values for % correlated trajectories from monomeric (1 x), dimeric (2 x), and tetrameric (4 x) HaloTag control constructs. Error bars represent standard errors of the mean. The orange line is a fit of the model equation to the three data points shown (refer to “Estimation of IRE1 cluster stoichiometry” section of Materials and methods).
Figure 3 with 3 supplements
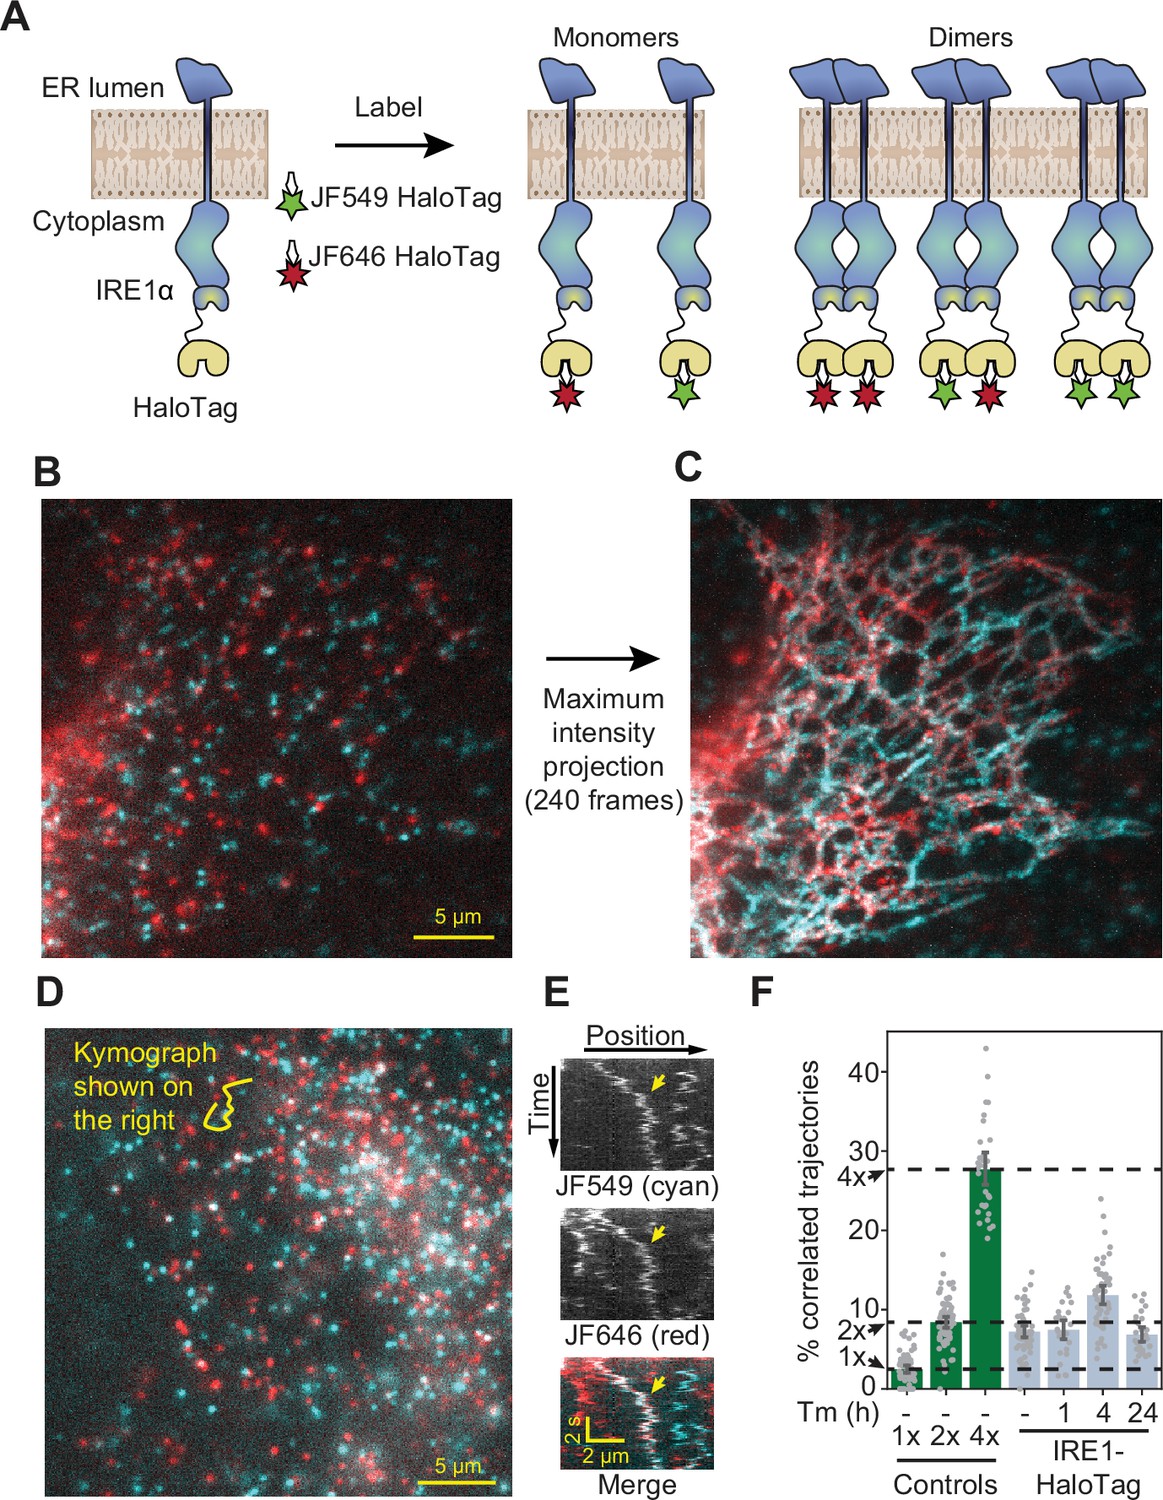
Detection of IRE1 dimers and oligomers in live cells.
(A) Schematic depiction of the assay. IRE1-HaloTag is simultaneously labeled with HaloTag dyes of two different colors, JF549 and JF646. If the protein is purely monomeric, all single-molecule tracks are expected to be either one color or the other. If it is purely dimeric, a fraction of tracks will contain both colors. Such dual-color tracks can then be identified as correlated trajectories. (B) Single frame from a long-exposure movie (100ms per frame) of a cell in which IRE1-HaloTag is labeled with a mixture of JF549 (cyan) and JF646 (red) dyes. (C) Maximum intensity projection of the entire movie from panel B showing that single IRE1 molecules diffuse along ER tubules. (D) Single frame from a short-exposure movie (50ms per frame) of a cell in which IRE1-HaloTag is labeled with a mixture of JF549 (cyan) and JF646 (red) dyes. (E) Kymograph (time vs. position plot) along the line shown in panel D. Co-localizing diffusional IRE1 trajectory is shown with a yellow arrow. (F) Stress-induced changes in IRE1 oligomerization in response to treatment with 5 μg/ml tunicamycin (Tm), as quantified by the fraction of correlated trajectories. Green bars on the left correspond to the 1 x, 2 x, and 4 x HaloTag controls, respectively. Error bars represent 95% confidence intervals.
-
Figure 3—source data 1
Pairwise significance test values (permutation test with 10,000 iterations and two-tailed t-test) for conditions plotted in Figure 3F.
- https://cdn.elifesciences.org/articles/74342/elife-74342-fig3-data1-v1.xlsx
Figure 3—figure supplement 1
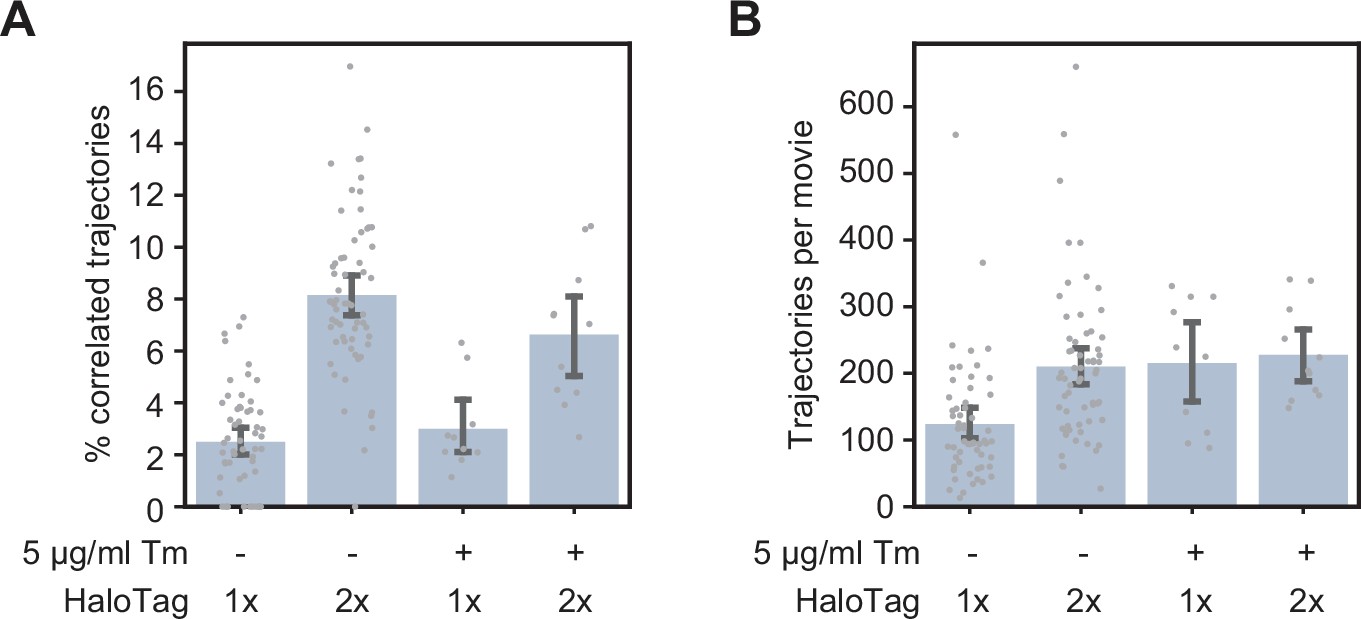
Effect of ER stress on HaloTag controls.
(A) Single-particle tracking data showing the fraction of correlated trajectories for the 1 x and 2 x HaloTag controls, with and without a 4-hr treatment with tunicamycin. (B) Number of trajectories per movie for the four conditions shown in panel A, demonstrating that the changes in % correlated trajectories are independent of construct expression levels. Each data point represents a single cell. Error bars represent 95% confidence intervals.
-
Figure 3—figure supplement 1—source data 1
Pairwise significance test values (permutation test with 10,000 iterations and two-tailed t-test) for all plotted conditions.
- https://cdn.elifesciences.org/articles/74342/elife-74342-fig3-figsupp1-data1-v1.xlsx
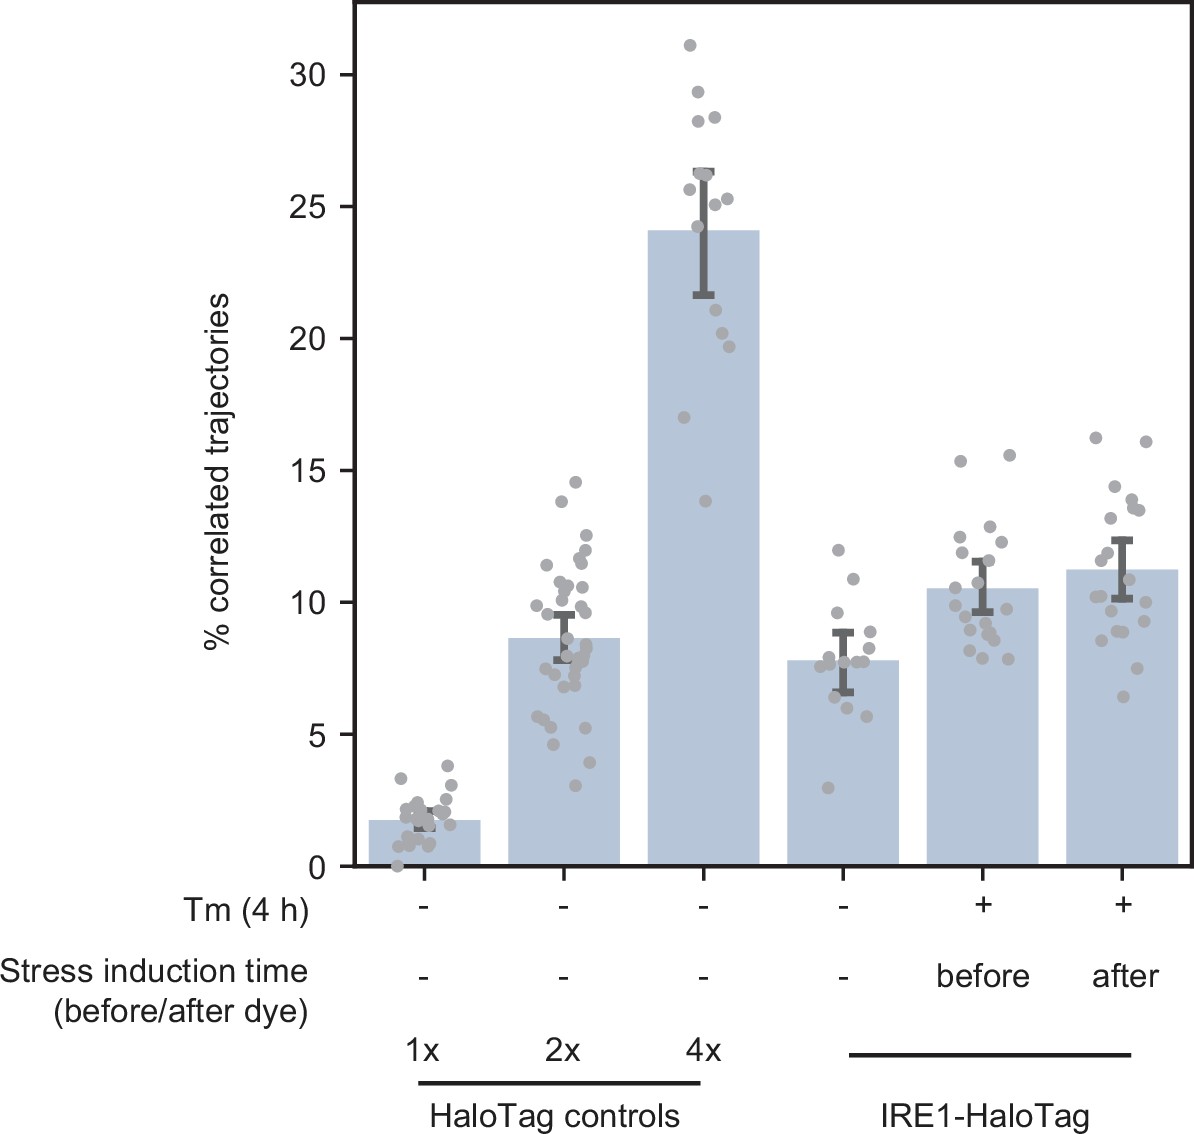
Figure 3—figure supplement 2
Effect of ER stress on the efficiency of HaloTag labeling.
Single-particle tracking data showing the fraction of correlated trajectories for the 1 x, 2 x, and 4 x HaloTag controls, as well as endogenously tagged IRE1-HaloTag cells with dye added at different times relative to the induction of ER stress. ‘Before’ indicates that cells were first treated with tunicamycin and then labeled with a mixture of JF549 and JF646 dyes, while ‘after’ indicates that cells were first labeled with the dye mixture and then stressed with tunicamycin. Each data point represents a single cell. Error bars represent 95% confidence intervals.
Figure 3—figure supplement 3
Quantification of diffusion from single-particle trajectories.
(A) Kernel density estimates of apparent diffusion constants of HaloTag controls and IRE1-HaloTag with and without stress, obtained by conventional MSD analysis of single particle trajectories. (B) Mean posterior occupation of single-particle diffusion constants of the same four conditions as shown in panel A (see Materials and methods for details).
-
Figure 3—figure supplement 3—source data 1
Pairwise significance test values (permutation test with 10,000 iterations and two-tailed t-test) for all plotted conditions.
- https://cdn.elifesciences.org/articles/74342/elife-74342-fig3-figsupp3-data1-v1.xlsx
Figure 4 with 2 supplements
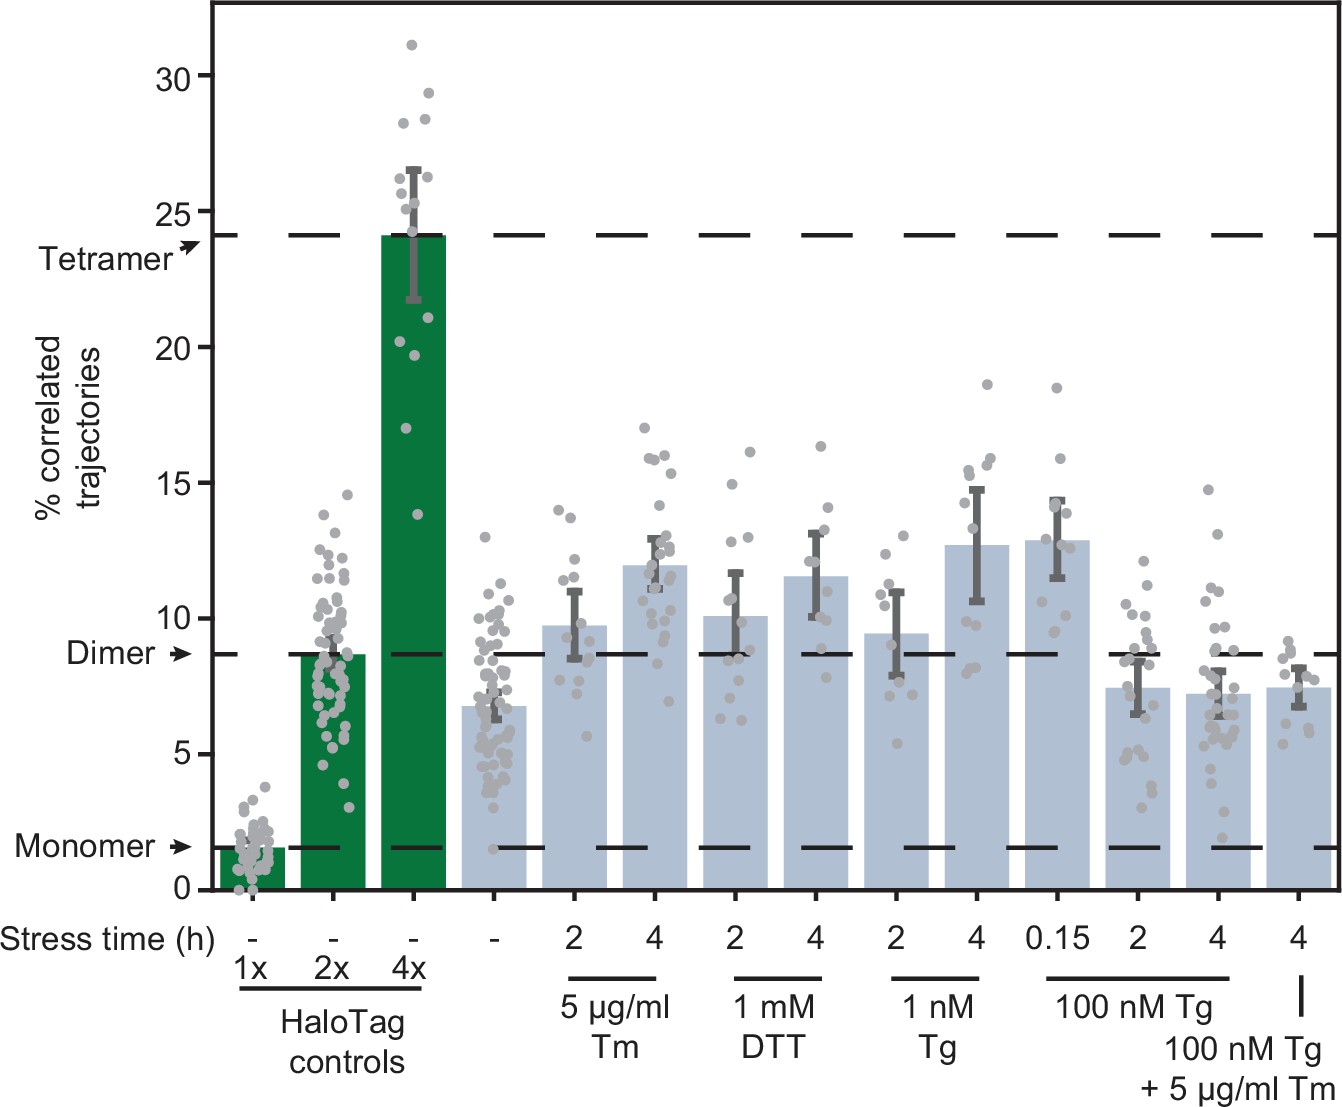
Effects of stressors on IRE1 oligomerization.
Oligomerization of endogenously tagged IRE1-HaloTag in U-2 OS cells treated with the indicated ER stressors for the indicated amounts of time. Tunicamycin (Tm) inhibits glycosylation in the ER lumen, thapsigargin (Tg) blocks sarco/endoplasmic reticulum Ca2+ pumps, and dithiothreitol (DTT) triggers reduction of disulfide bonds. Green bars on the left correspond to the 1 x, 2 x, and 4 x HaloTag controls, respectively. Error bars represent 95% confidence intervals.
-
Figure 4—source data 1
Pairwise significance test values (permutation test with 10,000 iterations and two-tailed t-test) for all plotted conditions.
- https://cdn.elifesciences.org/articles/74342/elife-74342-fig4-data1-v1.xlsx
Figure 4—figure supplement 1
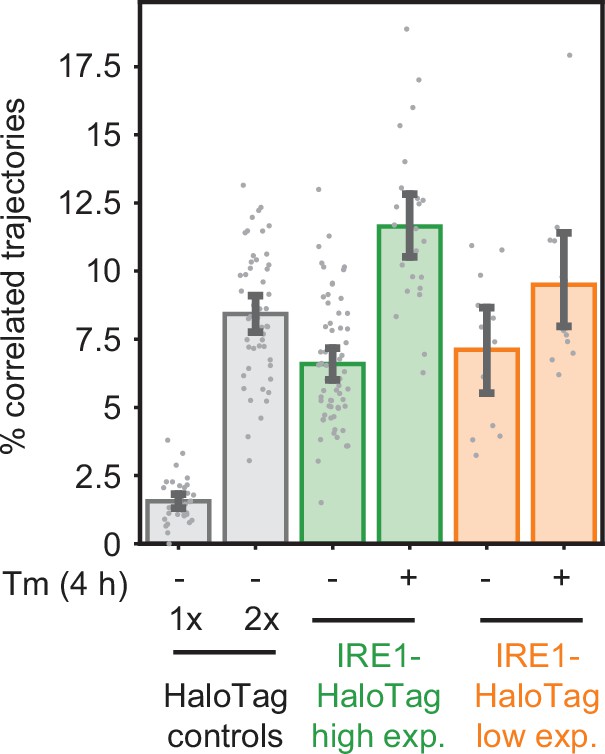
Formation of dimers and oligomers in high- and low-expressing clones of IRE1-HaloTag cells.
Single-particle tracking data showing stress-dependent oligomerization of the high- and low-expressing IRE1-HaloTag clones. IRE1 in the lower-expressing clone remains dimeric in unstressed cells, while the shift to higher-order oligomers upon stress is less prominent than in the higher-expressing clone. Each data point represents a single cell. Error bars represent 95% confidence intervals.
-
Figure 4—figure supplement 1—source data 1
Raw uncropped gel of immunoblot against IRE1, XBP1s, and GAPDH of Figure 4—figure supplement 1.
- https://cdn.elifesciences.org/articles/74342/elife-74342-fig4-figsupp1-data1-v1.zip
-
Figure 4—figure supplement 1—source data 2
Raw uncropped gel of immunoblot against PERK, ATF4, and CHOP of Figure 4—figure supplement 1.
- https://cdn.elifesciences.org/articles/74342/elife-74342-fig4-figsupp1-data2-v1.tif
-
Figure 4—figure supplement 1—source data 3
Raw uncropped gel of immunoblot against ATF6 of Figure 4—figure supplement 1.
- https://cdn.elifesciences.org/articles/74342/elife-74342-fig4-figsupp1-data3-v1.tif
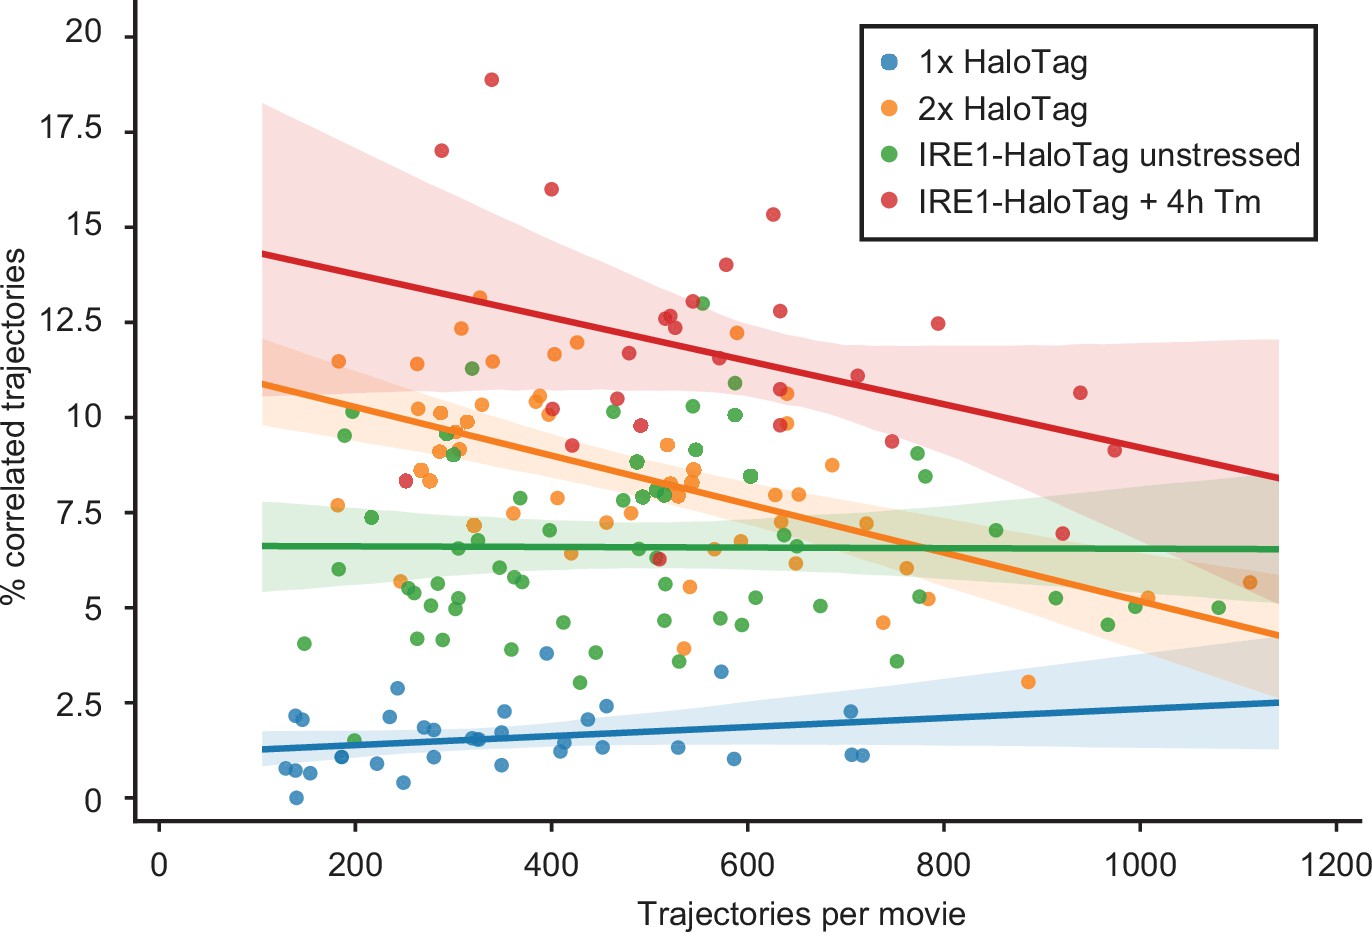
Figure 4—figure supplement 2
Trajectory density vs. percent correlation.
A plot showing the relationship between the percentage of a calculated trajectories in a given cell against the number of trajectories in the movie collected from that cell, for the four conditions indicated in the box. Solid lines represent linear fits, with the shaded regions around them showing 95% confidence intervals. Each data point represents a single cell.
-
Figure 4—figure supplement 2—source data 1
Pairwise significance test values (permutation test with 10,000 iterations and two-tailed t-test) for all plotted conditions.
- https://cdn.elifesciences.org/articles/74342/elife-74342-fig4-figsupp2-data1-v1.xlsx
Figure 5 with 1 supplement

Effects of mutations on IRE1 oligomerization.
Oligomerization of the indicated IRE1 mutants transiently transfected into IRE1 KO U-2 OS cells and expressed under the control of the weak CMVd3 promoter. ‘IRE1-HaloTag (endogenous)’ refers to the endogenously tagged IRE1 cells that are shown in Figure 4. Error bars represent 95% confidence intervals.
-
Figure 5—source data 1
Pairwise significance test values (permutation test with 10,000 iterations and two-tailed t-test) for all plotted conditions.
- https://cdn.elifesciences.org/articles/74342/elife-74342-fig5-data1-v1.xlsx
Figure 5—figure supplement 1
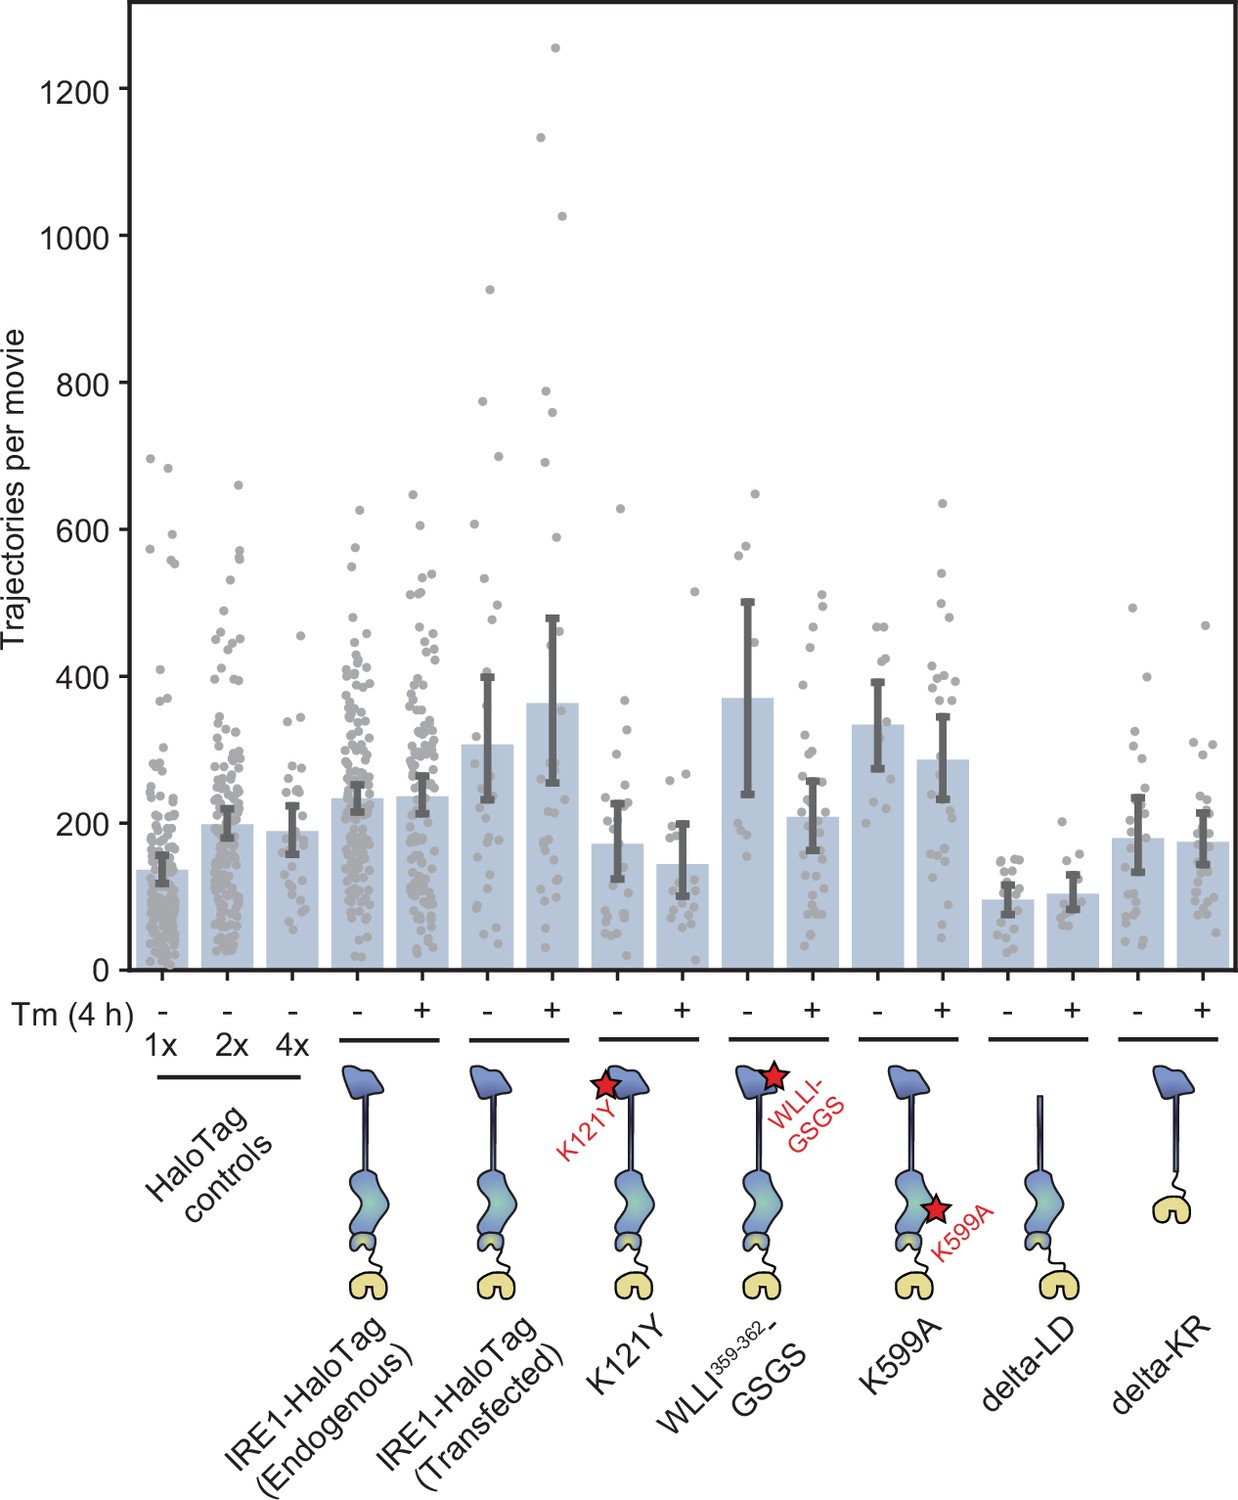
Trajectory counts of all mutants.
Number of trajectories per movie for all mutants shown in Figure 5, demonstrating that all constructs are expressed at comparable levels and that the changes in % correlated trajectories are independent of construct expression levels. Each data point represents a single cell. Error bars represent 95% confidence intervals.
Figure 6
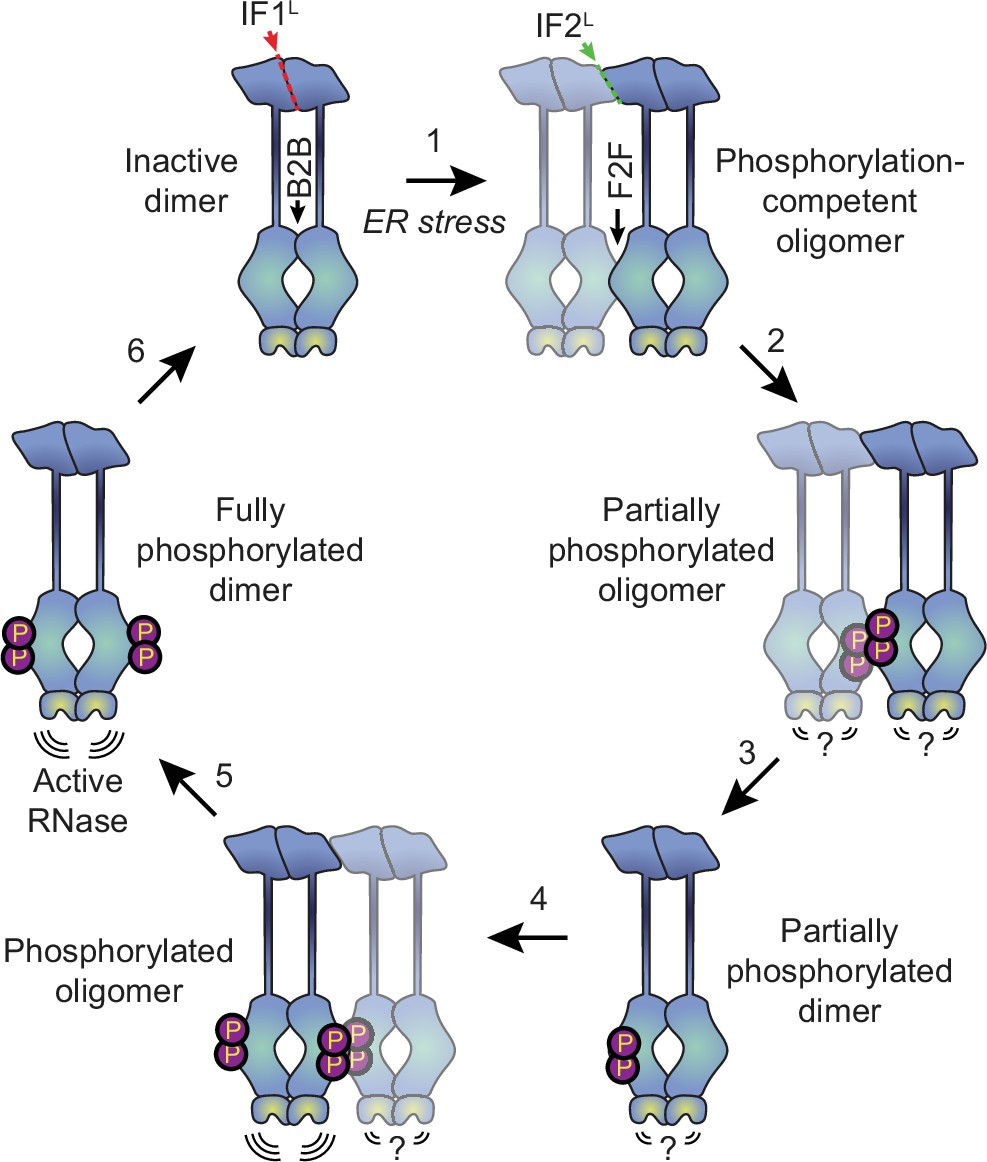
Proposed model for human IRE1 activation.
In the absence of external stress, IRE1 is pre-assembled into inactive unphosphorylated dimers via the IF1L interface of the lumenal domain. Kinase domains within the dimer are positioned in a back-to-back (B2B) orientation, which does not allow for phosphorylation. (Gurevich and Gurevich, 2018) ER stress forces dimers to oligomerize via the IF2L interface, placing the kinase active sites of adjacent dimers in a face-to-face (F2F) orientation that favors trans-autophosphorylation. Here and throughout the figure, the original dimer is shown in solid blue tones while the newly associated dimer is semi-transparent. (Shattil and Newman, 2004) Phosphorylation at the F2F interface results in a partially phosphorylated oligomer, wherein one protomer of each dimer is phosphorylated and one is not. The relative activity of the RNase domains in this state is unknown. (Chung, 2017) At this point, the oligomer may dissociate into partially phosphorylated dimers. (Reich et al., 1997) Another dimer associates with the partially phosphorylated dimer via the second IF2L interface, catalyzing phosphorylation of the second protomer of the original dimer. Note that this may either occur sequentially, as shown here, or simultaneously with step 2, if multiple dimers assemble into a hexamer or larger oligomer. Phosphorylated IRE1 now has an active RNase domain and dissociates into fully active dimers (Kaufman, 1999). Eventually, dimers are dephosphorylated by phosphatases and return back into the inactive state.
Videos
Video 1
Co-localizing spots in cells expressing 2 x tandem HaloTag.
A cropped and annotated movie recorded from an IRE1 KO cells transiently transfected with the 2 x tandem HaloTag construct and labeled with a mixture of JF549 and JF646 dyes. Two separate co-localizing spots (as determined by the automated analysis pipeline) are annotated.
Tables
Key resources table
| Reagent type (species) or resource | Designation | Source or reference | Identifiers | Additional information |
|---|---|---|---|---|
| Gene (Homo sapiens) | ERN1 | HUGO Gene Nomenclature Committee | HGNC:3,449 | Gene encoding human IRE1a |
| Strain, strain background (Escherichia coli) | Stellar Competent Cells | Takara Bio | 636,763 | High-efficiency competent cells for cloning |
| Cell line (Homo-sapiens) | U-2 OS WT Flp-In T-REx | Ivan Dikic lab; verified by ATCC STR service; published in Belyy et al., 2020 | PWM253 | Parental line for all cells in this study, denoted as “WT” |
| Cell line (Homo-sapiens) | U-2 OS IRE1α KO | Belyy et al., 2020 | PWM254 | CRISPR knock-out of IRE1α in PWM253 |
| Cell line (Homo-sapiens) | U-2 OS IRE1α partial KO | This paper | PWM359 | Partial CRISPR knock-out of IRE1α in PWM253, containing one intact ERN1 allele |
| Cell line (Homo-sapiens) | U-2 OS IRE1a-HaloTag endogenously tagged | This paper | PWM360 | Introduction of a C-terminal HaloTag into the endogenous ERN1 locus of PWM359 cells. Clonal population. |
| Cell line (Homo-sapiens) | U-2 OS IRE1a-HaloTag endogenously tagged, low expression clone | This paper | PWM361 | Introduction of a C-terminal HaloTag into the endogenous ERN1 locus of PWM359 cells. clonal population with lower IRE1 expression level than PWM360. |
| Recombinant DNA reagent (plasmid) | SpCas9 and gRNA targeting the C-terminus of HsIRE11 | This paper | pPW3754 | Used for endogenous CRISPR editing of ERN1 gene. |
| Recombinant DNA reagent (plasmid) | HDR-HsIRE1a-10xGS-HaloTag | This paper | pPW3755 | Used for endogenous CRISPR editing of ERN1 gene. |
| Recombinant DNA reagent (plasmid) | CMVd3-ERmembrane-HaloTag-KKMP | This paper | pPW3756 | Used for transient transfections |
| Recombinant DNA reagent (plasmid) | CMVd3-ERmembrane-2xHaloTag-KKMP | This paper | pPW3757 | Used for transient transfections |
| Recombinant DNA reagent (plasmid) | CMVd3-HsIRE1-HaloTag | This paper | pPW3758 | Used for transient transfections |
| Recombinant DNA reagent (plasmid) | CMVd3-HsIRE1deltaLD-HaloTag | This paper | pPW3759 | Used for transient transfections |
| Recombinant DNA reagent (plasmid) | CMVd3-HsIRE1-K599A_KinaseDead-HaloTag | This paper | pPW3760 | Used for transient transfections |
| Recombinant DNA reagent (plasmid) | CMVd3-HsIRE1(WLLI-GSGS)[359-362]-HaloTag | This paper | pPW3761 | Used for transient transfections |
| Recombinant DNA reagent (plasmid) | CMVd3-HsIRE1(K121Y)-HaloTag | This paper | pPW3762 | Used for transient transfections |
| Recombinant DNA reagent (plasmid) | CMVd3-HsIRE1dLKR-HaloTag | This paper | pPW3763 | Used for transient transfections |
| Recombinant DNA reagent (plasmid) | CMVd3-ERmembrane-GST-HaloTag-KKMP | This paper | pPW3781 | Used for transient transfections |
| Recombinant DNA reagent (plasmid) | CMVd3-ERmembrane-GST-2xHaloTag-KKMP | This paper | pPW3783 | Used for transient transfections |
| Antibody | Anti- IRE1α (Rabbit monoclonal) | Cell Signaling Technology | 3294 | WB (1:1000) |
| Antibody | Anti- PERK (Rabbit monoclonal) | Cell Signaling Technology | 3192 | WB (1:1000) |
| Antibody | Anti- ATF4 (Rabbit monoclonal) | Cell Signaling Technology | 11,815 | WB (1:1000) |
| Antibody | Anti- CHOP (Mouse monoclonal) | Cell Signaling Technology | 2895 | WB (1:1000) |
| Antibody | Anti- ATF6 (Mouse monoclonal) | Proteintech | 66563–1 | WB (1:1000) |
| Antibody | Anti- β-actin (Rabbit monoclonal) | Cell Signaling Technology | 5125 | WB (1:1000) |
| Antibody | Anti-IRE1p (Rabbit monoclonal) | Chang et al., 2018 | N/A | WB (1:1000) |
| Antibody | Anti-XBP1s (Rabbit monoclonal) | Chang et al., 2018 | N/A | WB (1:1000) |
| Sequence-based reagent | Hs00176385_m1 | ThermoFisher Scientific | qPCR primer for IRE1 | |
| Sequence-based reagent | Hs02856596_m1 | ThermoFisher Scientific | qPCR primer for XBP1u | |
| Sequence-based reagent | Hs03929085_g1 | ThermoFisher Scientific | qPCR primer for XBP1s | |
| Sequence-based reagent | Hs01045913_m1 | ThermoFisher Scientific | qPCR primer for DGAT2 | |
| Sequence-based reagent | Hs00170663_m1 | ThermoFisher Scientific | qPCR primer for BCAM | |
| Sequence-based reagent | Hs00197728_m1 | ThermoFisher Scientific | qPCR primer for TGOLN2 | |
| Sequence-based reagent | s02800695_m1 | ThermoFisher Scientific | qPCR primer for HPRT1 | |
| Commercial assay or kit | TaqMan RNA-to-CT 1-Step Kit | ThermoFisher Scientific | 4392938 | |
| Commercial assay or kit | RNeasy Plus kit | Qiagen | 74,134 | |
| Commercial assay or kit | In-Fusion HD Cloning | Clontech | Clontech:639,647 | |
| Software, algorithm | saSPT | Heckert et al., 2021 | https://github.com/alecheckert/saspt | Open-source software package used for extracting diffusion coefficients from single-particle trajectories. |
| Other | JF549 dye conjugated with HaloTag ligand | Luke Lavis Lab; Grimm et al., 2017 | Promega: GA1110 | Kind gift of Luke Lavis; also available commercially from Promega |
| Other | JF646 dye conjugated with HaloTag ligand | Luke Lavis Lab; Grimm et al., 2017 | Promega: GA1120 | Kind gift of Luke Lavis; also available commercially from Promega |
Additional files
-
Supplementary file 1
Table containing detailed information for all plasmids used in this study.
- https://cdn.elifesciences.org/articles/74342/elife-74342-supp1-v1.docx
-
Supplementary file 2
Full plasmid maps for all plasmids used in this study.
- https://cdn.elifesciences.org/articles/74342/elife-74342-supp2-v1.zip
-
Transparent reporting form
- https://cdn.elifesciences.org/articles/74342/elife-74342-transrepform1-v1.docx
Download links
A two-part list of links to download the article, or parts of the article, in various formats.
Downloads (link to download the article as PDF)
Open citations (links to open the citations from this article in various online reference manager services)
Cite this article (links to download the citations from this article in formats compatible with various reference manager tools)
Endoplasmic reticulum stress activates human IRE1α through reversible assembly of inactive dimers into small oligomers
eLife 11:e74342.
https://doi.org/10.7554/eLife.74342


