Reciprocally inhibitory circuits operating with distinct mechanisms are differently robust to perturbation and modulation
- Volen Center and Department of Biology, Brandeis University, United States
- Biology Department, University of Oregon, United States
Figures
Figure 1
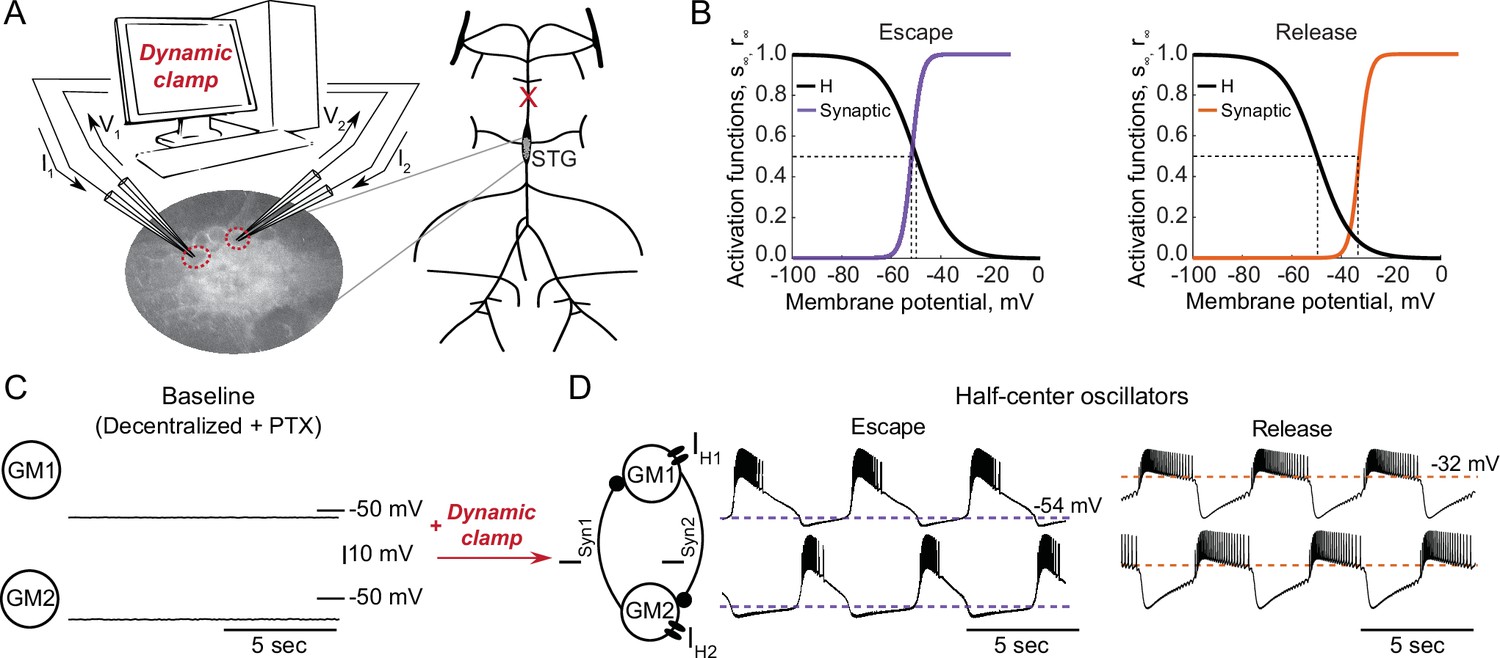
Experimental set-up.
(A) Half-center oscillator circuits are built by connecting two gastric mill (GM) neurons from the stomatogastric ganglion (STG) of the crab Cancer borealis via artificial reciprocal inhibitory synapses () and by adding an artificial hyperpolarization-activated inward current () in two-electrode dynamic-clamp mode using RTXI. The membrane potentials of the neurons () are digitized and passed to a computer to calculate the currents (), which are then converted to analogue signals and injected into the appropriate neurons. (B) Activation curves of the dynamic clamp generated H current and synaptic current. Shift in the synaptic activation curve switches the mechanism of oscillations between escape (left graph, purple curve) and release (right graph, orange curve). (C) At baseline, synaptically isolated GM neurons are silent with a resting membrane potential between –65 and –55 mV. (D) When coupled via the dynamic clamp, the neurons generate an alternating bursting pattern of activity (half-center oscillator). Representative half-center oscillator traces with escape mechanism are shown on the left and with release mechanism on the right. Synaptic thresholds are indicated by the horizontal dashed lines. In the circuit diagram, filled circles indicate inhibitory synapses.
Figure 2
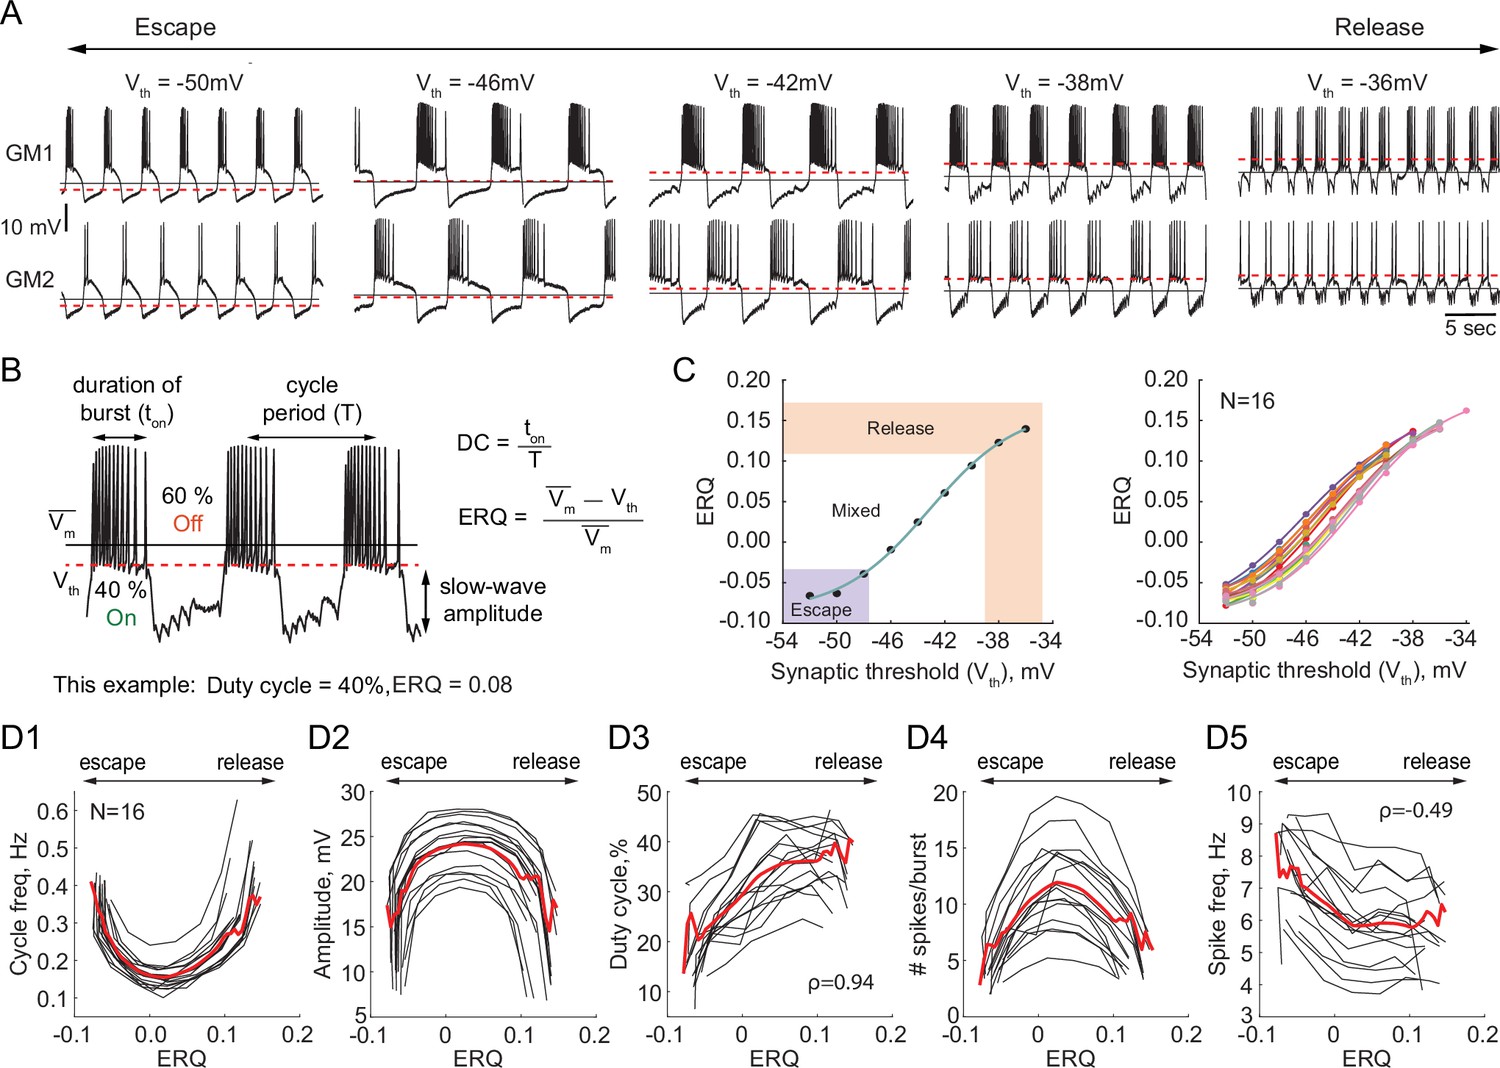
Dependence of the characteristics of half-center oscillator output on the mechanism of oscillation.
(A) Representative intracellular recordings of GM neurons coupled via the dynamic clamp to form a half-center oscillator for different synaptic thresholds (Vth). Red dashed lines correspond to the synaptic thresholds, black solid lines correspond to the mean membrane potentials (). Depolarization of the synaptic threshold switches the mechanism of oscillations from escape to release passing through a mixture of mechanisms. (B) Half-center oscillator activity characteristics measured in this study, such as cycle period (frequency), slow-wave amplitude and duty cycle (DC) are indicated on the example GM neuron trace. Escape to Release Quotient (ERQ) is calculated based on the mean membrane potential and the synaptic threshold as shown. (C) ERQ as a function of the synaptic threshold for a single preparation (left) and multiple preparations (N = 16, right). Relationship between the ERQ and the synaptic threshold is sigmoidal as shown by the fit curve (cyan). Left hand ERQ plot is from the experiment shown in (A) (D1) Cycle frequency vs ERQ. (D2) Slow-wave amplitude vs ERQ. (D3) Duty cycle vs ERQ. (D4) Number of spikes per burst vs ERQ. (D5) Spike frequency vs ERQ. Black lines are individual experiments (N = 16), red lines represent means across all the experiments.
Figure 3 with 1 supplement
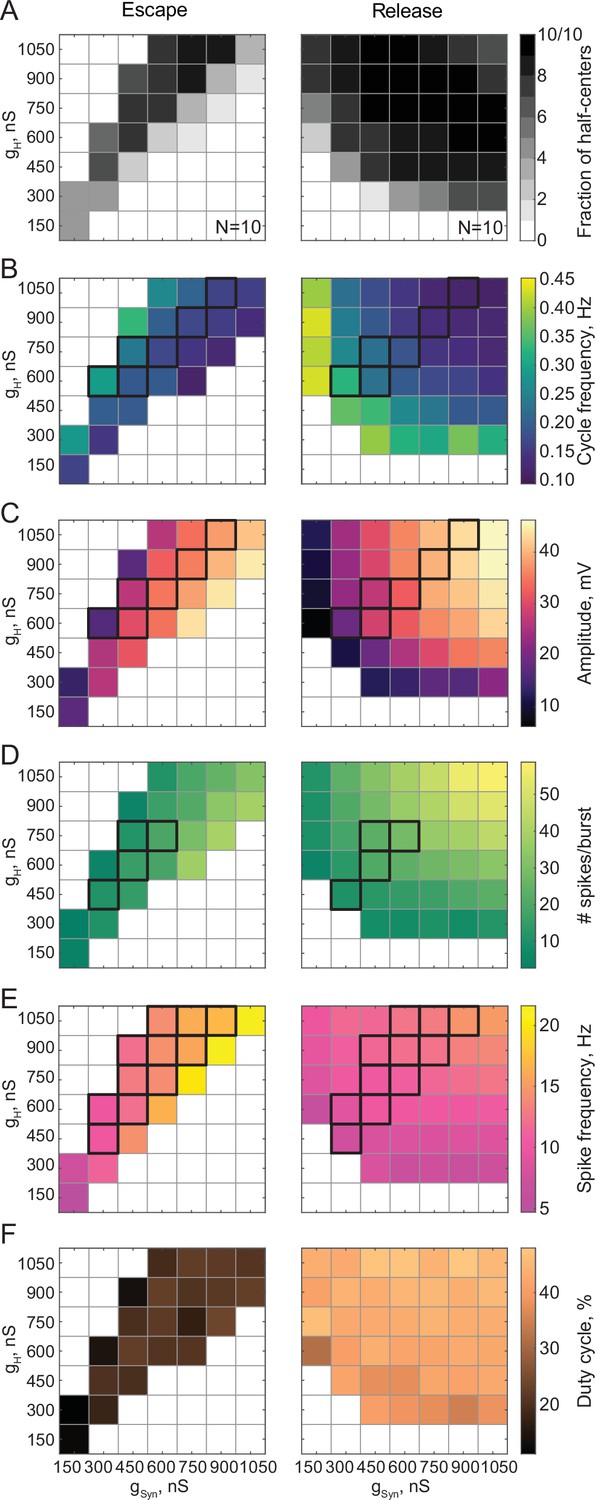
Maps of network output as a function of the synaptic and H conductances (gSyn, gH) for circuits with escape and release mechanisms.
(A) Distribution of half-center oscillators in gSyn-gH parameter space. Gray scale shows the fraction of preparations that formed half-center oscillators for each gSyn-gH parameter combination within the map (N = 10 for each mechanism). White space corresponds to parameters sets for which no oscillators exist. (B) Dependence of the mean half-center oscillator cycle frequency on gSyn and gH across 10 preparations for each mechanism. (C) Dependence of the mean slow-wave amplitude on gSyn and gH. (D) Dependence of the mean number of spikes per burst on gSyn and gH. (E) Dependence of the mean spike frequency on gSyn and gH. (F) Dependence of the mean duty cycle on gSyn and gH. In panels B-E, gSyn-gH parameter sets for which circuit output characteristics were not significantly different between release and escape are indicated by black boxes (Wilcoxon rank-sum test, p > 0.05). Figure 3—figure supplement 1. Dependence of the mean duty cycle of the circuits in escape, calculated based on time above synaptic threshold, on gSyn and gH.
Figure 3—figure supplement 1
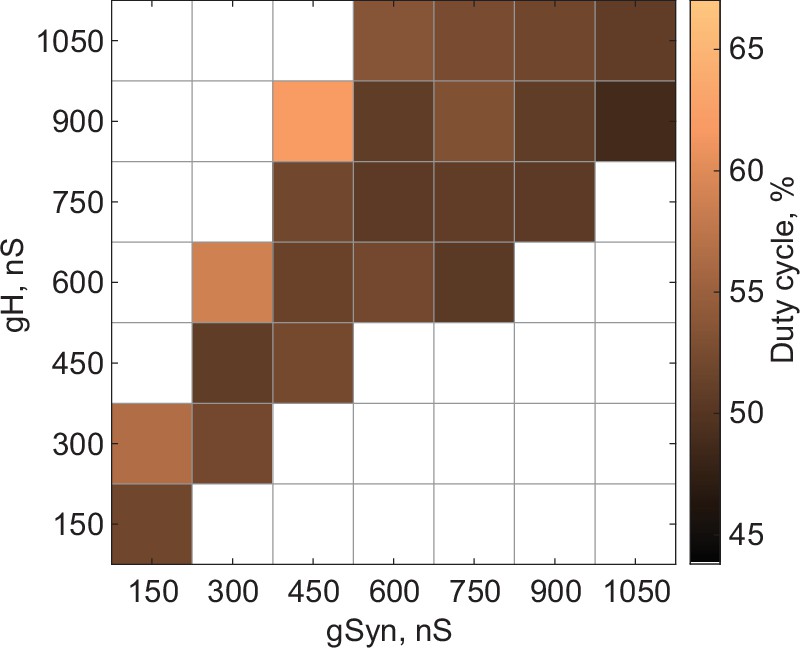
Dependence of the mean duty cycle of the circuits in escape, calculated based on time above synaptic threshold, on gSyn and gH.
Figure 4 with 1 supplement
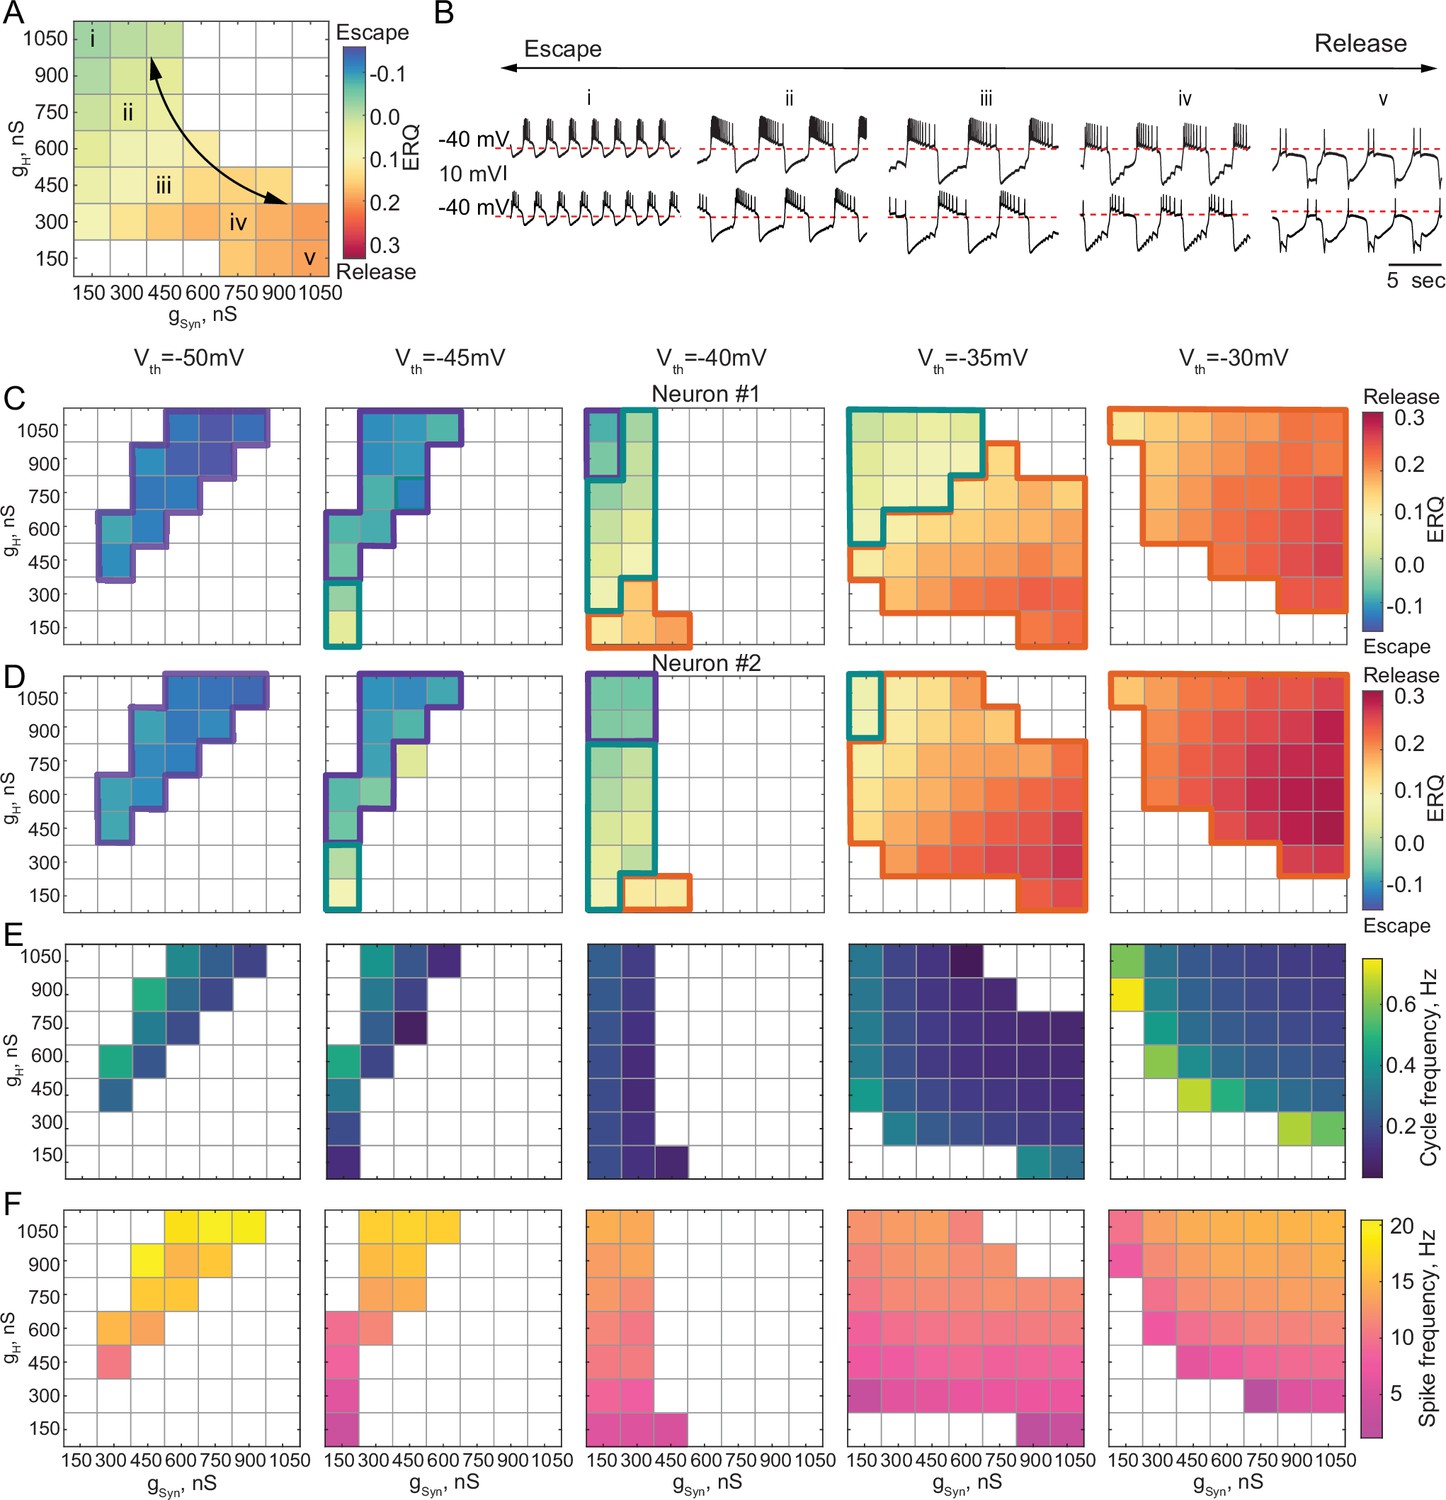
Dependence of the oscillation mechanism and half-center activity characteristics on the synaptic and H conductances for different synaptic thresholds.
(A) ERQ as a function of synaptic and H conductances with a synaptic threshold of –40 mV in a single preparation. Mechanism of oscillation is sensitive to the changes in synaptic and H conductances at Vth=-40 mV: an increase in gSyn together with a decrease in gH switches the mechanism of oscillation from escape (top left corner in the map) to release (bottom right corner in the map). (B) Representative intracellular recordings of GM neurons coupled via the dynamic clamp corresponding to values of gSyn and gH indicated in the parameter map (A) by roman numerals. (C) Dependence of ERQ on gSyn and gH for the synaptic thresholds of –50 mV, –45 mV, –40 mV, –35 mV, and –30 mV for one of the neurons in a circuit in a single preparation. Colored borders outline the regions of parameter space corresponding to different mechanisms of oscillation (escape-purple, release-orange or mixed-cyan). (D) Same as (C) but for the other neuron in a circuit. ERQ is relatively insensitive to changes in gSyn and gH in pure escape (left map) and pure release (right map) cases, but sensitive to gSyn and gH for intermediate thresholds (middle maps) similar to the experiment shown in panel (A). (E) Dependence of the half-center oscillator cycle frequency on gSyn and gH for different synaptic thresholds. (F) Dependence of the spike frequency on gSyn and gH for different synaptic thresholds.
Figure 4—figure supplement 1
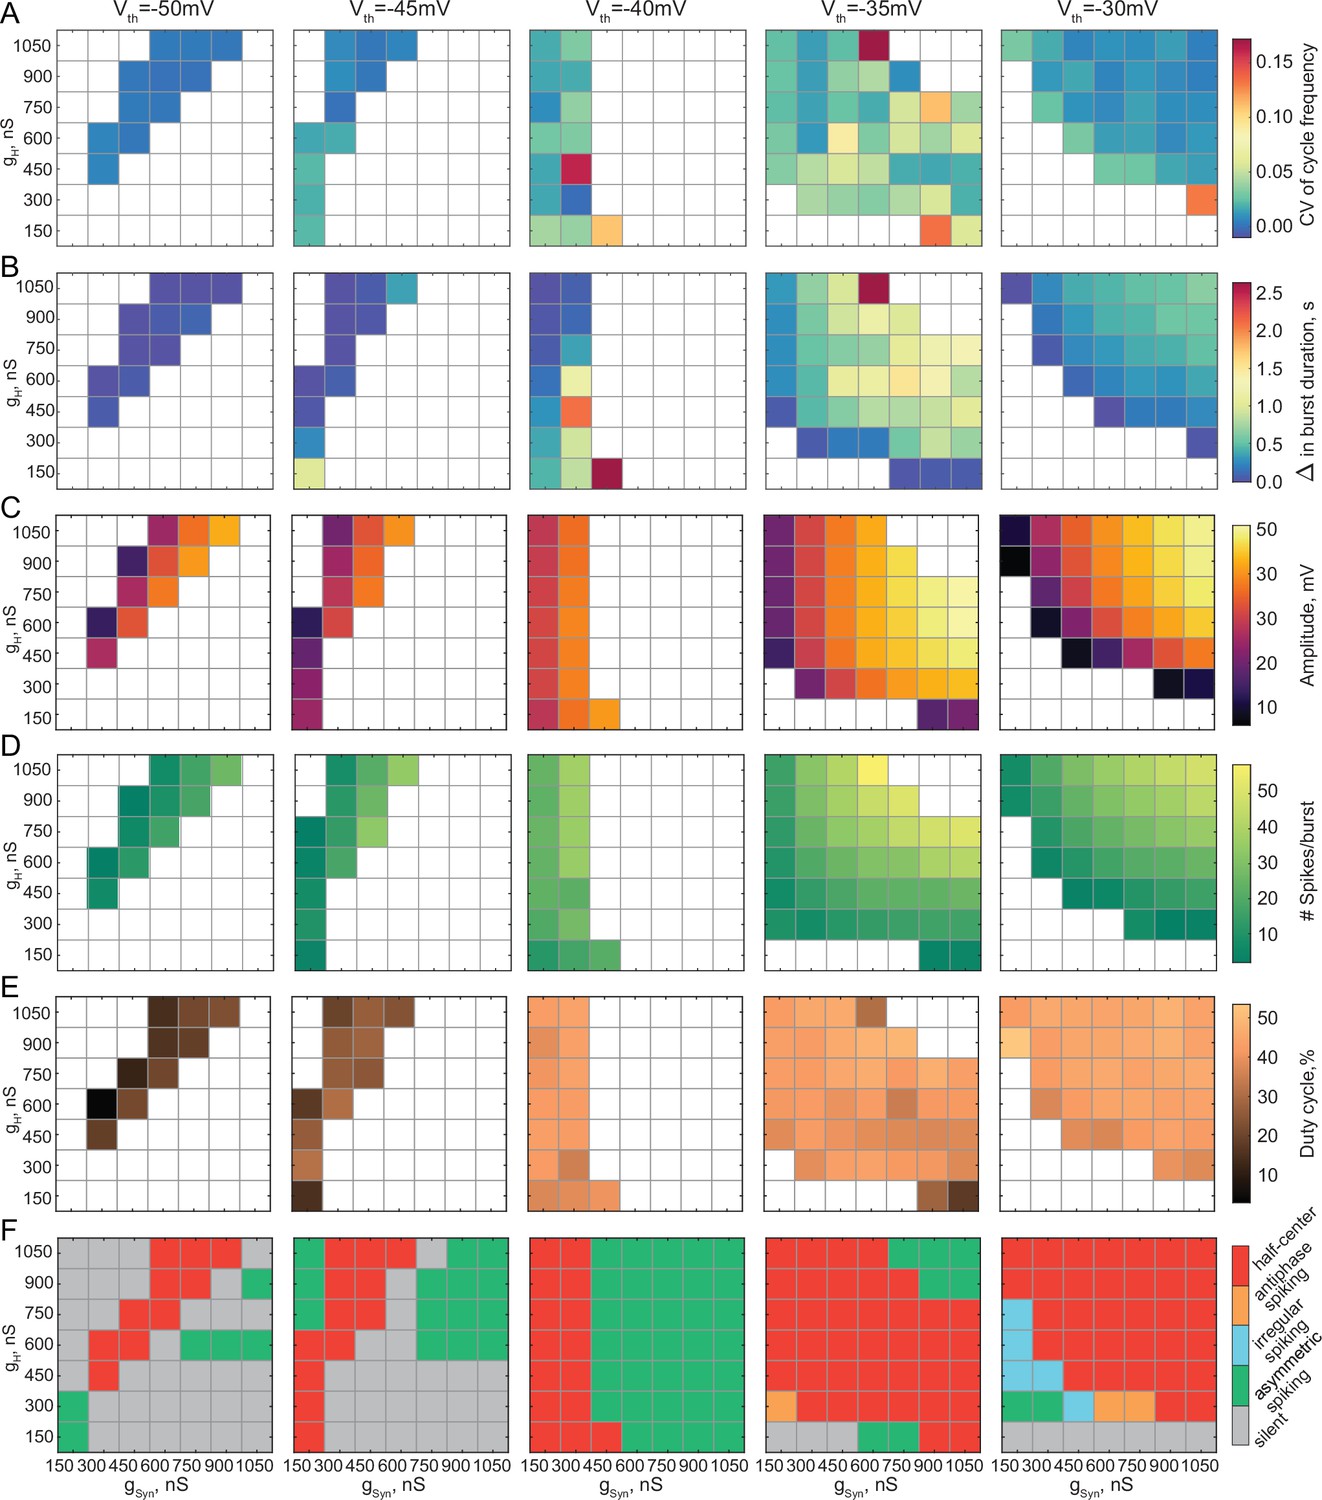
Output characteristics and activity patterns of reciprocally inhibitory circuits for different synaptic thresholds and different combinations of gSyn and gH.
(A) Dependence of a Coefficient of Variation of cycle frequency on gSyn and gH for the synaptic thresholds of –50 mV, –45 mV, –40 mV, –35 mV, and –30 mV in a single preparation. (B) Difference in the mean burst durations between the neurons in a circuit as a function of gSyn and gH at different synaptic thresholds (C) Dependence of the oscillation amplitude on gSyn and gH for different synaptic thresholds. (D) Dependence of the number of spikes per burst on gSyn and gH for different synaptic thresholds. (E) Dependence of the duty cycle on gSyn and gH for different synaptic thresholds. (F) Activity patterns of reciprocally inhibitory circuits for different combinations of gSyn and gH and different synaptic thresholds.
Figure 5 with 1 supplement
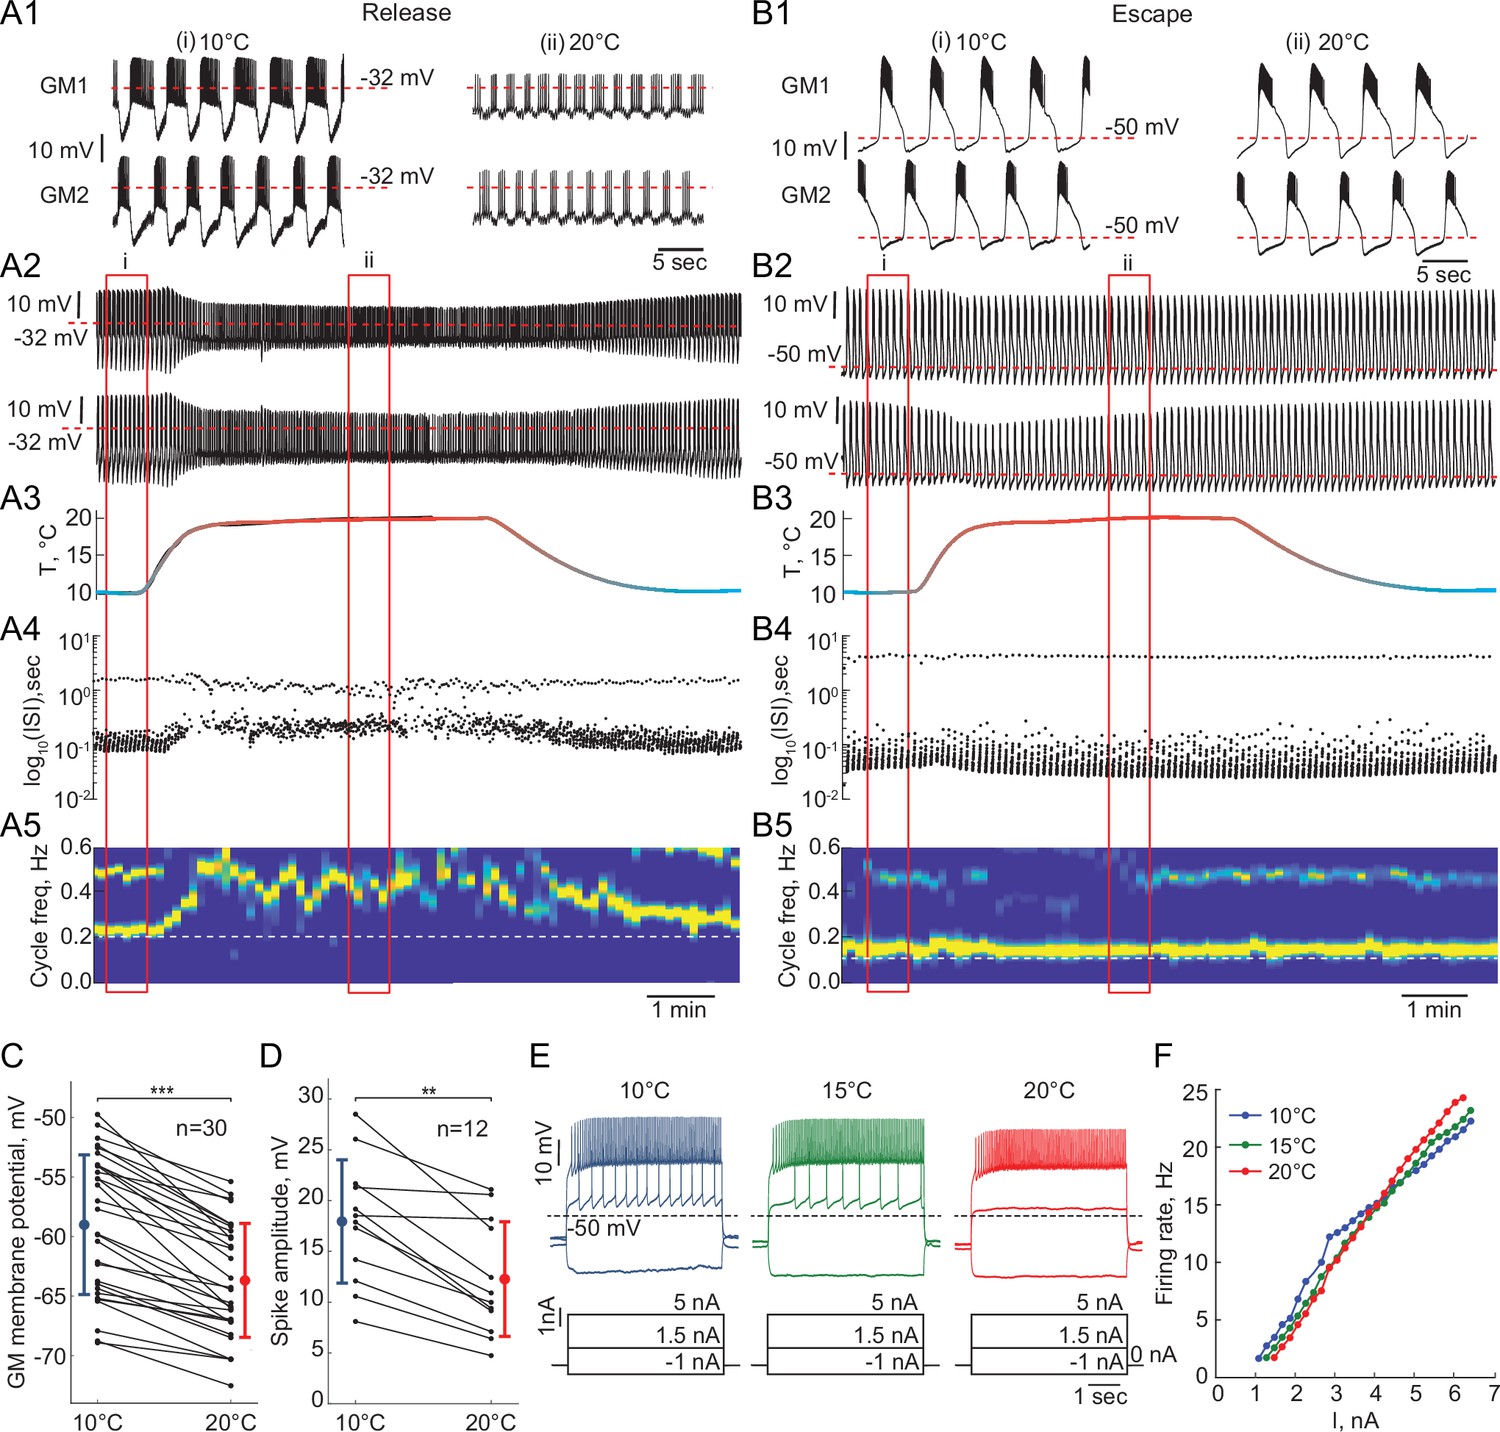
Response of reciprocally inhibitory circuits with release and escape mechanisms and temperature-independent artificial synaptic and H currents to an increase in temperature.
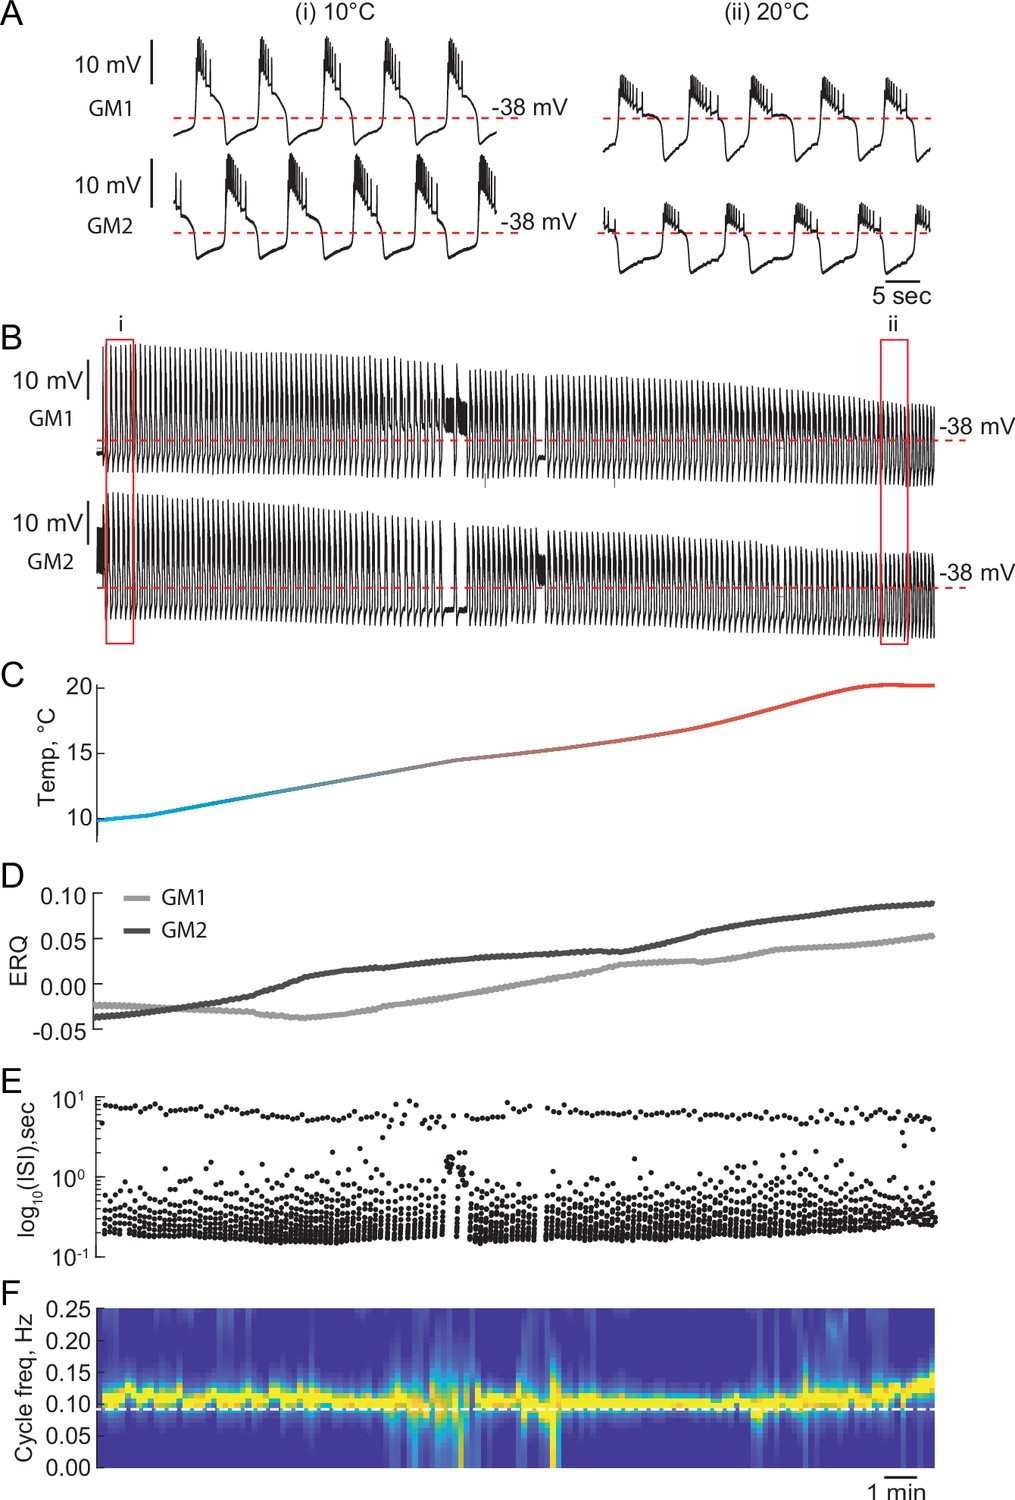
(A1) 25 second segments of the activity of a half-center circuit with a release mechanism at 10°C and 20°C. (A2) Voltage traces of a half-center oscillator network in release during the increase in temperature for the entire representative experiment. (A3) Saline temperature. (A4) Inter spike intervals (ISI) of GM1 neuron during an increase in temperature plotted on a log scale. (A5) Spectrogram of the GM1 voltage trace, showing an increase in oscillation frequency at high temperature. Color code represents the power spectral density, with yellow representing the maximum power and blue the minimum power. Low-frequency band with the strongest power corresponds to the fundamental frequency of the periodic signal; secondary band at higher frequency corresponds to its 2f harmonic. (B1-5) Same as (A1-5) for a half-center oscillator circuit with an escape mechanism. (C) GM resting membrane potentials at 10°C and 20°C. for all the recorded neurons (n = 30). Each line corresponds to one neuron, colored circles and lines correspond to means ± standard deviation. Membrane potential of GM neurons is significantly more hyperpolarized at 20°C relative to 10°C (-59.0 ± 5.9 mV at 10°C vs -63.7 ± 4.8 mV at 20°C, *** p<0.0001, Wilcoxon signed rank test). (D) GM spike amplitudes at 10°C and 20°C measured at –40 mV in response to a current step for all the neurons (n = 12). The amplitude of GM spikes is significantly smaller at 20°C than at 10°C (17.9 ± 6.1 mV at 10°C vs 12.3 ± 5.6 mV at 20°C, *** p=0.0005, Wilcoxon signed rank test). (E) Representative voltage traces from a single GM neuron in response to current steps recorded at 10°C (blue), 15°C (green) and 20°C (red). (F) Frequency-current (f-I) relationships at 10°C (blue), 15°C (green) and 20°C (red) of the neuron from the representative experiment in panel (E).
Figure 5—figure supplement 1

Coefficient of Variation (CV) of output characteristics of circuits in release and escape at low and high temperatures.
(A1) CV of cycle frequency of release circuits. (A2) CV of spike frequency of release circuits. (B1-2) Same as (A1-2) for escape circuits.
Figure 6
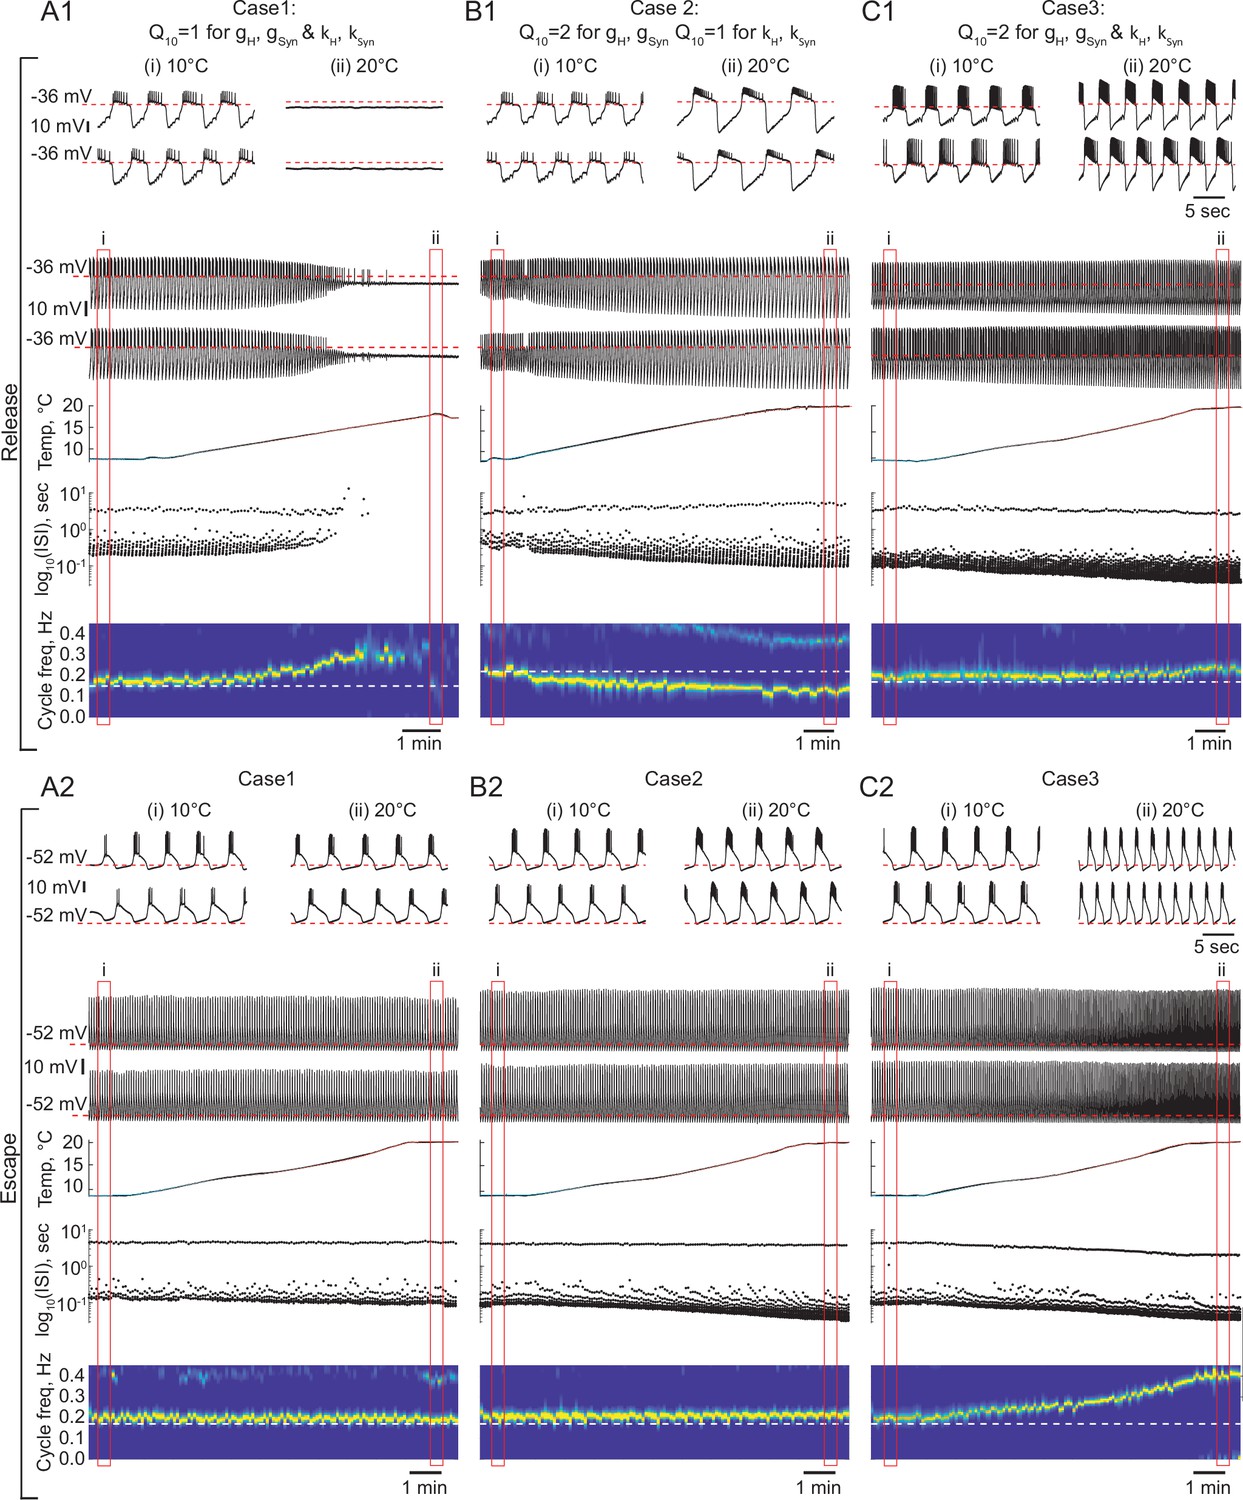
The role of temperature dependence in the synaptic and H currents in the response of the circuits with release and escape mechanisms to changes in temperature.
(A1) Representative example of the behavior of a half-center oscillator in release in case of temperature-independent synaptic and H conductances and activation rates of these currents (gH, gSyn, kH, KSyn Q10 = 1). Figure follows the same format as Figure 5A–B. (A2) Same condition as in (A1) for a circuit in escape. (B1) Representative example of the behavior of a half-center oscillator in release in case of temperature-dependence of the synaptic and H conductances with a Q10 = 2 and temperature-independent activation rates (kH, KSyn Q10 = 1). (B2) Same condition as in (B1) for a circuit in escape. (C1) Representative example of the behavior of a half-center oscillator in release in case of temperature-dependence of the synaptic and H conductances and activation rates with a Q10 = 2. (C2) Same condition as in (C1) for a circuit in escape.
Figure 7 with 1 supplement
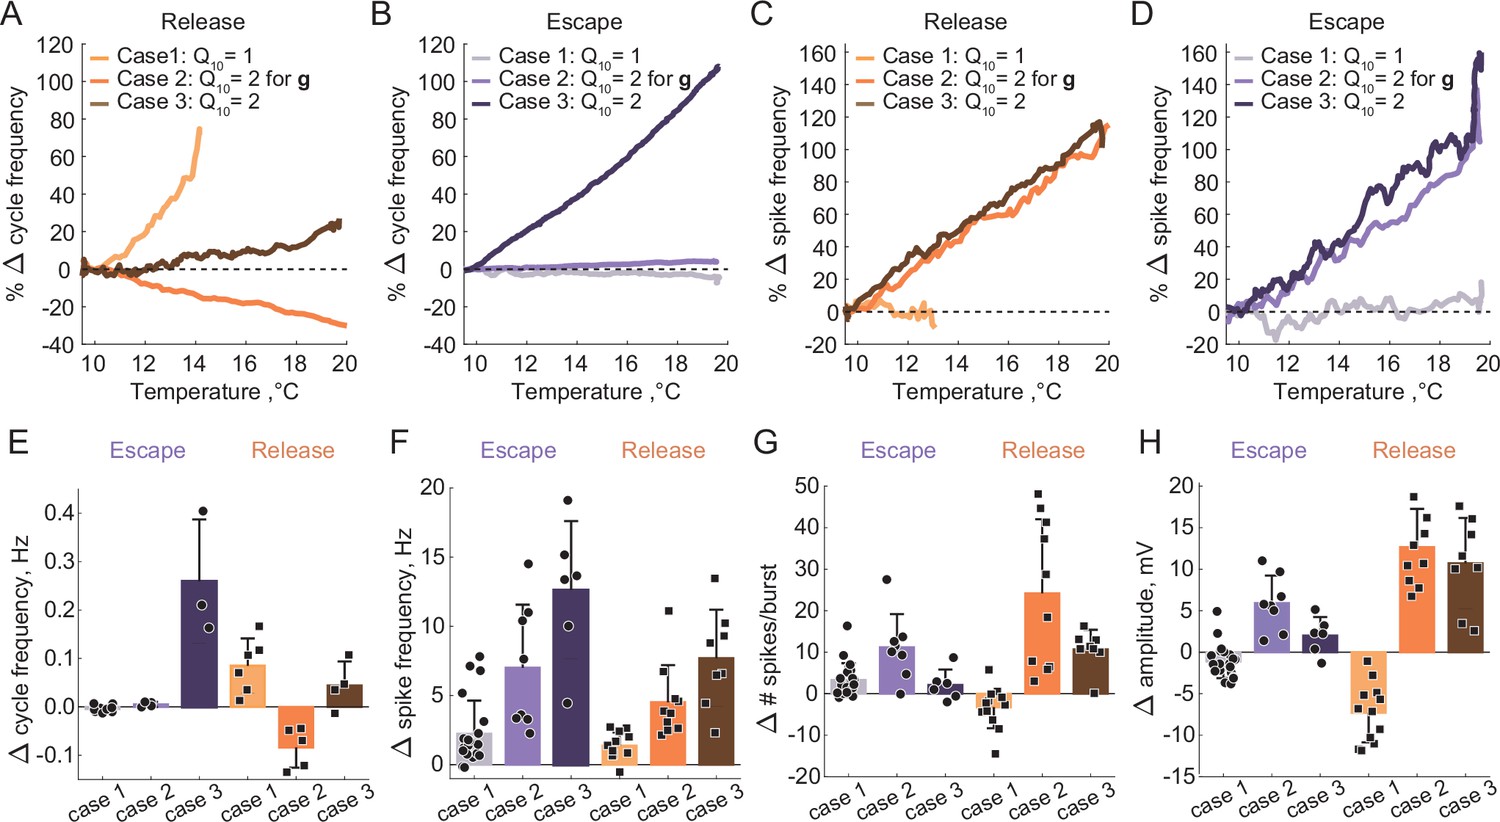
Summary of the effects of temperature on the characteristics of half-center oscillators with escape and release mechanisms and different temperature-dependences in the synaptic and H currents.
(A) Percent change in cycle frequency of the release circuits shown in Figure 6 with an increase in temperature from 10°C to 20°C. (B) Percent change in cycle frequency of the escape circuits shown in Figure 6 with an increase in temperature from 10°C to 20°C. (C) Percent change in spike frequency of the release circuits in Figure 6 with an increase in temperature from 10°C to 20°C. (D) Percent change in spike frequency of the escape circuits in Figure 6 with an increase in temperature from 10°C to 20°C. (E) Change in cycle frequency with an increase in temperature from 10°C to 20°C across all experimental conditions (N = 33). (F) Change in spike frequency across all experimental conditions. (G) Change in number of spikes per burst across all experimental conditions. (H) Change in slow-wave amplitude across all experimental conditions. Case 1: for the conductances and the activation rates of the synaptic and H currents; Case 2: for the conductances and for the activation rates of the synaptic and H currents; Case 3: for the conductances and the activation rates of the synaptic and H currents.
Figure 7—figure supplement 1
Temperature can alter the mechanism of oscillations of reciprocally inhibitory circuits.
(A) 1 min segments of the activity of a half-center oscillator recorded at 10°C and 20°C. (B) Voltage traces of a half-center oscillator during the temperature ramp from the entire experiment. (C) Temperature ramp (D) ERQs. Increase in temperature switches the mechanism of oscillation from a mixture of intrinsic escape and synaptic release to a pure synaptic release. (E) Inter spike intervals (ISI) of GM1 neuron during the increase in temperature plotted on a log scale. (F) Spectrogram of the GM1 voltage trace.
Figure 8 with 1 supplement
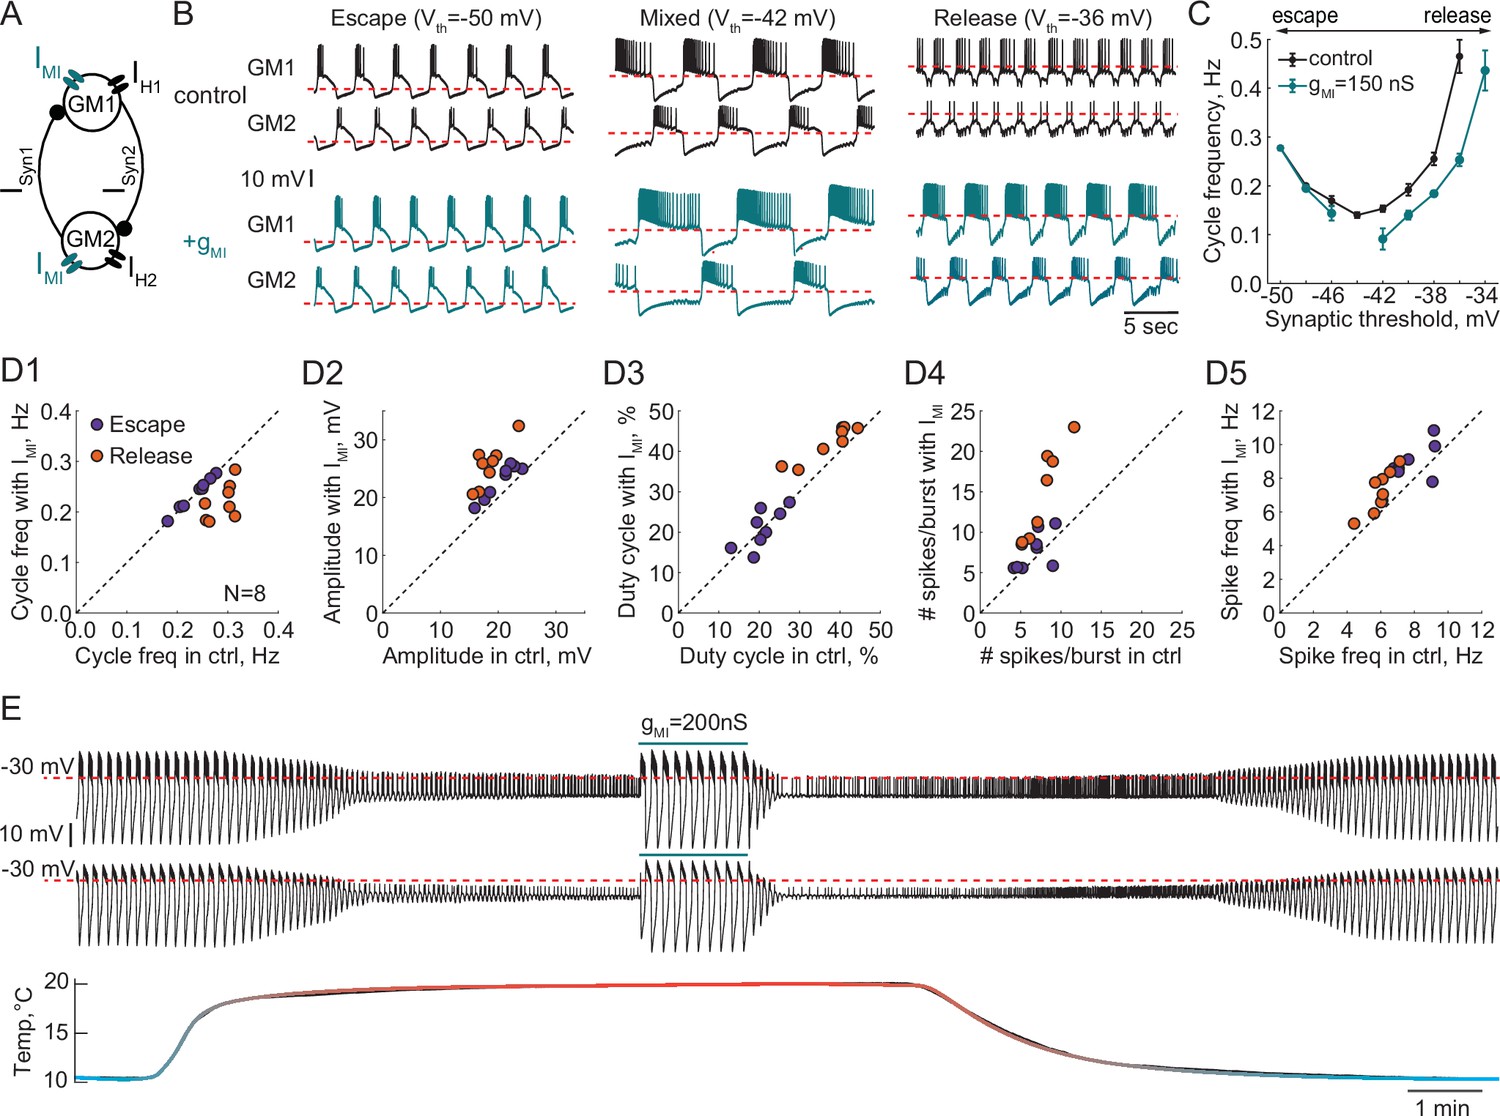
Effect of a modulatory current (IMI) on the behavior of reciprocally inhibitory circuits with different oscillatory mechanisms.
(A) A schematic representation of a reciprocally inhibitory circuit with a dynamic clamp modulatory current (IMI). (B) Representative traces of a half-center oscillator for different synaptic thresholds in control (black) and with the addition of IMI (gMI = 150 nS, blue). (C) Oscillation frequency of the circuit in panel B as a function of the synaptic threshold in control (black) and with the addition of IMI (blue). (D) Characterizing the half-center oscillator output in escape and release with the addition of IMI (N = 8). (D1) Cycle frequency (Escape: 0.236 ± 0.033 Hz in control vs 0.237 ± 0.032 Hz with IMI, n.s. p = 0.38, paired-sample t-test; Release: 0.289 ± 0.026 Hz in control vs 0.22 ± 0.036 Hz with IMI, *** p = 0.0003, paired-sample t-test). (D2) Slow-wave amplitude (Escape: 20.5 ± 2.8 mV in control vs 23.0 ± 2.9 mV with IMI, *** p < 0.0001, paired-sample t-test; Release: 18.4 ± 2.5 mV in control vs 25.7 ± 3.8 mV with IMI, *** p < 0.0001, paired-sample t-test). Amplitude increase in release is significantly larger than in escape, *p = 0.02, paired-sample t-test. (D3) Duty cycle (Escape: 20.8 ± 4.3% in control vs 21.1 ± 4.9% with IMI, n.s. p = 0.8, paired-sample t-test; Release: 37.3 ± 6.5% in control vs 42.2 ± 4.3% with IMI, *p = 0.002, paired-sample t-test). (D4) Number of spikes per burst (Escape: 6.7 ± 1.9 in control vs 7.6 ± 2.3 with IMI, n.s. p = 0.2, paired-sample t-test; Release: 7.6 ± 2.2 in control vs 14.4 ± 5.7 with IMI, ** p = 0.001, paired-sample t-test). (D5) Spike frequency (Escape: 7.8 ± 1.2 Hz in control vs 8.7 ± 1.3 Hz with IMI, * p = 0.029, paired-sample t-test; Release: 6.0 ± 0.8 Hz in control vs 7.2 ± 1.3 Hz with IMI, ** p = 0.001, paired-sample t-test). (E) IMI restores the oscillations in the circuit with a release mechanism that stopped oscillating at high temperature. Example voltage traces of a half-center oscillator circuit in release during an increase in temperature from 10°C to 20°C. In this example, synaptic and H conductances and activation rates are temperature-independent.
Figure 8—figure supplement 1
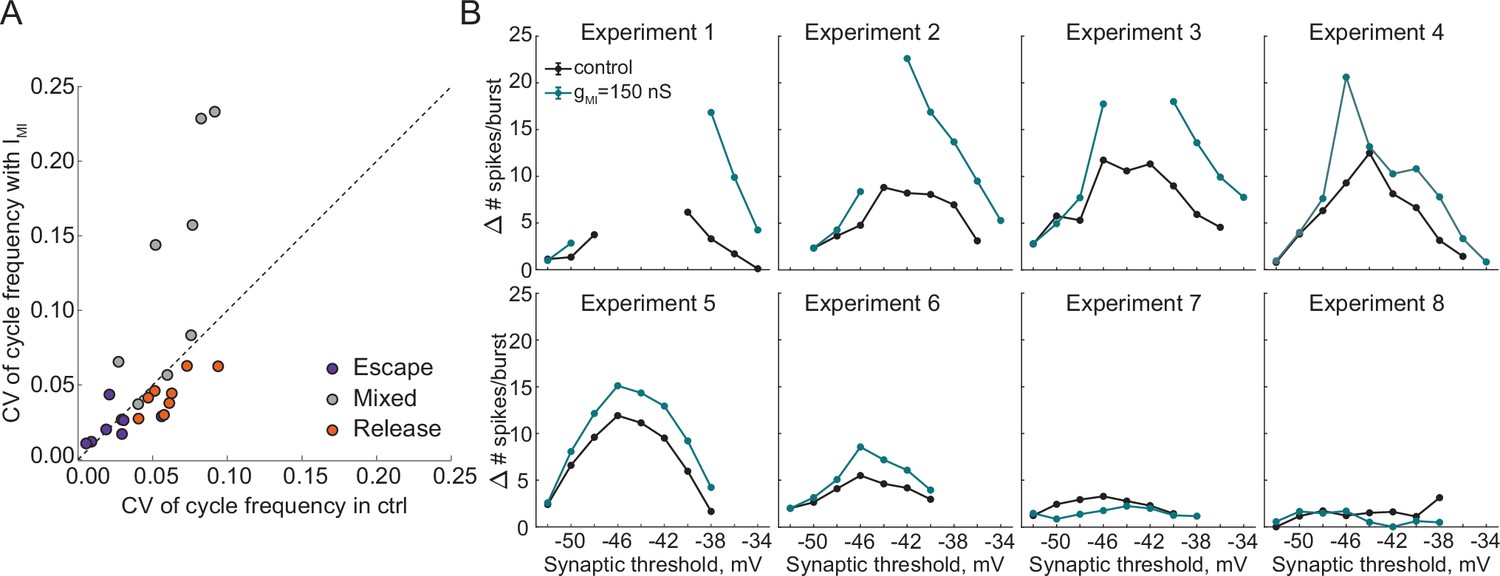
Irregularity and asymmetry of oscillations.
(A) Coefficient of Variation of cycle frequency of circuits operating with escape, mixture or release mechanism in control and with addition of IMI. (B) Difference in spikes per burst between the two neurons in circuits in controls and with addition of IMI.
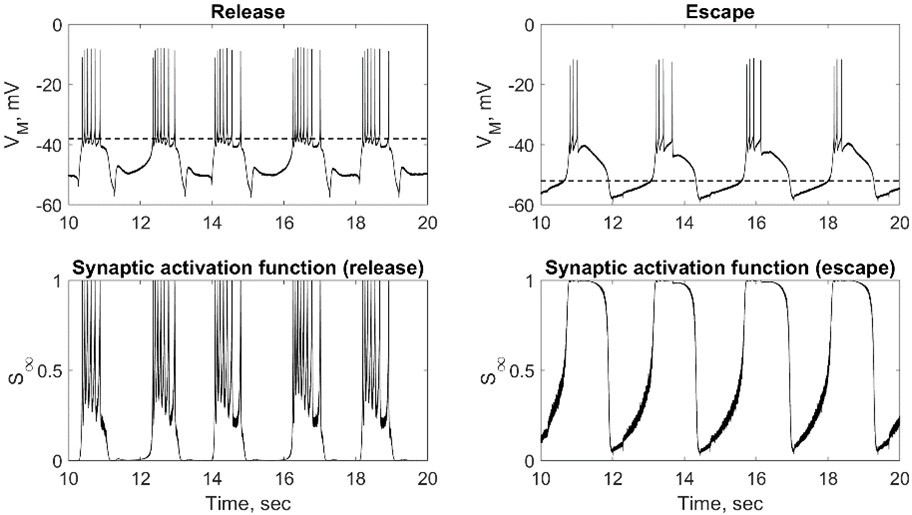
Author response image 1
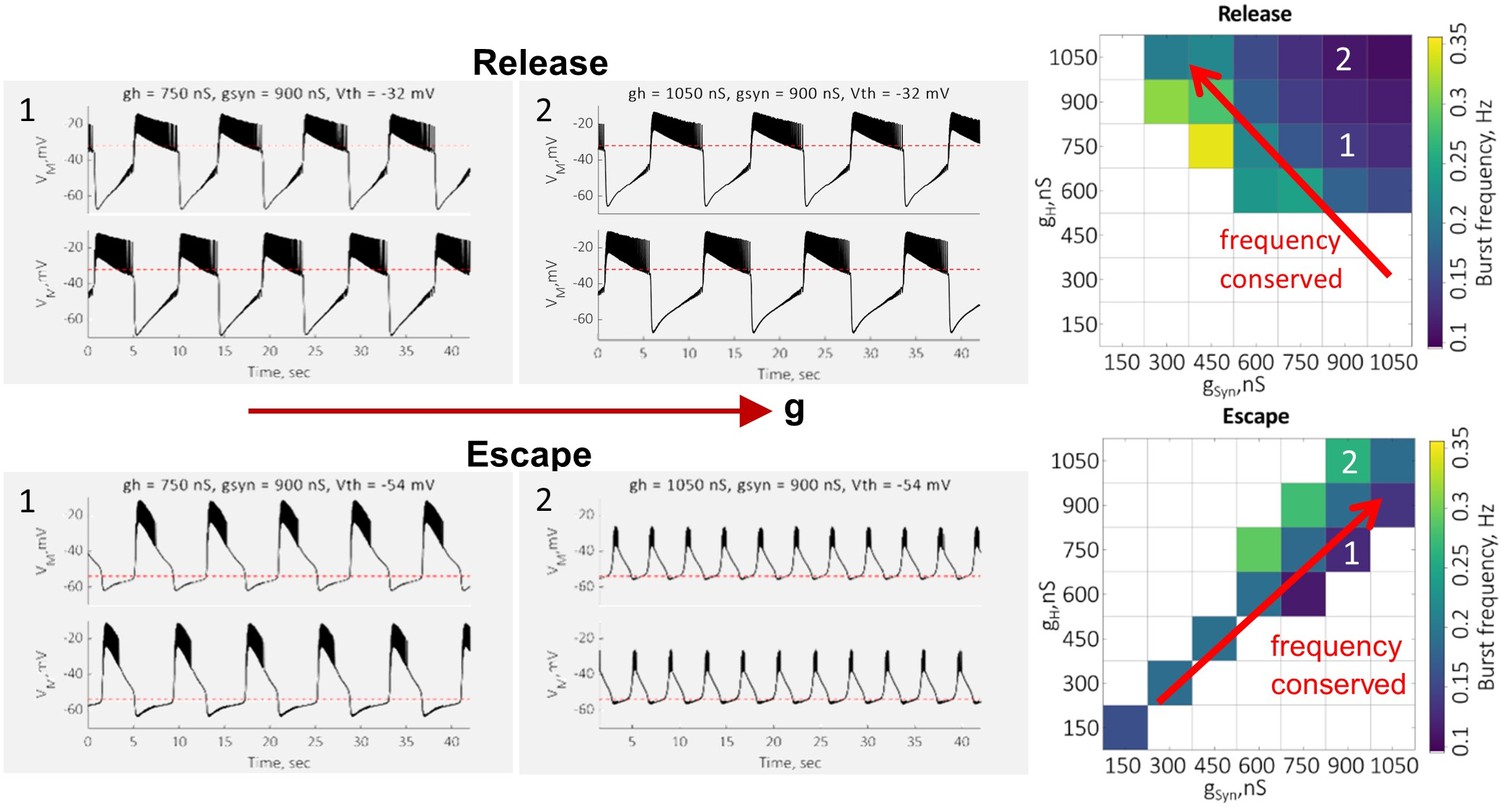
Author response image 2
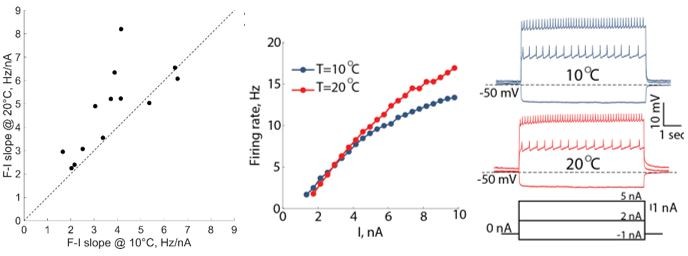
Author response image 3
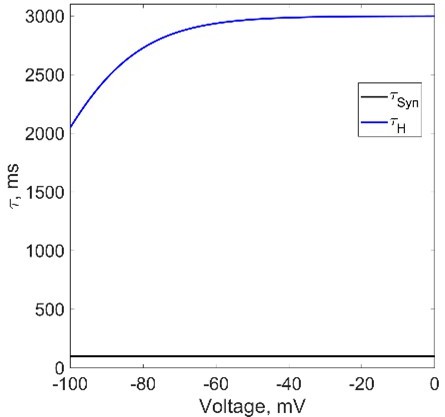
Author response image 4
Tables
Key resources table
| Reagent type (species) or resource | Designation | Source or reference | Identifiers | Additional information |
|---|---|---|---|---|
| Biological sample(Jonah Crabs) | Cancer borealis (Jonah Crabs)Adult Male | Commercial Lobster (Boston, MA) | NCBI:txid39395 | |
| Chemical compound, drug | Picrotoxin (PTX) | Sigma-Aldrich | ||
| Chemical compound, drug | Tetrodotoxin (TTX) | Alamone labs | T-550 | |
| Software, algorithm | Dynamic clamp | Real-Time eXperiment Interface (RTXI) software versions 1.4 and 2.2 | http://rtxi.org/ | |
| Software, algorithm | pClamp version 10.5 | Molecular Devices, San Jose | https://www.moleculardevices.com/products/axon-patch-clamp-system/acquisition-and-analysis-software/pclamp-software-suiteRRID: SCR_011323 | |
| Software, algorithm | MATLAB R2020a | MathWorks | https://www.mathworks.com/products/matlab.html | |
| Software, algorithm | IBM SPSS Statistics 24 | IBM | RRID:SCR_002865 | |
| Software, algorithm | Adobe Illustrator 2020 | Adobe | https://www.adobe.com/products/illustrator.html |
Table 1
Parameter values for the dynamic clamp.
| Parameter | Value | Description |
|---|---|---|
| Synaptic current ( ) | ||
| Varied from 150 to 1,050 nS | Maximal conductance of synaptic current | |
| –80 mV | Reversal potential of synaptic current | |
| Varied from –28 to –54 mV | Synaptic threshold voltage | |
| 50 or 100 msec | Synaptic time constant | |
| –2 mV | Slope factor of synaptic activation function | |
| Hyperpolarization-activated inward current ( ) | ||
| Varied from 150 to 1,050 nS | Maximal conductance of H current | |
| –10 mV | Reversal potential of H current | |
| –50 mV | Half-maximal activation voltage of H current | |
| 7 mV | Slope factor of H current activation function | |
| 2000 or 3000 msec | Time constant of H current | |
| –110 mV | Half-maximal voltage of H current time constant | |
| –13 mV | Slope factor of H current time constant | |
| Neuromodulatory inward current ( ) | ||
| 100, 150 or 200 nS | Maximal conductance of neuromodulatory current | |
| –20 mV | Reversal potential of neuromodulatory current | |
| –21 mV | Half-maximal activation voltage of | |
| 4 msec | Time constant of neuromodulatory current | |
| –8 mV | Slope factor of activation function | |
Additional files
-
Supplementary file 1
Summary statistics for the temperature experiments.
(a) Mean ± SD of output characteristics of the circuits in escape and release at 10°C and 20°C. (b) Significance analysis of the cycle frequency, spike frequency, number of spikes per burst, slow wave amplitude, duty cycle and ERQ at 10°C and 20°C. (c-h) Significance analysis of the change in the output characteristics of the circuits in escape and release with different temperature-dependencies.
- https://cdn.elifesciences.org/articles/74363/elife-74363-supp1-v2.docx
-
Transparent reporting form
- https://cdn.elifesciences.org/articles/74363/elife-74363-transrepform1-v2.docx
Download links
A two-part list of links to download the article, or parts of the article, in various formats.
Downloads (link to download the article as PDF)
Open citations (links to open the citations from this article in various online reference manager services)
Cite this article (links to download the citations from this article in formats compatible with various reference manager tools)
Reciprocally inhibitory circuits operating with distinct mechanisms are differently robust to perturbation and modulation
eLife 11:e74363.
https://doi.org/10.7554/eLife.74363


