Dcp2 C-terminal cis-binding elements control selective targeting of the decapping enzyme by forming distinct decapping complexes
- Department of Microbiology and Physiological Systems, University of Massachusetts Chan Medical School, United States
Figures
Figure 1 with 2 supplements
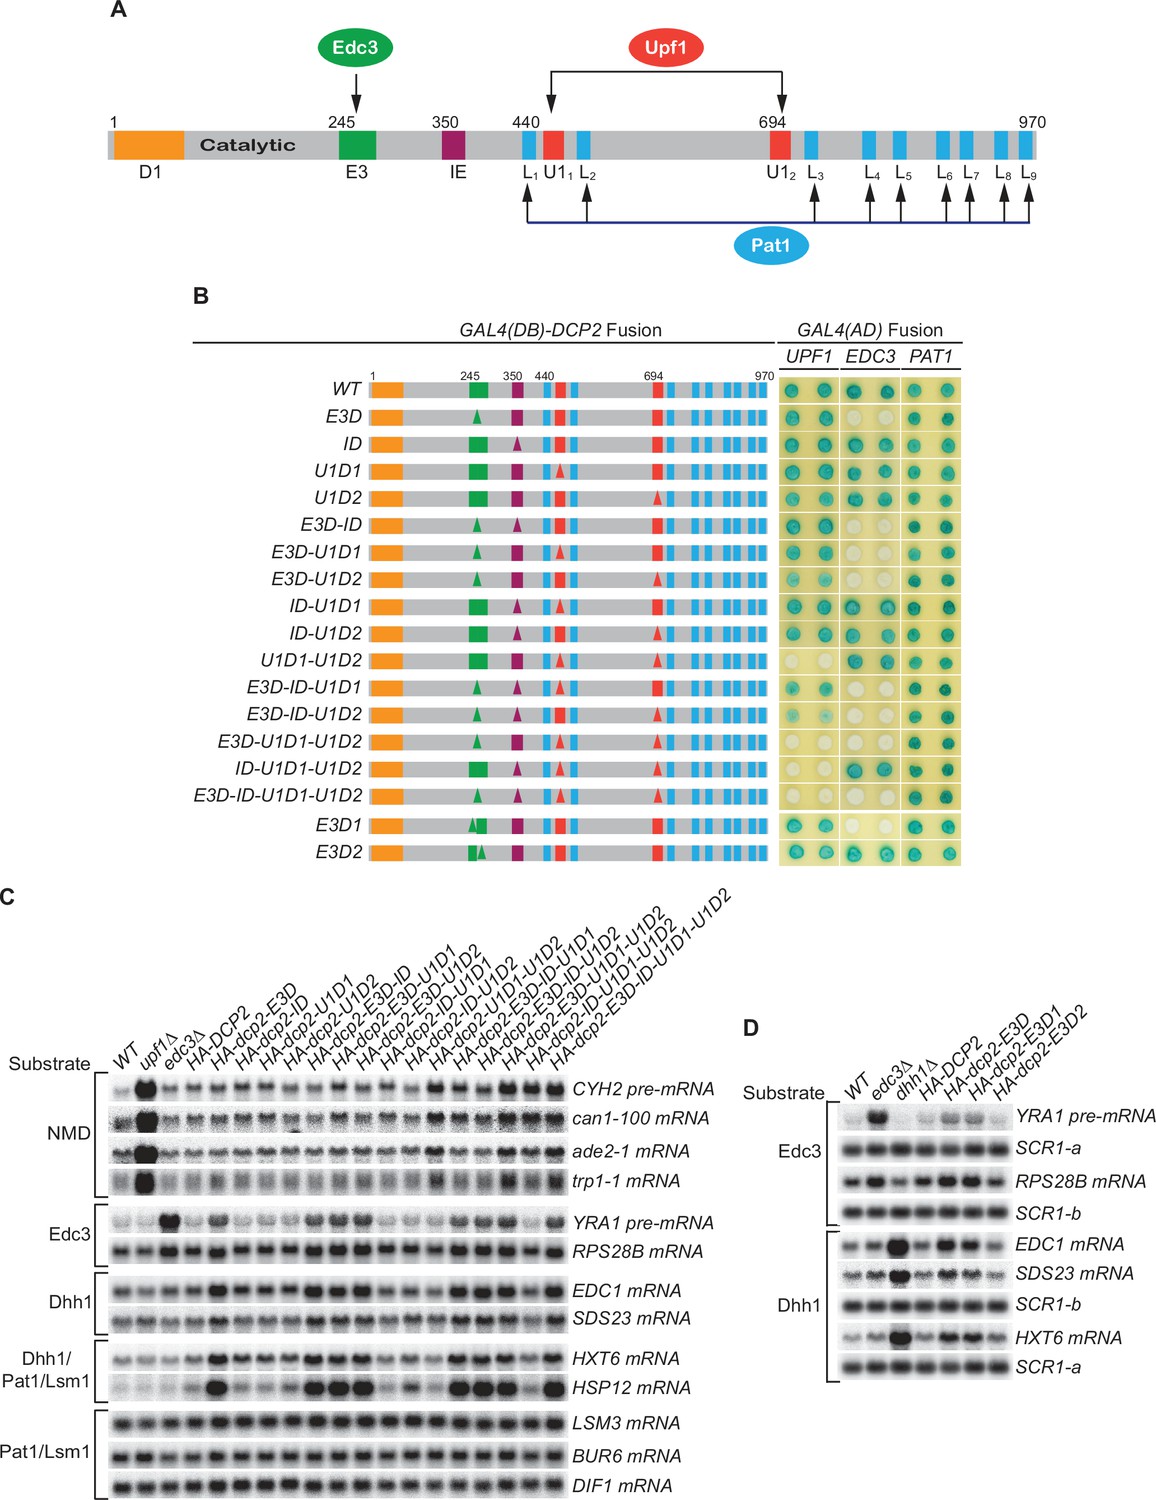
Consequences of deleting Dcp2’s Edc3- and Upf1-binding motifs, and its inhibitory element.
(A) Dcp2 schematic depicting its distinct regulatory elements. D1, Dcp1-binding site; E3, Edc3-binding motif; U11 and U12, Upf1-binding motifs; L1–L9, leucine-rich Pat1-binding motifs; IE, the inhibitory element. (B) Two-hybrid assays evaluating the consequences of specific dcp2 deletions on Dcp2 interactions with Upf1, Edc3, and Pat1. Left, schematics of deletion alleles, with specific element deletions marked by triangles. The letter D in the allele names is used to indicate that a specific element has been deleted, such that E3D denotes deletion of the E3 element, U1D1 denotes deletion of the U11 element, etc. Right, two-hybrid colony color assays, duplicated horizontally, with blue color indicating interaction and white indicating no interaction. (C) Northern analyses of individual transcript levels in cells expressing specific dcp2 deletion alleles or harboring deletions of UPF1 or EDC3. Groupings depict transcripts subject to common regulation. (D) Northern analyses of Edc3 and Dhh1 substrates in cells expressing dcp2 alleles deleted for E3-1 or E3-2, or harboring deletions of EDC3 or DHH1. Further analyses of the transcripts considered in (C) and (D) are presented in Figure 1—figure supplement 1 and Figure 1—figure supplement 2. In all blots, lower case letters denote SCR1 blots duplicated for clarity of presentation.
-
Figure 1—source data 1
Northern analyses of Edc3 and Dhh1 substrates in cells harboring the E3-1 or E3-2 deletions of DCP2 or deletions of EDC3 or DHH1 (Figure 1D).
- https://cdn.elifesciences.org/articles/74410/elife-74410-fig1-data1-v2.zip
Figure 1—figure supplement 1
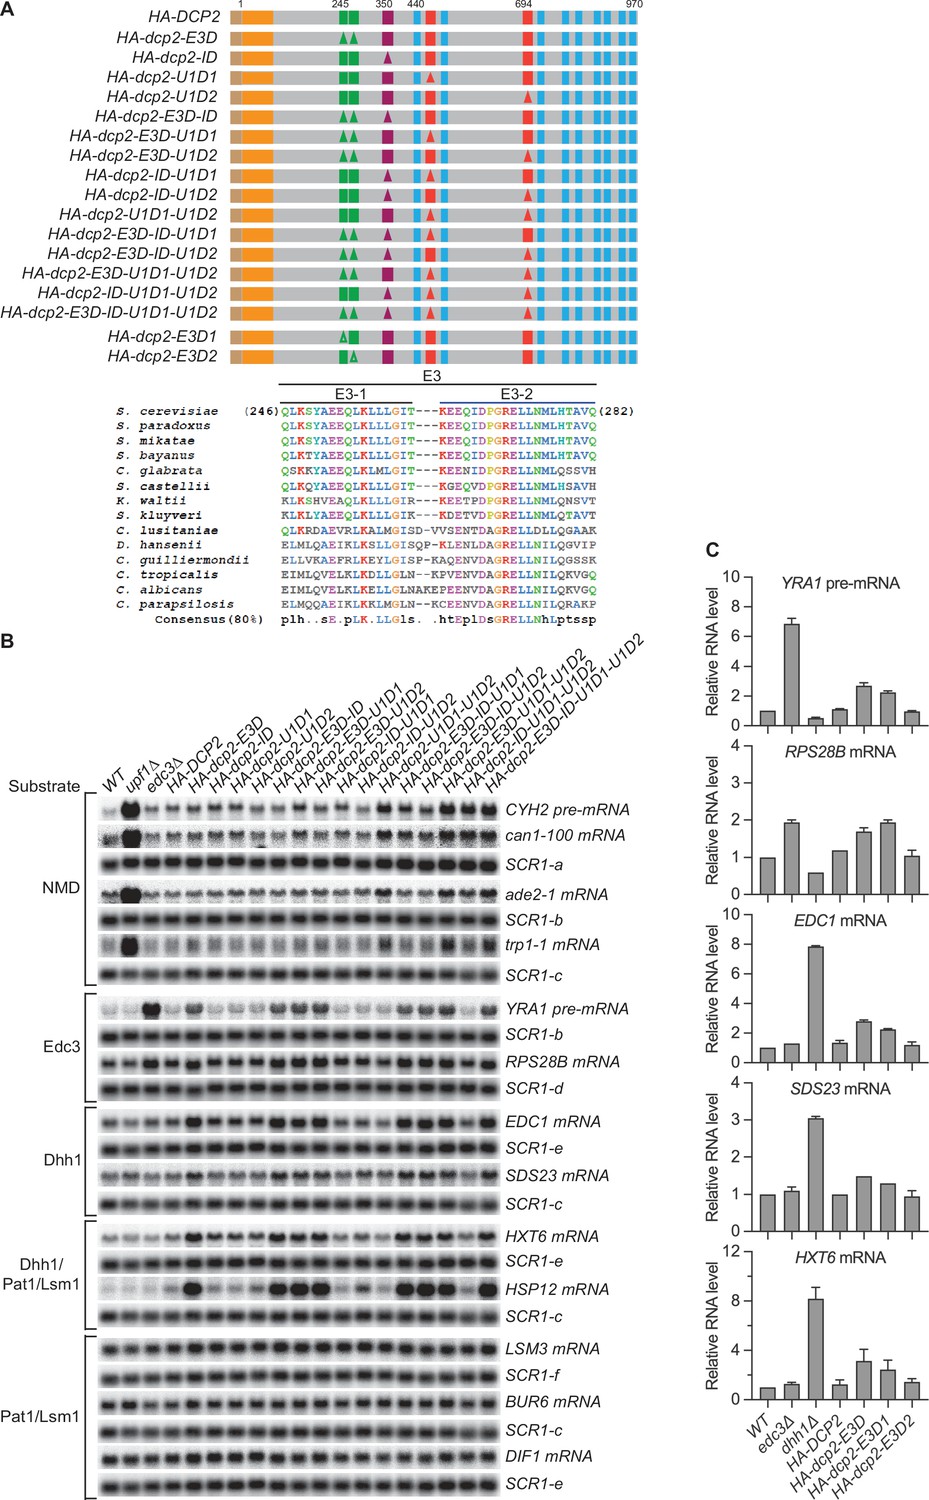
Loss of the Upf1- and Edc3-binding motifs, respectively, causes selective stabilization of nonsense-mediated mRNA decay (NMD) or Edc3/Dhh1 substrates.
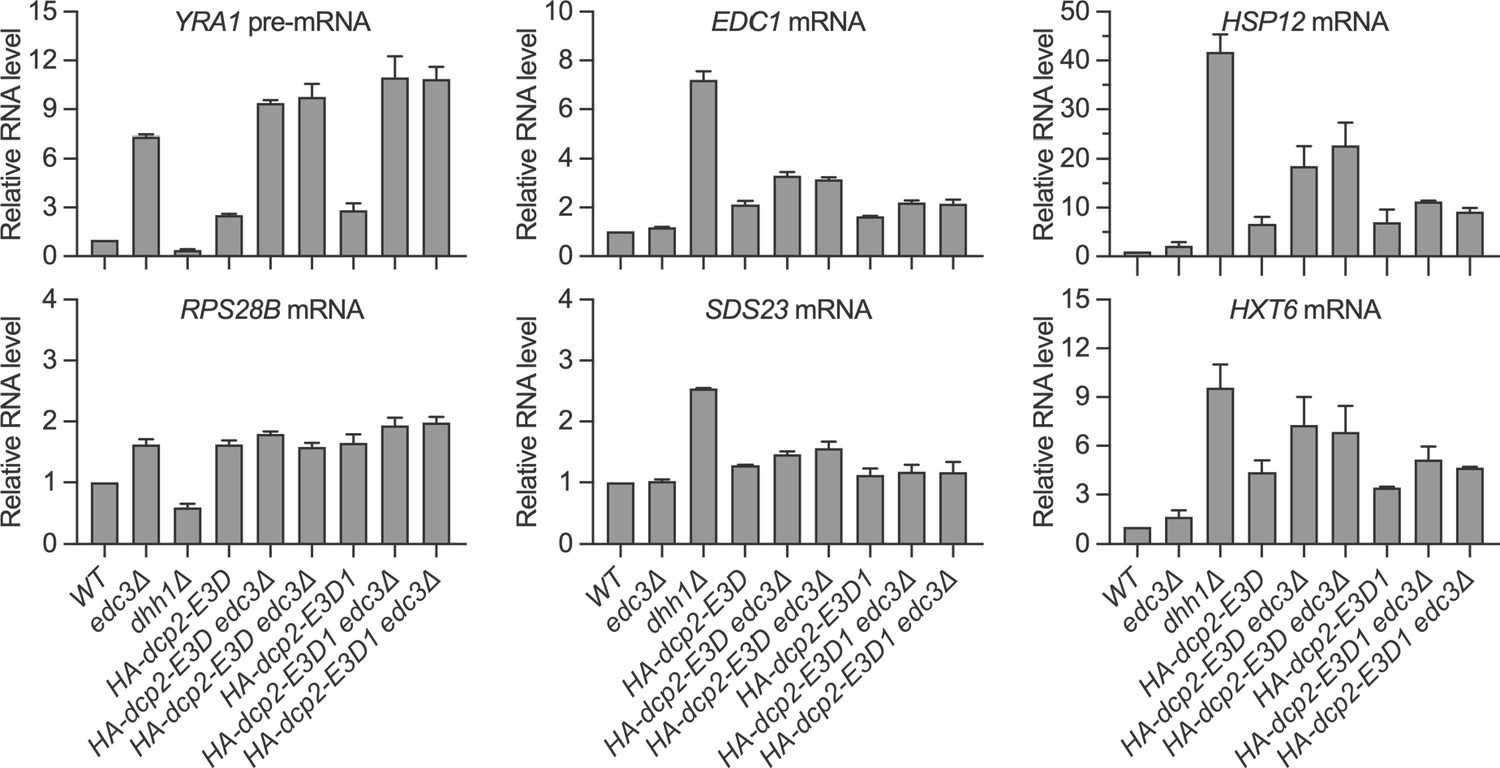
(A) Schematics of dcp2 alleles harboring specific deletions of the inhibitory element and the Edc3- and Upf1-binding motifs. Each of the dcp2 alleles contains a triple HA-tag at its N-terminus and was integrated at the DCP2 genomic locus for phenotypic analysis of mRNA decay. Specific element deletions are marked by filled triangles. The lower part of the panel displays the amino acid sequences and conservation patterns of the originally designated Edc3-binding site and its composite motifs, E3-1 and E3-2. Our data indicate that Edc3 binds to the E3-1 motif (see Figure 1B). (B) Northern analyses of individual transcript levels in cells expressing specific dcp2 deletion alleles or harboring deletions of UPF1 or EDC3. Groupings depict transcripts subject to common regulation. The northern blots shown here are the same as those in Figure 1C but contain their respective matched loading control SCR1 blots. In all blots, lower case letters denote SCR1 blots duplicated for clarity of presentation. (C) Bar graphs of average ± SEM for the northern analyses depicted in Figure 1D. The relative levels of each decapping substrate in different strains were determined from three independent experiments, with one representative blot for each transcript shown in Figure 1D. In each case, the relative RNA levels in different mutants were calculated by comparisons to the levels of the respective transcripts in wild-type cells.
-
Figure 1—figure supplement 1—source data 1
Northern analyses of different decapping substrates in cells harboring specific dcp2 deletions of the inhibitory element and the Edc3- or Upf1-binding motifs (Figure 1B).
- https://cdn.elifesciences.org/articles/74410/elife-74410-fig1-figsupp1-data1-v2.zip
Figure 1—figure supplement 2
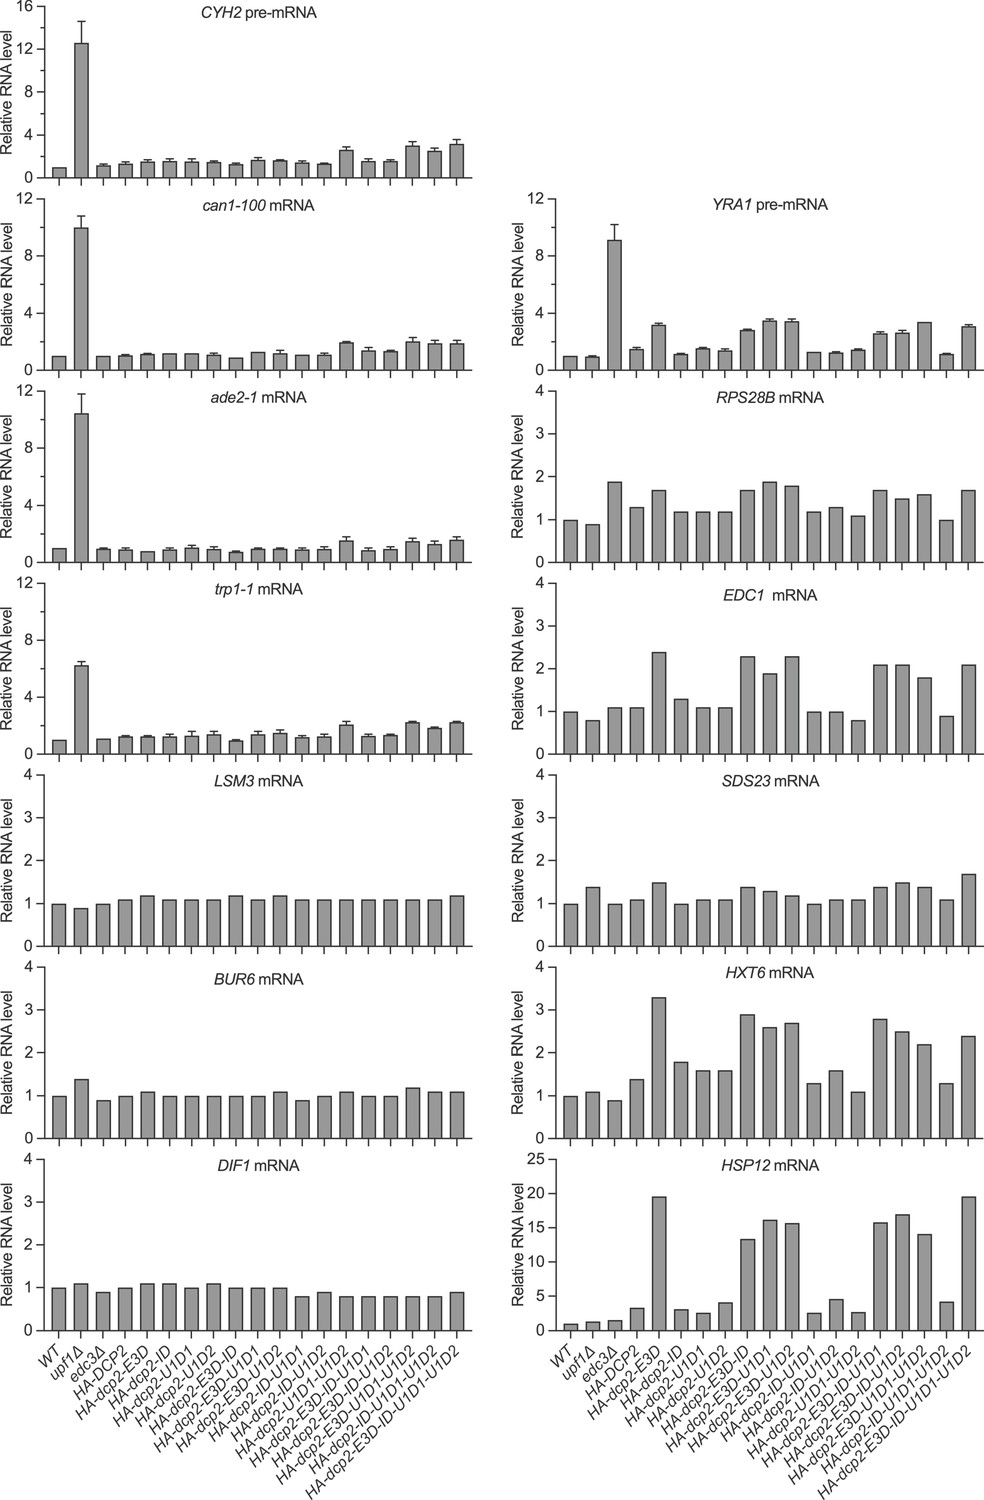
Loss of the Upf1- and Edc3-binding motifs, respectively, causes selective stabilization of nonsense-mediated mRNA decay (NMD) or Edc3/Dhh1 substrates.
Bar graphs for the northern analyses depicted in Figure 1C and for additional blots for CYH2 and YRA1-pre-mRNAs, and can1-100, ade2-1, trp1-1, and LSM3 mRNAs from independent experiments. In each case, relative RNA levels in different mutants were determined by comparisons to the levels of the same transcripts in wild-type cells. The graphs depict either single measurements or the average ± SEM. Eight graphs (RPS28B, EDC1, SDS23, HXT6, HSP12, LSM3, BUR6, and DIF1 mRNAs) in this figure did not have error bars. However, the phenotypic analyses for each of these transcripts in the relevant dcp2 element mutants were independently repeated in our subsequent experiments shown in Figures 1D, 3B,, 4B, E.
Figure 2 with 1 supplement
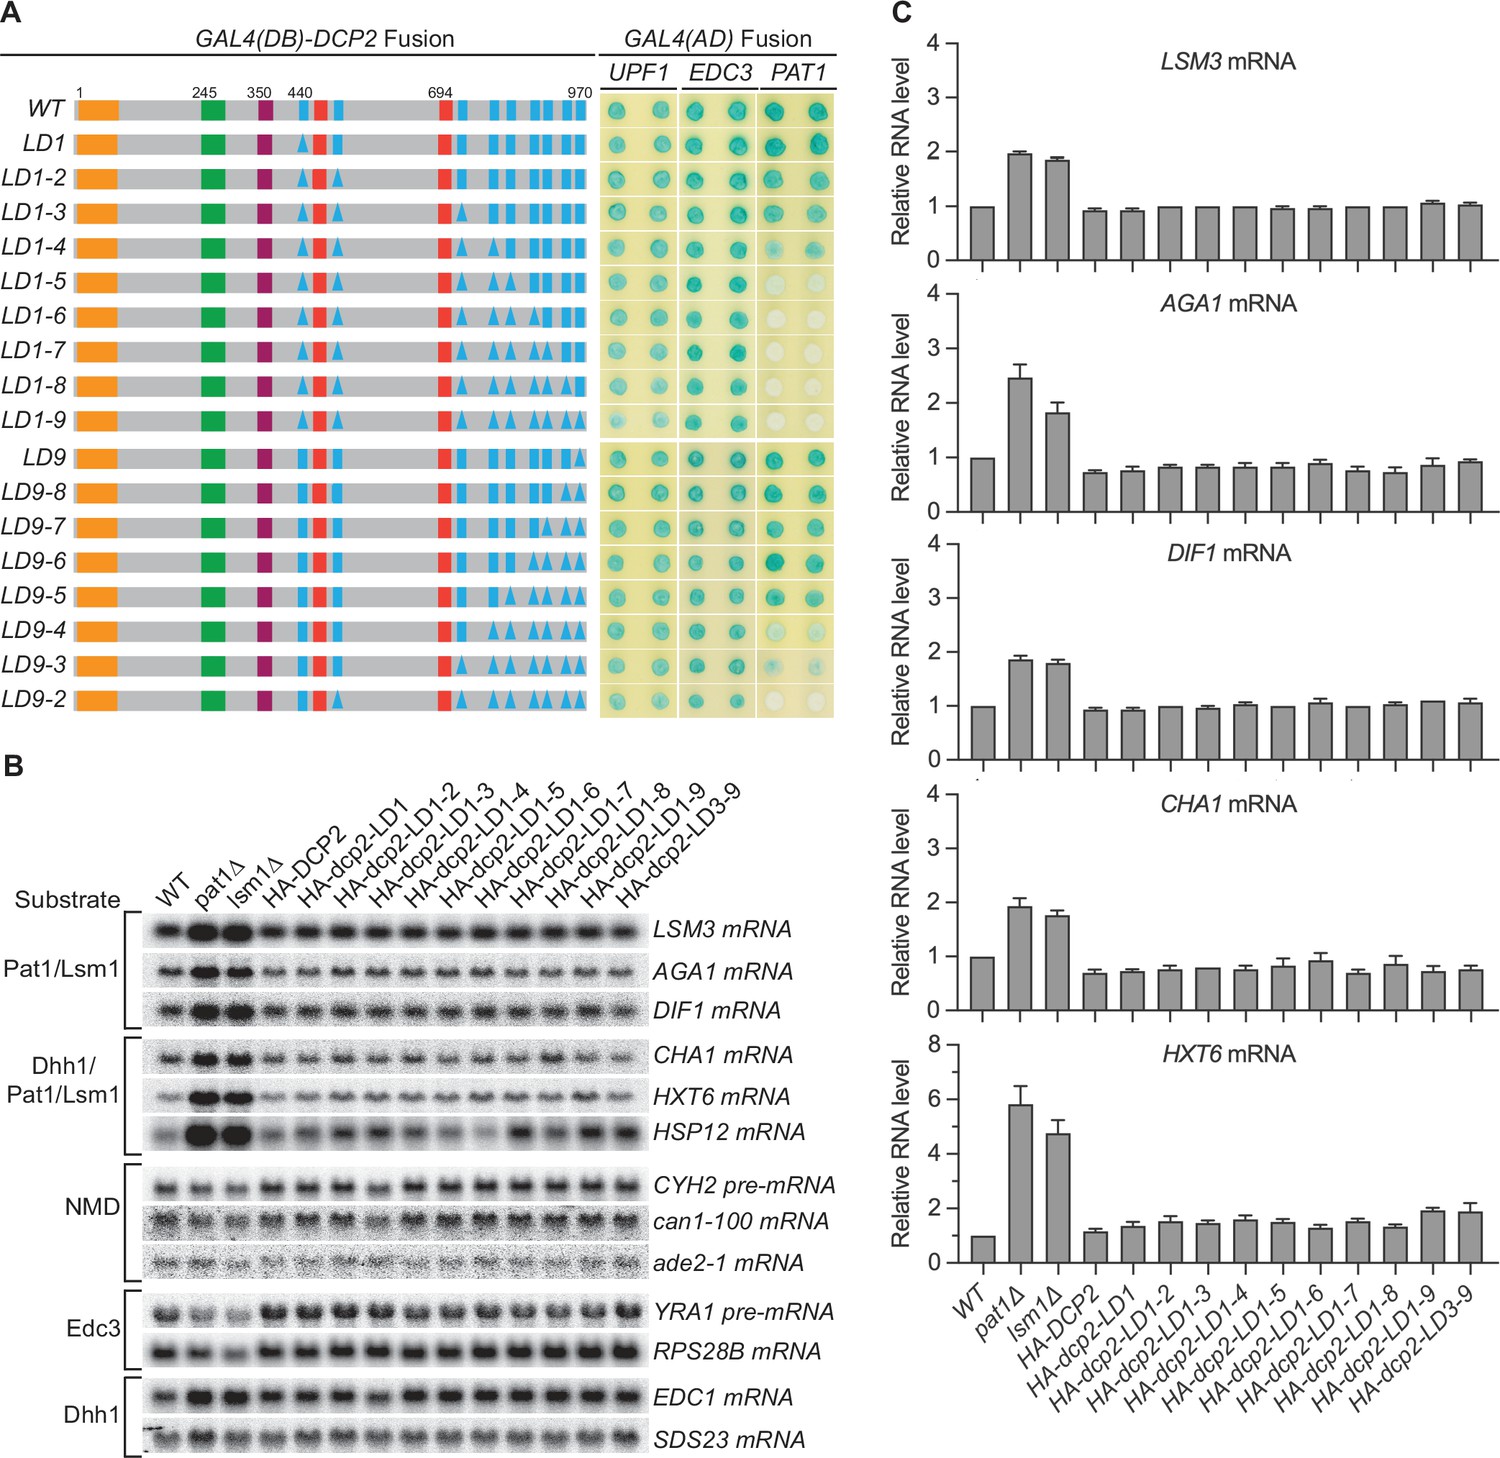
Consequences of deleting Dcp2 leucine-rich Pat1-binding motifs.
(A) Two-hybrid assays evaluating the consequences of deleting the leucine-rich motifs (L1–L9) from the Dcp2 C-terminal domain. As in Figure 1B, schematics of the individual dcp2 alleles are shown on the left (with specific element deletions denoted by triangles) and duplicate two-hybrid assays are on the right. (B) Northern analyses of individual Pat1/Lsm1 and Pat1/Lsm1/Dhh1 substrate levels in cells harboring individual or combined deletions of Dcp2 leucine-rich motifs. (C) Bar graphs of average ± SEM for a subset of the northern analyses depicted in B. The relative levels of each decapping substrate in different strains were determined from three independent experiments, with one representative blot for each transcript shown in panel B. See also Figure 2—figure supplement 1.
Figure 2—figure supplement 1
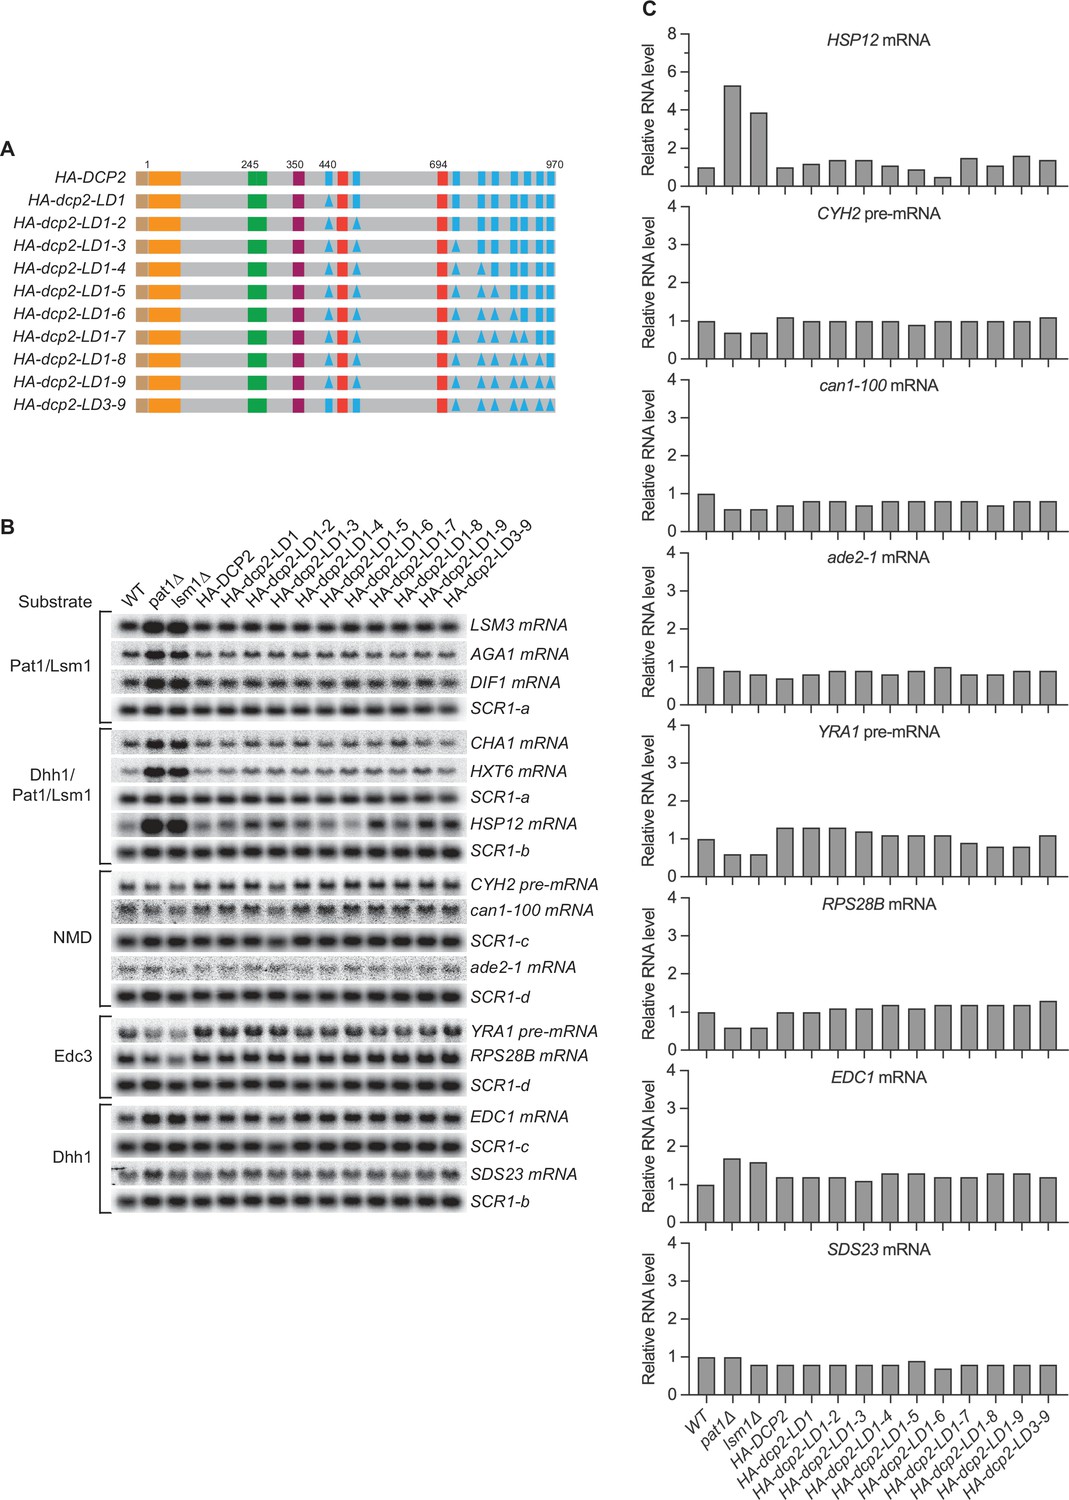
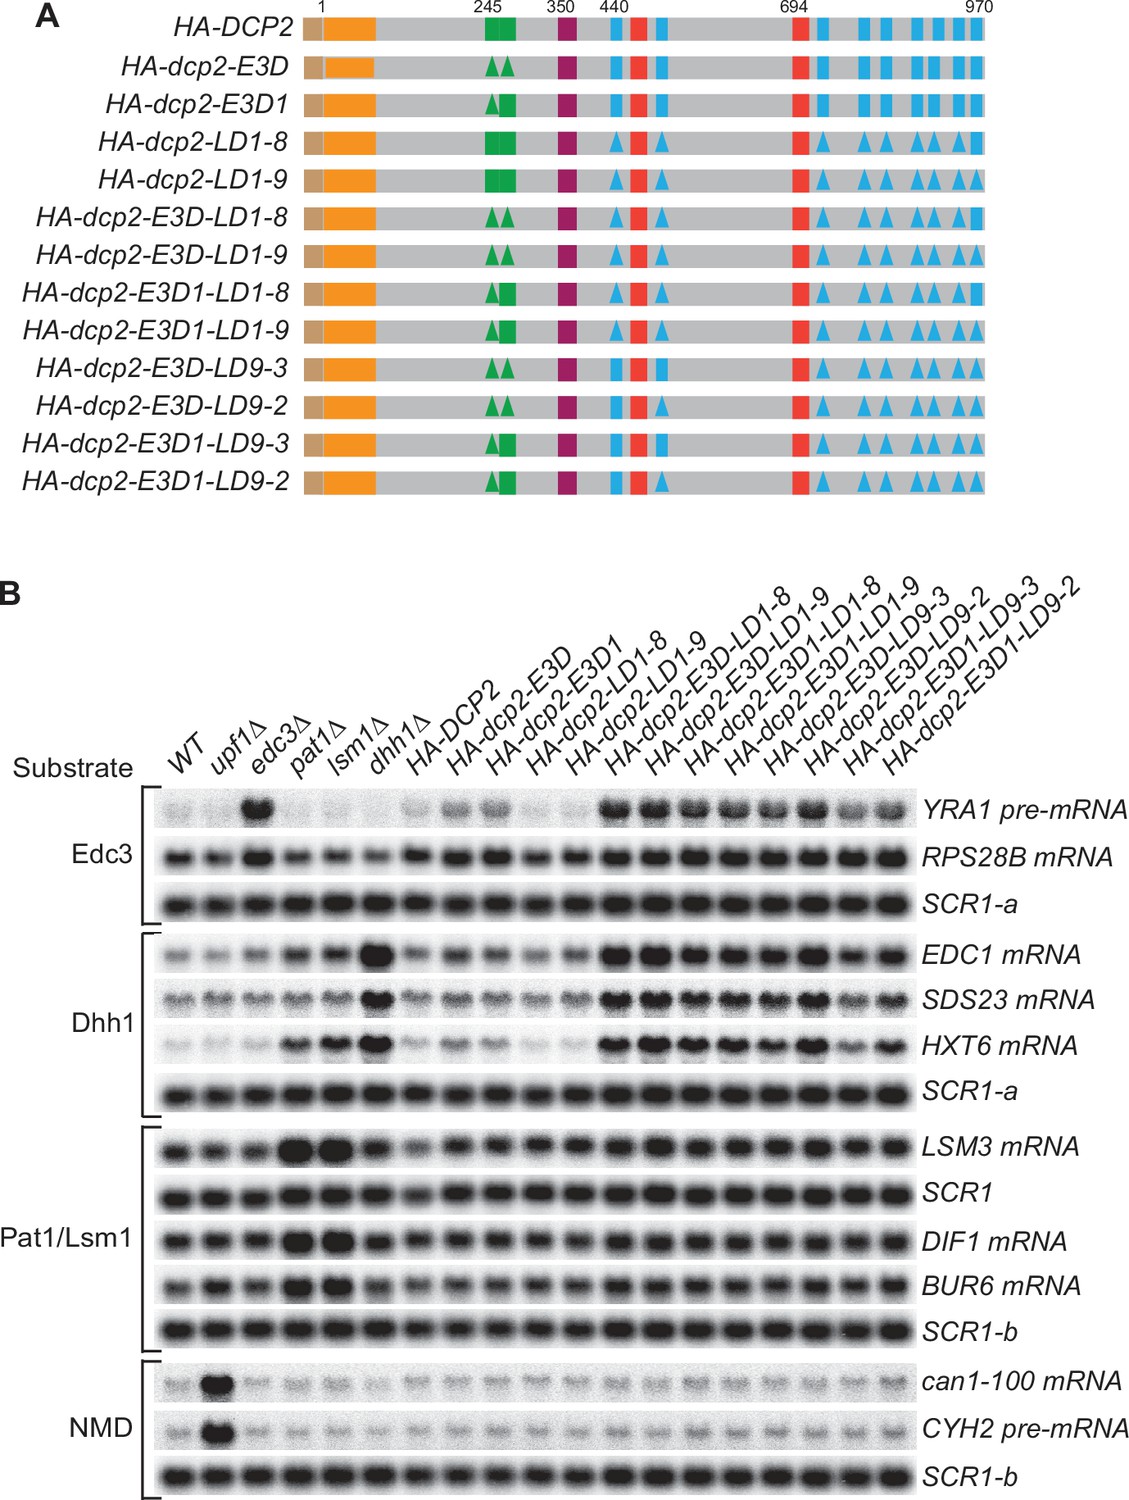
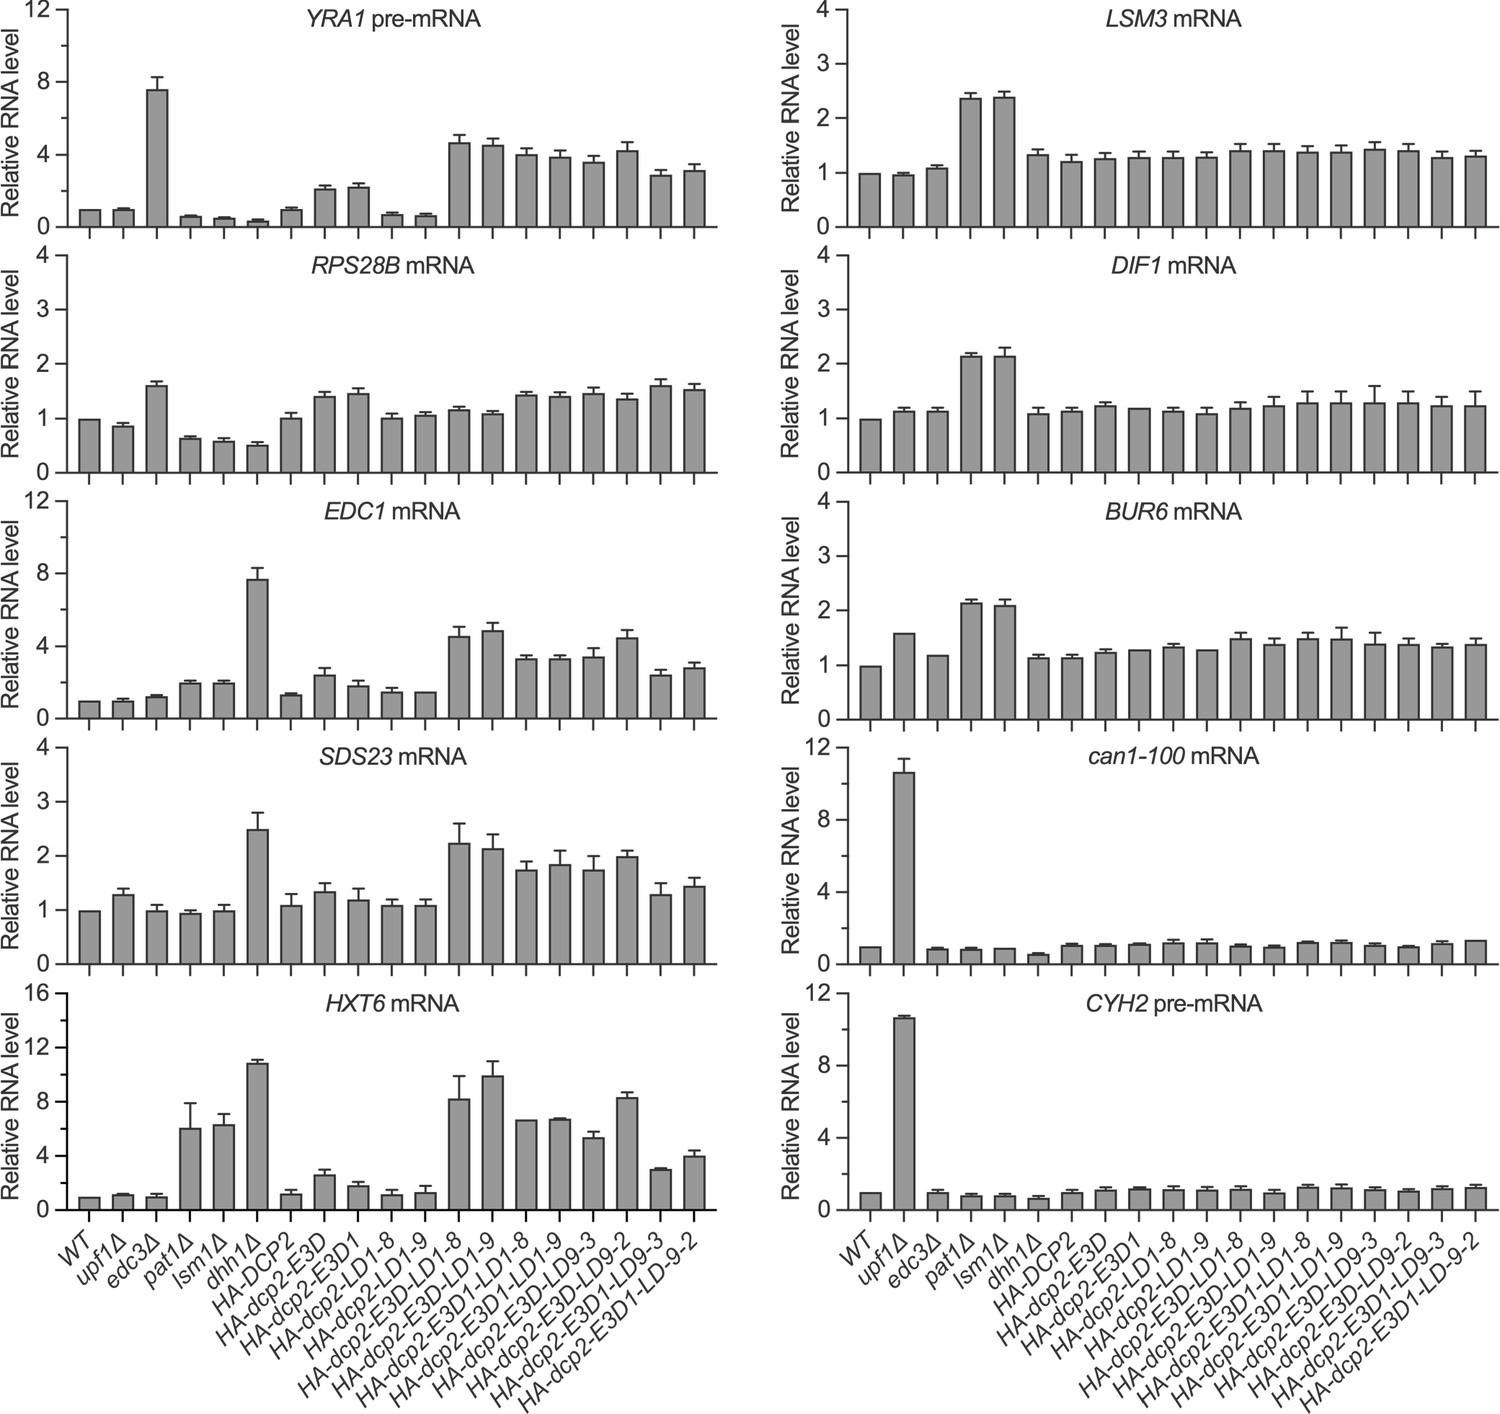
Loss of single, multiple, or even all nine leucine-rich motifs has no effect on decay of Pat1/Lsm1 and Pat1/Lsm1/Dhh1 substrates.
(A) Schematics of dcp2 alleles harboring specific deletions of the leucine-rich Pat1-binding motifs. Each dcp2 allele contains a triple HA-tag at its N-terminus and was integrated at the DCP2 genomic locus for phenotypic analysis of mRNA decay. Specific element deletions are marked by filled triangles. (B) Northern analyses of individual Pat1/Lsm1 and Pat1/Lsm1/Dhh1 substrate levels in cells harboring individual or combined deletions of Dcp2 leucine-rich motifs. The northern blots shown here are the same as those in Figure 2B but contain matched loading control SCR1 blots. In all blots, lower case letters denote SCR1 blots duplicated for clarity of presentation. (C) Bar graphs for a subset of the northern analyses depicted in Figure 2B. In each case, the relative RNA levels in different mutants were determined by comparison to the levels of the same transcripts in wild-type cells. The graphs depict data from single measurements. Eight graphs (HSP12, can1-100, ade2-1, RPS28B, EDC1, and SDS23 mRNAs, and CYH2 and YRA1 pre-mRNAs) in this figure did not have error bars. However, the phenotypic analyses for six out eight of these substrates in relevant dcp2 element mutants were independently repeated in our subsequent experiments (Figure 4B).
-
Figure 2—figure supplement 1—source data 1
Northern analyses of different decapping substrate levels in cells harboring individual or combined deletions of Dcp2 leucine-rich motifs.
- https://cdn.elifesciences.org/articles/74410/elife-74410-fig2-figsupp1-data1-v2.zip
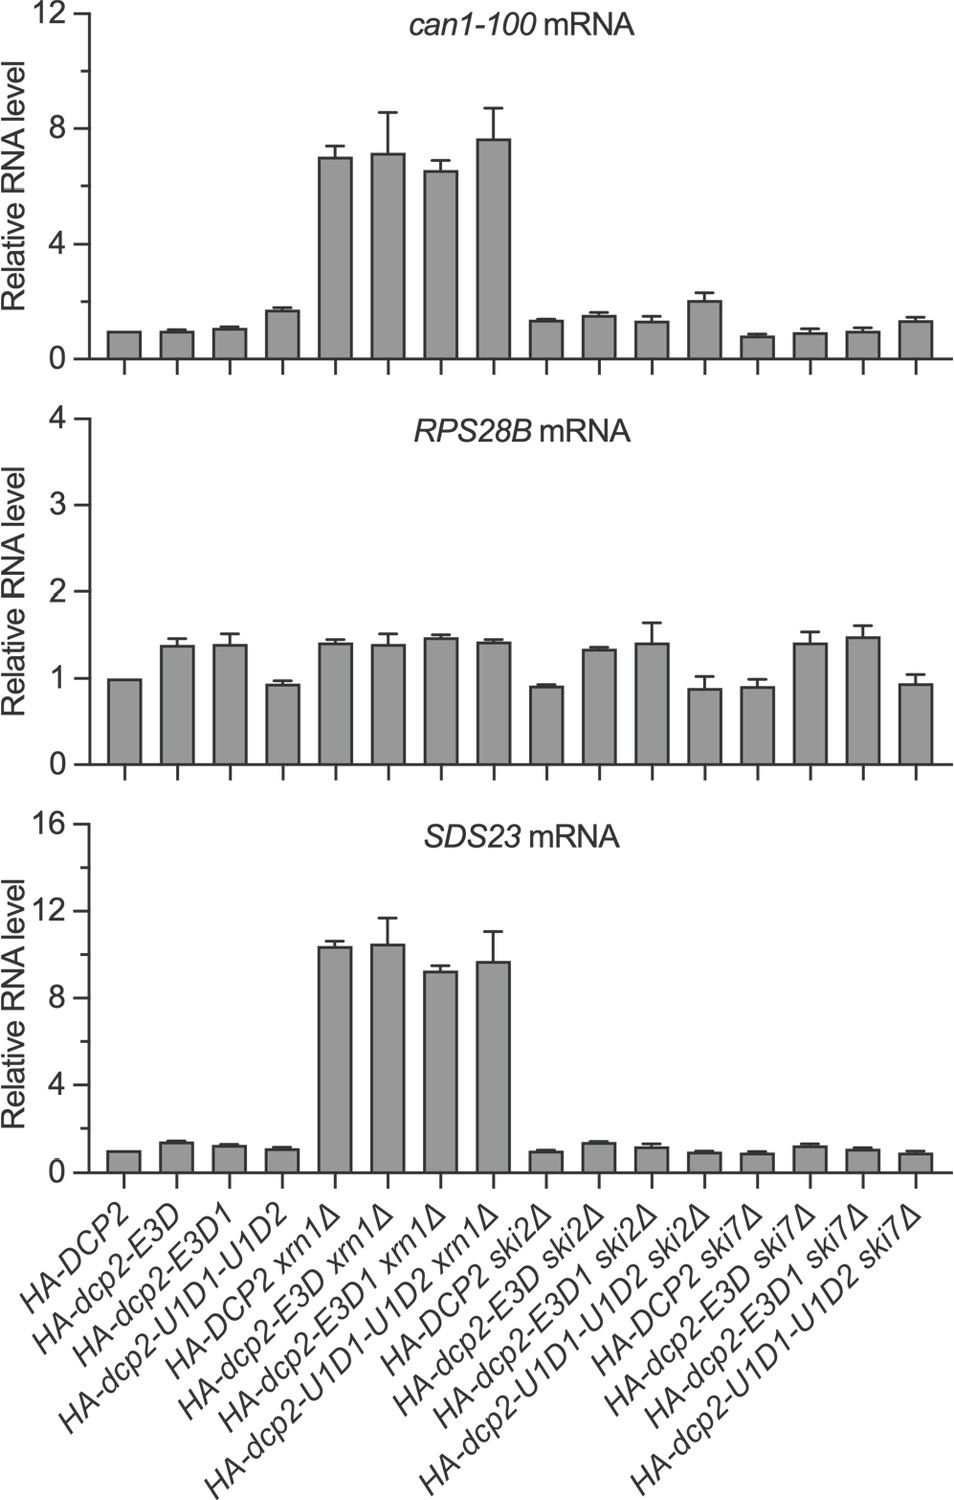
Figure 3 with 1 supplement
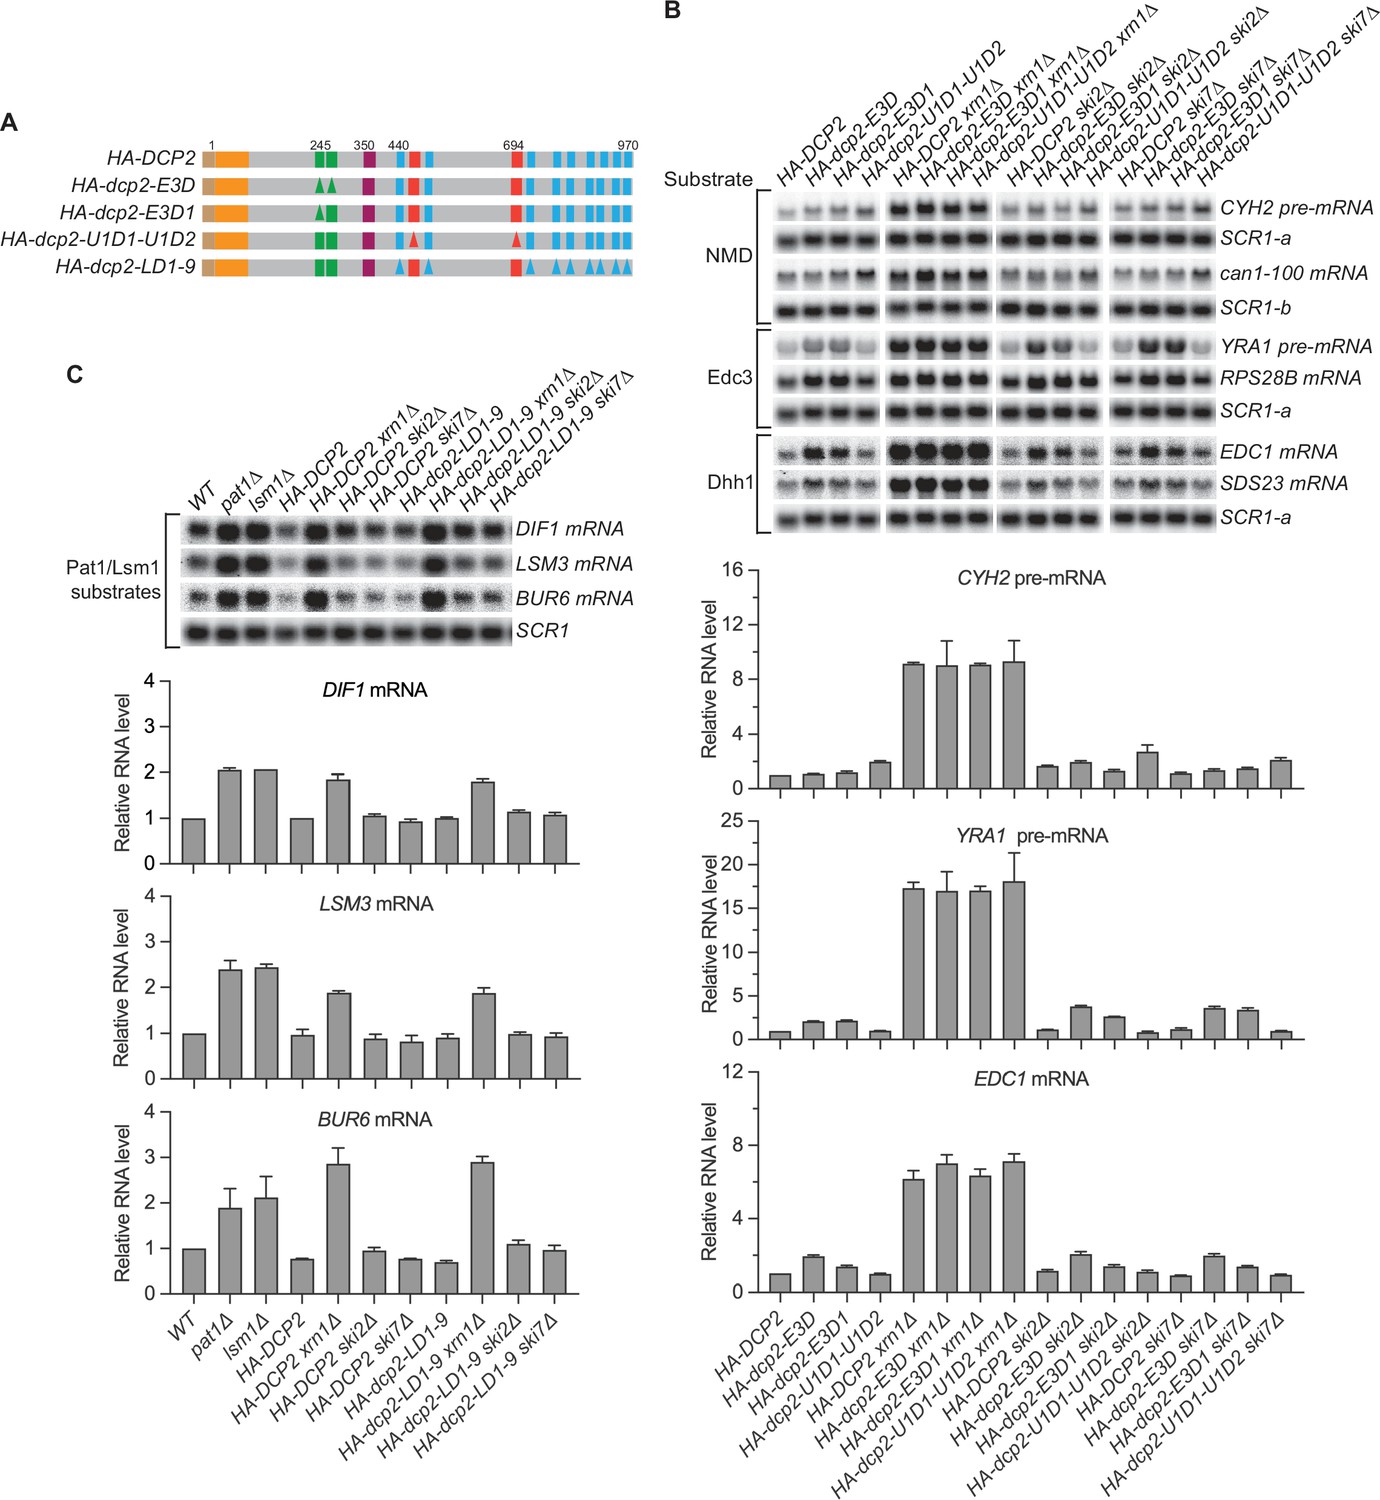
Nonsense-mediated mRNA decay (NMD), Edc3, Dhh1, and Pat1 substrates are still degraded by decapping-dependent 5′ to 3′ decay in the absence of active decapping enzyme recruitment.
(A) Schematics of dcp2 alleles that eliminate Edc3, Upf1, or Pat1 binding to Dcp2. (B) Deletion of XRN1, but not deletions of SKI2 or SKI7, causes significant stabilization of NMD substrates in HA-dcp2-U1D1-U1D2 cells, and Edc3 and Dhh1 substrates in HA-dcp2-E3D or E3D1 cells. (C) Deletion of XRN1, but not deletions of SKI2 or SKI7, causes significant stabilization of Pat1 substrates in HA-dcp2-LD1-9 cells. Northern analyses in B and C as in Figures 1 and 2. Bar graphs in lower panels of B and C depict relative levels of decapping substrates in different strains determined from average ± SEM of three independent experiments. One representative northern blot for each transcript is shown in the upper panels. In the upper panel of B, lower case letters denote SCR1 blots duplicated for clarity of presentation. See also Figure 3—figure supplement 1.
-
Figure 3—source data 1
Northern analyses of different nonsense-mediated mRNA decay (NMD), Edc3, and Dhh1 substrates in cells harboring the HA-dcp2-U1D1-U1D2, E3D, or E3D1 alleles and deletions of XRN1, SKI2, or SKI7 (Figure 3B).
- https://cdn.elifesciences.org/articles/74410/elife-74410-fig3-data1-v2.zip
-
Figure 3—source data 2
Northern analyses of different Pat1 substrates in cells harboring the HA-dcp2-LD1-9 allele and deletions of XRN1, SKI2, or SKI7 (Figure 3C).
- https://cdn.elifesciences.org/articles/74410/elife-74410-fig3-data2-v2.zip
Figure 3—figure supplement 1
Nonsense-mediated mRNA decay (NMD), Edc3, and Dhh1 substrates are still degraded by decapping-dependent 5′ to 3′ decay in the absence of active recruitment of the decapping enzyme.
Bar graphs of average ± SEM for a subset of the northern analyses depicted in Figure 3B. The relative levels of each decapping substrate in different strains were determined from three independent experiments, with one representative blot for each transcript shown in Figure 3B. In each case, the relative RNA levels in different mutants were determined by comparison to the levels of the same transcripts in wild-type cells.
Figure 4 with 5 supplements
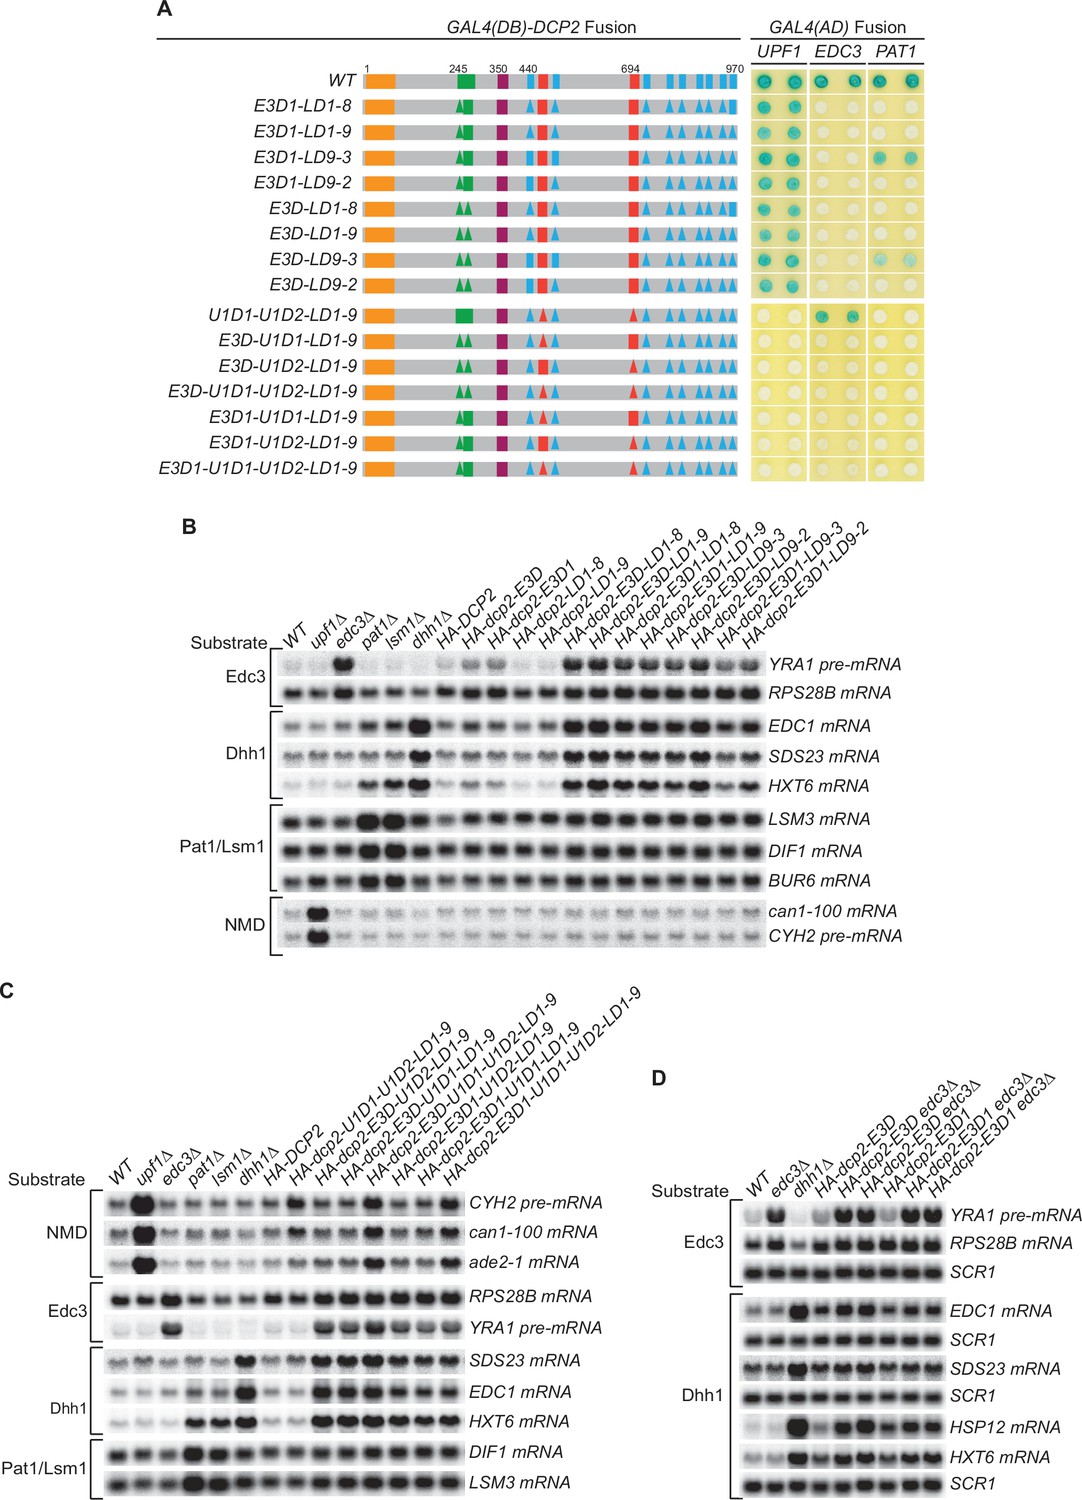
Genetic interactions between the Dcp2 Edc3-, Upf1-, and Pat1-binding motifs, or between the Edc3-binding motif and Edc3, that affect mRNA decapping.
(A) Two-hybrid assays examining the effects of different combinations of element deletions on Edc3, Upf1, and Pat1 binding to Dcp2. Allele schematics and two hybrid analyses are as in Figure 1B. (B) Northern analyses of the consequences of simultaneous loss of the Dcp2 Edc3-binding motif and leucine-rich motifs. See also Figure 4—figure supplement 1 and Figure 4—figure supplement 2. (C) Northern analyses of the consequences of simultaneous loss of the Dcp2 Upf1-binding motifs and leucine-rich motifs, and the roles of single Dcp2 Edc3 or Upf1-binding motifs. See also Figure 4—figure supplement 3 and Figure 4—figure supplement 4. (D) Northern analyses of the consequences for Edc3 and Dhh1 substrates caused by loss of the Dcp2 Edc3-binding motif and trans deletion of EDC3. See also Figure 4—figure supplement 5. Northern analyses as in Figures 1 and 2. Two-hybrid analyses as in Figure 1.
-
Figure 4—source data 1
Northern analyses of the consequences for Edc3 and Dhh1 substrates caused by loss of the Dcp2 Edc3-binding motif and trans deletion of EDC3 (Figure 4D).
- https://cdn.elifesciences.org/articles/74410/elife-74410-fig4-data1-v2.zip
Figure 4—figure supplement 1
Simultaneous loss of the Edc3-binding motif and the leucine-rich motifs has synergistic effects and causes substantial stabilization of both Edc3 and Dhh1 substrates.
(A) Schematics of dcp2 alleles harboring different combinations of deletions of the Edc3-binding motif and the leucine-rich Pat1-binding motifs. Each of the dcp2 alleles contains a triple HA-tag at its N-terminus and was integrated at the DCP2 genomic locus for phenotypic analysis of mRNA decay. Specific element deletions are marked by filled triangles. (B) Northern analyses of the consequences of simultaneous loss of the Dcp2 Edc3-binding motif and leucine-rich motifs. The northern blots shown here are the same as those in Figure 4B but contain matched loading control SCR1 blots. In all blots, lower case letters denote SCR1 blots duplicated for clarity of presentation.
-
Figure 4—figure supplement 1—source data 1
Northern analyses of the consequences of simultaneous loss of the Dcp2 Edc3-binding motif and leucine-rich motifs (Figure 4B).
- https://cdn.elifesciences.org/articles/74410/elife-74410-fig4-figsupp1-data1-v2.zip
Figure 4—figure supplement 2
Simultaneous loss of the Edc3-binding motif and the leucine-rich motifs has synergistic effects and causes substantial stabilization of both Edc3 and Dhh1 substrates.
Bar graphs of average ± SEM for the northern analyses depicted in Figure 4B. The relative levels of each decapping substrate in different strains were determined from two or three independent experiments, with one representative blot for each transcript shown in Figure 4B. In each case, the relative RNA levels in different mutants were determined by comparison to the levels of the same transcripts in wild-type cells.
Figure 4—figure supplement 3
Simultaneous loss of the Upf1-binding motifs and the leucine-rich motifs has no synergistic effects on mRNA decapping, and a single Edc3- or Upf1-binding motif alone can promote efficient decapping of Edc3 or nonsense-mediated mRNA decay (NMD) substrates.
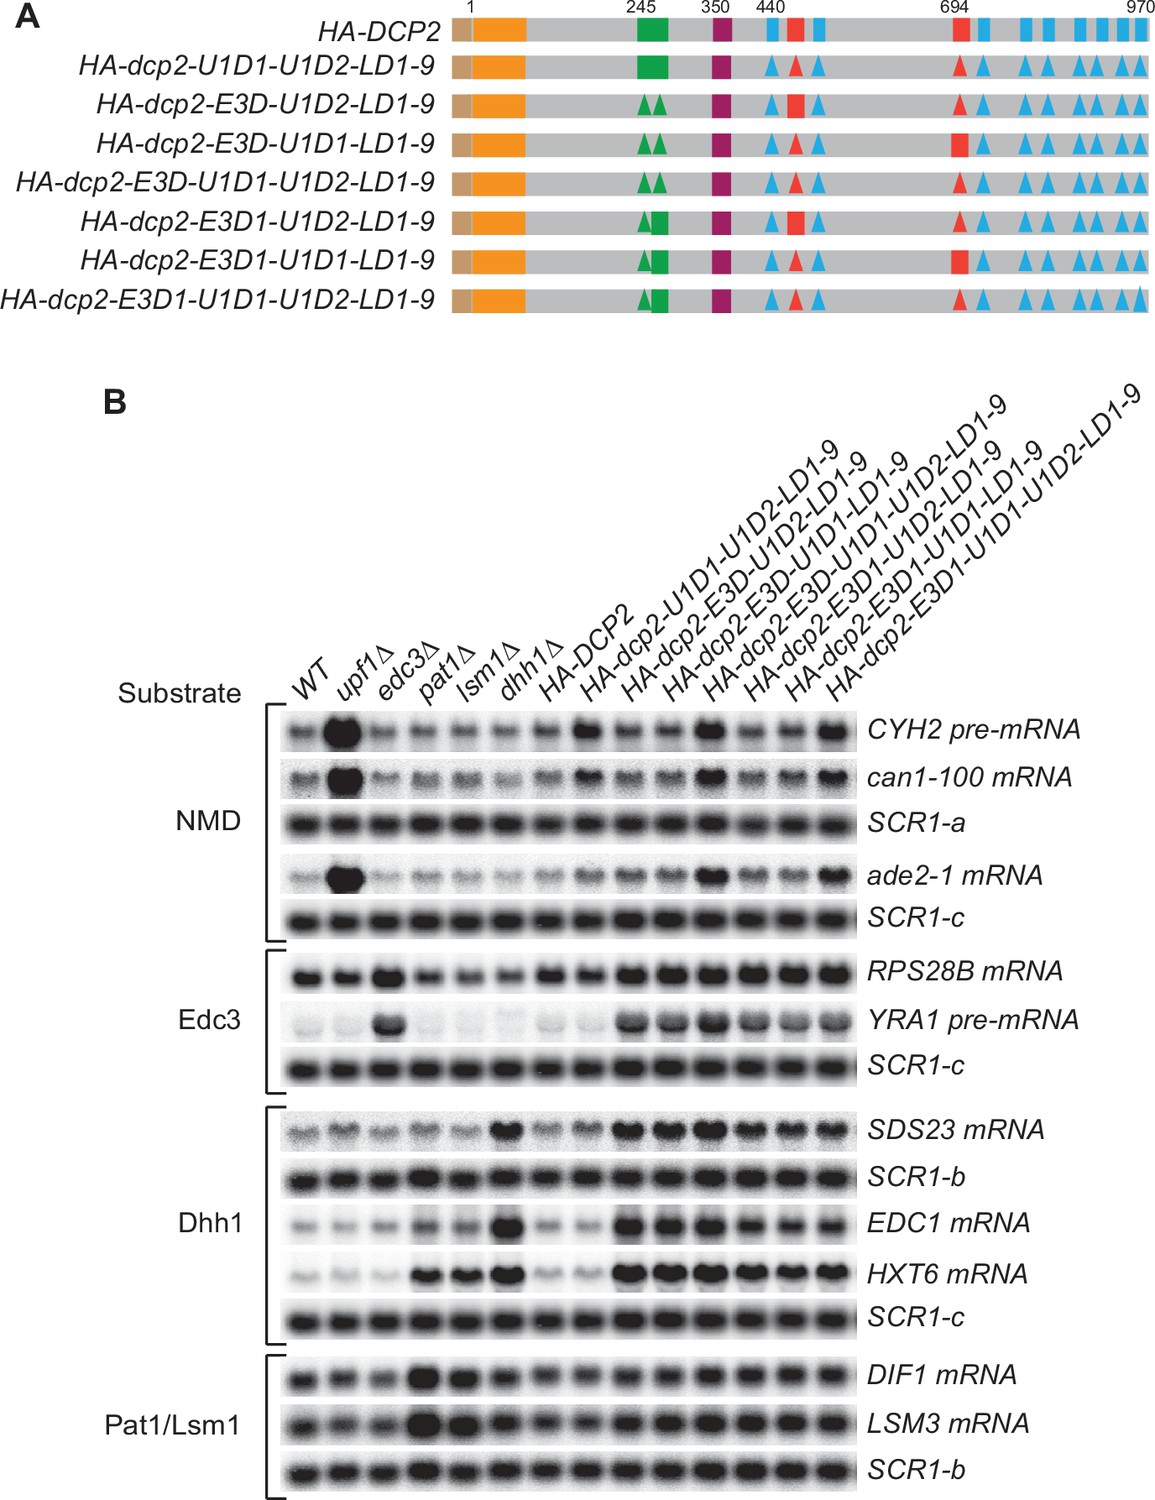
(A) Schematics of dcp2 alleles harboring different combinations of deletions of the Upf1-binding motifs, the Edc3-binding motif, and the leucine-rich Pat1-binding motifs. Each of these dcp2 alleles contains a triple HA-tag at its N-terminus and was integrated at the DCP2 genomic locus for phenotypic analysis of mRNA decay. Specific element deletions are marked by filled triangles. (B) Northern analyses of the consequences of simultaneous loss of the Dcp2 Upf1-binding motifs and leucine-rich motifs, and the roles of single Dcp2 Edc3- or Upf1-binding motifs. The northern blots shown here are same as those in Figure 4C but contain matched loading control SCR1 blots. In all blots, lower case letters denote SCR1 blots duplicated for clarity of presentation.
-
Figure 4—figure supplement 3—source data 1
Northern analyses of the consequences of simultaneous loss of the Dcp2 Upf1-binding motifs and leucine-rich motifs, and the roles of single Dcp2 Edc3- or Upf1-binding motifs (Figure 4C).
- https://cdn.elifesciences.org/articles/74410/elife-74410-fig4-figsupp3-data1-v2.zip
Figure 4—figure supplement 4
Simultaneous loss of the Upf1-binding motifs and the leucine-rich motifs has no synergistic effects on mRNA decapping, and a single Edc3- or Upf1-binding motif alone can promote efficient decapping of Edc3 or nonsense-mediated mRNA decay (NMD) substrates.
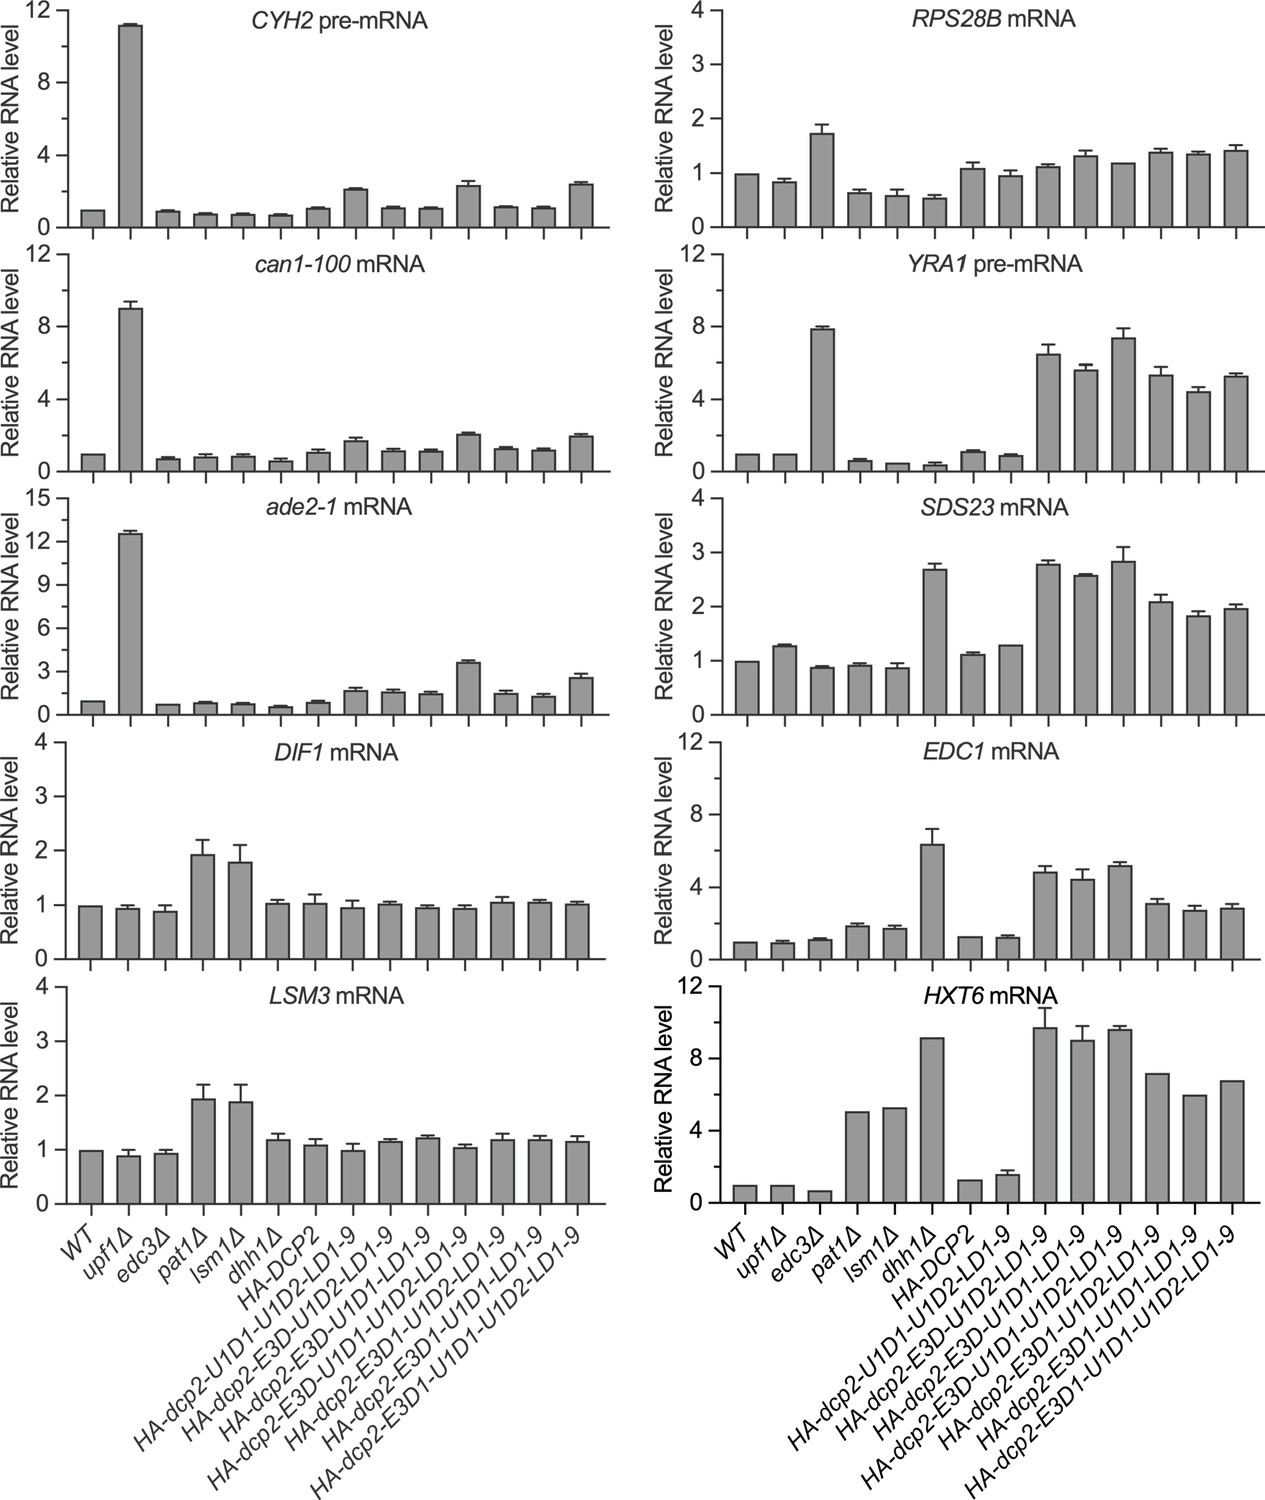
Bar graphs of average ± SEM for the northern analyses depicted in Figure 4C. The relative levels of each decapping substrate in different strains were determined from three or four independent experiments, with one representative blot for each transcript shown in Figure 4C. In each case, the relative RNA levels in different mutants were determined by comparison to the levels of the same transcripts in wild-type cells.
Figure 4—figure supplement 5
Loss of the Edc3-binding motif and trans deletion of EDC3 have additive effects on decapping of both Edc3 and Dhh1 substrates.
Bar graphs of average ± SEM for the northern analyses depicted in Figure 4D. The relative levels of each decapping substrate in different strains were determined from two to four independent experiments, with one representative blot for each transcript shown in Figure 4D. In each case, the relative RNA levels in different mutants were determined by comparison to the levels of the same transcripts in wild-type cells.
Figure 5
The Dcp1–Dcp2 decapping enzyme forms distinct decapping complexes in vivo with the decapping activators Edc3, Dhh1, Upf1, and Pat1.
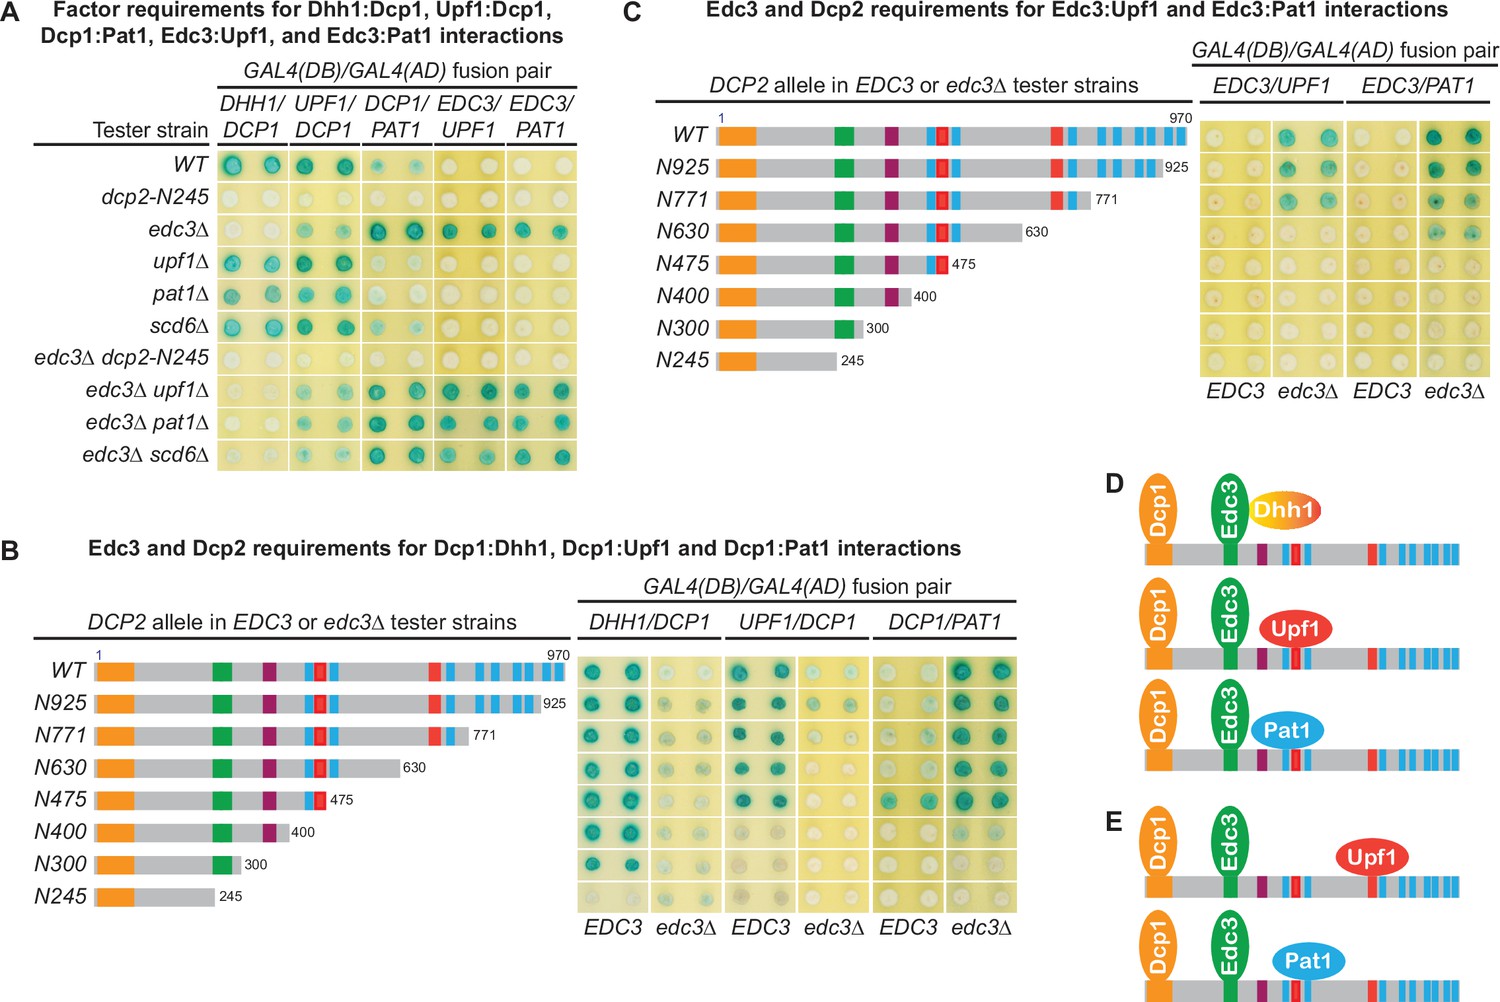
Two-hybrid assays, as in Figure 1, were used to dissect the molecular basis of five Dcp2-bridged interactions between Dcp1 and Dhh1, Upf1, or Pat1, and between Edc3 and Upf1 or Pat1. (A) Dcp1:Dhh1, Dcp1:Upf1, Dcp1:Pat1, Edc3:Upf1, and Edc3:Pat1 interactions in tester strains harboring different gene deletions or truncations of decapping factors. (B) Dcp1:Dhh1, Dcp1:Upf1, and Dcp1:Pat1 interactions in tester strains harboring Dcp2 C-terminal truncations in EDC3 and edc3Δ cells. (C) Edc3:Upf1 and Edc3:Pat1 interactions in tester strains harboring Dcp2 C-terminal truncations in EDC3 and edc3Δ cells. (D) Three different decapping complexes inferred from two-hybrid analyses in A and B. (E) Two different decapping complexes inferred from two-hybrid analyses in A and C.
Figure 6 with 1 supplement
Xrn1 binds to Dcp2 and is directly recruited to different decapping complexes by Dcp2.
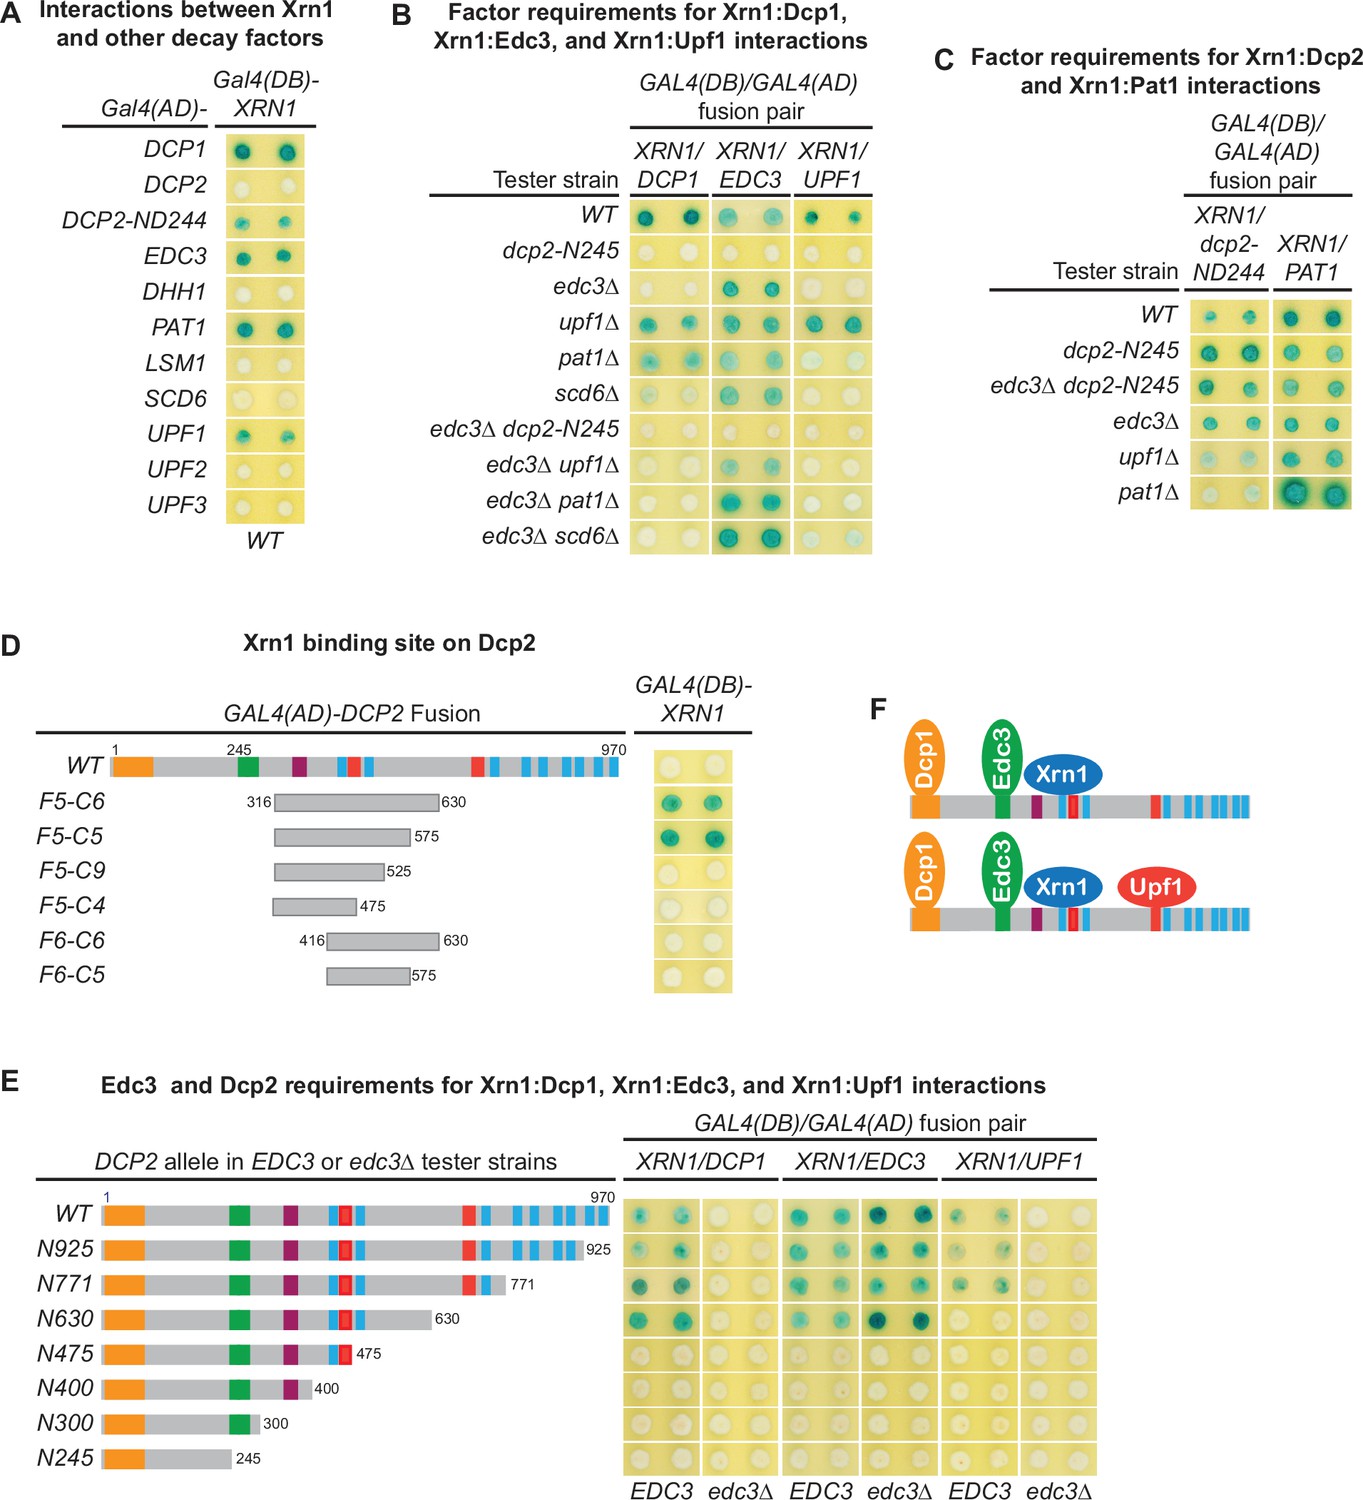
(A) Two-hybrid analyses of Xrn1 interactions with Dcp1, Edc3, Pat1, Upf1, and an N-terminally truncated Dcp2 fragment in WT cells. (B) Two-hybrid analyses of Dcp2-bridged interactions between Xrn1 and Dcp1, Edc3, or Upf1. (C) Two-hybrid analyses of interactions between Xrn1 and Pat1 or N-terminally truncated Dcp2. (D) Two-hybrid analyses of Xrn1 binding to an internal Dcp2 fragment. See also Figure 6—figure supplement 1. (E) Dcp1:Xrn1, Edc3:Xrn1, and Upf1:Xrn1 interactions in tester strains harboring Dcp2 C-terminal truncations and EDC3 or edc3Δ alleles. (F) Two different Xrn1-containing decapping complexes inferred from two-hybrid analyses in B and E. Allele schematics and two-hybrid analyses as in Figure 1.
Figure 6—figure supplement 1
Xrn1 binds to an internal region of Dcp2.
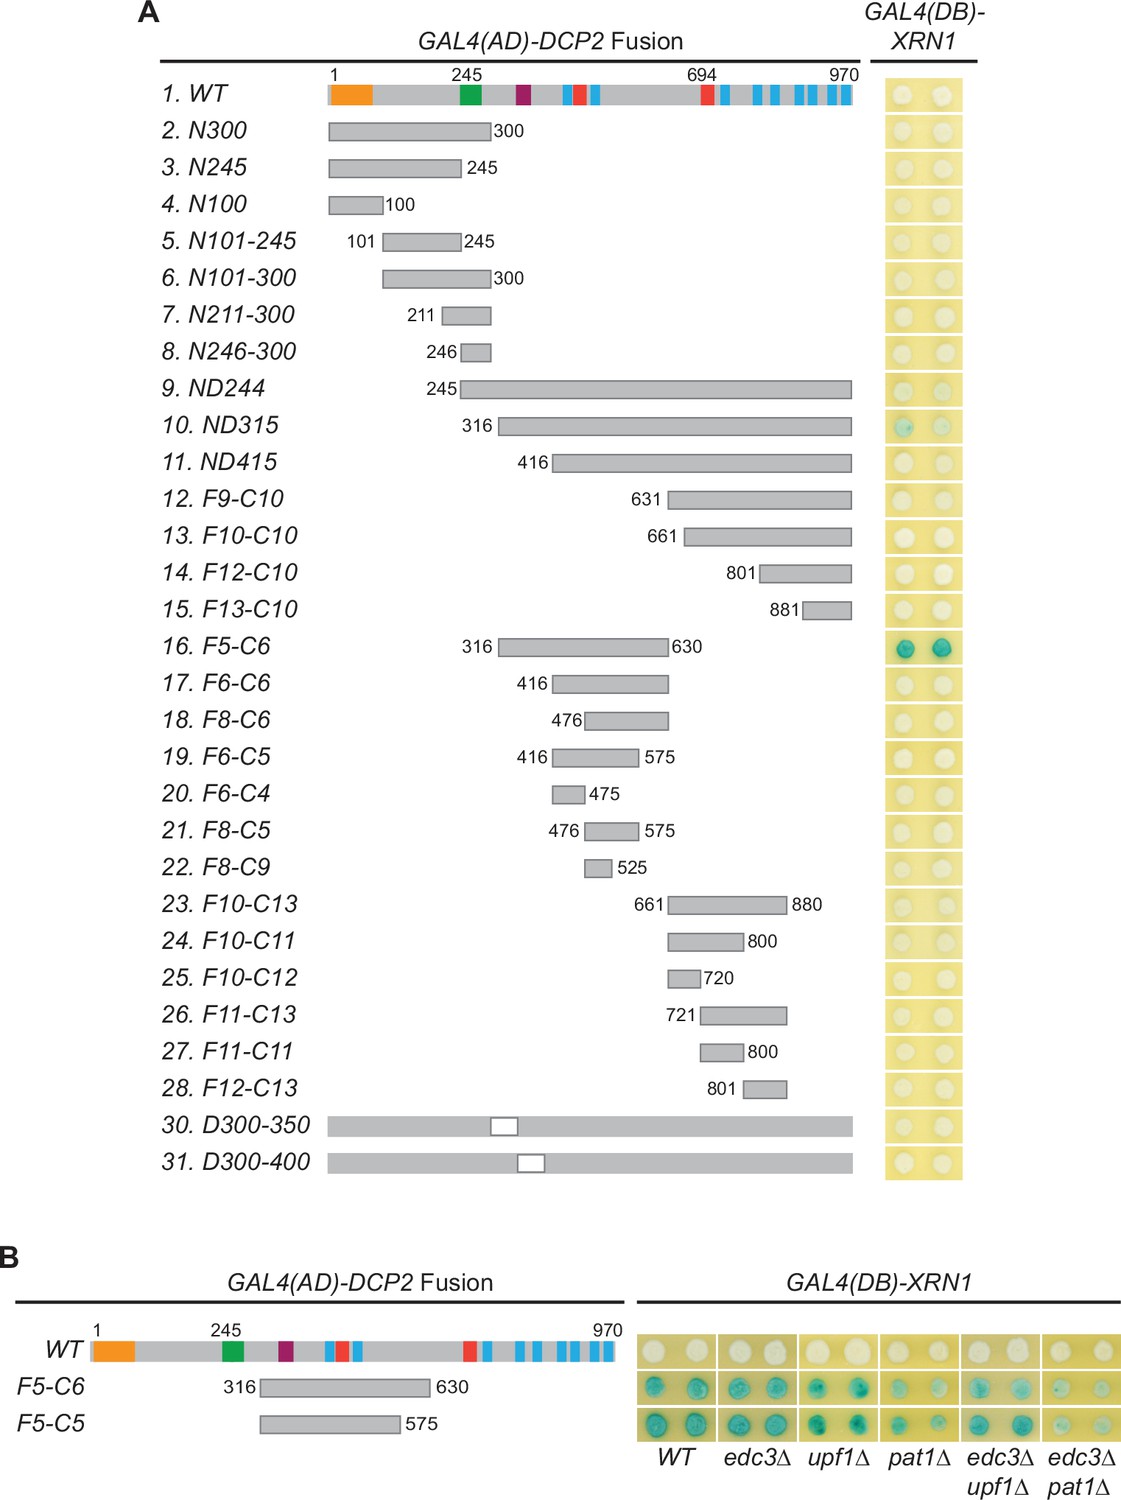
(A) Xrn1 binds to specific Dcp2 fragments. A panel of Dcp2 fragments was tested for interaction with Xrn1 in two-hybrid assays. The ND244 and ND315 fragments exhibited weak interaction and the F5-C6 fragment exhibited strong interaction. The Xrn1-binding site on the F5-C6 was mapped further in Figure 6D. (B) Interactions between Xrn1 and two internal fragments of Dcp2, F5-C6, or F5-C5, are independent of Edc3, Upf1, or Pat1. Two-hybrid interactions between Xrn1 and the Dcp2 F5-C6 or F5-C5 fragments were assessed in the wild-type tester strain and in tester strains containing single or double deletions of EDC3, UPF1, and PAT1.
Figure 7 with 1 supplement
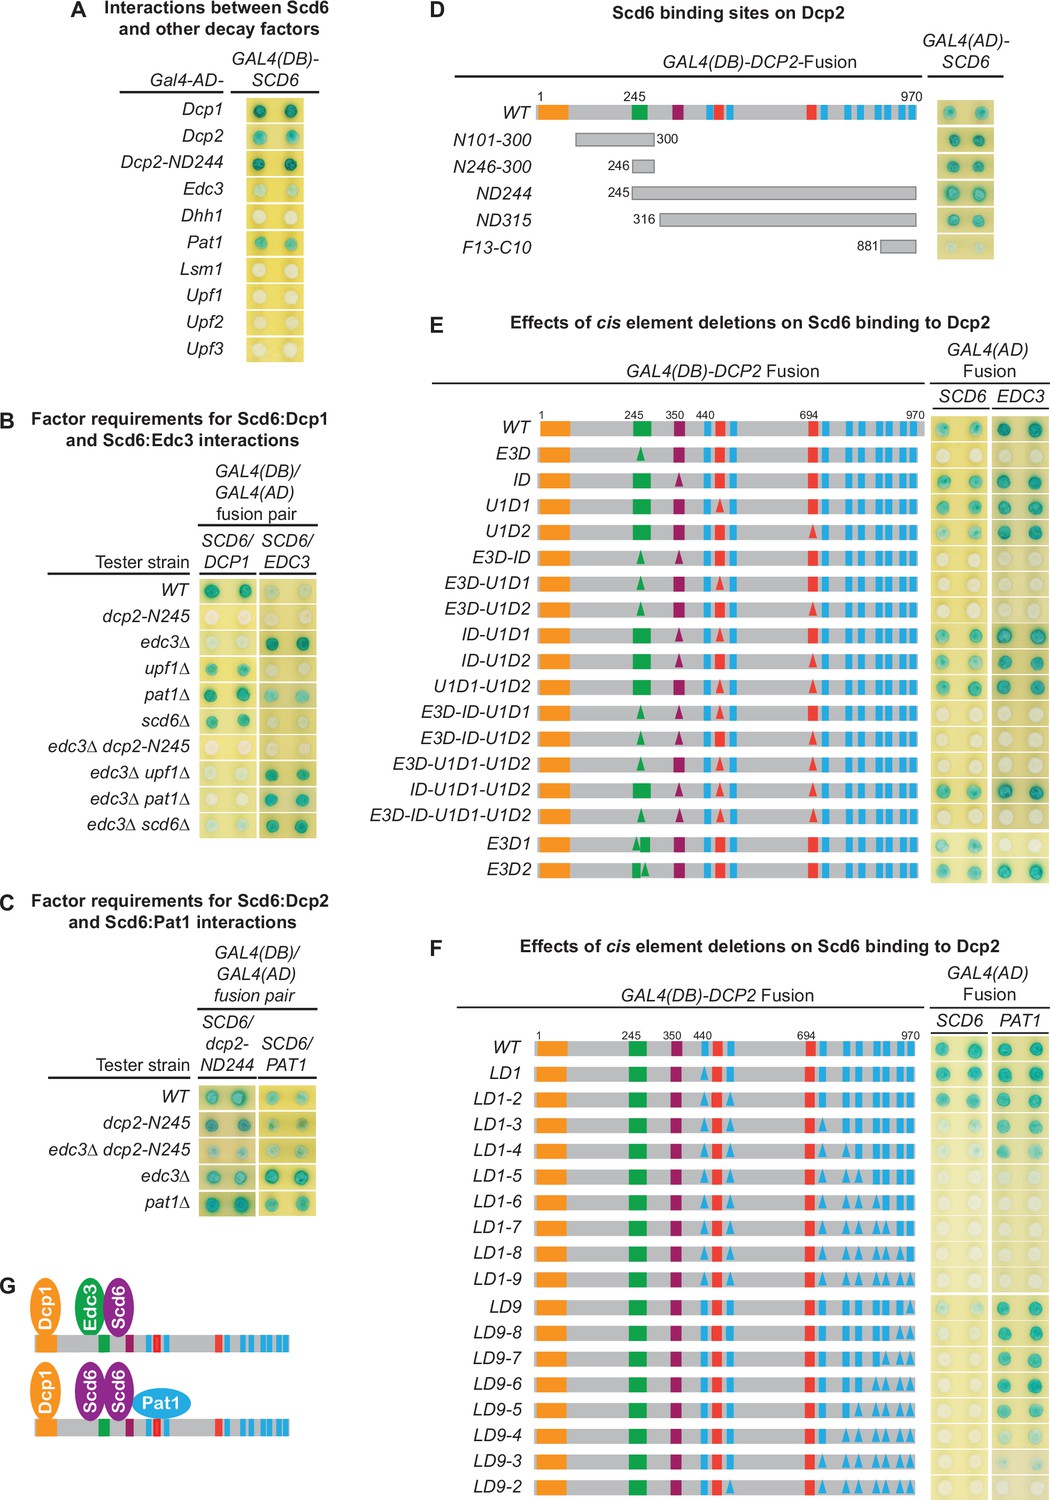
Scd6 binds to Dcp2 via multiple elements including the Edc3-binding and leucine-rich motifs and exists in both Edc3- and Pat1-containing decapping complexes.
(A) Two-hybrid analyses of Scd6 interactions with known yeast decapping factors in a WT tester strain. (B) Two-hybrid analyses of Dcp2-bridged interactions between Scd6 and Dcp1 or Edc3. (C) Two-hybrid analyses of interactions between Scd6 and Pat1 or N-terminally truncated Dcp2. (D) Two-hybrid analyses of Scd6 binding to different Dcp2 fragments. See also Figure 7—figure supplement 1. (E) Two-hybrid assays evaluating the consequences of deleting the Dcp2 inhibitory element and the Edc3- or Upf1-binding motifs on Dcp2 interactions with Scd6 and Edc3. (F) Two-hybrid assays evaluating the consequences of deleting the leucine-rich motifs (L1–L9) from the Dcp2 C-terminal domain on Dcp2 interactions with Scd6 and Pat1. (G) Two different decapping complexes inferred from two-hybrid analyses in B, E, and F. Allele schematics and two-hybrid analyses as in Figure 1.
Figure 7—figure supplement 1
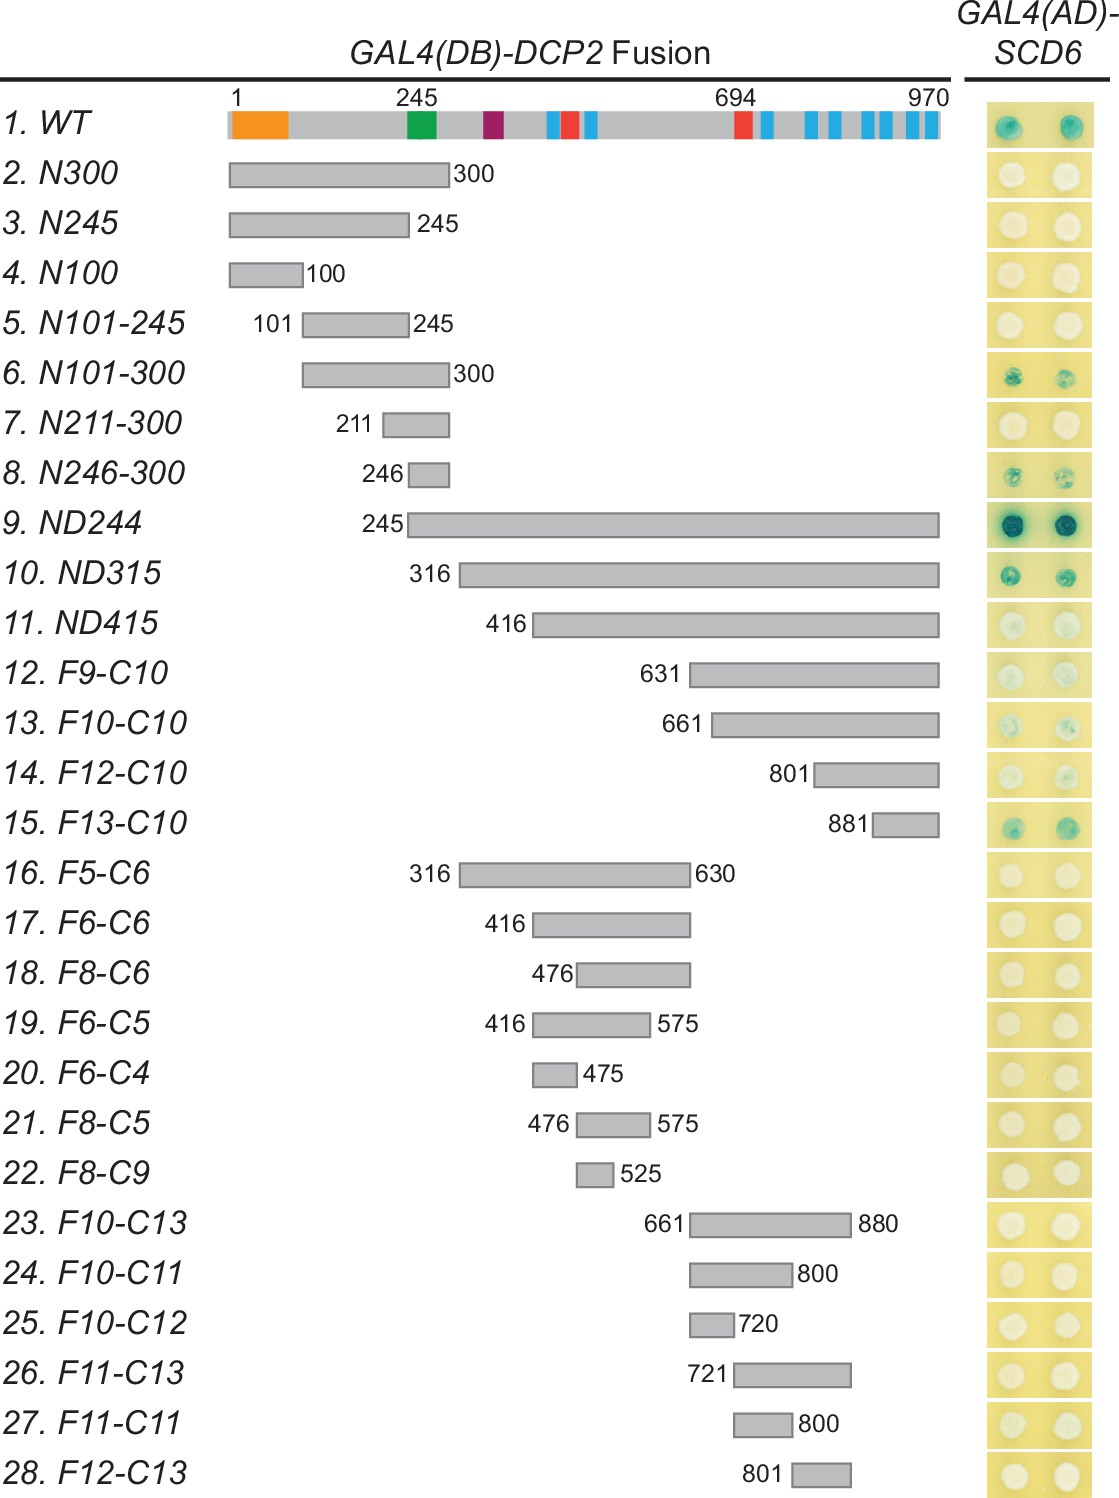
Scd6 binds to multiple Dcp2 fragments with or without specific overlaps.
A panel of Dcp2 fragments was tested for interaction with Scd6 in two-hybrid assays. The ND244 fragment exhibited strong interaction, the N101-300, N246-330, and ND315 fragments exhibited moderate interaction, and the ND415, F9-C10, F10-C10, F12-C10, and F13-C10 fragments exhibited weak interaction.
Figure 8

A new model: formation of target-specific decapping complexes controls mRNA decapping.
In brief, the Dcp1–Dcp2 decapping enzyme interacts with Edc3 and then Xrn1, forming a preassembled inactive Dcp1–Dcp2–Edc3–Xrn1 complex. The resulting complex binds to individual targeting components, forming target-specific decapping complexes. The final assembly and enzymatic activation of these complexes are postulated to occur on mRNPs destined for degradation.
Tables
Key resources table
| Reagent type (species) or resource | Designation | Source or reference | Identifiers | Additional information |
|---|---|---|---|---|
| Chemical compound, drug | [α-32P]-dCTP | Perkin Elmer | Blu513Z | |
| Chemical compound, drug | 5-Bromo-4-chloro-3-indolyl-beta-D-galactopyranoside (X-GAL) | USB | 7240-90-6 | 40 µg/ml |
| Chemical compound, drug | Phenol | Fisher | A92-500 | |
| Chemical compound, drug | Phenol:choroform:IAA (25:24:1) | Ambion | AM9732 | |
| Chemical compound, drug | Herring Sperm DNA | Promega | D1815 | |
| Chemical compound, drug | Geneticin (G418 Sulfate) | Gibco | 11811-023 | 400 µg/ml |
| Chemical compound, drug | Hygromycin B | Roche | 10843555001 | 200 µg/ml |
| Peptide, recombinant protein | Taq DNA polymerase | Roche | 04-728-874-001 | |
| Commercial assay or kit | QuikChange XL Site-Directed Mutagenesis Kit | Agilent Technologies | 200,519 | |
| Commercial assay or kit | Random Primed DNA labeling Kit | Roche | 11-004-760-001 | |
| Strain, strain background (Escherichia coli) | DH5α | Invitrogen | 11319-019 | Electrocompetent cells |
| Strain, strain background (Saccharomyces cerevisiae) | Supplementary file 1 | This paper | Yeast strains used in this study | See Materials and methods |
| Genetic reagent (plasmid) | Supplementary file 2 | This paper | Plasmids used in this study | See Materials and methods |
| Genetic reagent (plasmid) | Supplementary file 4 | This paper | DNA probes used in this study | See Materials and methods |
| Sequence-based reagent | Supplementary file 3 | This paper | Oligonucleotides used in this study | See Materials and methods |
| Software, algorithm | Multi-Gauge software | Fujifilm | Science lab 2005 | |
| Software, algorithm | GraphPad Prism 9 for Windows | GraphPad Software, LLC | https://www.graphpad.com | |
| Other | Zeta-Probe Blotting Membranes | BioRad | 1620159 | He et al., 2008 |
| Other | Mini Quick Spin RNA Columns | Roche | 11-814-427-001 | He et al., 2008 |
Additional files
-
Supplementary file 1
Yeast strains used in this study.
- https://cdn.elifesciences.org/articles/74410/elife-74410-supp1-v2.xlsx
-
Supplementary file 2
Plasmids used in this study.
- https://cdn.elifesciences.org/articles/74410/elife-74410-supp2-v2.xlsx
-
Supplementary file 3
Oligonucleotides used in this study.
- https://cdn.elifesciences.org/articles/74410/elife-74410-supp3-v2.xlsx
-
Supplementary file 4
DNA fragments used as probes in this study.
- https://cdn.elifesciences.org/articles/74410/elife-74410-supp4-v2.xlsx
-
Transparent reporting form
- https://cdn.elifesciences.org/articles/74410/elife-74410-transrepform1-v2.docx
Download links
A two-part list of links to download the article, or parts of the article, in various formats.
Downloads (link to download the article as PDF)
Open citations (links to open the citations from this article in various online reference manager services)
Cite this article (links to download the citations from this article in formats compatible with various reference manager tools)
Dcp2 C-terminal cis-binding elements control selective targeting of the decapping enzyme by forming distinct decapping complexes
eLife 11:e74410.
https://doi.org/10.7554/eLife.74410


