Host-pathogen genetic interactions underlie tuberculosis susceptibility in genetically diverse mice
- Department of Microbiology and Physiological Systems, University of Massachusetts Medical School, United States
- Department of Molecular Genetics and Microbiology, Duke University, United States
- Department of Immunology and Microbial Disease, Albany Medical College, United States
- Department of Microbiology and Immunology, Weill Cornell Medical College, United States
- University Program in Genetics and Genomics, Duke University, United States
- Department of Genetics, University of North Carolina at Chapel Hill, United States
- Curriculum in Genetics and Molecular Biology, University of North Carolina at Chapel Hill, United States
- Lineberger Comprehensive Cancer Center, University of North Carolina at Chapel Hill, United States
- Department of Computer Science and Engineering, Texas A&M University, United States
Figures
Figure 1 with 2 supplements
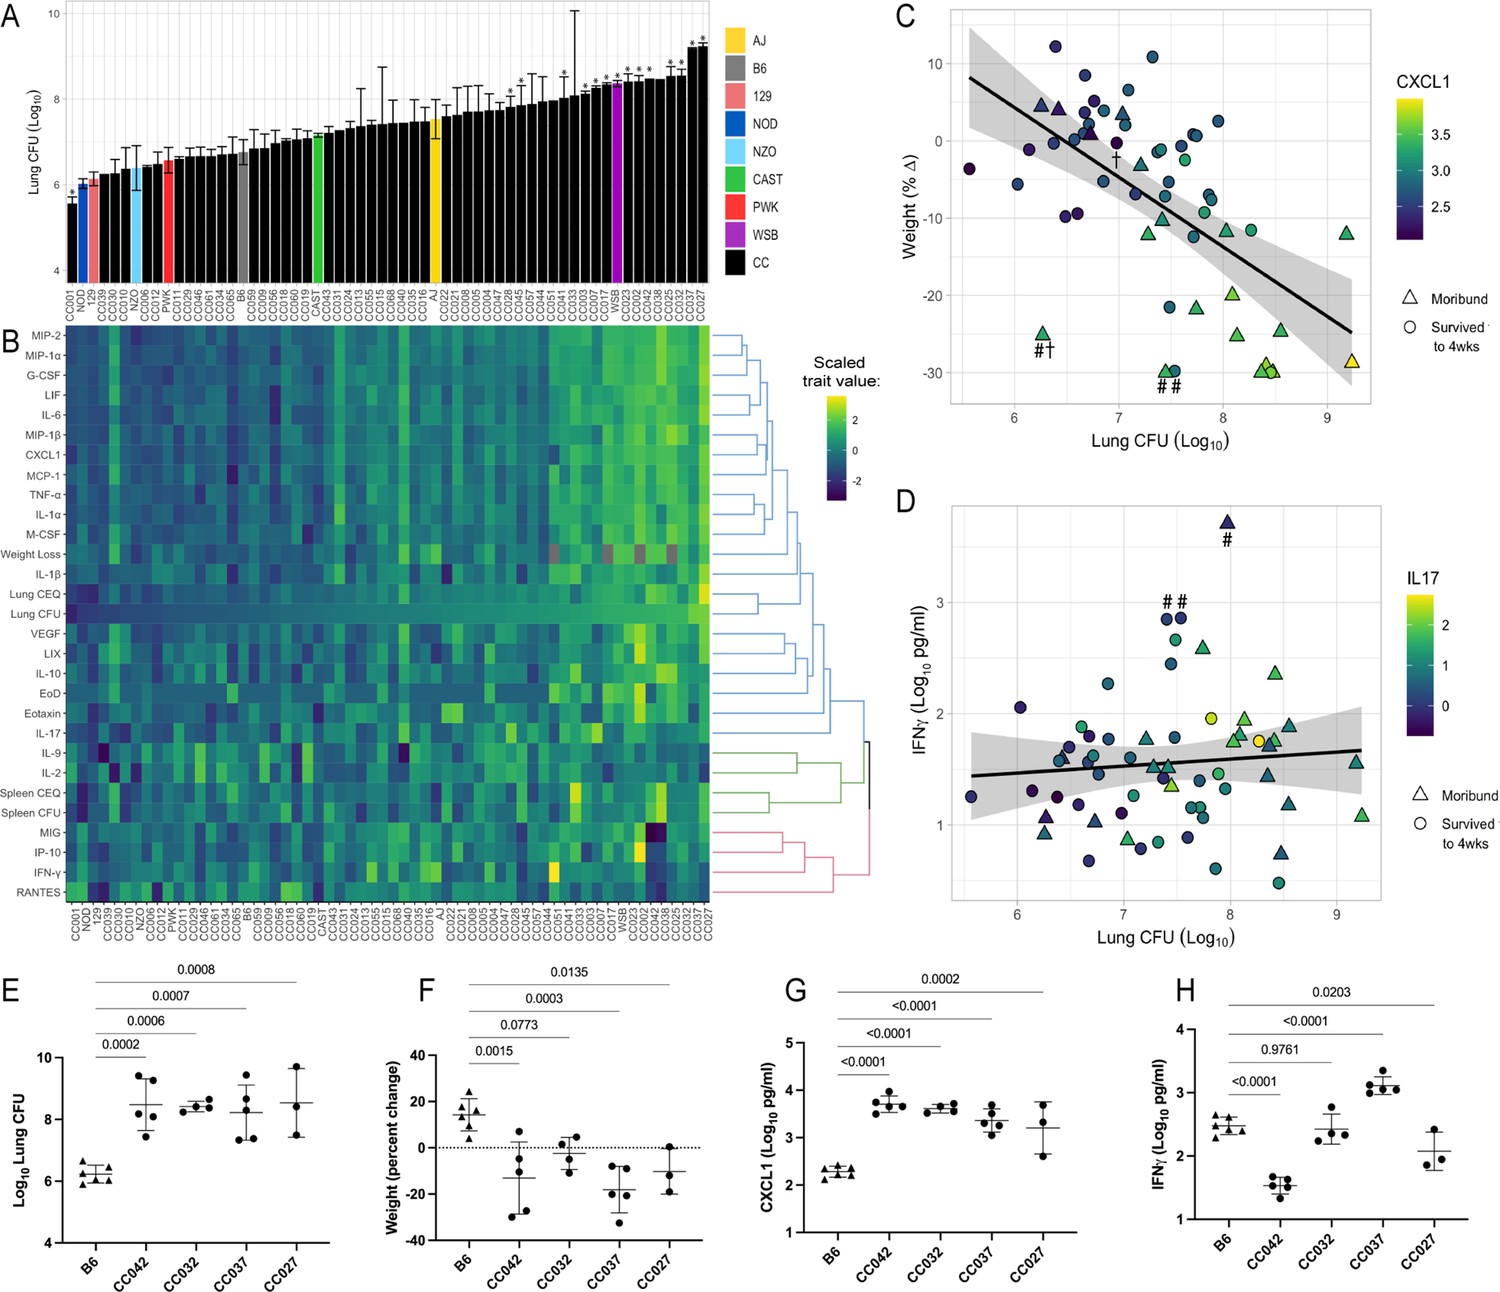
he spectrum of M.tuberculosis disease-related traits across the collaborative cross.
(A) Average lung CFU (log10) across the CC panel at 4 weeks post-infection. Bars show mean ± SD for CFU per CC or parental strain; groups of three to six mice per genotype were infected via IV route (infectious dose of 104 in the lungs and 105 in the spleen as quantified by plating CFU 24 hr post-infection). To compare the field standard B6 mouse strain with the diverse CC mouse strains, bars noted with * indicate strains that were statistically different from B6 (p < 0.05; 1-factor ANOVA with Dunnett’s post-test). (B) Heatmap of the 32 disease-related traits (log10 transformed) measured including: lung and spleen colony forming units (CFU); lung and spleen chromosomal equivalents (CEQ); weight loss (% change); cytokines from lung; ‘earliness of death’ (EoD), reflecting the number of days prior to the end of experiment that moribund strains were euthanized. Mouse genotypes are ordered by lung CFU. Scaled trait values were clustered (hclust in R package heatmaply) and dendrogram nodes colored by 3 k-means. Blue node reflects correlation coefficient R > 0.7; green R = 0.3–0.6 and red R < 0.2. Source files of all measured phenotypes are available in Figure 1—source data 1. (C) Correlation of lung CFU and weight (% change) shaded by CXCL1 levels. Genotypes identified as statistical outliers for weight are noted by #; CXCL1 by † (CC030 is triangle with #†;CC040 is triangle with #; AJ is circle with #; CC056 is circle with †). (D) Correlation of lung CFU and IFNγ levels shaded by IL-17. Strains identified as outliers for IFNγ noted by # (CC055 is left circle with #, AJ is right circle with #, CC051 is triangle with #). Each point in (C) and (D) is the average value per genotype. Outlier genotypes were identified after linear regression using studentized residuals. (E–H) Disease traits measured in a validation cohort (B6 vs CC042, CC032, CC037, and CC027) at 4 weeks after post low-dose aerosol infection (E) lung CFU (log10); (F) Weight (percent change relative to uninfected); (G) CXCL1 abundance in lung (log10 pg/mL homogenate); (H) IFNγ (log10 pg/mL homogenate). Bar plots show the mean ± SD. p-Values indicate strains that were statistically different from B6 (1-factor ANOVA with Dunnett’s post-test). Source files of all measured phenotypes in the aerosol validation cohort are available in Figure 1—source data 2. Groups consist of three to six mice per genotype. All mice in the initial CC screen and validation cohort were male.
-
Figure 1—source data 1
CC TB disease phenotypes.
TB disease-related phenotypes measured in the CC and parental strains at one-month post-infection. Recorded values are the average and standard deviation of indicated number of mice per genotype (‘N of mice infected’ at the start of the large screen and ‘N of surviving phenotyped animals’). Mice were infected over three batches (denoted by ‘block’). ‘Freezer days’ denotes the number of days prior to the one-month end of infection timepoint that some moribund genotypes were euthanized in accordance with IACUC approved endpoints. ‘Blaze’ denotes genotypes with white head-spotting coat color trait (WSB haplotype for Kitl; used as a positive control/proof-of-concept for QTL mapping as per Aylor et al., 2011; Smith et al., 2019).
- https://cdn.elifesciences.org/articles/74419/elife-74419-fig1-data1-v2.zip
-
Figure 1—source data 2
Aerosol validation phenotypes.
TB disease-related phenotypes measured in B6 and the susceptible CC genotypes (CC027, CC032, CC037, CC042) after infection with Mtb by low-dose aerosol infection. Recorded values are the individual measurements per mouse, designated by genotype.
- https://cdn.elifesciences.org/articles/74419/elife-74419-fig1-data2-v2.zip
Figure 1—figure supplement 1
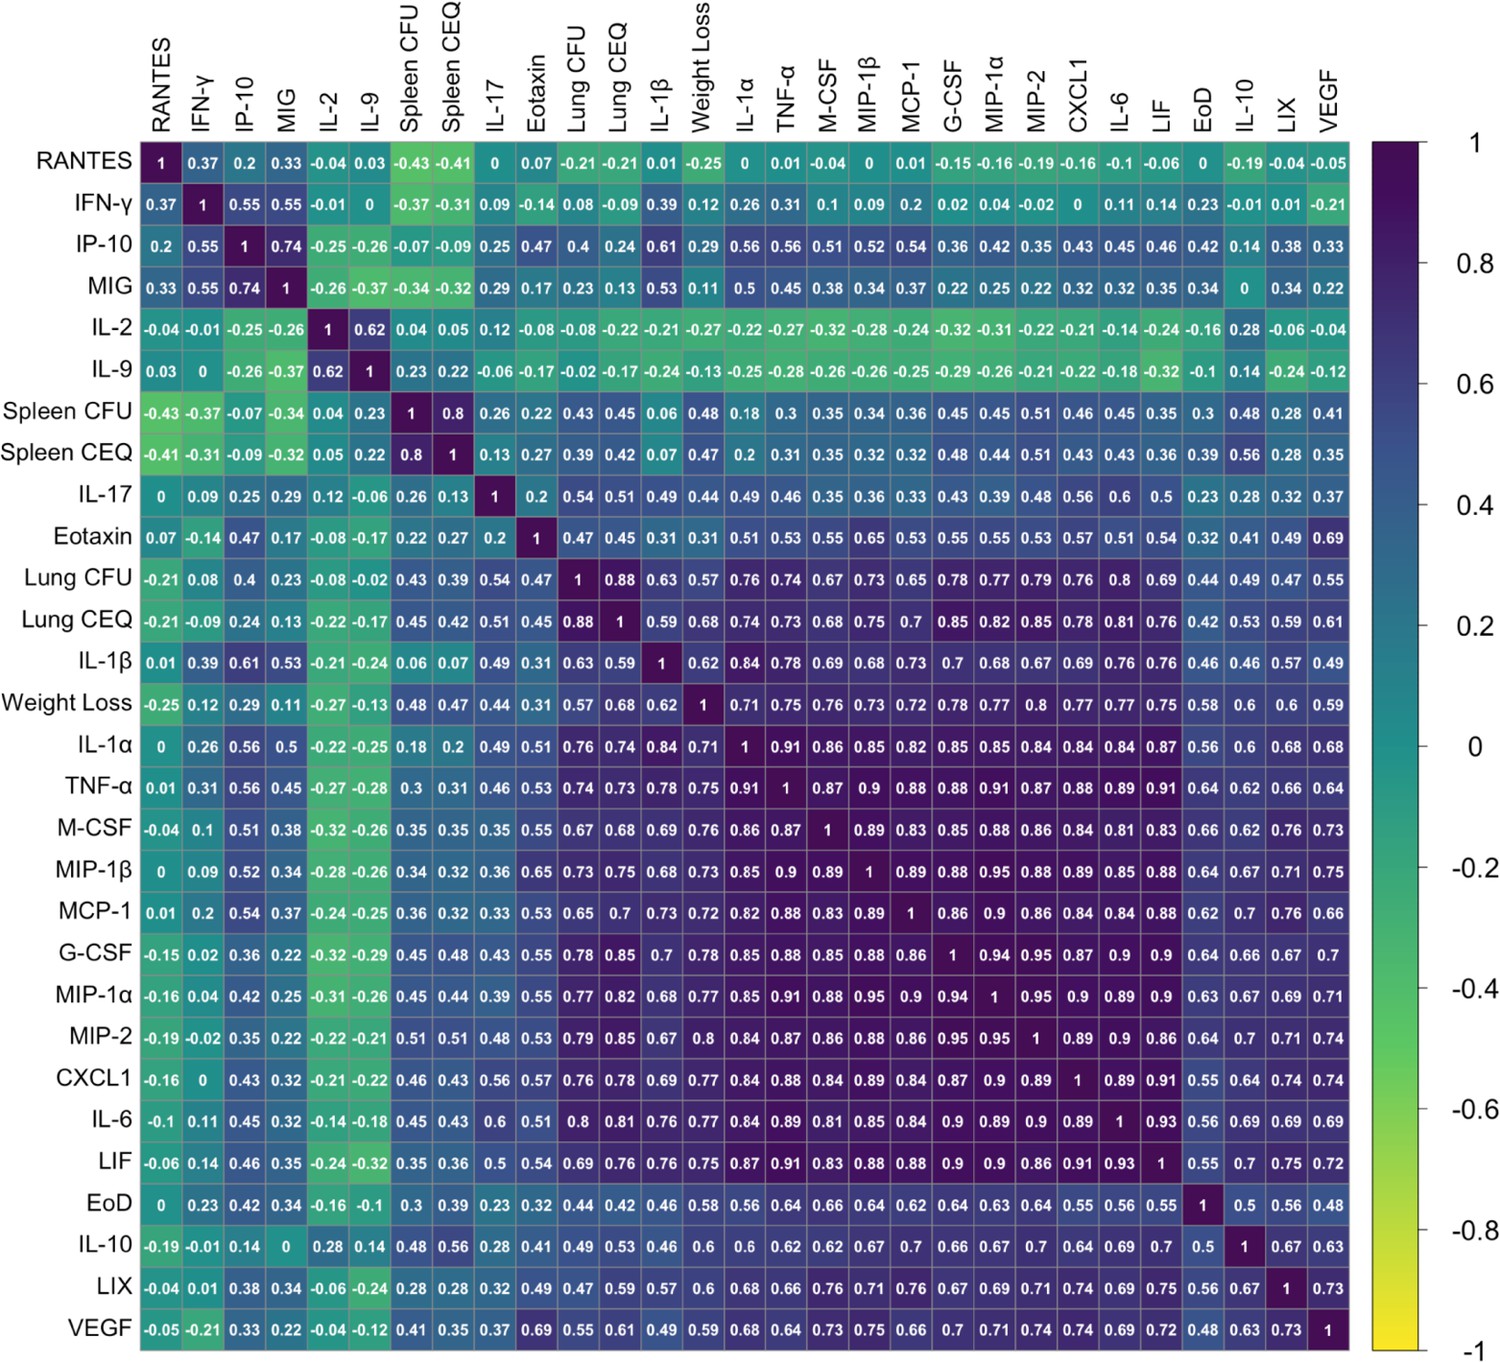
Phenotypic relationships between TB disease-related traits in the CC IV screen.
Correlation between 32-measured TB traits was determined by Pearson’s correlation and visualized using corrplot version 0.84 (ordered by hclust method ‘complete’) in R version 4.0.3. Violet indicates a positive correlation, and yellow indicates negative correlations. The correlation coefficient for each trait comparison (R value) is noted on each square. EoD (Earliness of Death); CEQ (Chromosomal Equivalents).
Figure 1—figure supplement 2
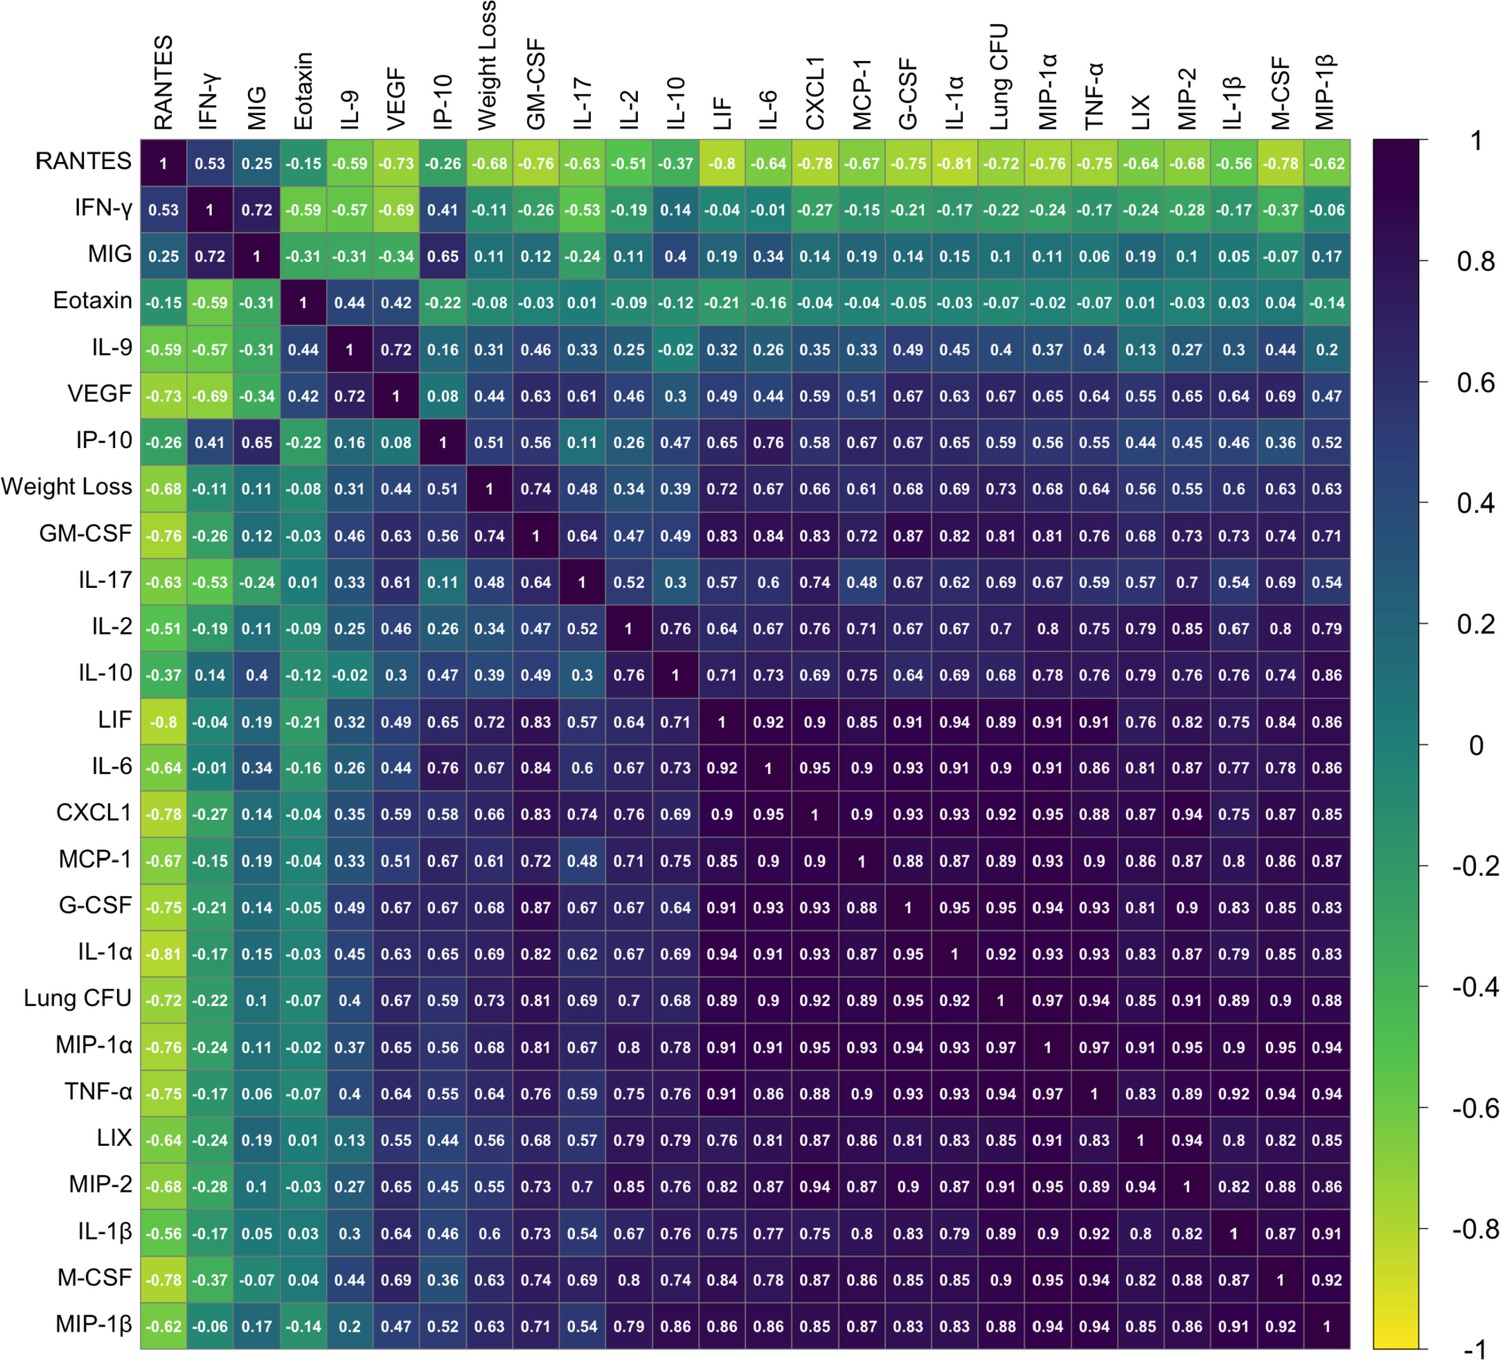
Phenotypic relationships between TB disease-related traits in the aerosol validation cohort.
Correlation between 32-measured TB traits was determined by Pearson’s correlation and visualized using corrplot version 0.84 (ordered by hclust method ‘complete’) in R version 4.0.3. Violet indicates a positive correlation, and yellow indicates negative correlations. The correlation coefficient for each trait comparison (R value) is noted on each square.
Figure 2
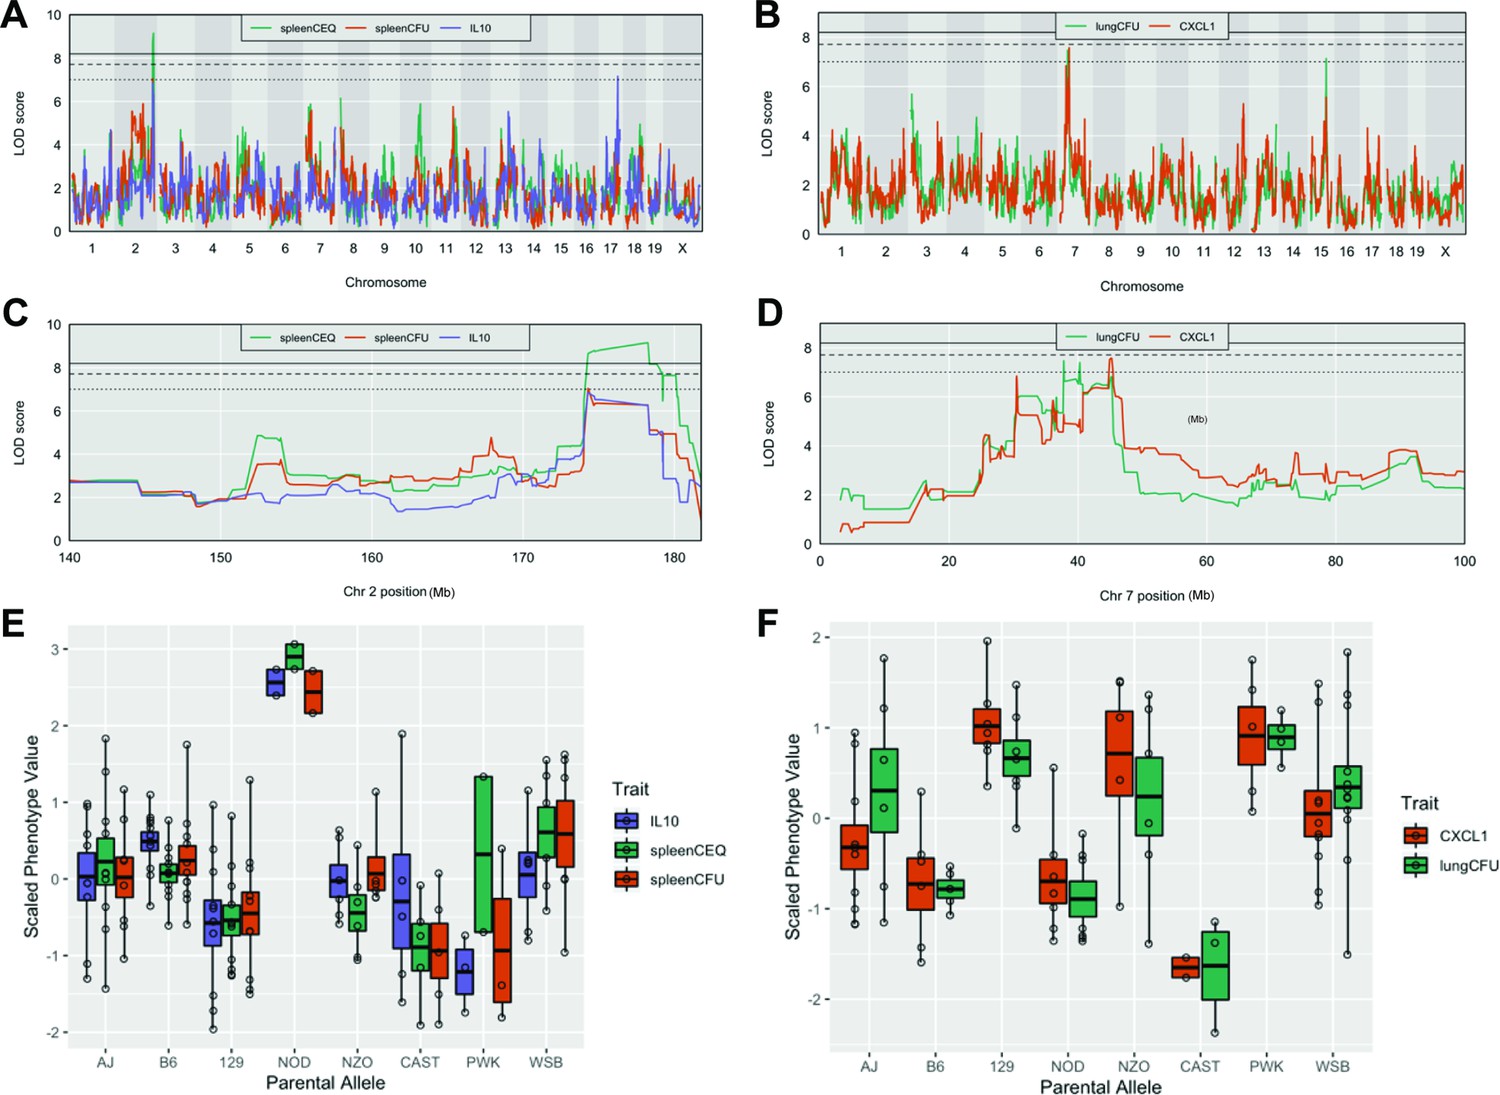
Host loci underlying TB disease-related traits.
(A–B) Whole genome QTL scans of (A) spleen CEQ, spleen CFU and IL-10 (B) lung CFU and CXCL1. (C) Zoom of chromosome two loci. (D) Zoom of chromosome seven loci. Thresholds were determined by permutation analysis; solid line, middle dashed line, and lowest dotted lines represent p = 0.05, p = 0.1, and p = 0.2. (E–F) Scaled phenotype value per haplotype at the QTL peak marker. Each dot represents the mean value for a genotype.
Figure 3
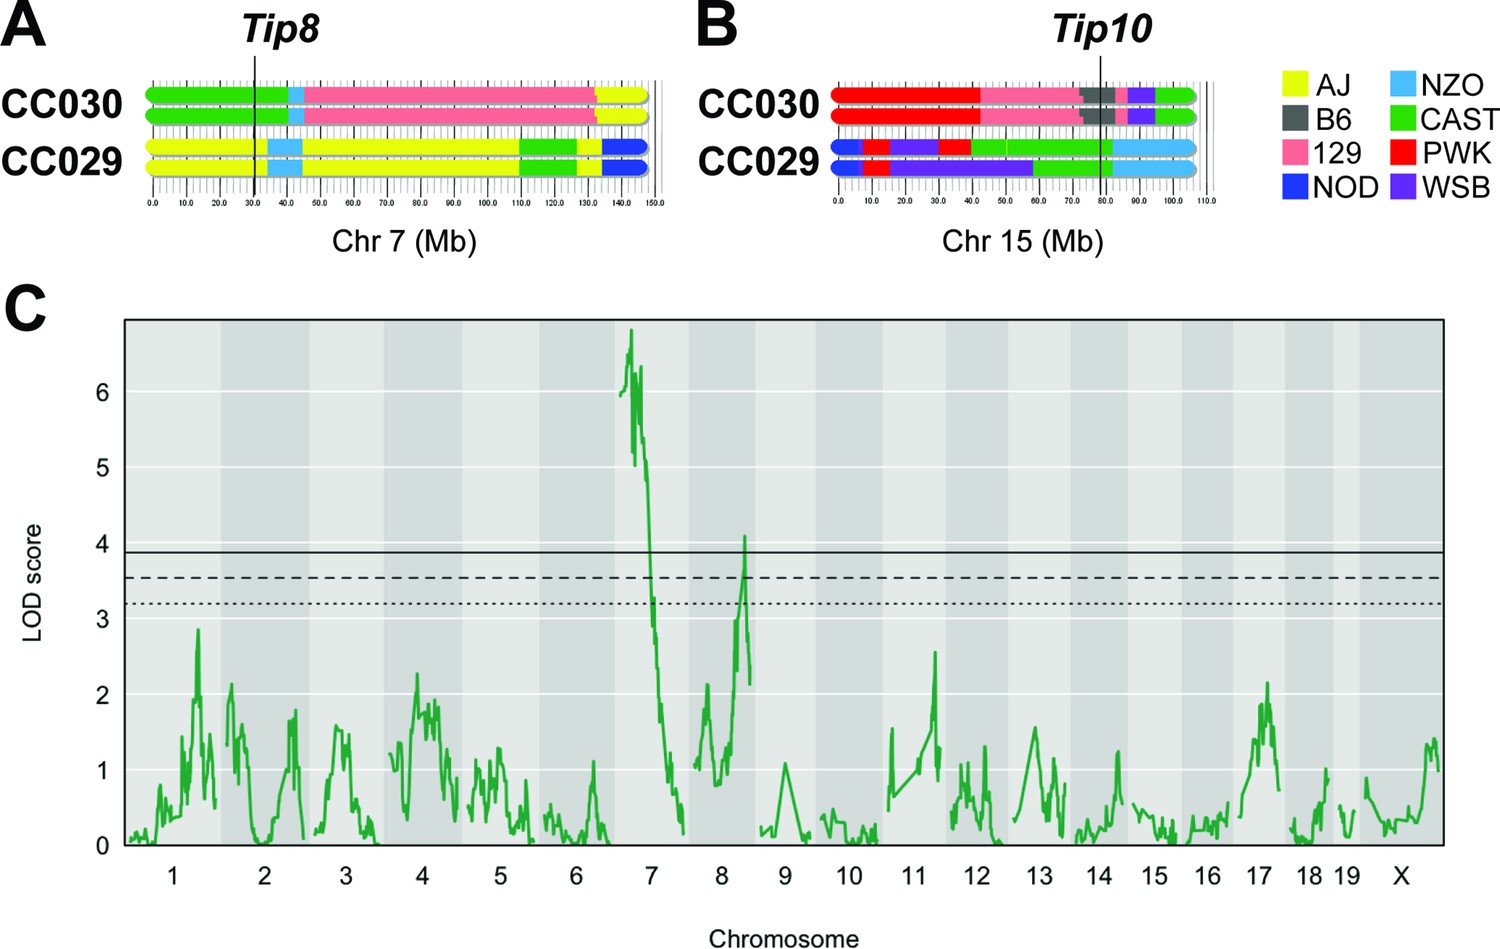
An F2 intercross approach to validate QTL underlying lung CFU.
(A) Haplotypes of CC030 and CC029 CC strains at Chr7 (Tip 8) and (B) at Chr15 (Tip10). The F2 population (n = 251) based on these founders were genotyped, infected with Mtb (105 infectious dose by IV route, as per the original CC screen), and lung CFU was quantified at 1 month post-infection. (C) QTL mapping identified genome-wide significant (p < 0.05) loci on Chr7 (LOD = 6.81; peak position on Chr7 at 28.6 Mb) overlapping with Tip8 and a new locus on Chr8 (LOD = 4.08; peak position Ch8:116.1 Mb). Thresholds were determined by permutation analysis; solid line, middle dashed line, and lowest dotted lines represent p = 0.05, p = 0.1, and p = 0.2. Source files of F2 genotypes are available in Figure 3—source data 1; phenotypes are available in Figure 3—source data 1.
-
Figure 3—source data 1
F2 Intercross genotype data.
MiniMUGA genotype data from 251 F2 mice generated from CC030xCC029 intercross strategy. The infected F2 cohort included both male and female mice, as indicated.
- https://cdn.elifesciences.org/articles/74419/elife-74419-fig3-data1-v2.zip
-
Figure 3—source data 2
F2 Intercross phenotype data.
Lung CFU data quantified by plating CFU from Mtb infected lungs from 251 F2 mice at 1 month post infection (matched with genotype data in Figure 3—source data 1). The infected F2 cohort included both male and female mice, as indicated.
- https://cdn.elifesciences.org/articles/74419/elife-74419-fig3-data2-v2.zip
Figure 4 with 1 supplement
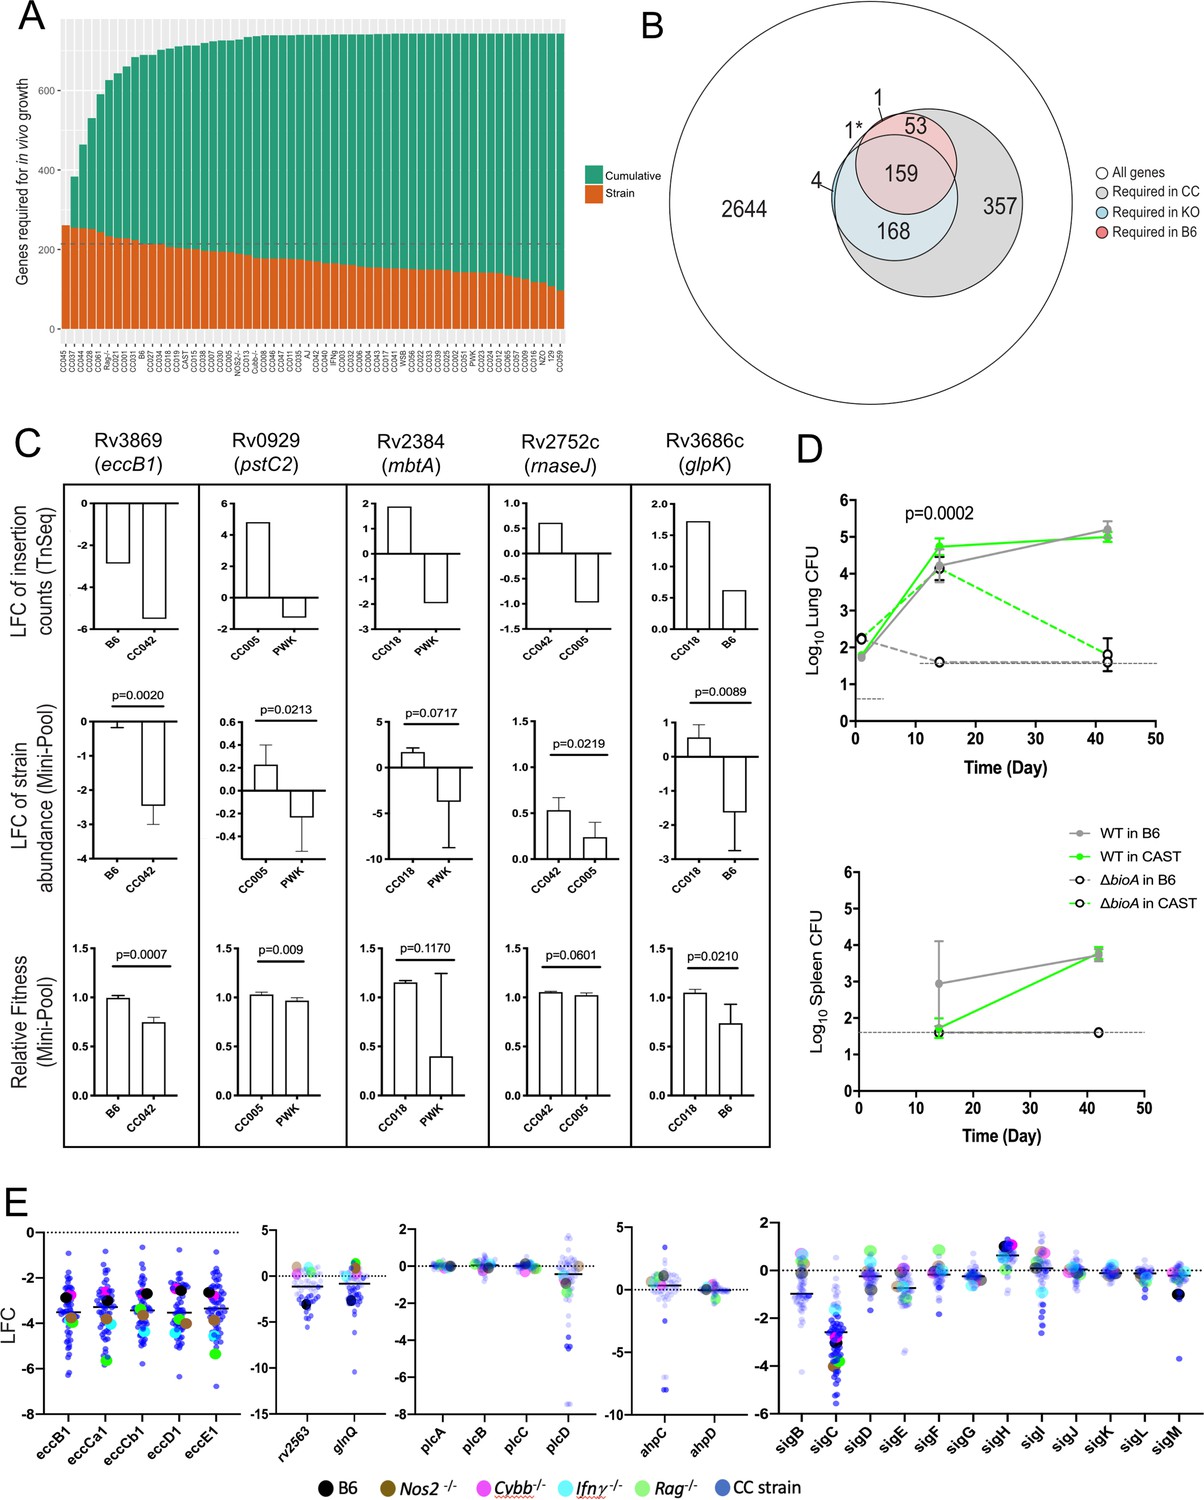
Mtb genetic requirements vary across diverse hosts.
(A) The number of Mtb genes required for growth or survival in each diverse mouse strain across the panel (Qval ≤0.05). Orange indicates the mutants required for each strain; turquoise shows the cumulative requirement as each new host strain is added. (B) Venn diagram showing the composition of Mtb gene sets required in each category of host (white, largest circle), only required in the CC panel (gray), required in specific immunological KO mice (blue) and genes required in B6 mice (red). Note, 1* is required in B6 and KO. In order to be called ‘essential’ in each mouse strain, Mtb genes had to be significantly over or underrepresented in at least two genotypes. (C) Each box shows log2 fold change (LFC) of individual mutants from the TnSeq screen relative to the input pool in indicated mouse strains (top); log2 fold change of the indicated deletion mutants relative to WT from a pooled mutant validation infection (middle panel); relative fitness calculated from (middle panel) to account for generation differences in each host due to differential growth rate. Bars are the average of 3–6 mice per mutant/genotype ± SD. Statistical differences between mini-pool validation groups was assessed by Welch’s t-test. (D) Lung CFU and spleen CFU from single strain low-dose aerosol infections of ∆bioA mutant or WT H37Rv strain in B6 and CAST mice at 2- or 5 weeks post-infection. Dashed line indicates the limit of detection. Each point indicates the average CFU ± SD of 4–5 mice per group. Statistical differences between groups were assessed by mixed effects models (Tukey’s test). (E) Log2 fold change of selected mutants from the TnSeq screen across the CC panel and immunological KO mice. Each dot represents the average LFC per mouse genotype; KO mouse strains (on a B6 background) dots are shown larger for clarity. All mice in the large CC TnSeq screen were male; mice in the ∆bioA aerosol validation were female; mice in the mini-pool validation studies were male and female with no significant differences detected. Source file of the TnSeq screen is available in Figure 4—source data 1; source count data of the TnSeq validation experiment is available in Figure 4—source data 2.
-
Figure 4—source data 1
TnSeq summary table.
LFC values represent the log2 fold change (LFC) between input and mouse-selected pools. ‘NA’ indicates genes with fewer than three occupied TA transposon insertion sites for the indicated comparison. Qvals represent adjusted p-values comparing mutant abundance in input and selected pools. ‘NA’ indicates genes with fewer than three occupied TA transposon insertion sites for the indicated comparison. Required in vivo: ‘TRUE’ indicates the mutant is significantly underrepresented (Qval <0.05) after in mouse-selection in at least two mouse strains. Required in B6: ‘TRUE’ indicates the mutant is significantly underrepresented (Qval <0.05) after in selection in B6 mice. Required in KO mice: "TRUE" indicates the mutant is significantly underrepresented (Qval <0.05) after in selection in Rag-/-, Nos2-/-, Cybb-/-, or Ifnγ-/- mice. Core gene set: ‘TRUE’ indicates the mutant is significantly underrepresented (Qval <0.05) in 30 mouse strains. U = uninformative; fewer than three occupied TA transposon insertion sites in all strains in panel. F = filtered; essential in only a single strain. ‘Module’ corresponds to WGCNA module number as illustrated in Figure 5A. Mouse strains are listed in the same order as Figure 5B, with the corresponding cluster designation.
- https://cdn.elifesciences.org/articles/74419/elife-74419-fig4-data1-v2.xlsx
-
Figure 4—source data 2
Validation counts table.
CFU and normalized barcode counts from Mtb mutant mini-pool infection in individual mice, including mbtA, glpK, pstC2, eccB1, RNaseJ, and WT (H37Rv).
- https://cdn.elifesciences.org/articles/74419/elife-74419-fig4-data2-v2.xlsx
Figure 4—figure supplement 1
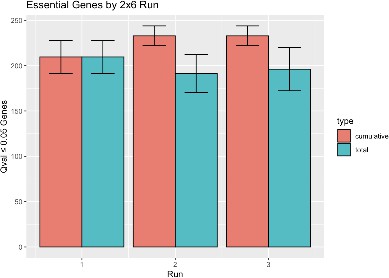
Sampling additional B6 libraries does not appreciably increase the estimate of genes necessary for growth.
To approximate the experimental design of Figure 4A but for B6 only, six biological replicate TnSeq libraries from 4-week post-infection B6 mice were randomly paired, and genes required for growth or survival in each of the three runs or cumulatively were identified and counted exactly as for Figure 4A. The process was repeated ten times with the results shown. Error bars indicate mean ± SD for the 10 runs. Cumulative gene count stabilizes after two runs.
Figure 5 with 1 supplement

Mtb virulence pathways associate with distinct host immune pressures.
(A) Weighted gene correlation network analysis (WGCNA) of the 679 Mtb genes that significantly vary across the diverse mouse panel. The most representative genes of each module (intramodular connectivity >0.6) are shown. (B) Mouse genotypes were clustered based on the relative abundance of the 679 variable Mtb mutants. The six major clusters (Cluster A-F) were associated with both CFU and the relative abundance of mutants in each bacterial module (1-20; right hand-side with known functions). Statistical analysis is described in Methods. Yellow shading indicates clusters associated with lung CFU. * indicate modules significantly associated with specific mouse clusters (p < 0.05).
Figure 5—figure supplement 1
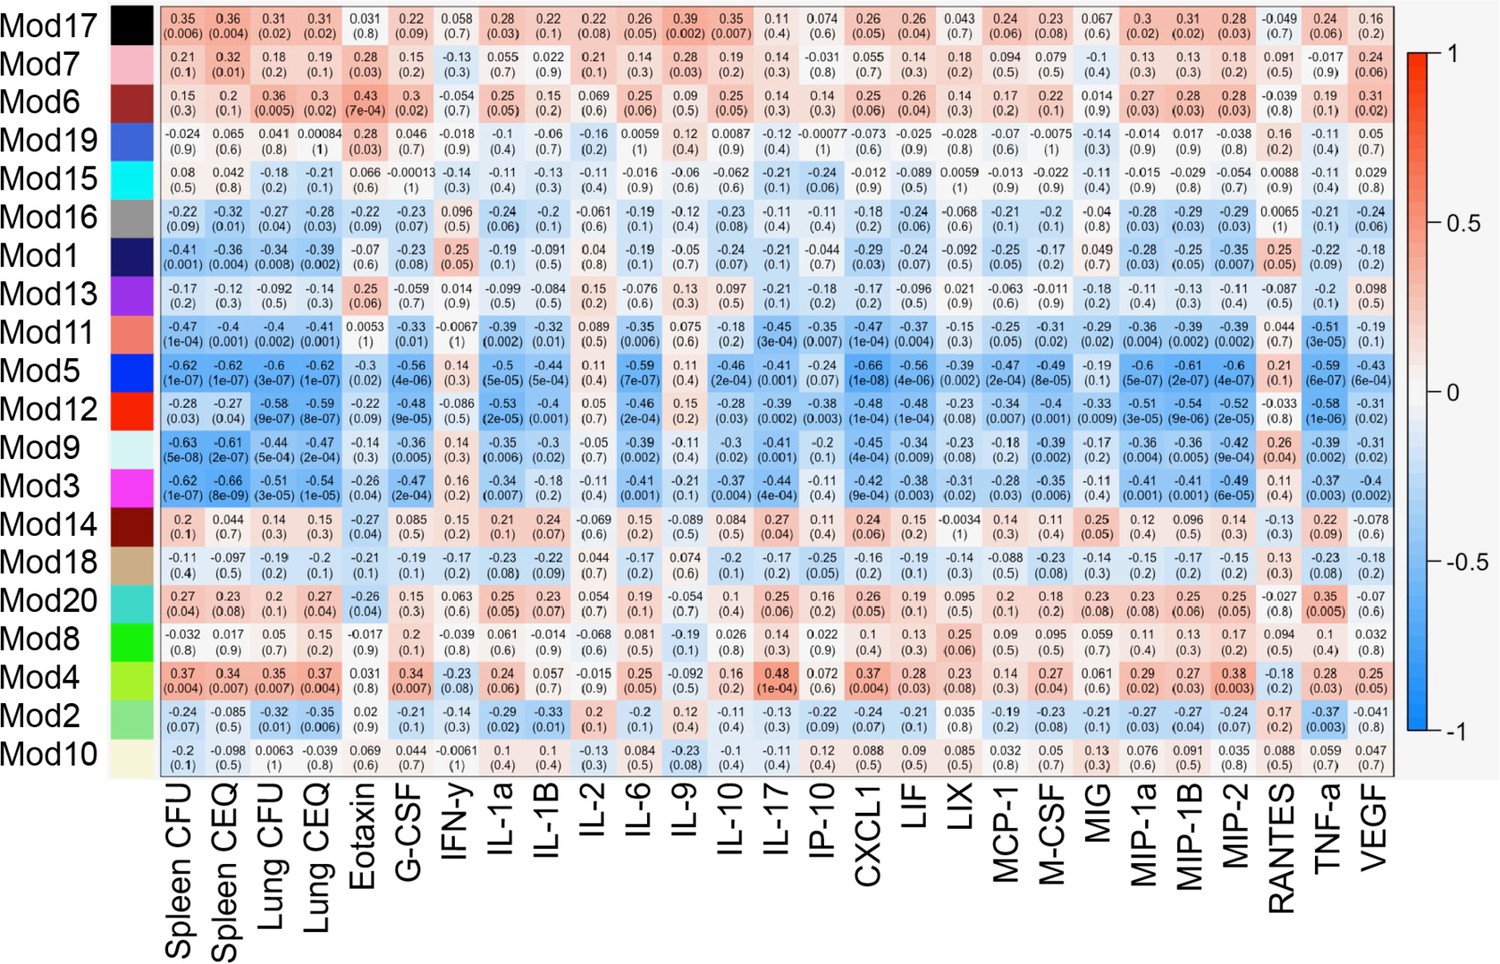
Module-trait associations.
Rows correspond to modules, columns to clinical traits. Numbers in each cell give the Pearson correlation between the module eigengene and the trait values across the 60 mouse panel (p-values in parentheses). Cells are colored by correlation as shown in the color legend (right).
Figure 6

Identification of ‘Host Interacting with Pathogen’ QTL mapping (HipQTL).
(A) Manhattan plot of single Mtb mutant QTL mapping across the mouse genome. Each dot represents an individual Mtb mutant plotted at the chromosomal location of its maximum LOD score. Red dashed line indicates p < 0.01; Blue p < 0.05. (B) Chromosome 10 QTL (in Mb) corresponding to Mtb eigentraits identified in network analysis in Figure 5. Module 3 (Type VII secretion, ESX1 operon; orange), Module 4 (Mycobactin synthesis, mbt; green) and Module 16 (Cholesterol uptake, mce4; purple) are shown. Solid and dotted lines indicated p = 0.05 and p = 0.1, respectively. Chromosomal position is in megabase units (Mb). (C–E) QTL mapping of single Mtb mutants corresponding to the (C) ESX1 module, (D) mbt module and (E) mce4 modules. Coincidence of multiple QTL was assessed by the NL-method of Neto et al., 2012. Thresholds shown are for N = 9, N = 8, and N = 6 for panels C, D, and E, respectively. Chromosomal position is in megabase units (Mb). (F) Parental founder effects underlying Module 3, 4, and 16 QTL. Allele effects were calculated at the peak LOD score marker on chromosome 10. (G) Distribution of log2 fold change (LFC) of representative single mutants from each module; eccCa1 (ESX1 module), mbtE (mbt module), and mce4F (mce4 module) relative to in vitro. Each dot is the LFC of the specified mutant in each CC mouse strain. Box and whiskers plots of each trait indicate the median and interquartile range. (H) Spleen CEQ and Spleen CFU for CC strains (box plots as in G). Mouse values are grouped by the parental haplotype allele series underlying the chromosome 10 Hip42 locus (NOD/WSB vs AJ/B6/NZO). Each dot represents the average CFU/CEQ of each CC genotype. Statistical differences in disease-associated traits and distinct haplotypes groups were assessed by t-test. LOD, logarithm of the odds; LFC, log2 fold change; CEQ, chromosomal equivalents; CFU, colony-forming units.
Figure 7
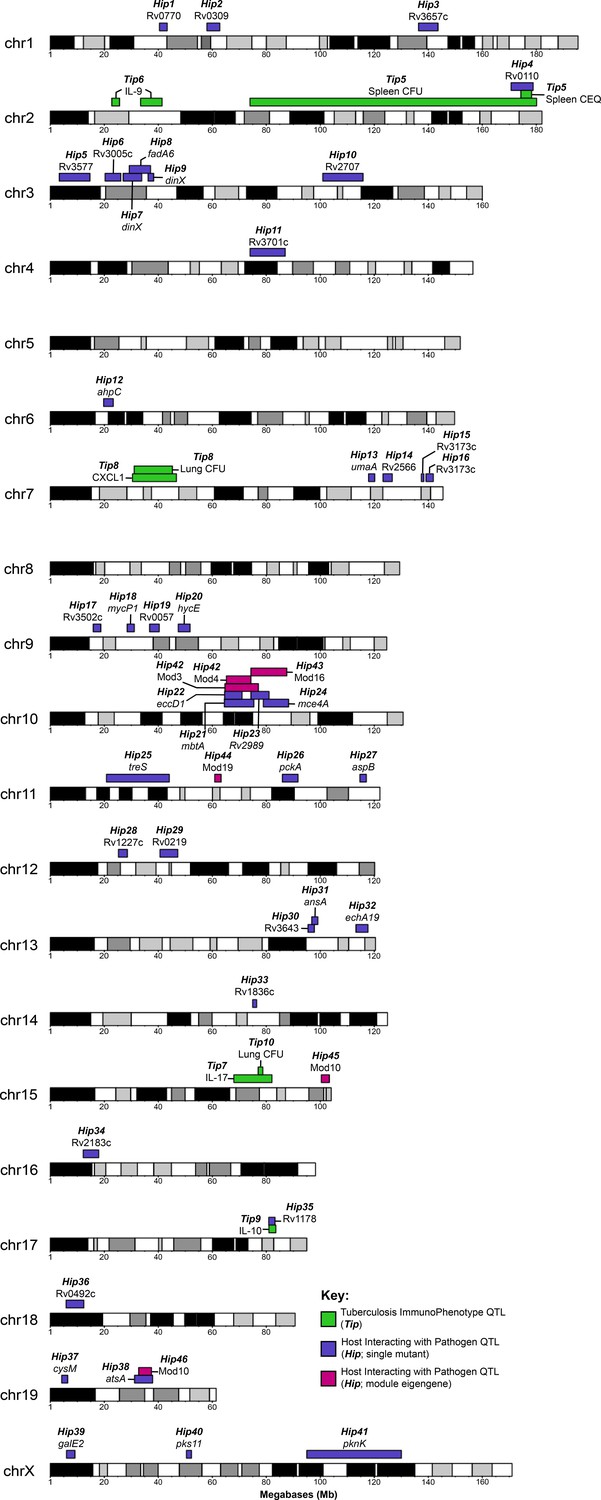
Visual representation of all Tip and HipQTL mapped in the CC TnSeq infection screen.
Tuberculosis ImmunoPhenotypes (Tip) QTL (QTL mapped by disease-associated traits in CC mice), are shown in green. TipQTL mapped by separate traits that share similar founder effects were considered to be the same QTL and were named accordingly. Host Interacting with Pathogen (Hip) QTL, (QTL mapped by individual TnSeq mutant relative abundance profiles), are shown in purple. After WGCNA mutant clustering and mapping with representative eigengenes from each module, QTL mapped by module eigengenes are shown in magenta.
Tables
Table 1
Disease-related Tuberculosis ImmunoPhenotype QTL (TipQTL).
Multiple QTL within the same interval and clear allele effects are designated with the same TipQTL number. p-Values are determined by Churchill-Doerge permutations (Churchill and Doerge, 1994). Column headings: QTL, quantitative trait loci; Chr, chromosome; LOD, logarithm of the odds; CEQ, chromosomal equivalents.
| QTL | Trait | Chr | LOD | p value | Interval start (Mb) | Peak (Mb) | Interval end (Mb) |
|---|---|---|---|---|---|---|---|
| Tip5 | Spleen CEQ | 2 | 9.14 | 2.38E-02 | 174.29 | 178.25 | 178.25 |
| Tip5 | Spleen CFU | 2 | 7.04 | 2.19E-01 | 73.98 | 174.29 | 180.10 |
| Tip6 | IL-9 | 2 | 8.61 | 4.52E-02 | 33.43 | 41.4 | 41.48 |
| Tip6 | IL-9 | 2 | 7.85 | 1.26E-01 | 22.77 | 24.62 | 25.65 |
| Tip7 | IL-17 | 15 | 7.84 | 5.27E-02 | 67.98 | 74.14 | 82.11 |
| Tip8 | CXCL1 | 7 | 7.57 | 1.06E-01 | 30.43 | 45.22 | 46.72 |
| Tip8 | Lung CFU | 7 | 7.47 | 1.17E-01 | 31.06 | 37.78 | 45.22 |
| Tip9 | IL-10 | 17 | 7.16 | 1.85E-01 | 80.98 | 82.47 | 83.55 |
| Tip10 | Lung CFU | 15 | 7.13 | 1.86E-01 | 77.00 | 78.16 | 78.70 |
Table 2
HipQTL for single Mtb mutant QTL and eigentrait/module QTL.
Hip1-41 each represent host loci associated with the relative abundance of a single mutant (p < 0.05). Hip42-46 correspond to Mtb eigentraits identified in network analysis in Figure 5 (including significant p < 0.05 and suggestive p < 0.25). Figure column headings: QTL, quantitative trait loci; Mtb, Mycobacterium tuberculosis; Module #, module number determined from WGCNA modules; ORF, open reading frame; ID, identification number; LOD, logarithm of the odds; Chr, chromosome.
| QTL | Trait | Mtb ORF ID | Module # | LOD | P value | Chr | Start (Mb) | Peak (Mb) | End (Mb) |
|---|---|---|---|---|---|---|---|---|---|
| Hip1 | rv0770 | RVBD_0770 | mod17 | 9.81 | 5.61E-03 | 1 | 40.43 | 42.73 | 43.32 |
| Hip2 | rv0309 | RVBD_0309 | mod13 | 7.95 | 3.22E-02 | 1 | 57.99 | 58.18 | 62.79 |
| Hip3 | rv3657c | RVBD_3657 c | mod15 | 7.90 | 4.95E-02 | 1 | 136.39 | 138.24 | 143.60 |
| Hip4 | rv0110 | RVBD_0110 | mod18 | 7.79 | 4.39E-02 | 2 | 170.67 | 174.00 | 178.84 |
| Hip5 | rv3577 | RVBD_3577 | mod7 | 9.23 | 3.83E-02 | 3 | 3.32 | 10.03 | 14.67 |
| Hip6 | rv3005c | RVBD_3005 c | mod6 | 8.03 | 3.75E-02 | 3 | 20.31 | 26.12 | 26.12 |
| Hip7 | dinX | RVBD_1537 | mod15 | 9.97 | 5.38E-03 | 3 | 26.99 | 30.29 | 33.85 |
| Hip8 | fadA6 | RVBD_3556 c | mod5 | 8.74 | 1.01E-02 | 3 | 29.23 | 35.22 | 37.11 |
| Hip9 | dinX | RVBD_1537 | mod15 | 9.22 | 1.60E-02 | 3 | 36.22 | 36.83 | 38.27 |
| Hip10 | rv2707 | RVBD_2707 | mod6 | 8.17 | 4.21E-02 | 3 | 100.90 | 103.23 | 115.82 |
| Hip11 | rv3701c | RVBD_3701 c | mod6 | 7.90 | 3.38E-02 | 4 | 74.00 | 78.25 | 87.00 |
| Hip12 | ahpC | RVBD_2428 | mod13 | 8.12 | 2.14E-02 | 6 | 19.75 | 22.21 | 23.31 |
| Hip13 | umaA | RVBD_0469 | mod20 | 8.32 | 2.31E-02 | 7 | 117.87 | 118.41 | 120.15 |
| Hip14 | rv2566 | RVBD_2566 | mod15 | 7.86 | 4.55E-02 | 7 | 123.21 | 126.67 | 126.67 |
| Hip15 | rv3173c | RVBD_3173 c | mod5 | 8.17 | 3.03E-02 | 7 | 137.41 | 138.36 | 138.36 |
| Hip16 | rv3173c | RVBD_3173 c | mod5 | 8.12 | 3.28E-02 | 7 | 139.15 | 140.76 | 141.88 |
| Hip17 | rv3502c | RVBD_3502 c | mod5 | 8.16 | 3.17E-02 | 9 | 15.91 | 16.33 | 18.72 |
| Hip18 | mycP1 | RVBD_3883 c | mod3 | 9.09 | 3.66E-03 | 9 | 28.47 | 29.45 | 31.10 |
| Hip19 | rv0057 | RVBD_0057 | mod6 | 8.39 | 3.79E-02 | 9 | 36.78 | 40.07 | 40.36 |
| Hip20 | hycE | RVBD_0087 | mod20 | 8.21 | 1.40E-02 | 9 | 47.40 | 47.93 | 51.80 |
| Hip21 | mbtA | RVBD_2384 | mod4 | 8.30 | 2.05E-02 | 10 | 64.48 | 68.09 | 75.42 |
| Hip22 | eccD1 | RVBD_3877 | mod3 | 8.08 | 3.08E-02 | 10 | 64.56 | 68.12 | 71.04 |
| Hip23 | rv2989 | RVBD_2989 | mod12 | 9.16 | 1.67E-02 | 10 | 74.30 | 77.63 | 81.03 |
| Hip24 | mce4A | RVBD_3499 c | mod16 | 7.91 | 4.12E-02 | 10 | 78.88 | 81.36 | 88.25 |
| Hip25 | treS | RVBD_0126 | mod7 | 7.94 | 3.04E-02 | 11 | 20.80 | 36.14 | 44.06 |
| Hip26 | pckA | RVBD_0211 | mod3 | 7.67 | 4.74E-02 | 11 | 85.95 | 89.78 | 91.75 |
| Hip27 | aspB | RVBD_3565 | mod7 | 8.32 | 3.66E-02 | 11 | 114.69 | 116.99 | 117.08 |
| Hip28 | rv1227c | RVBD_1227 c | mod17 | 9.16 | 4.64E-02 | 12 | 25.23 | 25.23 | 28.54 |
| Hip29 | rv0219 | RVBD_0219 | mod20 | 7.94 | 3.09E-02 | 12 | 40.65 | 42.65 | 47.22 |
| Hip30 | rv3643 | RVBD_3643 | mod8 | 8.89 | 1.04E-02 | 13 | 95.43 | 97.08 | 97.79 |
| Hip31 | ansA | RVBD_1538 c | mod11 | 8.28 | 3.32E-02 | 13 | 96.82 | 97.79 | 99.09 |
| Hip32 | echA19 | RVBD_3516 | mod20 | 9.68 | 3.95E-02 | 13 | 113.20 | 114.59 | 117.64 |
| Hip33 | rv1836c | RVBD_1836 c | mod15 | 9.19 | 1.75E-02 | 14 | 74.94 | 76.40 | 76.43 |
| Hip34 | rv2183c | RVBD_2183 c | mod11 | 7.75 | 4.84E-02 | 16 | 12.18 | 14.06 | 17.92 |
| Hip35 | rv1178 | RVBD_1178 | mod6 | 8.19 | 4.76E-02 | 17 | 80.92 | 80.92 | 83.23 |
| Hip36 | rv0492c | RVBD_0492 c | mod17 | 8.90 | 3.18E-02 | 18 | 5.85 | 5.85 | 12.40 |
| Hip37 | cysM | RVBD_1336 | mod12 | 8.47 | 8.67E-03 | 19 | 4.20 | 6.46 | 6.46 |
| Hip38 | atsA | RVBD_0711 | mod1 | 8.58 | 1.38E-02 | 19 | 31.21 | 37.86 | 37.93 |
| Hip39 | galE2 | RVBD_0501 | mod6 | 8.10 | 2.85E-02 | X | 6.01 | 6.01 | 9.12 |
| Hip40 | pks11 | RVBD_1665 | mod17 | 8.25 | 1.94E-02 | X | 50.43 | 51.75 | 52.29 |
| Hip41 | pknK | RVBD_3080 c | mod17 | 8.73 | 3.79E-02 | X | 95.01 | 102.02 | 130.04 |
| Hip42 | Module 3 | ESX1 operon | mod3 | 7.80 | 5.38E-02 | 10 | 64.7 | 68.27 | 77.07 |
| Hip42 | Module 4 | Mycobactin (mbt) | mod4 | 7.79 | 5.05E-02 | 10 | 65.23 | 69.94 | 74.30 |
| Hip43 | Module16 | mce4 operon | mod16 | 7.53 | 7.97E-02 | 10 | 74.30 | 81.36 | 87.61 |
| Hip44 | Module 19 | unclassified | Module 19 | 7.64 | 1.39E-01 | 11 | 60.87 | 62.20 | 63.26 |
| Hip45 | Module 10 | Transcriptional regulation | Module 10 | 6.95 | 1.04E-01 | 15 | 100.39 | 102.25 | 103.36 |
| Hip46 | Module 10 | Transcriptional regulation | Module 10 | 6.32 | 2.54E-01 | 19 | 32.74 | 32.87 | 37.48 |
Table 3
Candidate genes within QTL regions.
Prioritized candidates shown for selected QTL. Candidates were prioritized by filtering on (1) differential expression during Mtb infection, and (2) variants within TB-expressed genes that segregated between informative CC haplotypes. Genes listed below contain non-synonymous variants (i.e. amino acid changes, regulatory mutations or splicing mutations) consistent with the identified singly causal haplotype (NOD for Tip5; CAST for Tip8). Hip42 displayed a more complex haplotype pattern (WSB/NOD vs AJ/B6/NZO), and candidate selection is discussed in the main text. Genes with missense or nonsense variants (denoted by *).
| Tip5 | Tip8 | Hip42 | |
|---|---|---|---|
| Ctsz | Fxyd5* | Siglecg | Ank3 |
| Tubb1 | Fxyd1 | Nkg7 | Cdk1 |
| Atp5e | Lgi4 | Cd33* | Tmem26 |
| Prelid3b | Fxyd3 | Siglece* | Slc16a9 |
| Zfp831* | Hpn | Klk13 | Fam13c |
| Edn3 | Scn1b | Klk8 | Rhobtb1 |
| Gm14391* | Gramd1a* | Klk7* | |
| Gm6710 | Pdcd2l* | Klk1b9* | |
| Zfp931 | Gpi1 | Klk1 | |
| 4931406P16Rik | Clec11a | ||
| Kctd15 | Shank1 | ||
| Chst8 | Syt3 | ||
| Pepd | Lrrc4b | ||
| Cebpa | Josd2 | ||
| Slc7a10 | Spib | ||
| Lrp3* | Pold1 | ||
| Rhpn2 | Napsa* | ||
| Faap24 | Kcnc3 | ||
| Tdrd12* | Myh14 | ||
| Ankrd27* | Atf5 | ||
| Pdcd5 | Il4i1 | ||
| Dpy19l3 | Pnkp* | ||
| Tshz3* | Ptov1 | ||
| Ccne1 | Fuz | ||
| 1600014C10Rik | Tsks | ||
| Plekhf1 | Cpt1c* | ||
| Vstm2b | |||
| Zfp975* | |||
| Zfp715* |
Key resources table
| Reagent type (species) or resource | Designation | Source or reference | Identifiers | Additional information |
|---|---|---|---|---|
| Strain, strain background (Mus musculus, male) | Collaborative Cross mice | DOI: https://doi.org/10.1038/ng1104-113 | ||
| Strain, strain background (Mycobacterium tuberculosis) | H37Rv | DOI: 10.1073/pnas.2134250100 | ||
| Genetic reagent (Mycobacterium tuberculosis) | ∆glpK; ∆pstC2; ∆eccB1; ∆mbtA; | DOI: 10.1128/mBio.01467–18 | ||
| Genetic reagent (Mycobacterium tuberculosis) | ∆BioA | DOI: 10.1371/journal.ppat.1002264 | ||
| Recombinant DNA reagent | pKM464 (plasmid) | DOI: 10.1128/mBio.01467–18 | ||
| Recombinant DNA reagent | Barcode qtag (plasmid) | DOI: 10.1128/mSystems.00396–20 | ||
| Sequence-based reagent | qtag/barcode sequencing primer sets | DOI: 10.1128/mSystems.00396–20 | Table S6 | |
| Sequence-based reagent | MiniMUGA genotyping array | Neogen Inc | ||
| Sequence-based reagent | GigaMUGA genotyping array | Neogen Inc | ||
| Commercial assay or kit | 32-plex cytokine assay | Eve Technologies, Calgary, CA | ||
| Software, algorithm | R/qtl2 | DOI: 10.1534/genetics.118.301595 | Dr. Karl Broman (University of Wisconsin-Madison) | |
| Software, algorithm | WGCNA | DOI: 10.1186/1471-2105-9-559 | Dr. Peter Langfelder (UCLA) |
Appendix 1—table 1
Heritability (h2) estimates for each measured TB-disease associated phenotype (Tuberculosis ImmunoPhenotypes;Tip).
h2 was calculated from the percentage of variation attributed to strain differences in each trait across the CC strains, as previously described (Noll et al., 2020). P-values were calculated by ANOVA and multiple-test corrected using the Benjamini-Hochberg method. Weight change is the percentage of weight (grams), CFU/CEQ is log10 transformed, cytokines are measured in pg/mL lung homogenate and log10 transformed.
| Trait | h2 (%) | p-value | Adj. p-value |
|---|---|---|---|
| IFN-γ | 87.70 | 7.90E-20 | 2.21E-18 |
| Lung CFU | 83.30 | 5.83E-15 | 8.16E-14 |
| Lung CEQ | 80.55 | 2.65E-14 | 2.47E-13 |
| CXCL1 | 81.57 | 8.19E-14 | 5.73E-13 |
| MIG | 81.19 | 1.62E-13 | 9.09E-13 |
| MIP-2 | 80.82 | 3.07E-13 | 1.43E-12 |
| IP-10 | 80.13 | 9.73E-13 | 3.89E-12 |
| M-CSF | 79.33 | 3.54E-12 | 1.24E-11 |
| IL-17 | 78.85 | 7.43E-12 | 2.31E-11 |
| MIP-1α | 78.02 | 2.53E-11 | 7.08E-11 |
| G-CSF | 77.71 | 3.98E-11 | 1.01E-10 |
| MCP-1 | 77.05 | 1.00E-10 | 2.34E-10 |
| IL-1α | 75.62 | 6.60E-10 | 1.42E-09 |
| IL-6 | 73.97 | 4.89E-09 | 9.77E-09 |
| RANTES | 73.70 | 6.63E-09 | 1.20E-08 |
| Spleen CFU | 72.94 | 6.83E-09 | 1.20E-08 |
| LIF | 73.48 | 8.50E-09 | 1.40E-08 |
| VEGF | 73.08 | 1.34E-08 | 2.08E-08 |
| IL-1β | 71.66 | 6.11E-08 | 9.00E-08 |
| Weight Change | 67.56 | 8.75E-07 | 1.22E-06 |
| MIP-1β | 68.51 | 1.23E-06 | 1.65E-06 |
| TNF-α | 66.38 | 7.39E-06 | 9.41E-06 |
| LIX | 65.30 | 1.70E-05 | 2.07E-05 |
| Eotaxin | 64.27 | 3.63E-05 | 4.23E-05 |
| IL-10 | 63.97 | 4.48E-05 | 5.02E-05 |
| IL-2 | 62.87 | 9.59E-05 | 1.03E-04 |
| Spleen CEQ | 60.43 | 1.09E-04 | 1.13E-04 |
| IL-9 | 56.79 | 3.19E-03 | 3.19E-03 |
Additional files
Download links
A two-part list of links to download the article, or parts of the article, in various formats.
Downloads (link to download the article as PDF)
Open citations (links to open the citations from this article in various online reference manager services)
Cite this article (links to download the citations from this article in formats compatible with various reference manager tools)
Host-pathogen genetic interactions underlie tuberculosis susceptibility in genetically diverse mice
eLife 11:e74419.
https://doi.org/10.7554/eLife.74419


