Weakly migratory metastatic breast cancer cells activate fibroblasts via microvesicle-Tg2 to facilitate dissemination and metastasis
- Department of Biomedical Engineering, Vanderbilt University, United States
- Department of Biomedical Engineering, Cornell University, United States
- Vanderbilt University Medical Center, United States
- Hume-Fogg Academic High School, United States
- CHU de Québec-Université Laval Research Center (Oncology division), UniversitéLaval Cancer Research Center and Faculty of Medicine, Université Laval, Canada
- Department of Biomedical Science, Cornell University, United States
- Department of Chemistry and Chemical Biology, Cornell University, United States
Figures
Figure 1
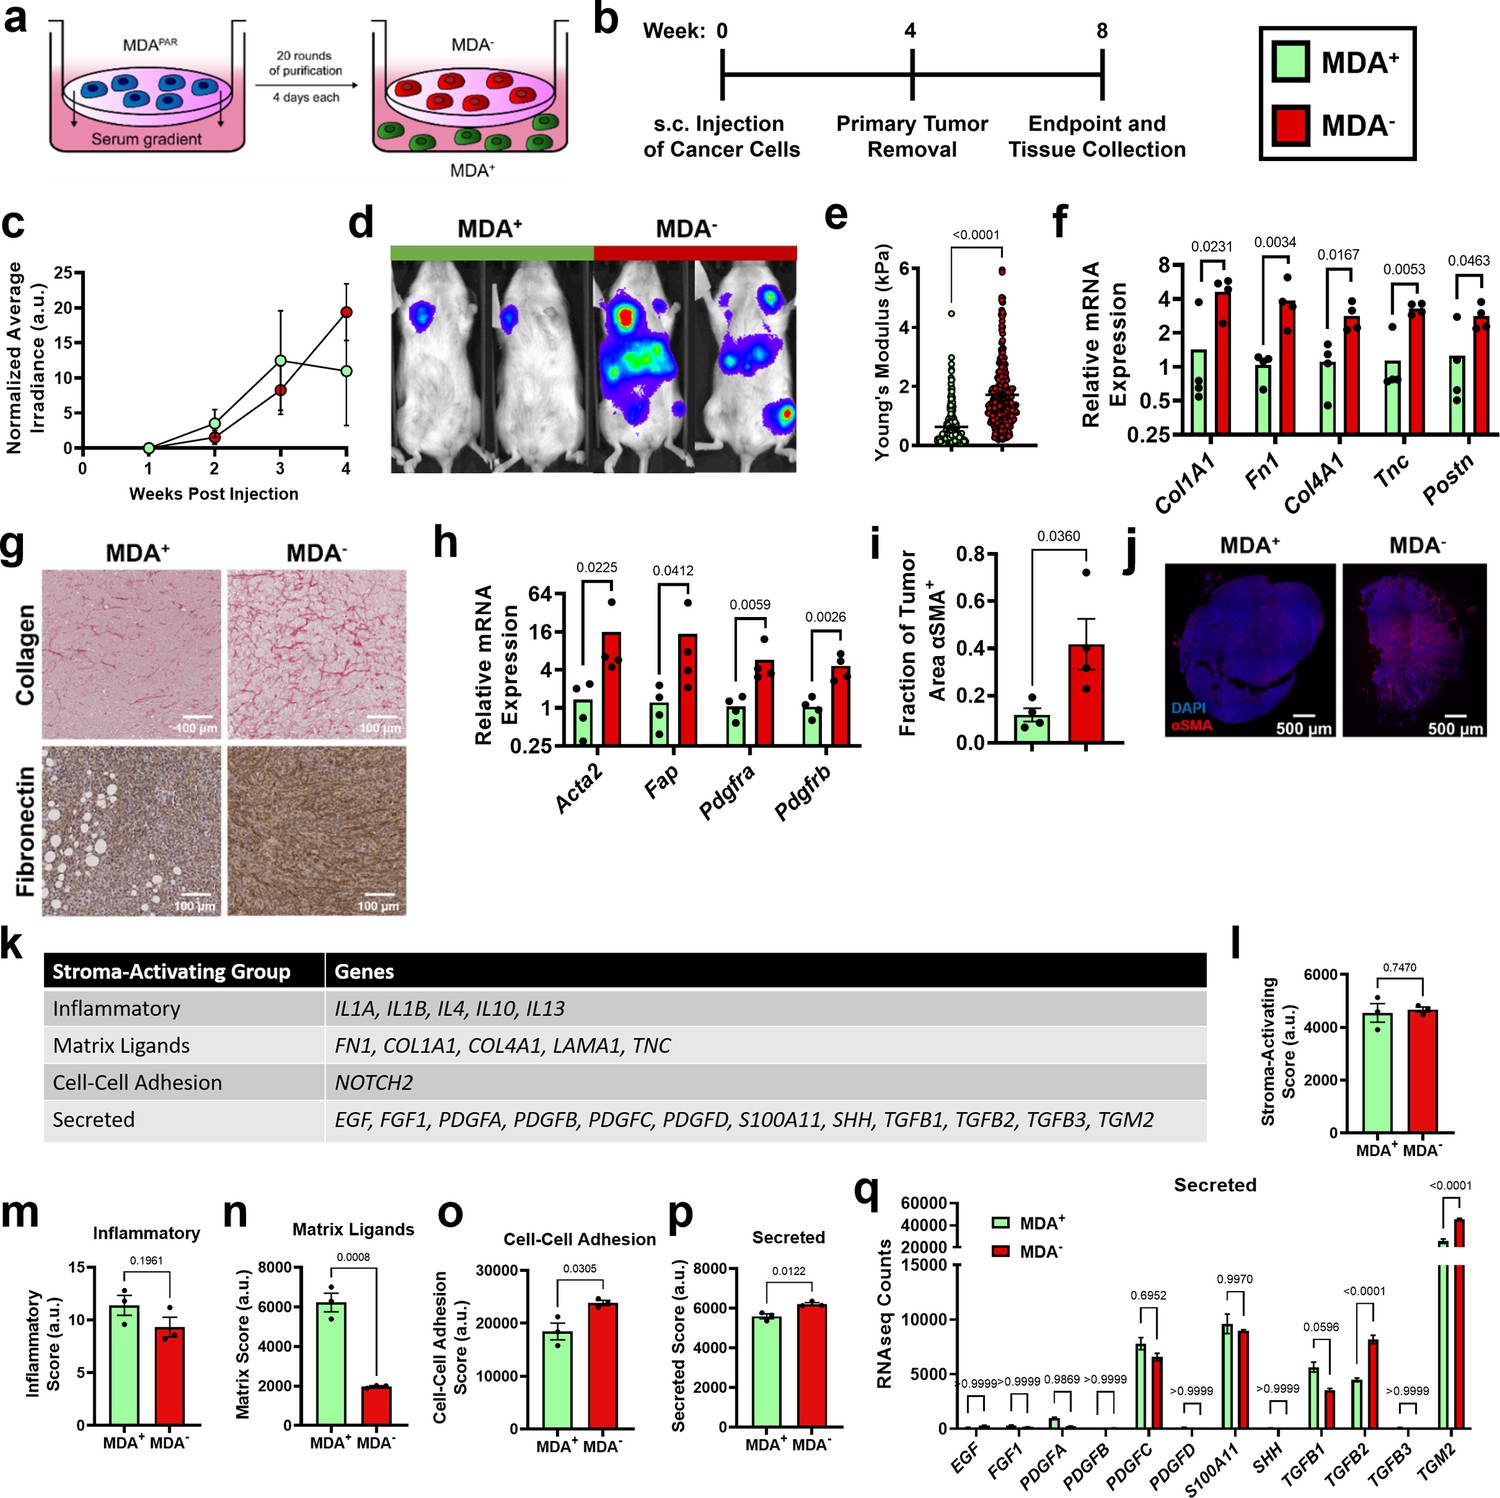
Highly and weakly migratory breast cancer subpopulations form tumors with distinct matrix and fibroblast populations.
(a) Schematic of phenotypic sorting. (b) Timeline of orthotopic mammary metastasis model. (c) Normalized average irradiance of MDA+ and MDA- primary tumors (N=3 mice). (d) Representative BLI of MDA+ and MDA- metastasis. (e) AFM stiffness measurements of MDA+ and MDA- primary tumors. (N=3 + tumors per condition; n=254, 280). (f) Relative mRNA expression of mouse-derived matrix components in MDA+ and MDA- primary tumors. (N=4 tumors per condition). (g) Immunohistochemical staining of collagen and fibronectin in MDA+ and MDA- primary tumors. (h) Relative mRNA expression of stromal CAF markers in MDA+ and MDA-. (N=4 tumors per condition). (i) Fraction of tumor area positive for αSMA (N=4). (j) Representative images of αSMA (red) and DAPI (blue) in MDA+ and MDA- tumors. (k) Stroma-Activating Score Group genes identified in RNAseq of MDA+ and MDA-. (l) Stroma-Activating Score of MDA+ and MDA- (N=3). (m) Inflammatory Score of MDA+ and MDA- (N=3). (n) Matrix Score of MDA+ and MDA- (N=3). (o) Cell-Cell Adhesion Score of MDA+ and MDA- (N=3). (p) Secreted Score of MDA+ and MDA- (N=3). (q) Inflammatory Score of MDA+ and MDA- (N=3). Secreted Score of MDA+ and MDA-, separated by gene (N=3). mRNA graphs show mean + individual data points. Bar graphs shown mean +/- SEM. p-values determined using an unpaired Student’s t-test. Source data available in Source data 2.
Figure 2 with 1 supplement

MV- are potent activators of fibroblasts in vitro.
(a) Number of MVs released from MDA+ and MDA- per hour (N=19, 16). (b) Size distribution of MVs isolated from MDA+ and MDA-. (c) Schematic overviewing fibroblast culture with MVs. (d) Western blot of pFAK, FAK, and GAPDH in fibroblasts cultured in cultured in control conditions (Ctrl), with MV+ (+MV+), or with MV- (+MV-). (e) Quantification of western blot from (d) (N=3). (f) Western blot of αSMA and GAPDH in fibroblasts cultured in in Ctrl, +MV+, or +MV- conditions (g) Quantification of western blot from (f) (N=4). (h) Fibroblast cell area after culture in Ctrl, +MV+, or +MV- conditions. (N=3; n=69, 75, 77). (i) Area of fibronectin deposited per fibroblast cultured in Ctrl, +MV+, or +MV- conditions. (N=3; n=66, 66, 61). (j) Percentage of fibroblasts EdU positive after culture in Ctrl, +MV+, or +MV- conditions. (N=3). (k) Fibroblast traction force after culture in Ctrl, +MV+, or +MV- conditions. (N=3; n=41, 57, 58). (l) Representative images of spheroid outgrowth 48 hr post embedding. MDA- (red); 3T3 fibroblast (gray). (m) Spheroid area index 48 hr post embedding. (N=3 + ; n=22, 31, 32, 22, 19). (n) Time series images of fibroblast leading MDA- escape from spheroid. (o) Spheroid area index 48 hr post embedding. (N=3 + ; n=28, 62, 34, 28). (p) Representative images of spheroid outgrowth 48 hr post embedding. MDA+ (green); 3T3 fibroblast (gray). Bar graphs show mean +/- SEM. Box and whisker plots show median and 25th-75th (box) and 10th-90th (whiskers) percentiles. p-Values determined using an unpaired Student’s t-test or a one-way ANOVA with Tukey’s test for multiple comparisons. Source data available in Source data 1 and 2.
Figure 2—figure supplement 1
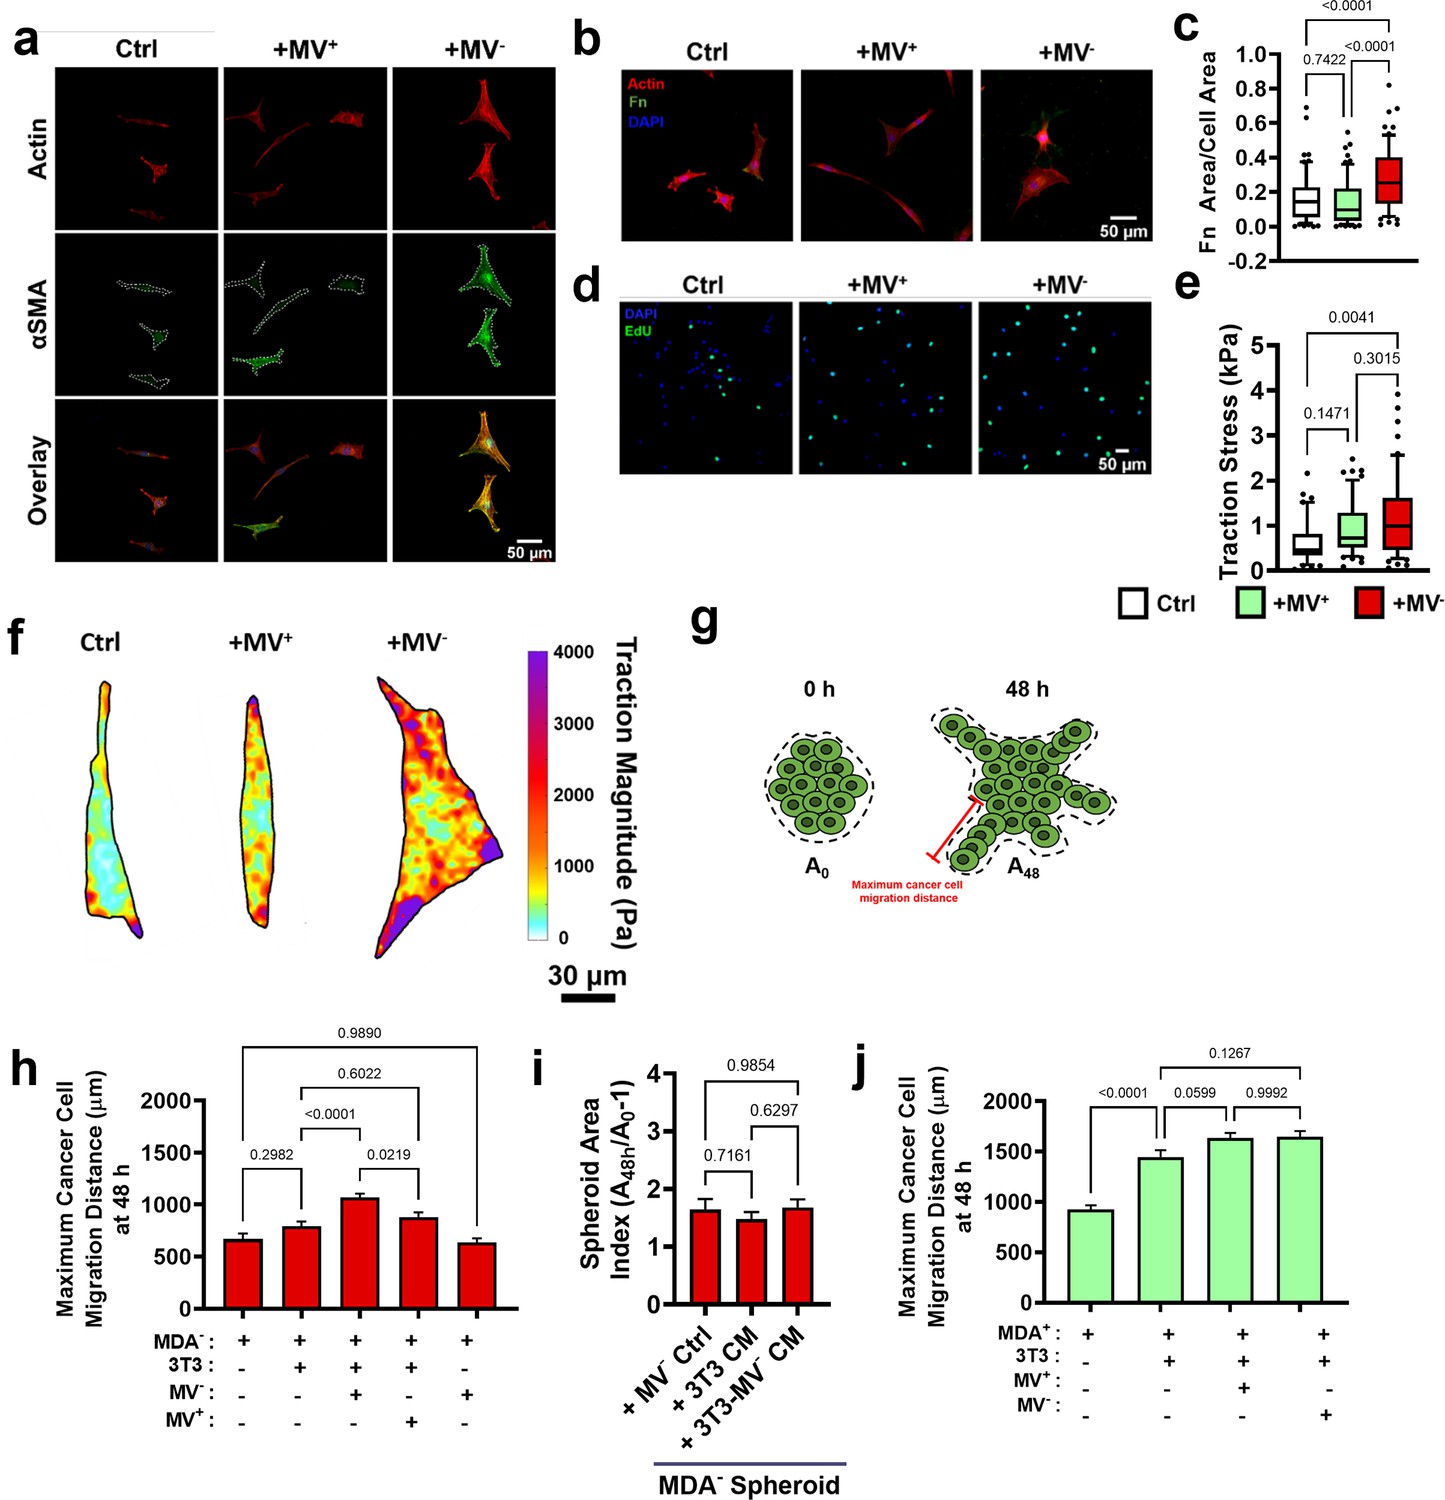
MV- activate fibroblasts in vitro.
(a) Representative images of fibroblast cell area (red) and αSMA expression (green) after culture in control conditions (Ctrl), with MV+ (+MV+), or with MV- (+MV-). (b) Representative images of fibroblast fibronectin deposition after culture in Ctrl, +MV+, or + MV- conditions. Actin (red); fibronectin (green); DAPI (blue). (c) To ensure that the increased fibronectin area was not a result of increased fibroblast spreading, fibronectin area was normalized to cell area. (N=3; n=66, 66, 61). (d) Representative images of fibroblast EdU incorporation after culture in Ctrl, +MV+, or + MV- conditions. DAPI (blue); EdU (green). (e) Fibroblast traction stress (calculated as fibroblast traction force / cell area) after culture in Ctrl, +MV+, or + MV- conditions. (N=3; n=41, 57, 58). (f) Representative fibroblast traction stress maps. (g) Schematic of spheroid outgrowth measurements. (h) Maximum distance of cancer cell migration away from spheroid core 48 hours post spheroid. (N=3 + , n=22, 31, 32, 22, 19) (i) Maximum distance of cancer cell migration away from spheroid core 48 hr post spheroid embedding. (N=3, n=19, 18, 17) (j) Maximum distance of cancer cell migration away from spheroid core 48 hr post spheroid embedding. (N=3 + ; n=28, 32, 54, 24). Bar graphs show mean +/- SEM. Box and whisker plots show median and 25th-75th (box) and 10th-90th (whiskers) percentiles. p-values determined using a one-way ANOVA with Tukey’s test for multiple comparisons. Source data available in Source data 2.
Figure 3 with 1 supplement
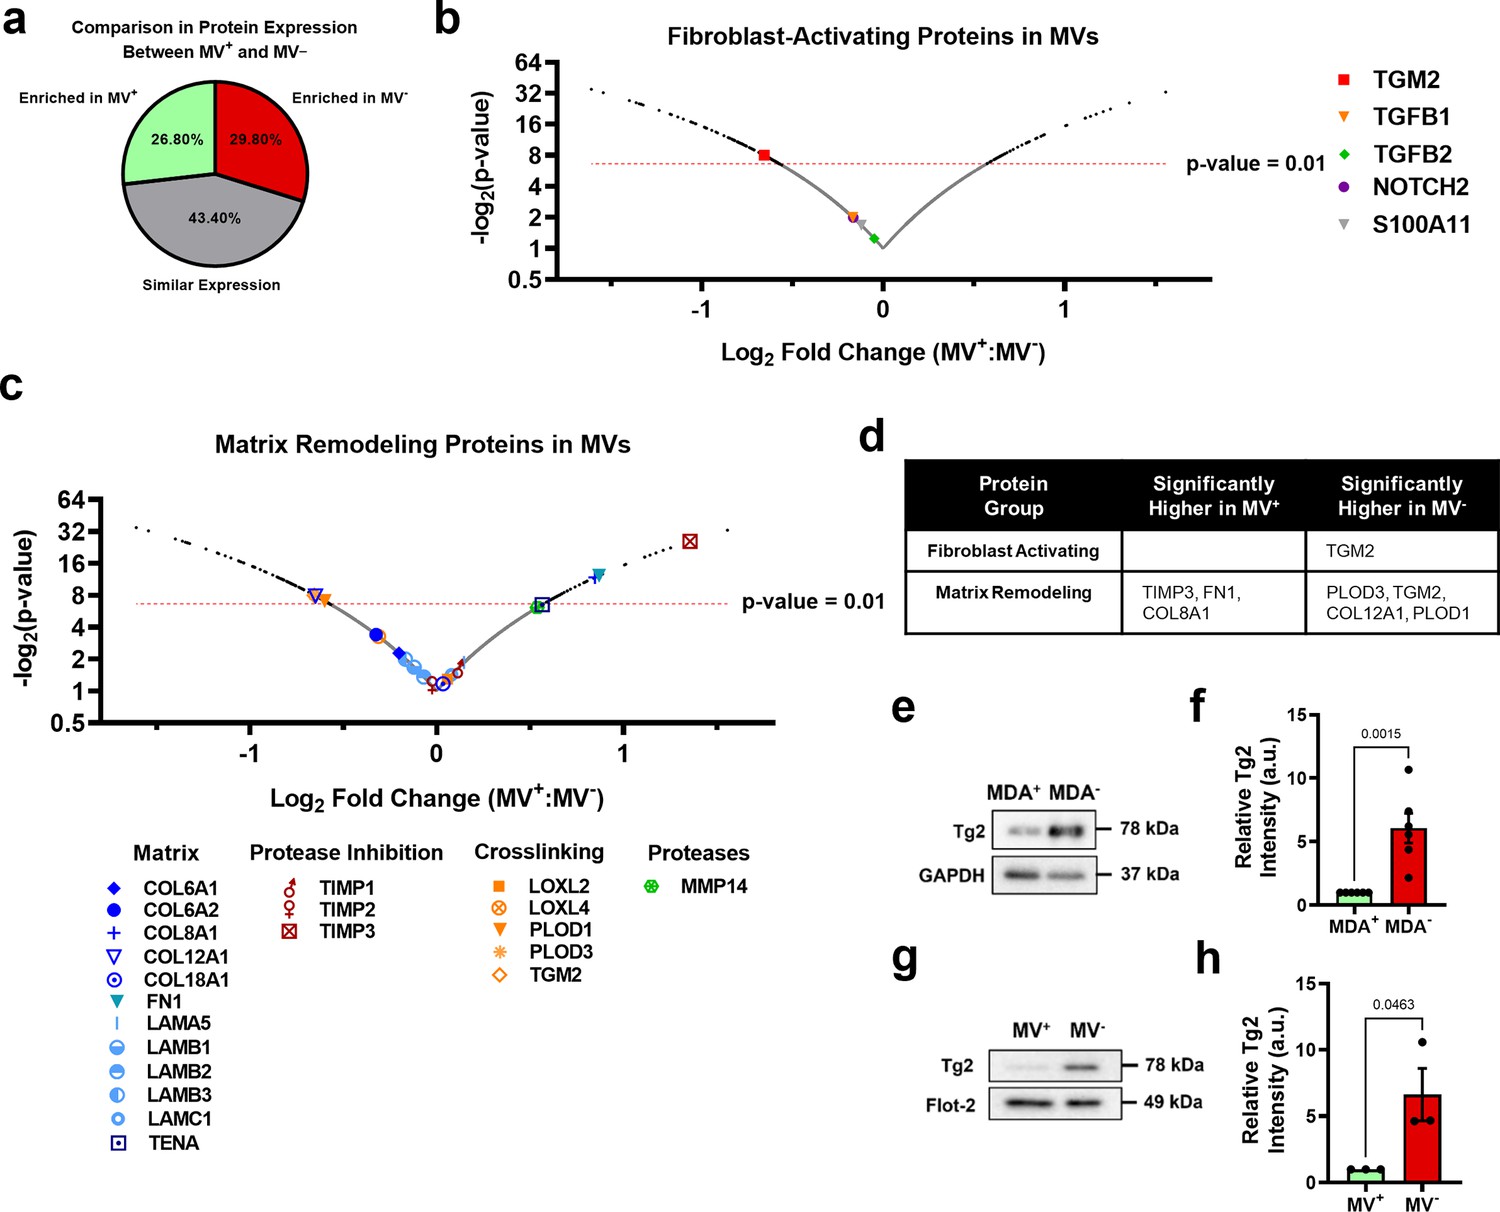
Phenotypically sorted breast cancer subpopulations release MVs with distinctly different contents.
(a) Comparison of protein expression between MV+ and MV-. Enriched in MV+=FC ≥ 1.1; similar expression = 0.9 < FC<1.1; enriched in MV-=FC ≤ 0.9. (b) Fibroblast-activating proteins identified in proteomics of MV+ and MV-. p-Value cut-off of 0.01 indicated with red-dotted line. (c) Matrix remodeling proteins identified in in proteomics of MV+ and MV-. p-Value cut-off of 0.01 indicated with red-dotted line. (d) Significantly upregulated genes (P<0.01) in MV+ and MV- involved in fibroblast activation and matrix remodeling. (e) Western blot of Tg2 and GAPDH in MDA+ and MDA-. (f) Quantification of western blot in (e) (N=6). (g) Western blot of Tg2 and Flot-2 in MV+ and MV-. (h) Quantification of western blot in (g) (N=3). Proteomics graphs show log2 Fold Change of MV+:MV- and each data point represents a protein. Bar graphs show mean +/- SEM. p-Values of bar graphs determined using an unpaired Student’s t-test. Source data avilable in Source data 1 and 2.
Figure 3—figure supplement 1
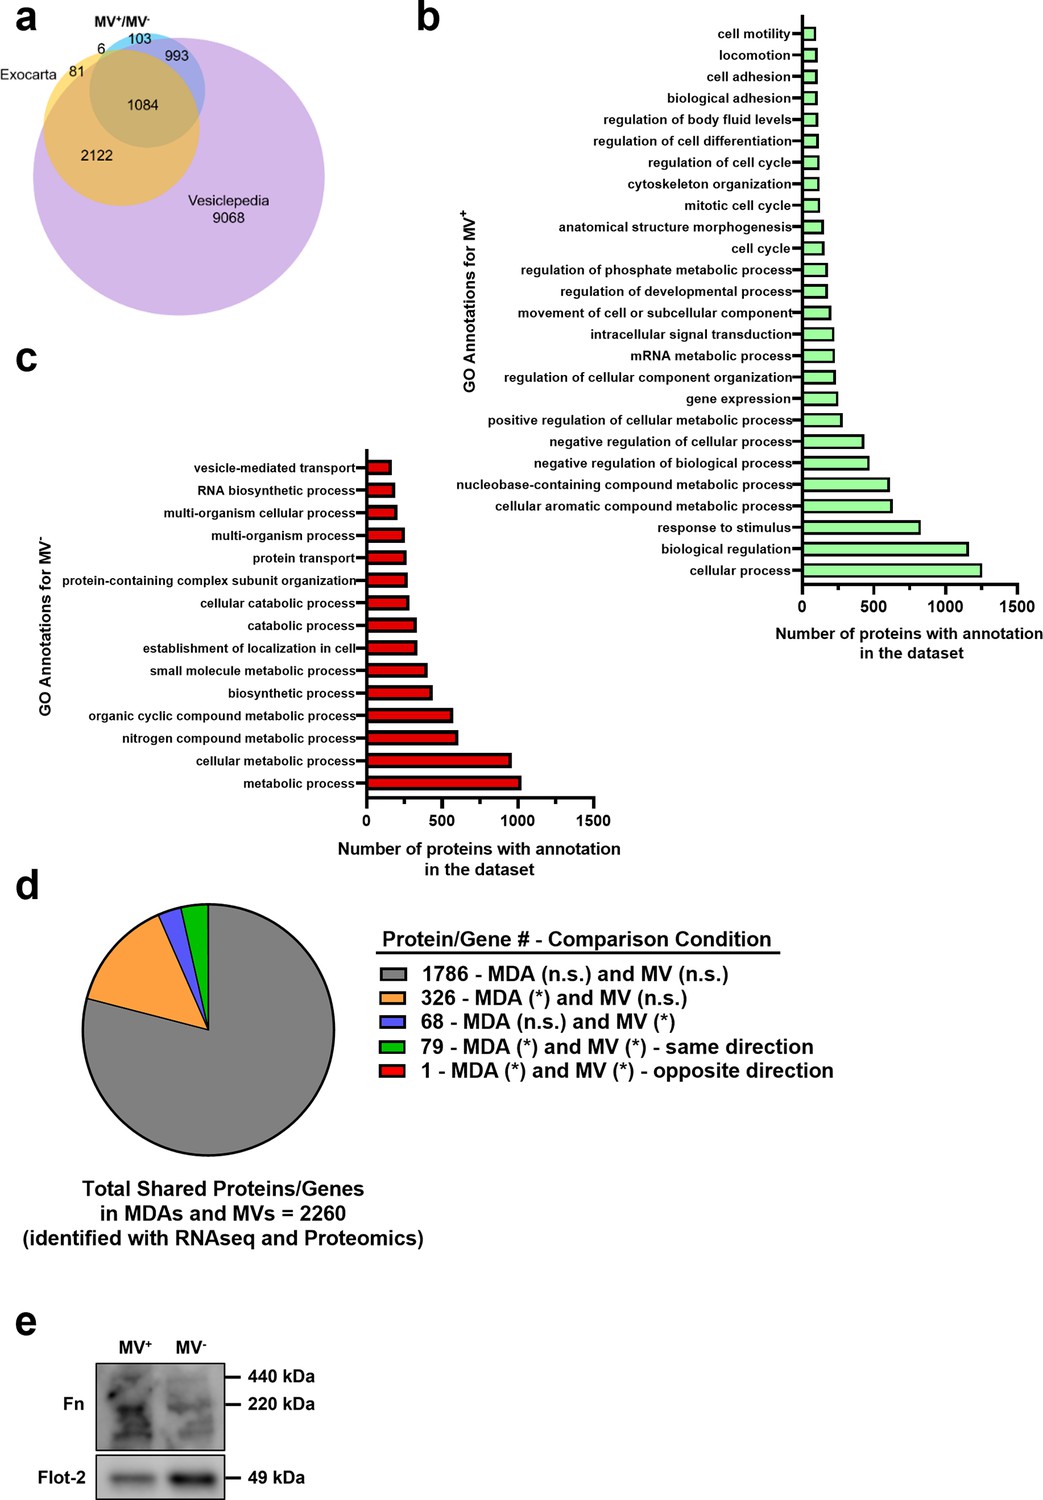
Proteomic analysis of MVs released from phenotypically sorted breast cancer cells.
(a) Comparison of proteomics of MV+ and MV- to Exocarta and Vesiclepedia databases. (b) GO annotations for proteins enriched in MV+. (c) GO annotations for proteins enriched in MV-. (d) Pie chart of RNA sequencing of MDA+ and MDA- and proteomics of MV+ and MV- comparison. (e) Western blot of Fn and Flot-2 in MV+ and MV-. (i) Western blot of Tg2 and GAPDH in MDA-, MDA- (scr), and MDA- (shTg2). Source data available in Source data 1 and 2.
Figure 4 with 3 supplements
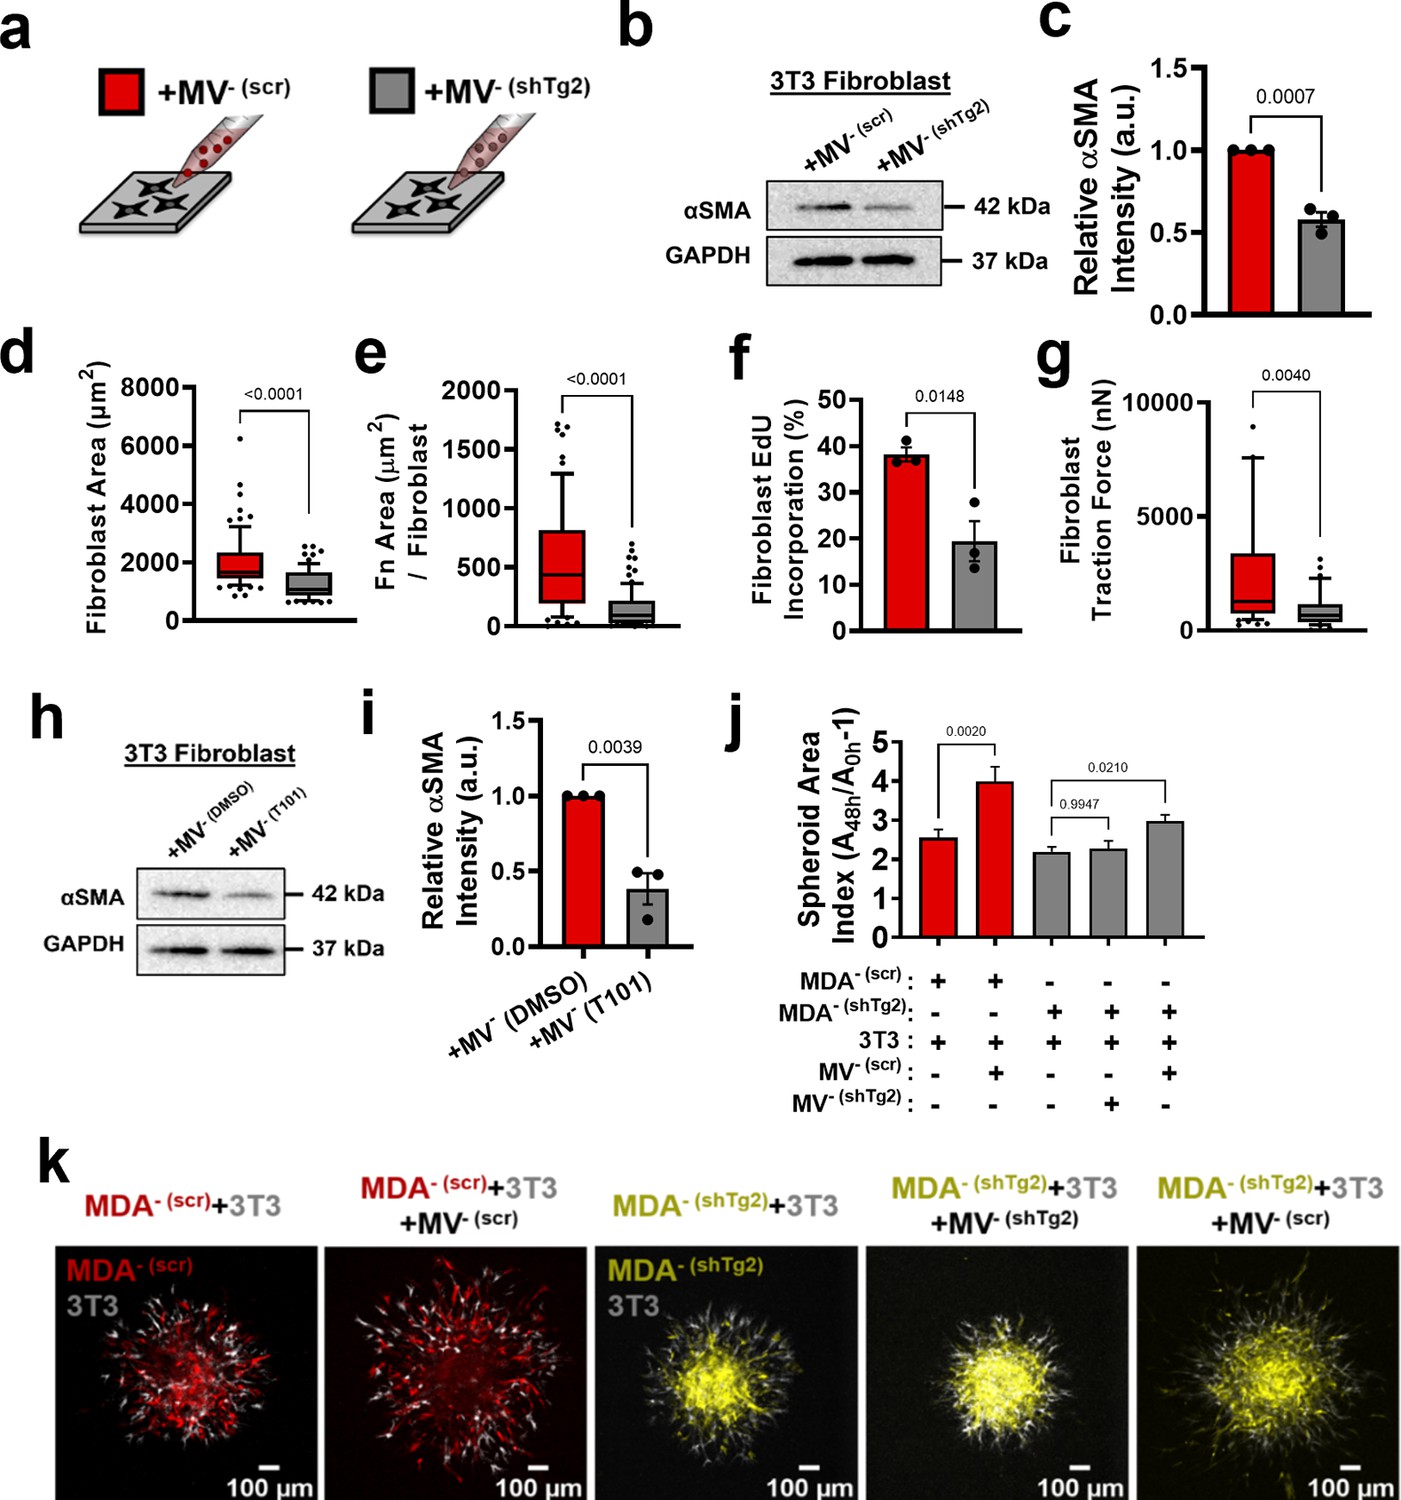
Modulation of Tg2 expression in MVs regulates MV-mediated fibroblast activation.
(a) Schematic overviewing fibroblast culture with MVs. (b) Western blot of αSMA and GAPDH in fibroblasts cultured with MV- (scr) (+MV- (scr)) or with MV- (shTg2) (+MV- (shTg2)). (c) Quantification of western blot in (b) (N=3). (d) Fibroblast cell area after culture in + MV- (scr) or + MV- (shTg2) conditions. (N=3; n=75,69). (e) Area of fibronectin deposited per fibroblast cultured in + MV- (scr) or + MV- (shTg2) conditions. (N=3; n=62, 82). (f) Percentage of fibroblasts EdU positive after culture in + MV- (scr) or + MV- (shTg2) conditions. (N=3). (g) Fibroblast traction force after culture in + MV- (scr) or + MV- (shTg2) conditions. (N=3; n=56, 33). (h) Western of blot of αSMA and GAPDH in fibroblasts cultured with MV- (DMSO) (+MV- (DMSO)) or with MV- (T101) (+MV- (T101)). (i) Quantification of western blot in (h) (N=3). (j) Spheroid area index quantification 48 hours post embedding. (N=3 + ; n=23, 23, 83, 60, 37). (k) Representative images of spheroid outgrowth 48 hours post embedding. MDA- (scr) (red); 3T3 fibroblast (gray); MDA- (shTg2) (yellow). Bar graphs show mean +/- SEM. Box and whisker plots show median and 25th-75th (box) and 10th-90th (whiskers) percentiles. P-values determined using an unpaired Student’s t-test or a one-way ANOVA with Tukey’s test for multiple comparisons. Source data available in Source data 1 and 2.
Figure 4—figure supplement 1

Modulation of Tg2 expression regulates fibroblast activation cargo in MVs.
(a) Western blot of Tg2 and GAPDH in MDA-, MDA- (scr), and MDA- (shTg2). (b) Quantification of western blot in (a). (c) Motile fraction of MDA- (scr) and MDA- (shTg2) in 3D collagen. (N=3; n=6). (d) Number of MVs released from MDA- (scr) and MDA- (shTg2) per hour. (N=7). (e) Invasive fraction of MDA- (scr) and MDA- (shTg2) through collagen coated transwells. (N=3; n=6). (f) Western blot of Tg2 and Flot-2 in MV- (scr) and MV- (shTg2). (g) Quantification of western blot in (f). Bar graphs show mean +/- SEM. p-Values determined using an unpaired Student’s t-test. (h) Comparison of protein expression between MV- (scr) and MV- (shTg2). Enriched in MV- (shTg2) = FC≥1.1; similar expression = 0.9 < FC<1.1; enriched in MV- (scr) = FC≤0.9. (i) GO annotations for proteins enriched in MV- (scr). (c) GO annotations for proteins enriched in MV- (shTg2). (k) Fibroblast-activating and matrix-remodeling proteins identified in proteomics of MV- (scr) and MV- (shTg2). p-Value cut-off of 0.01 indicated with red-dotted line. Data shown as mean +/- SEM or mean + individual data points. p-Values for panels c-e determined using an unpaired Student’s t-test. Source data available in Source data 1 and 2.
Figure 4—figure supplement 2

Modulation of Tg2 expression in MVs regulates MV-mediated fibroblast activation in vitro.
(a) Representative images of fibroblast area (red) and αSMA expression (green) after culture with MV- (scr) (+MV- (scr)) or MV- (shTg2) (+MV- (shTg2)). (b) Representative images of fibroblast fibronectin deposition after culture in + MV- (scr) or + MV- (shTg2) conditions. Actin (red); fibronectin (green); DAPI (blue). (c) Fibronectin area normalized to fibroblast cell area. (N=3; n=62, 82). (d) Representative images of fibroblast EdU incorporation after culture in + MV- (scr) or + MV- (shTg2) conditions. DAPI (blue); EdU (green). (e) Fibroblast traction stress (calculated as fibroblast traction force / cell area) after culture in + MV- (scr) or + MV- (shTg2) conditions. (N=3; n=56, 33). (f) Representative fibroblast traction stress maps. (g) Maximum distance of cancer cell migration away from spheroid core 48 hr post spheroid embedding. (N=3 + ; n=23, 23, 83, 60, 37). Bar graphs show mean +/- SEM. Box and whisker plots show median and 25th-75th (box) and 10th-90th (whiskers) percentiles. p-Values determined using an unpaired Student’s t-test or a one-way ANOVA with Tukey’s test for multiple comparisons. Source data available in Source data 2.
Figure 4—figure supplement 3
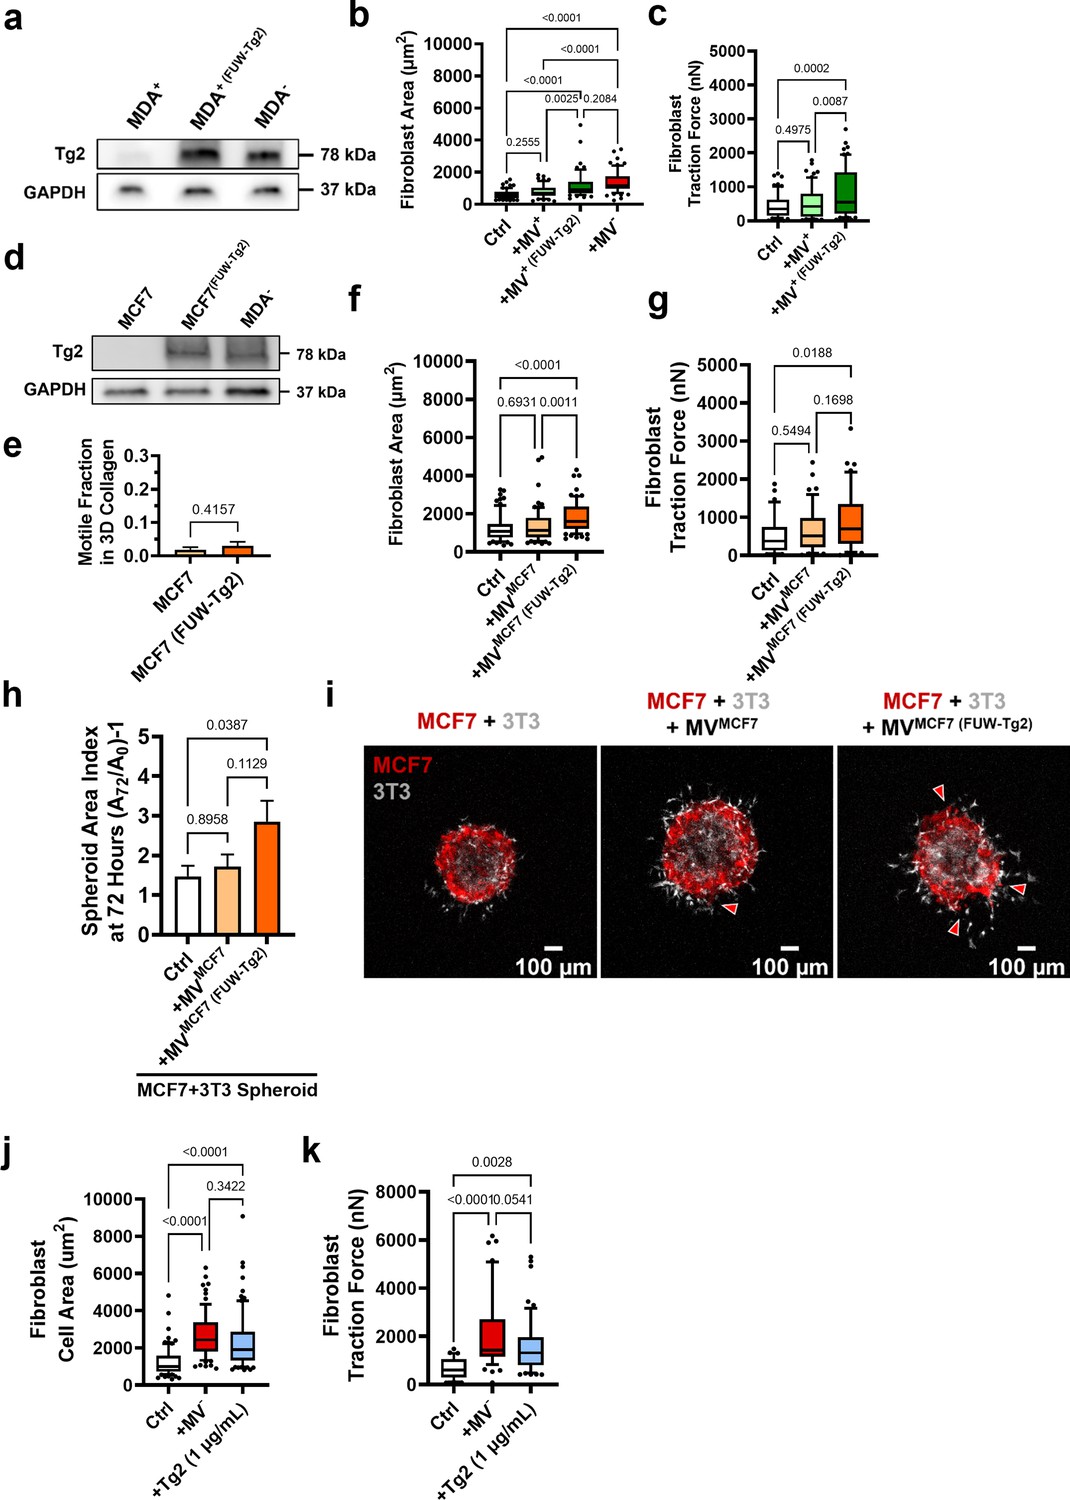
Modulation of Tg2 expression in MVs regulates MV-mediated fibroblast activation and spheroid outgrowth in vitro.
(a) Western blot for Tg2 and GAPDH in MDA+, MDA+ (FUW-Tg2), and MDA-. (b) Fibroblast cell area after culture in control conditions (Ctrl), with MV+ (+MV+), with MV+ (FUW-Tg2) (+MV+ (FUW-Tg2)), or with MV- (+MV-). (N=3; n=70, 57, 56, 64). (c) Fibroblast traction force after culture in Ctrl, +MV+, and +MV+ (FUw-Tg2) conditions (N=3, n=61, 60, 60). (d) Western blot for Tg2 and GAPDH in MCF7, MCF7(FUW-Tg2), and MDA-. (e) Motile fraction of MCF7 and MCF7(FUW-Tg2) in 3D collagen (N=3). (f) Fibroblast cell area after culture in control conditions (Ctrl), with MVMCF7 (+MVMCF7), or with MVMCF7 (FUW-Tg2) (+MVMCF7 (FUW-Tg2)) (N=3, n=76, 72, 71). (g) Fibroblast traction force after culture in Ctrl, +MVMCF7, + MVMCF7 (FUW-Tg2) (N=3, n=38, 47, 44). (h) Spheroid area index of MCF7 + 3 T3 spheroids after 72 hr of outgrowth (N=3, n=13, 12, 13) (i) Representative images of spheroid outgrowth 72 hr post embedding. MCF7 (red); 3T3 fibroblast (gray). Red arrows point to MCF7 cells migrating away from spheroid core. (j) Fibroblast cell area after culture in control conditions (Ctrl), with MV- (+MV+), or with Tg2 (1 µg/mL) (N=3; n=81, 75, 81). (k) Fibroblast traction force after culture in control conditions (Ctrl), with MV- (+MV+), or with Tg2 (1 µg/mL) (N=3; n=30, 48, 57). Bar graphs show mean +/- SEM. Box and whisker plots show median and 25th-75th (box) and 10th-90th (whiskers) percentiles. p-Values determined using an unpaired Student’s t-test or a one-way ANOVA with Tukey’s test for multiple comparisons. Source data available in Source data 1 and 2.
Figure 5
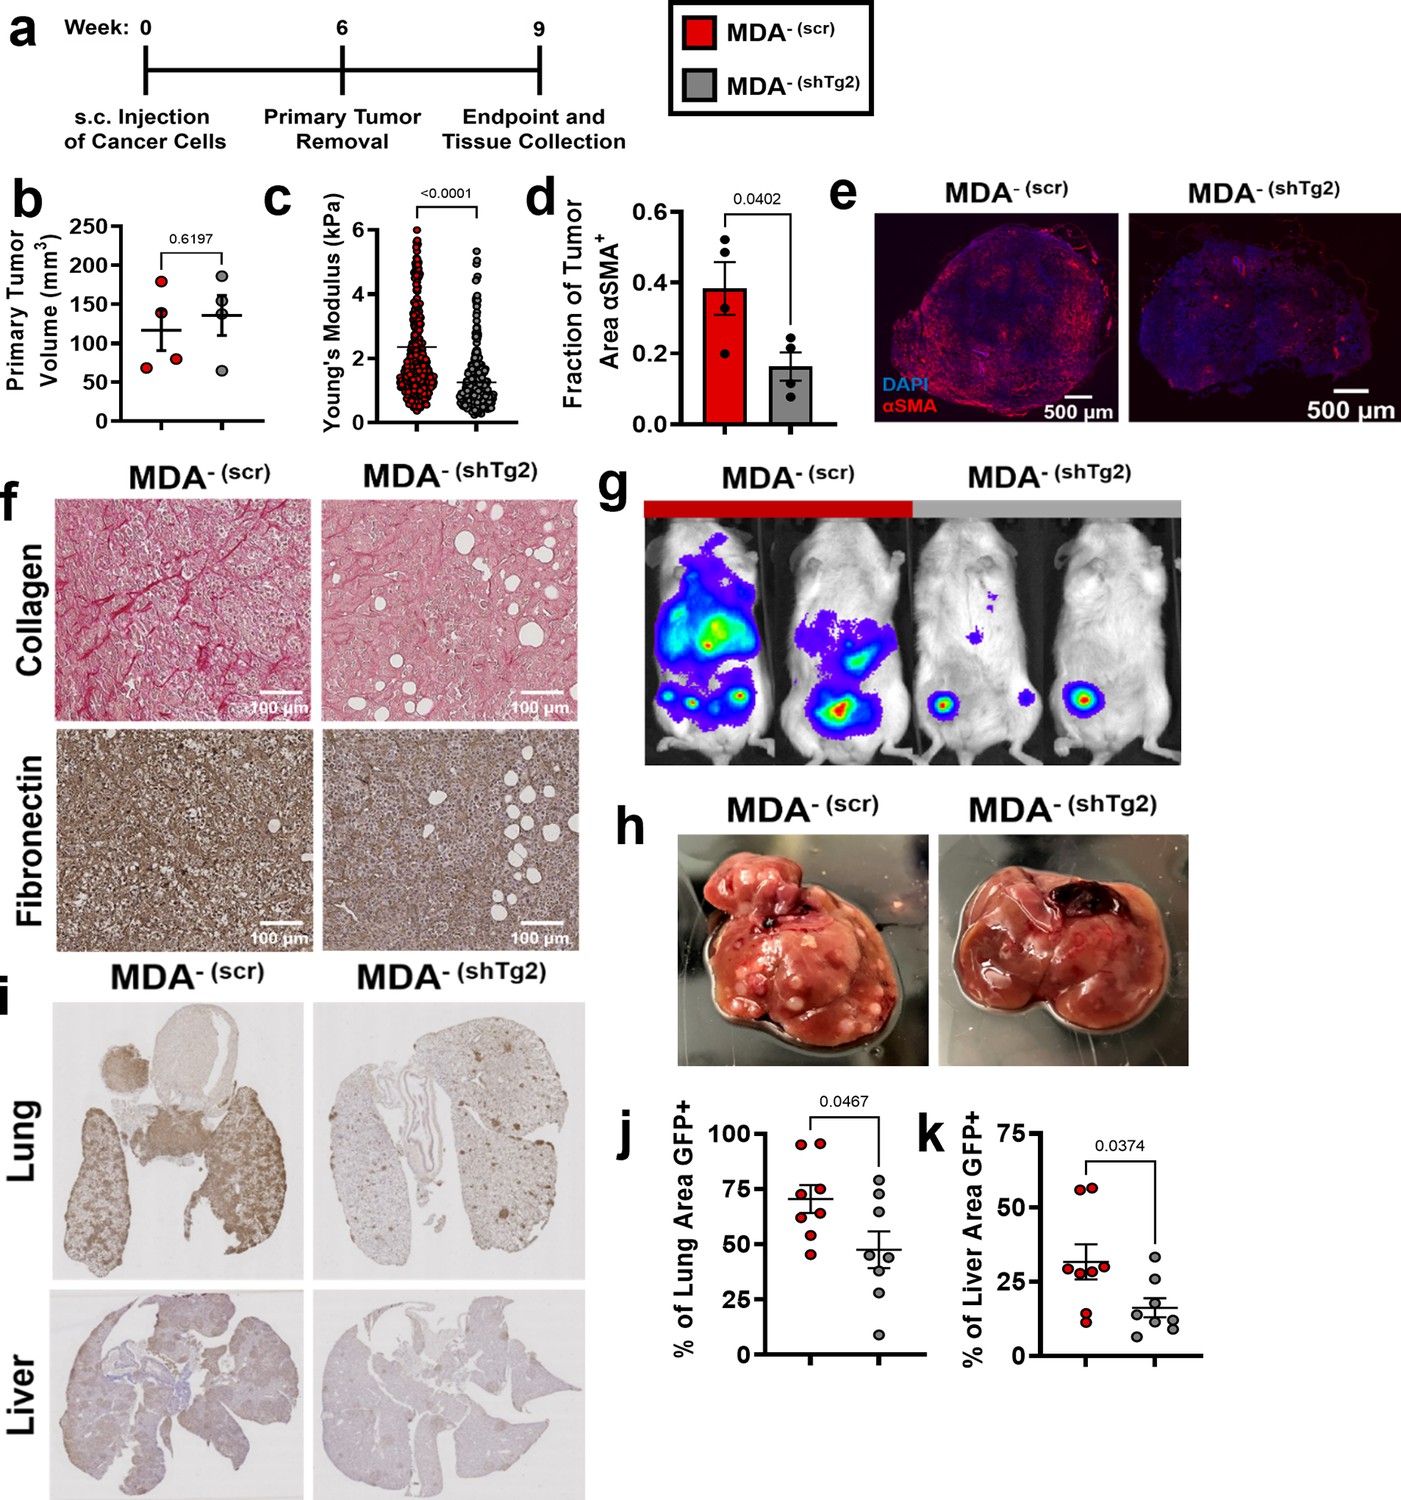
Knockdown of Tg2 in MDA- subpopulation reduces metastasis.
(a) Timeline of orthotopic mammary metastasis model. (b) Primary tumor volume after removal (N=4). (c) AFM stiffness measurements of MDA- (scr) and MDA- (shTg2) primary tumors. (N=3 + tumors per condition; n=420, 379). (d) Fraction of tumor area positive for αSMA (N=4). (e) Representative images of αSMA (red) and DAPI (blue) in MDA- (scr) and MDA- (shTg2) primary tumors. (f) Immunohistochemical staining of collagen and fibronectin in MDA- (scr) and MDA- (shTg2) primary tumors. (g) Representative BLI of MDA- (scr) and MDA- (shTg2) metastasis. (h) Representative image of macroscopic liver nodules. (i) Anti-GFP immunohistochemical staining of lungs and liver from MDA- (scr) and MDA- (shTg2) mice. (j) Quantification of percentage of lung tissue area GFP-positive. (N=4, n=8). (k) Quantification of percentage of liver tissue area GFP-positive. (N=4, n=8). Data shown as mean +/- SEM. p-Values determined using an unpaired Student’s t-test. Source data available in Source data 2.
Figure 6 with 1 supplement
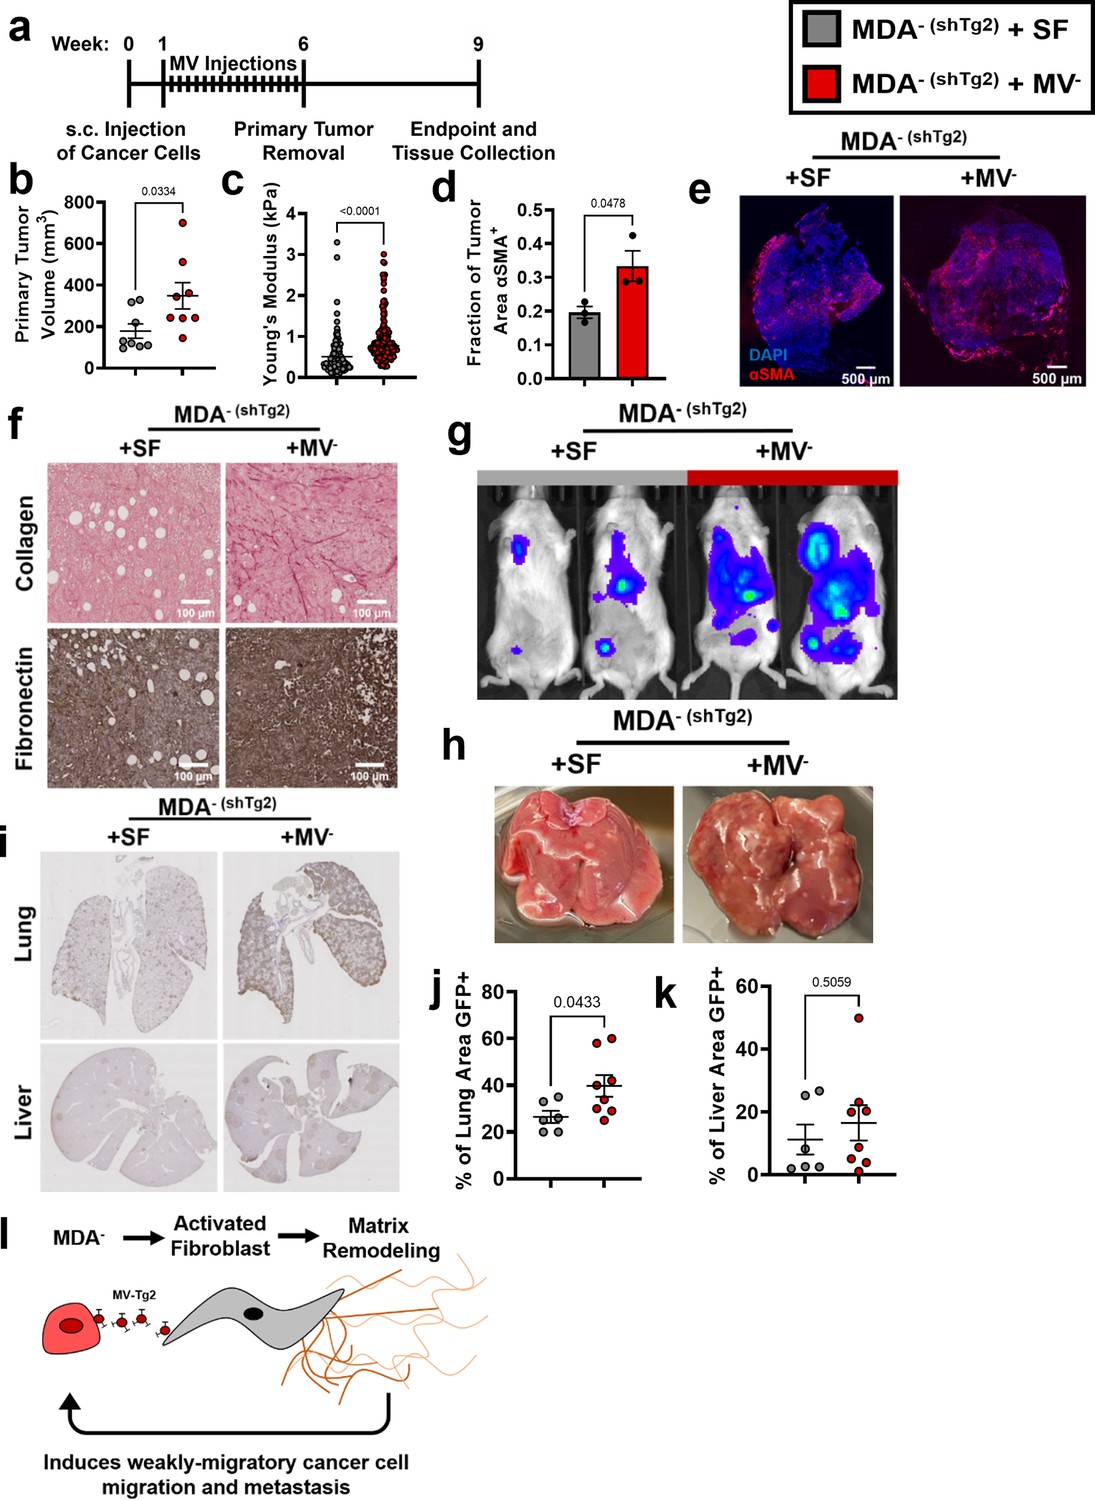
Tg2-rich wildtype MV- are sufficient to induce the metastasis of MDA- (shTg2).
(a) Timeline of orthotopic mammary metastasis model with MV injections every 3 days. (b) Primary tumor volume after removal (N=8). (c) AFM stiffness measurements of MDA- (shTg2) + SF and MDA- (shTg2) + MV- primary tumors. (N=3 + tumors per condition; n=128, 140). (d) Fraction of tumor area positive for αSMA (N=3). (e) Representative images of αSMA (red) and DAPI (blue) in MDA- (shTg2) + SF and MDA- (shTg2) + MV- primary tumors. (f) Immunohistochemical staining of collagen and fibronectin in MDA- (shTg2) + SF and MDA- (shTg2) + MV- primary tumors. (g) Representative BLI of MDA- (shTg2) metastasis. (h) Representative image of macroscopic liver nodules. (i) Anti-GFP immunohistochemical staining of lungs and liver from MDA- (shTg2) + SF and MDA- (shTg2) + MV mice. (j) Quantification of percentage of lung tissue area GFP-positive. (N=6, 8). (k) Quantification of percentage of liver tissue area GFP-positive. (N=6, 8). (l) Illustration overviewing the mechanism of MDA- metastasis. Data shown as mean +/- SEM. p-Values determined using an unpaired Student’s t-test. Source data available in Source data 2.
Figure 6—figure supplement 1
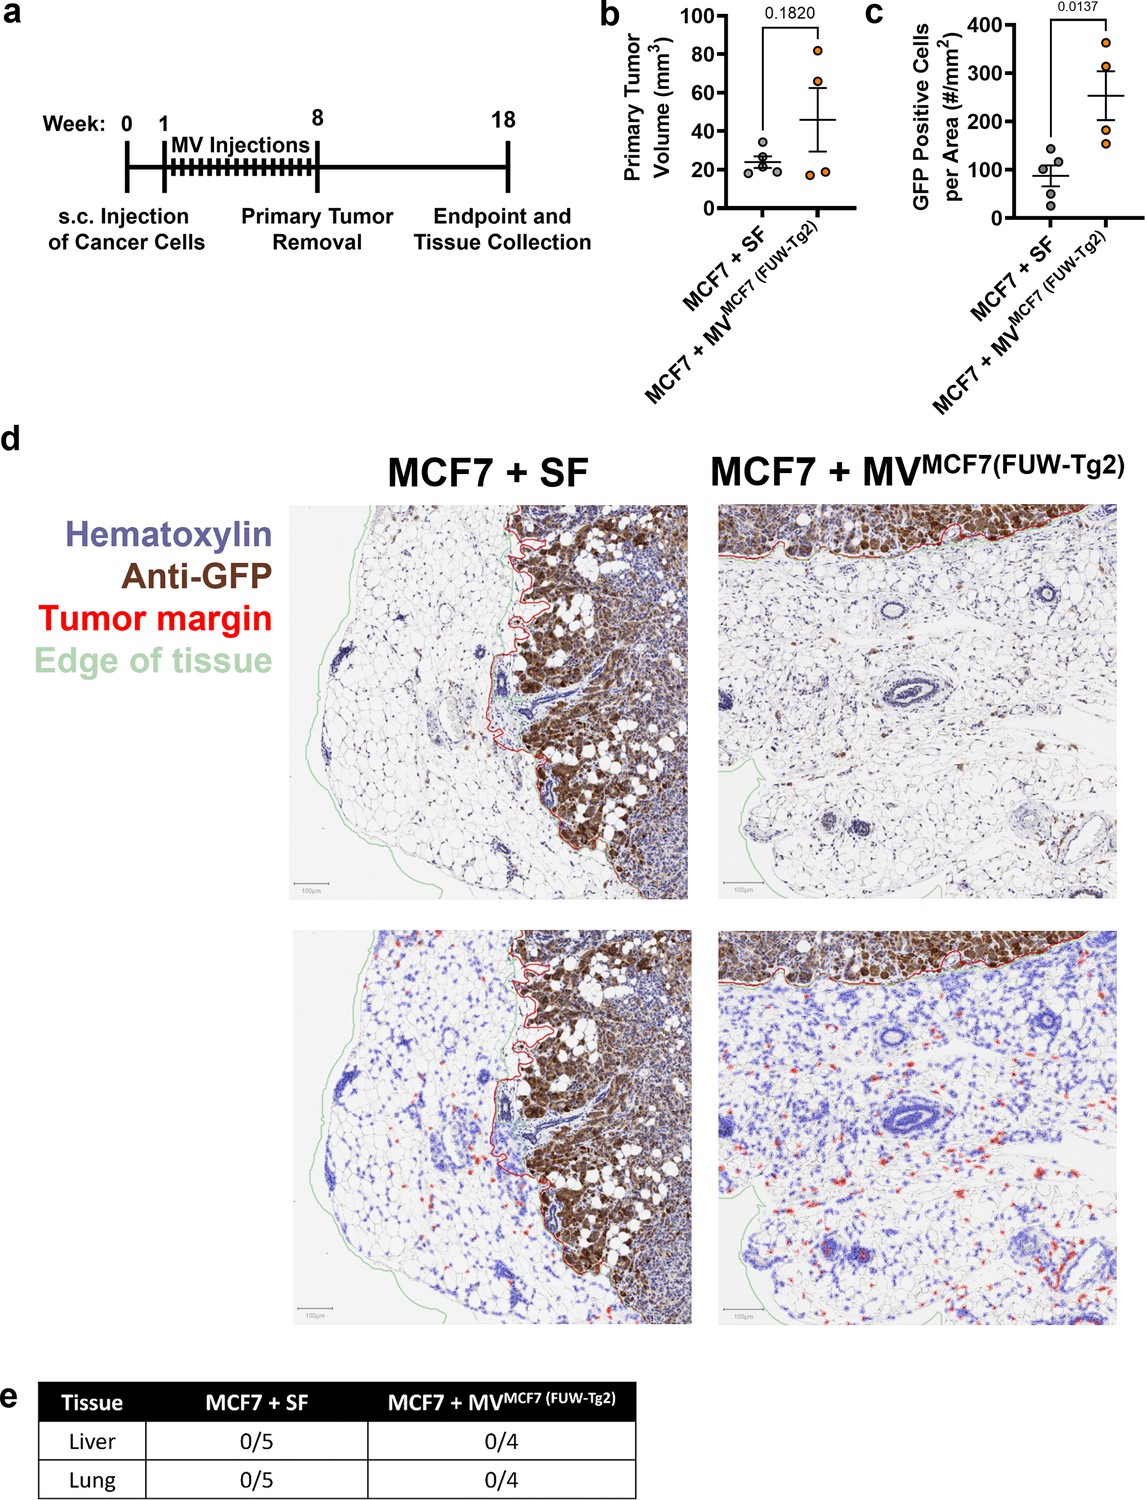
Primary tumor MV-Tg2 promotes dissemination of weakly migratory cancer cells in vivo.
(a) Timeline of orthotopic mammary metastasis model with MV injections every 3 days. (b) Primary tumor volume after removal (N=5,4). (c) GFP positive cells (MCF7) per area of tissue outside tumor margins of primary tumor en bloc sections (N=5,4). (d) Representative image of en bloc tumor sections for hematoxylin (blue) and anti-GFP (brown). Tumor margin denoted with red line. Edge of tissue denoted with green line. (e) Table of metastatic outcomes at endpoint. Data shown as mean +/- SEM. p-Values determined using an unpaired Student’s t-test. Source data available in Source data 2.
Figure 7 with 1 supplement

Clinical implications of Tg2 expression on breast cancer progression.
(a) TGM2 gene expression, measured with RNA sequencing, of normal, tumor, and metastatic tissue from breast invasive carcinoma patients. (N=242, 7569, 82). Data adapted from TNMplot database. (b) Distant metastasis-free survival Kaplan-Meier plot for TGM2 expression in all breast cancer subtypes. Data adapted from the Kaplan-Meier Plotter database. (c) Distant metastasis-free survival Kaplan-Meier plot for TGM2 expression in ER, PR, and HER2 negative breast cancer. Data adapted from the Kaplan-Meier Plotter database. (d) TGM2 co-expression correlation data for breast invasive carcinoma. Data adapted from cBioPortal using the Firehose Legacy dataset. Source data available in Source data 2.
Figure 7—figure supplement 1
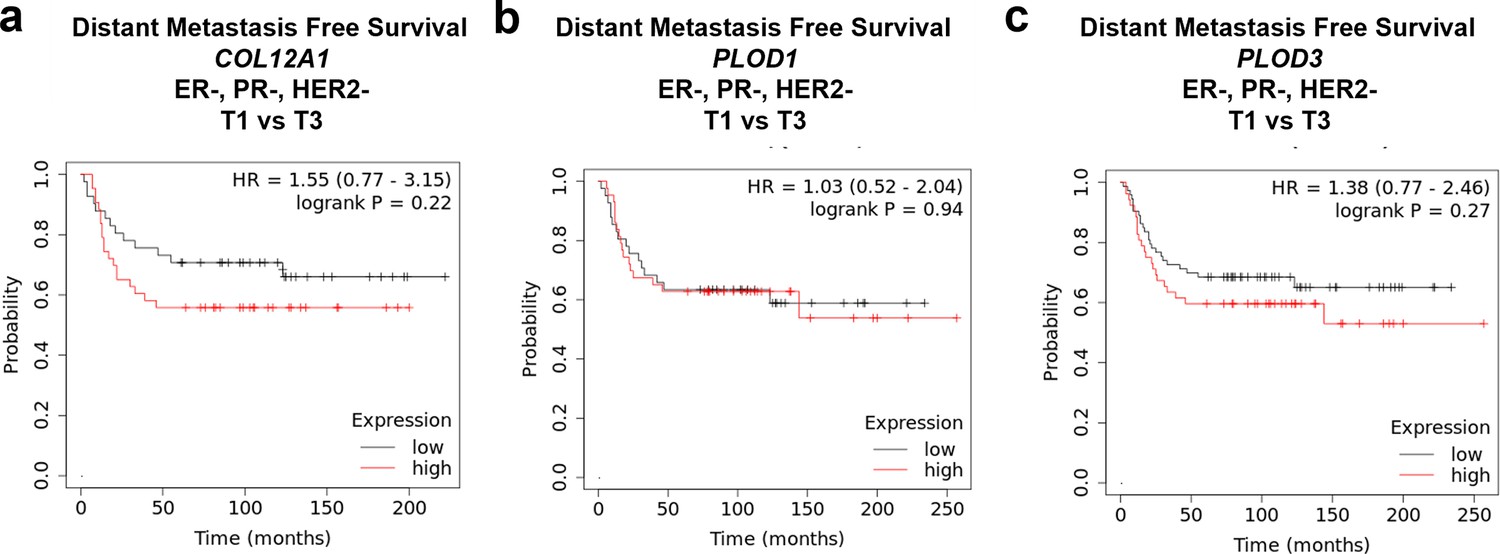
COL12A1, PLOD1, and PLOD3 expression do not significantly correlate with distant metastasis free survival in triple negative breast cancer.
(a) Distant metastasis-free survival Kaplan-Meier plot for COL12A1 expression in ER, PR, and HER2-negative breast cancer. Data adapted from the Kaplan-Meier Plotter database. (b) Distant metastasis-free survival Kaplan-Meier plot for PLOD1 expression in ER, PR, and HER2-negative breast cancer. Data adapted from the Kaplan-Meier Plotter database. (c) Distant metastasis-free survival Kaplan-Meier plot for PLOD3 expression in ER, PR, and HER2-negative breast cancer. Data adapted from the Kaplan-Meier Plotter database.
Author response image 1
Additional files
-
Transparent reporting form
- https://cdn.elifesciences.org/articles/74433/elife-74433-transrepform1-v2.docx
-
Source data 1
Raw western blot image files.
- https://cdn.elifesciences.org/articles/74433/elife-74433-data1-v2.zip
-
Source data 2
Raw numerical data.
- https://cdn.elifesciences.org/articles/74433/elife-74433-data2-v2.zip
-
Supplementary file 1
Primer sequences used for quantitative real-time PCR.
- https://cdn.elifesciences.org/articles/74433/elife-74433-supp1-v2.xlsx
Download links
A two-part list of links to download the article, or parts of the article, in various formats.
Downloads (link to download the article as PDF)
Open citations (links to open the citations from this article in various online reference manager services)
Cite this article (links to download the citations from this article in formats compatible with various reference manager tools)
Weakly migratory metastatic breast cancer cells activate fibroblasts via microvesicle-Tg2 to facilitate dissemination and metastasis
eLife 11:e74433.
https://doi.org/10.7554/eLife.74433


