Efferocytosis of SARS-CoV-2-infected dying cells impairs macrophage anti-inflammatory functions and clearance of apoptotic cells
- Departamento de Biologia Celular e Molecular e Bioagentes Patogênicos, Faculdade de Medicina de Ribeirão Preto, Universidade de São Paulo, Brazil
- Hospital Israelita Albert Einstein, Brazil
- Departamento de Bioquímica e Imunologia, Faculdade de Medicina de Ribeirão Preto, Universidade de São Paulo, Ribeirão Preto, Brazil
- Departamento de Farmacologia, Faculdade de Medicina de Ribeirão Preto, Universidade de São Paulo, Brazil
- Center of Research in Inflammatory Diseases (CRID), Faculdade de Medicina de Ribeirão Preto, Universidade de São Paulo, Brazil
- Divisão de Imunologia Clinica, Emergência, Doenças Infecciosas e Unidade de Terapia Intensiva, Faculdade de Medicina de Ribeirão Preto, Universidade de São Paulo, Brazil
- Departamento de Patologia e Medicina Legal, Faculdade de Medicina de Ribeirão Preto, Universidade de São Paulo, Brazil
- Departamento de Cirurgia e Anatomia, Faculdade de Medicina de Ribeirão Preto, Universidade de São Paulo, Brazil
Figures
Figure 1 with 1 supplement
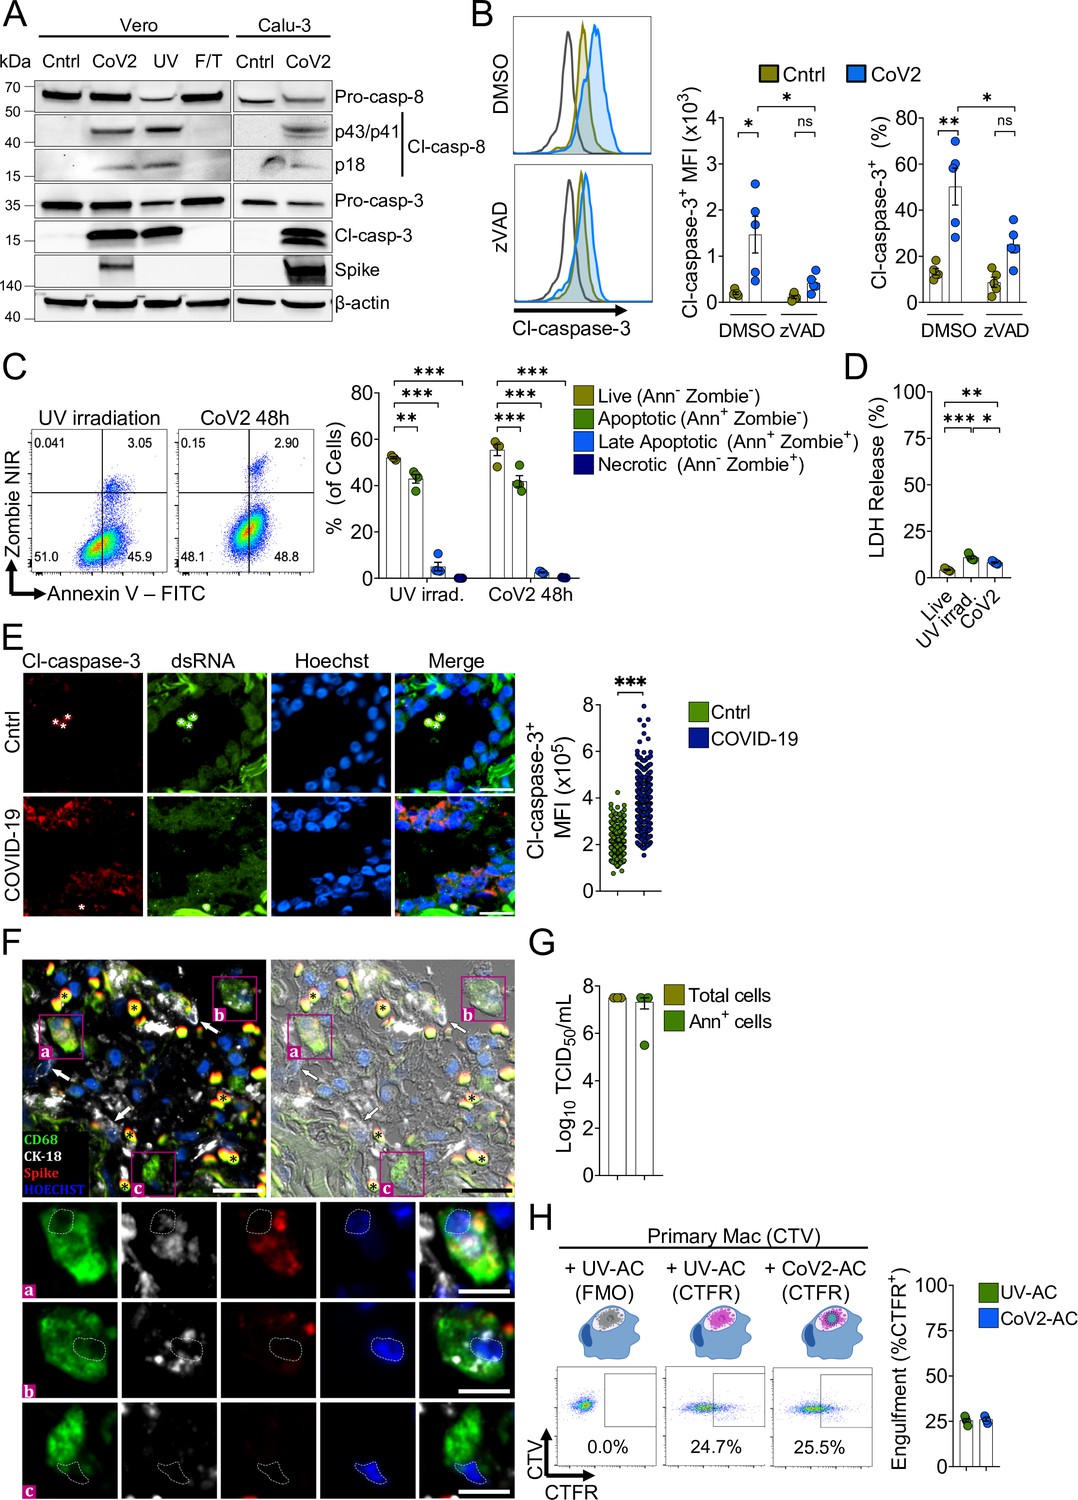
Macrophages engulf apoptotic cells (AC) carrying viable SARS-CoV-2.
(A) Immunoblot of caspase-8 and caspase-3 cleavage in Calu-3 and Vero CCL81 cells in response to infection with SARS-CoV-2 for 48 hr (CoV2, detected with rabbit anti-Spike), UV irradiation (UV), or freezing and thawing (F/T). (B) Flow cytometric analysis of caspase-3 cleavage (Cl-caspase-3) in Calu-3 cells unstimulated (Cntrl) or infected with CoV2 for 48 hr. The pan-caspase inhibitor z-VAD-FMK (zVAD; 20 μM) or vehicle (DMSO) was added to cell cultures after viral adsorption. Representative histogram, geometric mean fluorescence intensity (MFI), and frequency of Cl-caspase-3+ cells (gated on total cells/single cells) are shown. The black line on the histogram represents the control sample labeled with secondary antibody only. (C) Flow cytometric analysis of apoptosis in Vero CCL81 cells in response to UV light irradiation or 48 hr post-infection with CoV2, assessed by annexin V (FITC) and viability dye (Zombie NIR) co-staining. Representative histogram and frequency of each population (pre-gated on total cells/single cells) are shown. (D) Cytotoxicity analysis by measurement of lactate dehydrogenase (LDH) release on the supernatants of Vero CCL81 cells in response to UV light irradiation or 48 hr post-infection with CoV2. (E, F) Representative histological findings in post-mortem lung tissue from COVID-19 patients obtained by ultrasound-guided minimally invasive autopsy. (E) Immunofluorescence images of tissue samples labeled with anti-Cl-caspase-3 (red), anti-dsRNA (green), and stained with Hoechst (nuclei, blue) for the detection of caspase-3 activation in infected epithelia (COVID-19, bottom panels) compared to samples from control patients (Cntrl, upper panels). Tissues were scanned by wide-field epifluorescence imaging. Scale bar: 20 μm, asterisks: erythrocytes. The MFI of Cl-caspase-3 of at least 300 cells is shown (n=3 individuals per group). Technical control for secondary antibodies background is shown in Figure 1—figure supplement 1. (F) Representative immunofluorescence image of a COVID-19 patient tissue sample labeled for the detection of efferocytosis in situ and superimposed with differential interference contrast. Samples were labeled with anti-CD68 (detecting macrophages, green), anti-cytokeratin18 (CK-18, detecting epithelial cells, white), anti-Spike (detecting SARS-CoV-2, red), and stained with Hoechst (nuclei, blue). Bottom panels show higher magnification of ( a,b) CD68+ macrophage with CK-18 and Spike labeling in the cytosol and (c) CD68+ only macrophage. White arrows: CK-18+ cells; asterisks: erythrocytes. Tissues were scanned by wide-field epifluorescence imaging. Scale bar: 20 μm; scale bar for insets: 10 μm. (G) Quantification by TCID50 of SARS-CoV-2 viral loads in Vero CCL81 cells infected for 48 hr. Viral loads were estimated for pre-sorted (total cells) or annexin V+ (Ann+ cells) cells isolated by magnetic separation. (H) Uptake of apoptotic Vero CCL81 cells (labeled with CTFR) in response to UV irradiation (UV-AC) or infection with SARS-CoV-2 for 48 hr (Cov2-AC) by human monocyte-derived macrophages (labeled with CellTrace Violet (CTV)). Macrophages were co-incubated with AC for 2 hr, and internalization was assessed by flow cytometry. Representative plot and percentage of engulfment (gated on total cells/single cells/live cells/CTV+/ CTV+CTFR+ cells) are shown. Boxes represent the mean of five (B, D), four (C, H), or three (G) biological replicates, and error bars are ± S.E.M. Each biological replicate is shown as a circle. Significance was calculated by ANOVA (B–D), Mann-Whitney test (E), or Student’s t-test (G, H). *p<0.05, **p<0.001, ***p<0.0001, comparing the indicated groups. Data shown are from one representative out of two (A, C, G) or three (B, D, H) experiments performed independently with similar results.
-
Figure 1—source data 1
Source data for Figure 1.
- https://cdn.elifesciences.org/articles/74443/elife-74443-fig1-data1-v2.xlsx
Figure 1—figure supplement 1
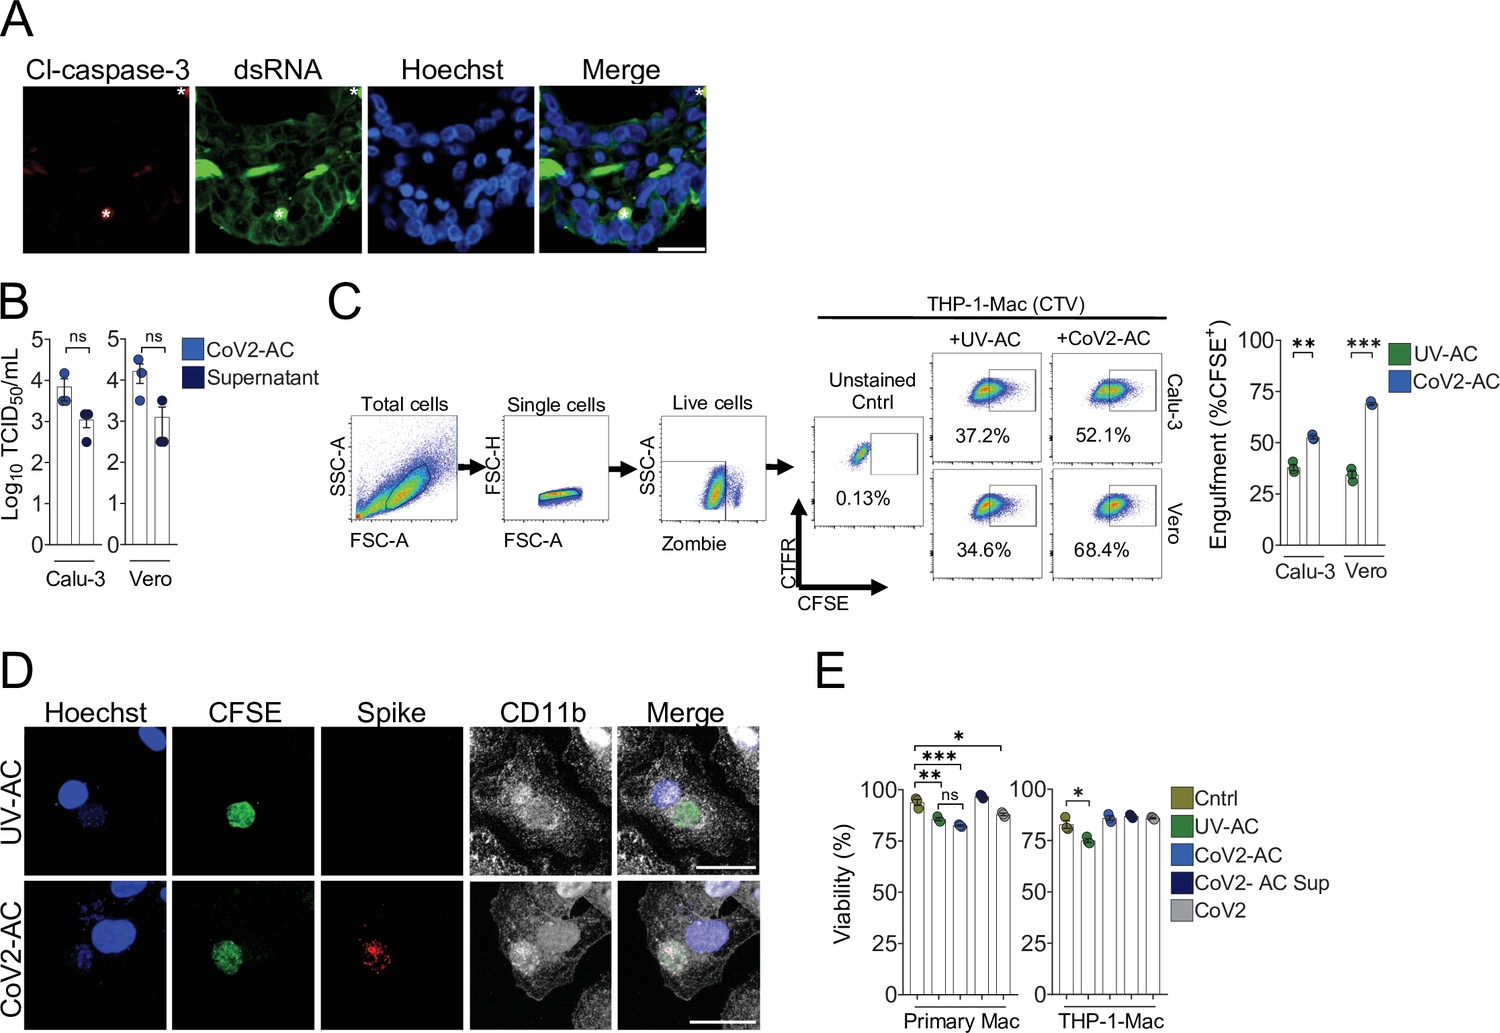
Support data for Figure 1.
(A) Immunofluorescence images of tissue samples immunolabeled with secondary antibodies only used for detection of anti-cleaved caspase-3 (red, anti-rabbit IgG conjugated to Alexa 594), anti-dsRNA (green, donkey anti-mouse IgG F(ab)´2-Alexa 488), and stained with Hoechst (nuclei, blue) in Figure 1E. Tissues were scanned by wide-field epifluorescence imaging. Scale bar: 20 μm, asterisks: erythrocytes. (B) TCID50 quantification of SARS-CoV-2 viral loads from detached, apoptotic Calu-3 and Vero CCL81 cells (CoV2-apoptotic cells [CoV2-AC], 1.0 × 10⁶cells) and their cell-free supernatants, collected 48 hr post-infection and isolated as described in the Methods. (C) Uptake of apoptotic Calu-3 and Vero CCL81 cells (labeled with CFSE) in response to UV irradiation (UV-AC) or infection with SARS-CoV-2 for 48 hr (Cov2-AC) by THP-1-derived macrophages (labeled with CTFR). Macrophages were co-incubated with AC for 2 hr, and internalization was assessed by flow cytometry. Representative gating strategy, plots, and percentage of engulfment (gated on total cells/single cells/live cells/CTFR+/CTFR+ CFSE+ cells) are shown. (D) Representative maximal projection of scanning confocal images showing the uptake of UV-AC or CoV2-AC (from Vero CCL81 cells, CFSE-labeled, green) by human monocyte-derived macrophages after 2 hr of co-incubation. Samples were stained with Hoechst (nuclei, blue) and were immunolabeled with anti-Spike (SARS-CoV-2, red) and anti-CD11b (macrophage, white). Scale bar: 5 μm. (E) Human monocyte-derived macrophages or THP-1-derived macrophages were unstimulated (Cntrl), co-incubated with apoptotic Vero CCL81 cells isolated from UV-irradiated (UV-AC) or SARS-CoV-2-infected (CoV2-AC) cultures, stimulated with the supernatants of infected AC (CoV2-AC Sup) or infected with SARS-CoV-2 (CoV2), as indicated. The percentage of cellular viability was measured using a viability probe 24 hr post-stimulation and analysis by flow cytometry (gated on total cells/single cells). Boxes represent the mean of three biological replicates, and error bars are ± S.E.M. Each biological replicate is shown as a circle. Significance was calculated by Student’s t-test (B–C) or ANOVA (E). *p<0.05, **p<0.001, ***p<0.0001, comparing the indicated groups; ns: non-significant. Data shown are from one representative out of two (B, C) or three (E) experiments performed independently with similar results.
-
Figure 1—figure supplement 1—source data 1
Source data for Figure 1—figure supplement 1.
- https://cdn.elifesciences.org/articles/74443/elife-74443-fig1-figsupp1-data1-v2.xlsx
Figure 2 with 1 supplement
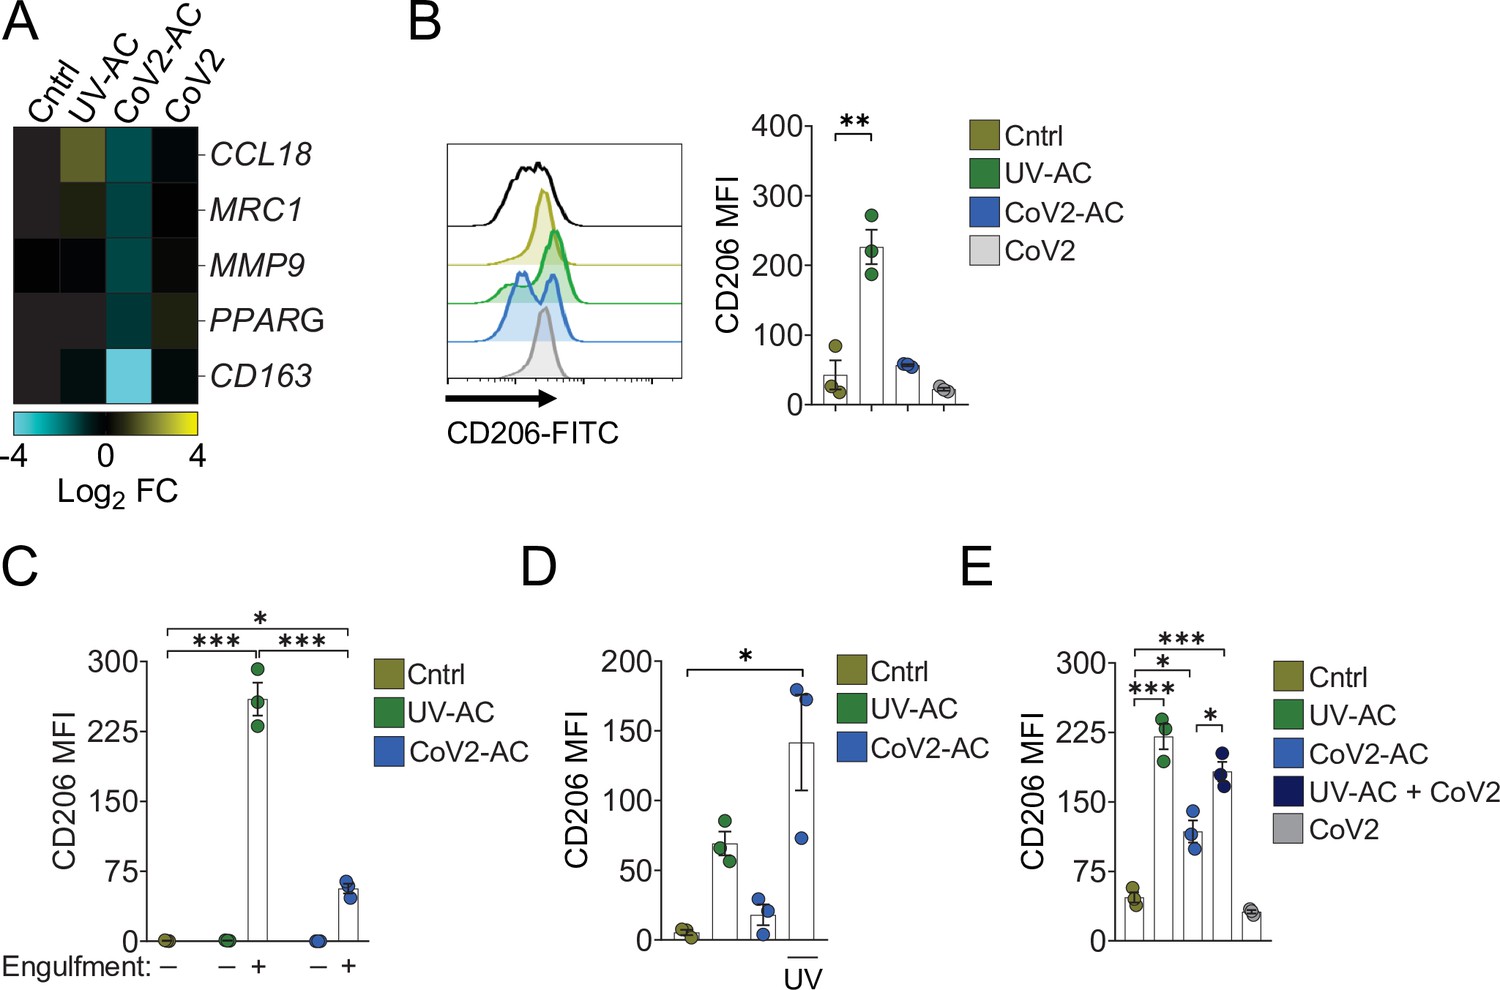
Engulfment of SARS-CoV-2-infected dying cells impairs macrophage anti-inflammatory functions.
Macrophages were unstimulated (Cntrl), co-incubated with apoptotic Vero CCL81 cells (AC) isolated from UV-irradiated (UV-AC) or SARS-CoV-2-infected (CoV2-AC) cultures, stimulated with the supernatants of infected apoptotic cells (CoV2-AC Sup), or infected with CoV2 (CoV2), as indicated. (A) Heatmap showing the expression of M2-marker genes (CCL18, MRC1, MMP9, PPARG, and CD163) in human monocyte-derived macrophages 24 hr after stimulation, calculated as log2 fold change relative to Cntrl. mRNA expression was determined by RT-qPCR and normalized to GAPDH. Data represent the mean of biological triplicates. (B) Flow cytometric analysis of CD206 expression on the cell surface of human monocyte-derived macrophages (gated on total cells/single cells/live cells; gating strategy in Figure 2—figure supplement 1A) 24 hr after stimulation. Representative histograms and quantification of geometric mean fluorescence intensity (MFI) are shown. The black line on the histogram represents the fluorescence minus one (FMO) control. (C–E) Flow cytometric analysis of CD206 expression on the cell surface of THP-1-derived macrophages 24 hr after stimulation, showing quantification of CD206 MFI. (C) Macrophages (labeled with CTFR) were stimulated with UV-AC or CoV2-AC (labeled with CTV), and CD206 expression was measured on macrophages that engulfed (+) or not (−) AC. Gating strategy is depicted in Figure 2—figure supplement 1E. (D) Where indicated, isolated CoV2-AC were UV-irradiated for 20 min prior to co-incubation for viral inactivation. (E) The responses of macrophages to UV-AC and CoV2-AC were compared to infection with CoV2 in the presence of UV-AC (UV-AC + CoV2). Boxes represent the mean of three biological replicates using cells from a single donor (A, B) or THP-1-derived cells (C–E), and error bars are ± S.E.M. Each biological replicate is shown as a circle. Significance was calculated by ANOVA. *p<0.05, **p<0.001, ***p<0.0001, comparing the indicated groups. Data shown are from one representative out of at least two experiments performed independently with similar results.
-
Figure 2—source data 1
Source data for Figure 2.
- https://cdn.elifesciences.org/articles/74443/elife-74443-fig2-data1-v2.xlsx
Figure 2—figure supplement 1
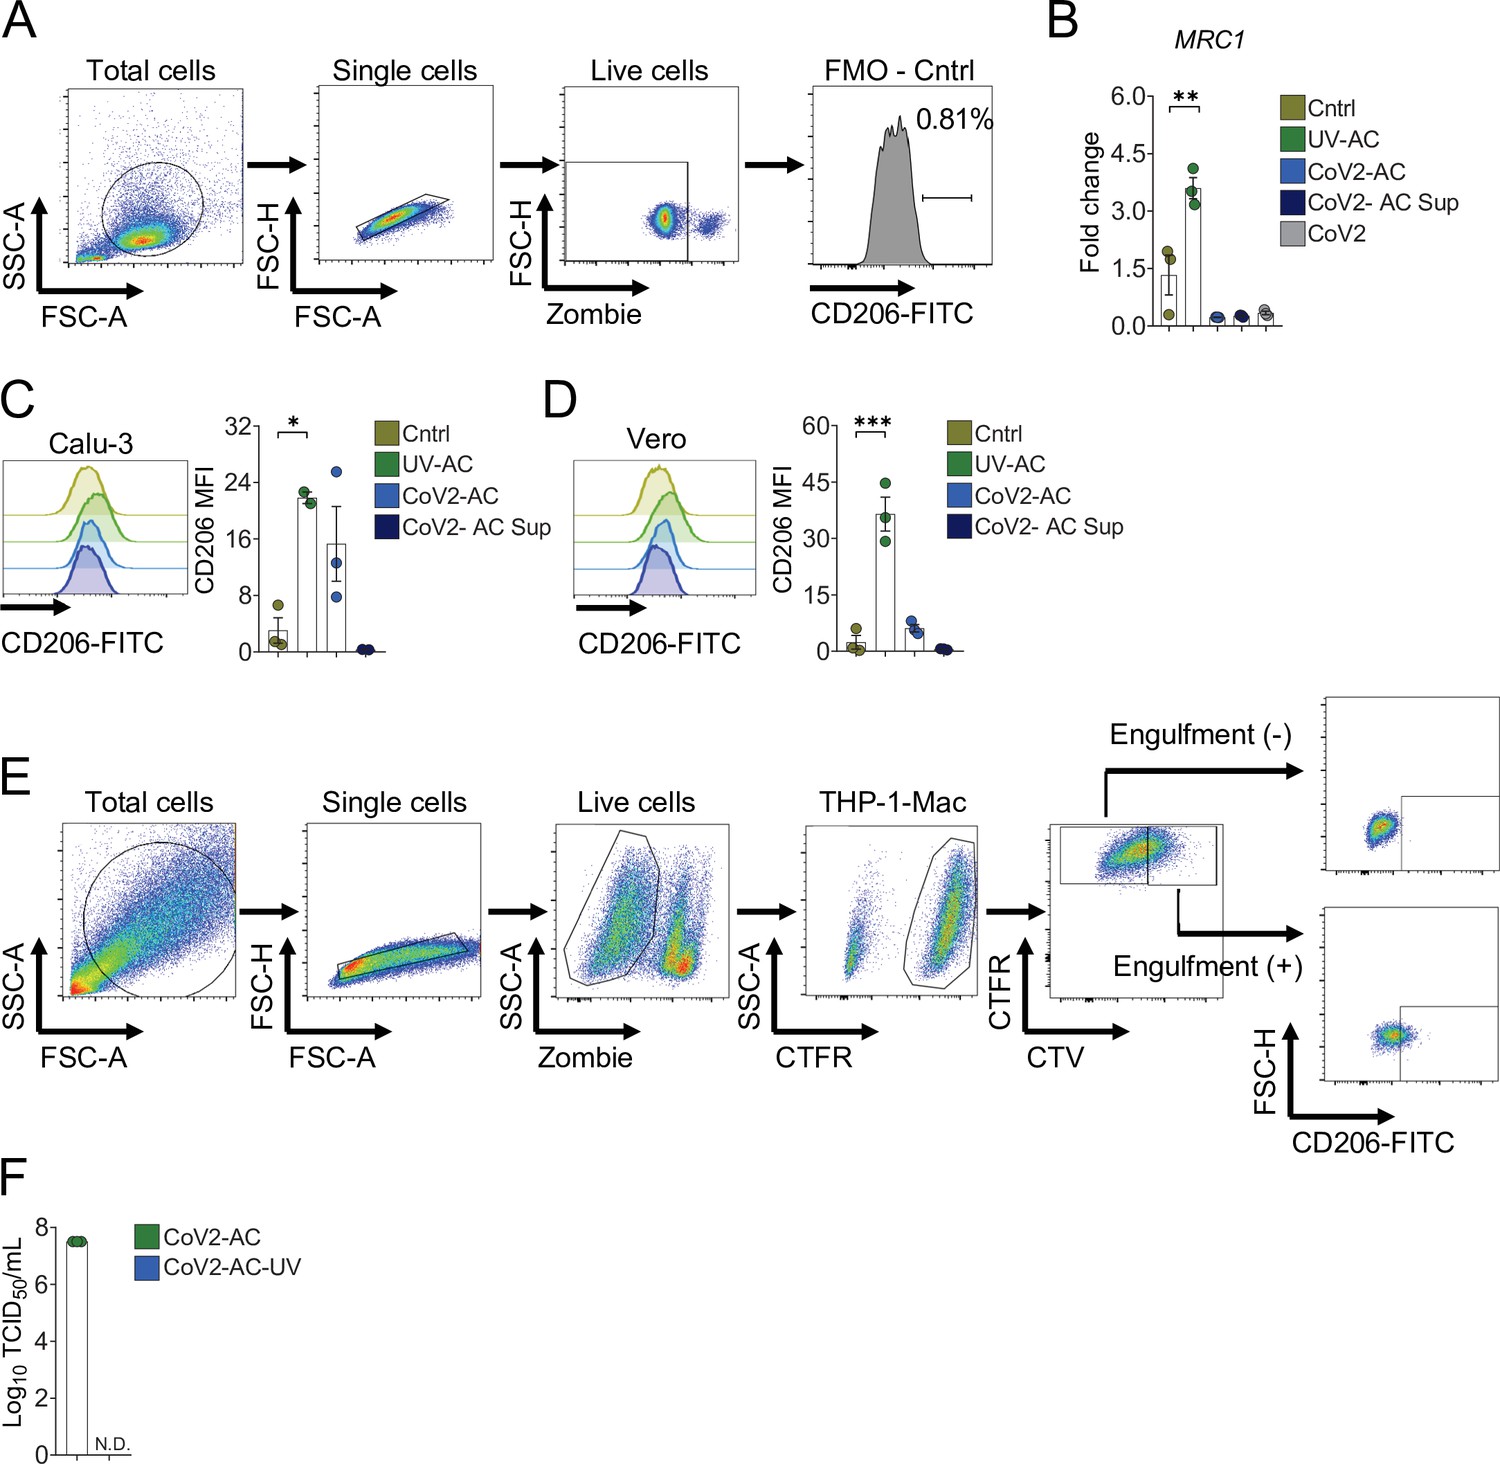
Support data for Figure 2.
(A) Representative gating strategy used to determine the CD206 expression on the surface of macrophages in response to the different stimuli by flow cytometry (backgating corresponds to FMO control showed in Figure 2B). (B) THP-1-derived macrophages were unstimulated (Cntrl), co-incubated with UV-AC, CoV2-AC, or CoV2-AC Sup obtained from Vero CCL81 cells, or infected with CoV2, as indicated. Expression of MRC1 in macrophages showed as fold change relative to Cntrl was assessed 24 hr after stimulation. mRNA expression was determined by RT-qPCR and normalized to GAPDH. (C–D) THP-1-derived macrophages were incubated with UV-AC, Cov2-AC, or CoV2-Sup obtained from (C) Calu-3 or (D) Vero CCL81 infected cell cultures. CD206 expression on the cell surface 24 hr after stimulation was assessed by flow cytometry (gated on total cells/single cells/live cells). Representative histograms and quantification of geometric mean fluorescence intensity (MFI) of CD206 are shown. (E) Representative gating strategy used to determine the CD206 expression on the surface of CTFR-labeled macrophages stimulated with CTV-labeled AC in Figure 2C. (F) Quantification by TCID50 of the SARS-CoV-2 viral loads in 1.0 × 10⁶ AC isolated from Vero CCL81 infected cells, either intact (CoV2-AC) or UV-irradiated for 20 min for viral inactivation (CoV2-AC UV). Boxes represent the mean of three biological replicates, and error bars are ± S.E.M. Each biological replicate is shown as a circle. Significance was calculated by ANOVA (B–D) *p<0.05, **p<0.001, ***p<0.0001, comparing the indicated groups; ns: non-significant. Data shown are from one representative out of two experiments performed independently with similar results.
-
Figure 2—figure supplement 1—source data 1
Source data for Figure 2—figure supplement 1.
- https://cdn.elifesciences.org/articles/74443/elife-74443-fig2-figsupp1-data1-v2.xlsx
Figure 3 with 1 supplement
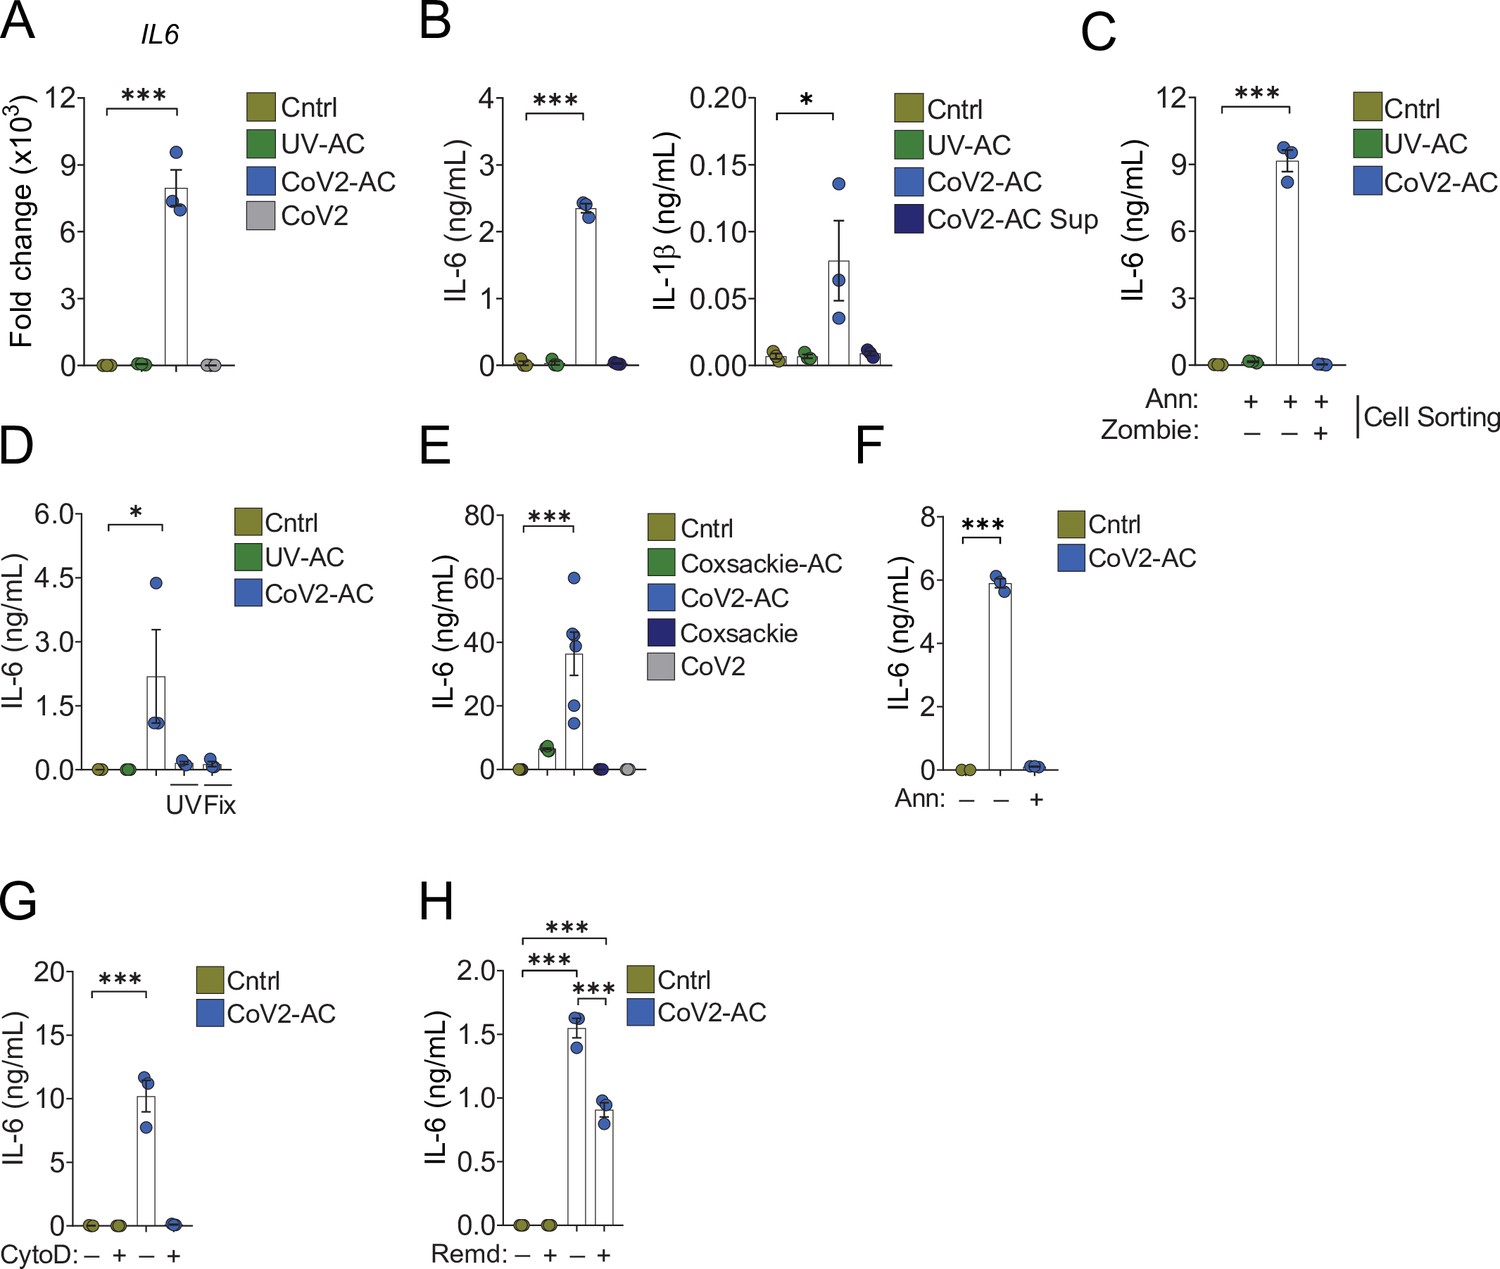
Engulfment of SARS-CoV-2-infected dying cells causes inflammatory cytokine production.
Macrophages were left unstimulated (Cntrl), co-incubated with apoptotic Vero CCL81 cells (AC) isolated from UV-irradiated (UV-AC) or SARS-CoV-2-infected (CoV2-AC) cultures, stimulated with the supernatants of infected apoptotic cells (CoV2-AC Sup), or infected with CoV2, as indicated. (A) IL6 expression in primary human monocyte-derived macrophages 24 hr after stimulation showed as fold change relative to Cntrl. mRNA expression was determined by RT-qPCR and normalized to GAPDH. (B) Cytometric bead array quantification of IL-6 and IL-1β in the culture supernatants of the monocyte-derived macrophages 24 hr after stimulation. (C, D) ELISA quantification of IL-6 in the culture supernatants of THP-1-derived macrophages 24 hr after stimulation. (C) Macrophages were stimulated with early AC (annexin V+ Zombie-) or late AC (annexin V+ Zombie+) sorted out by flow cytometry. (D) Where indicated, isolated CoV2-AC were UV-irradiated (UV) for 20 min or fixed with 2% paraformaldehyde (Fix) for 10 min prior to co-incubation. (E–H) ELISA quantification of IL-6 in the culture supernatants of human primary monocyte-derived macrophages 24 hr after stimulation. (E) IL-6 secretion in response to CoV2-AC was compared to AC isolated from Vero CCL81 cells similarly infected with Coxsackievirus (Coxsackie-AC). (F) Phosphatidylserine on the surface of CoV2-AC was blocked by incubation with annexin V (Ann, 0.1 μg/mL) prior to addition to macrophage cultures to inhibit AC binding. (G) CoV2-AC and macrophages were co-incubated in the presence of cytochalasin D (Cyto D, 10 μM) to inhibit AC internalization. (H) Macrophages were treated with Remdesivir (Remd, 20 μM) following stimulation with CoV2-AC to inhibit viral RNA transcription. Boxes represent the mean of three biological replicates using cells from a single donor (A, B, F, G), two donors (E), or THP-1-derived cells (C, D), and error bars are ± S.E.M. Each biological replicate is shown as a circle. Significance was calculated by ANOVA. *p<0.05, **p<0.001, ***p<0.0001, comparing the indicated groups. Data shown are from one representative out of at least two experiments performed independently with similar results.
-
Figure 3—source data 1
Source data for Figure 3.
- https://cdn.elifesciences.org/articles/74443/elife-74443-fig3-data1-v2.xlsx
Figure 3—figure supplement 1
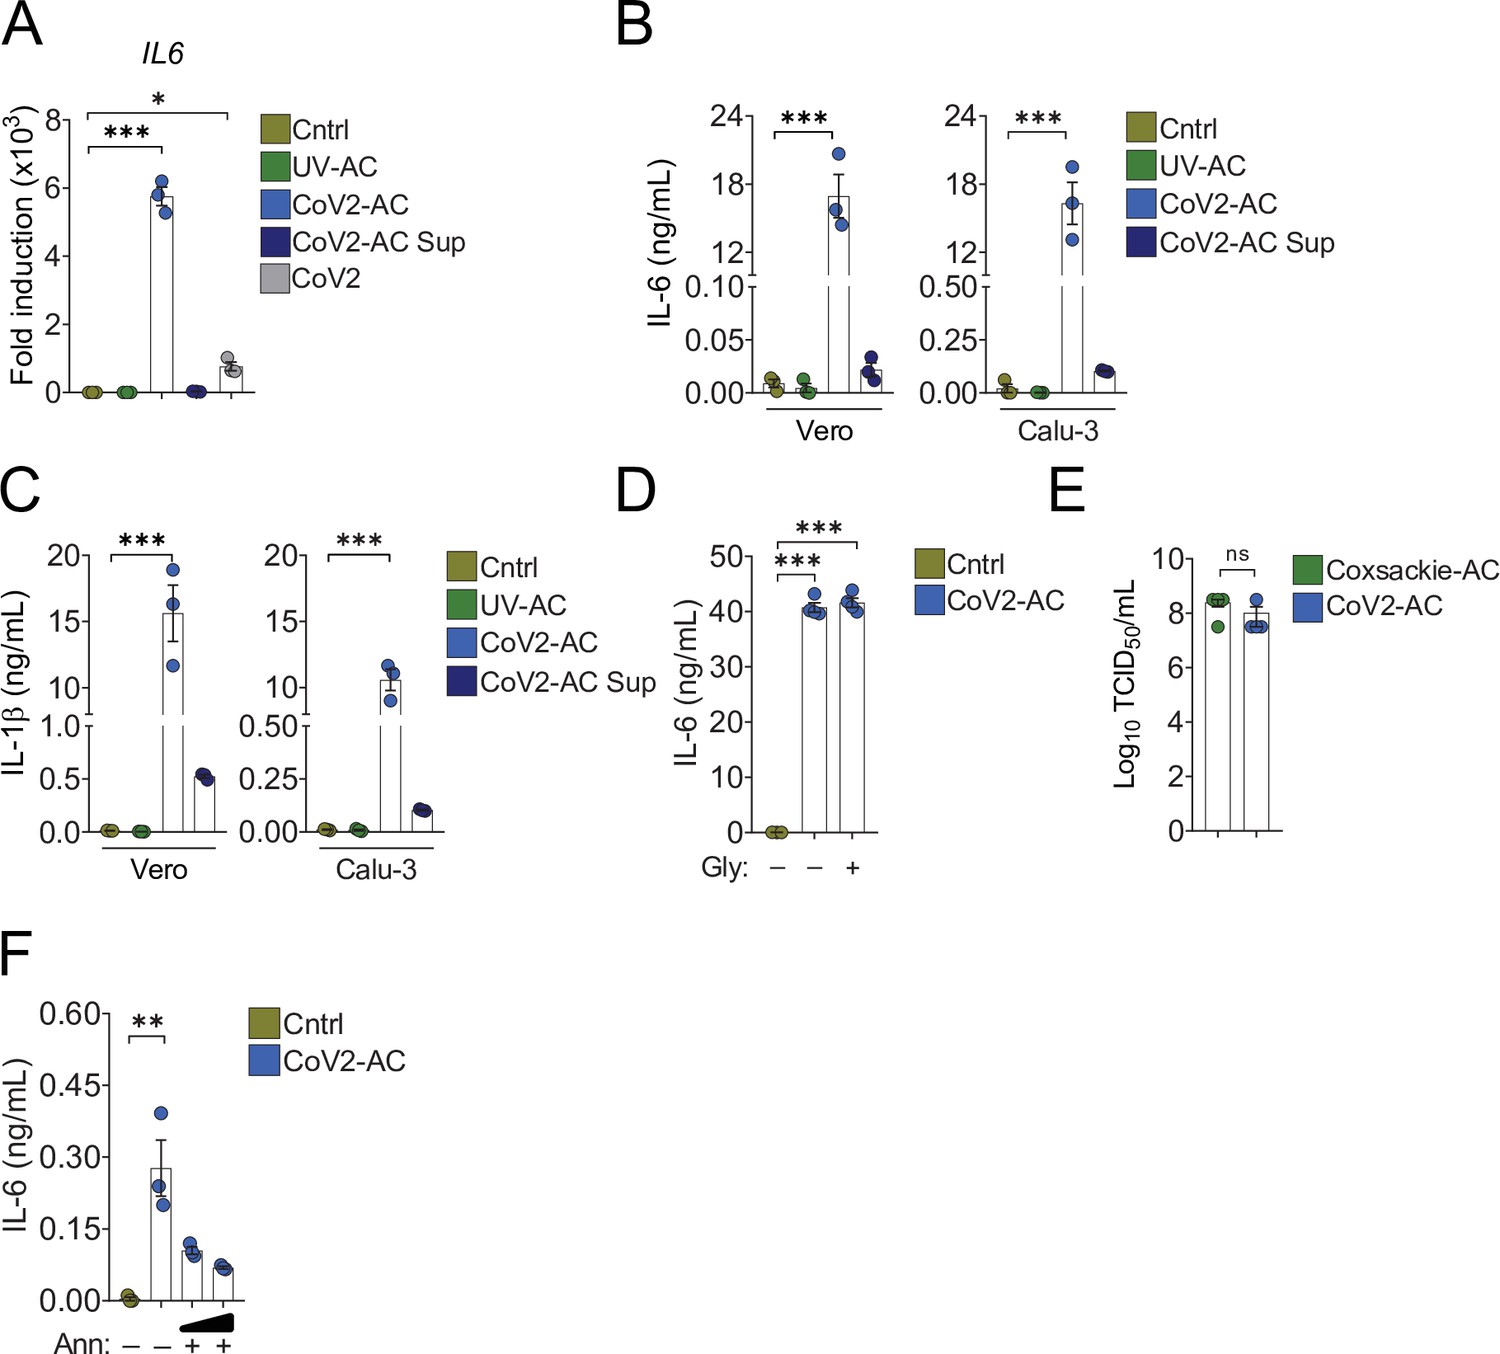
Support data for Figure 3.
(A) THP-1-derived macrophages were incubated with UV-AC, Cov2-AC, or CoV2-Sup obtained from infected Vero CCL81 cells or infected with CoV2. Expression of IL6 in macrophages showed as fold change relative to Cntrl was assessed 24 hr after stimulation. mRNA expression was determined by RT-qPCR and normalized to GAPDH. (B–C) THP-1-derived macrophages were incubated for 24 hr with UV-AC, Cov2-C, or CoV2-Sup obtained from Calu-3 or Vero CCL81 infected cell cultures, as indicated. (B) IL-6 and (C) IL-1β in the culture supernatants were quantified by cytometric bead array. (D) ELISA quantification of IL-6 in the culture supernatants of THP-1-derived macrophages incubated with UV-AC obtained from Vero CCL81 cells infected in the presence of glycine (Gly, 5 mM), where indicated, to inhibit release of cytosolic content due to permeabilization. (E) Quantification by TCID50 of the viral loads in 1.0 × 10⁶ AC isolated from Vero CCL81 cells similarly infected with either Coxsackievirus (Coxsackie-AC) or SARS-CoV-2 (CoV2-AC). (F) ELISA quantification of IL-6 in the culture supernatants of THP-1-derived macrophages stimulated with Cov2-AC for 24 hr. Phosphatidylserine on the cell surface was blocked to inhibit AC binding by incubation of CoV2-AC with annexin V (Ann, 0.01 and 0.1 μg/mL) prior to addition to macrophage cultures. Boxes represent the mean of three (A, B, C, F) or four (D, E) biological replicates, and error bars are ± S.E.M. Each biological replicate is shown as a circle. Significance was calculated by ANOVA (A–D, F) or Student’s t-test (E), *p<0.05, **p<0.001, ***p<0.0001, comparing the indicated groups; ns: non-significant. Data shown are from one representative out of two experiments performed independently with similar results.
-
Figure 3—figure supplement 1—source data 1
Source data for Figure 3—figure supplement 1.
- https://cdn.elifesciences.org/articles/74443/elife-74443-fig3-figsupp1-data1-v2.xlsx
Figure 4 with 1 supplement
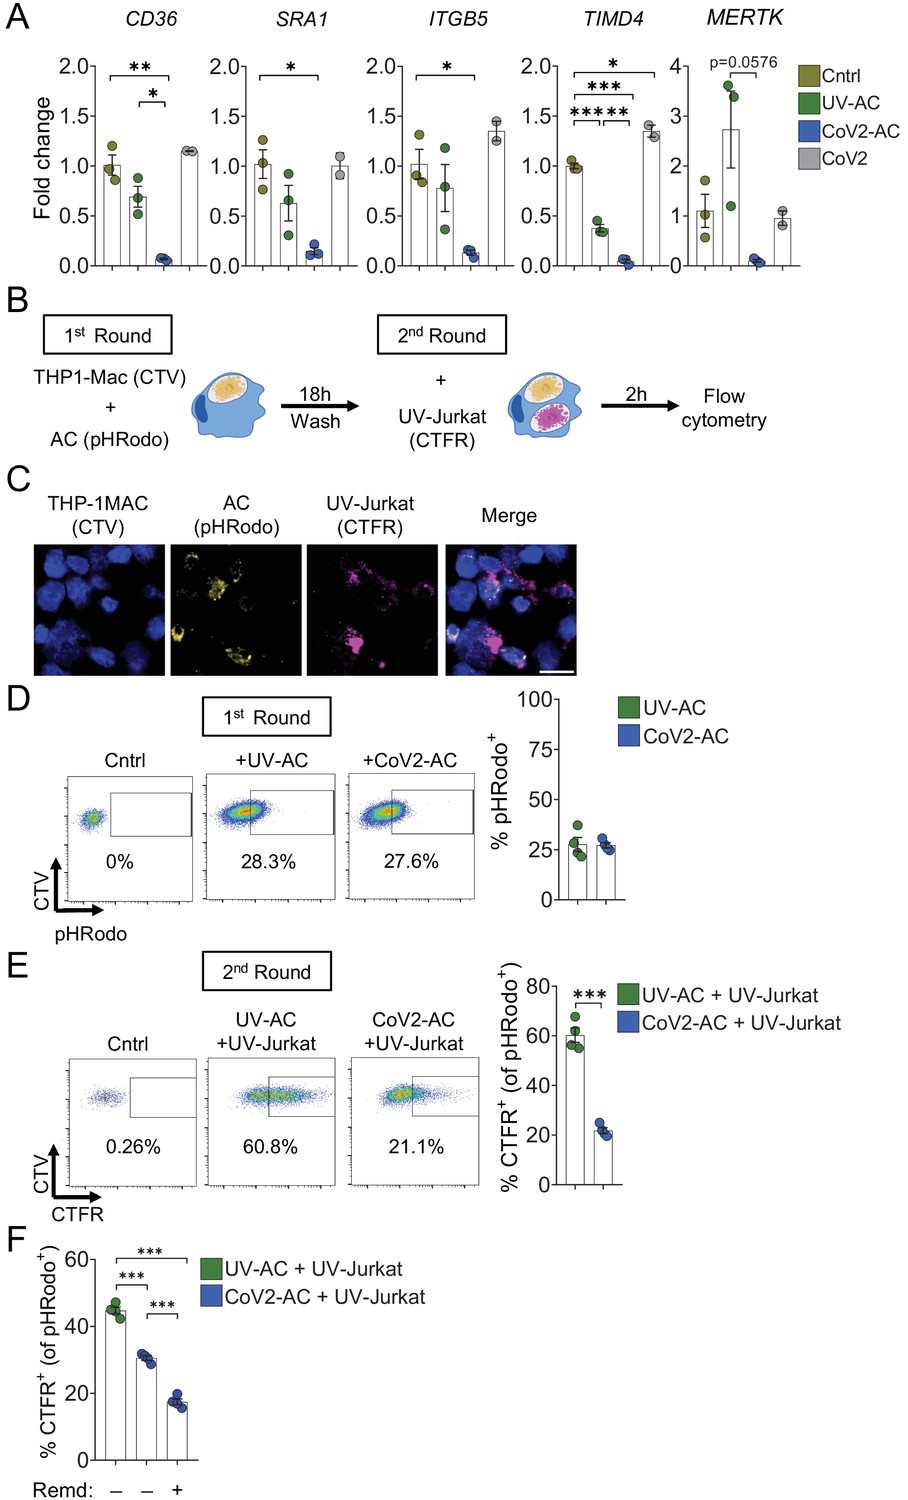
Engulfment of SARS-CoV-2-infected dying cells suppresses continual efferocytosis by macrophages.
(A) Expression of efferocytic receptors in human primary monocyte-derived macrophages. Macrophages were left unstimulated (Cntrl), co-incubated for 24 hr with apoptotic Vero CCL81 cells (AC) isolated from UV-irradiated (UV-AC) or SARS-CoV-2-infected (CoV2-AC) cultures, or infected with CoV2 (CoV2), as indicated. Expression of CD36, SRA1, ITGB5, TIMD4, and MERTK is showed as fold change relative to Cntrl. mRNA levels were determined by RT-qPCR and normalized to GAPDH. (B–F) Flow cytometric analysis of two-step efferocytosis in vitro. THP-1-derived macrophages (CTV-labeled) were incubated with UV-AC or CoV2-AC isolated from Vero CCL81 cell cultures (labeled with pHRodo) for 18 hr, and subsequently incubated with UV-irradiated apoptotic Jurkat cells (UV-Jurkat, CTFR-labeled) for 2 hr. (B) Schematic representation of consecutive co-incubations of THP-1-derived macrophages with AC prior to the assessment of cell corpse uptake by flow cytometry. (C) Representative maximal projection of scanning confocal images showing the uptake of AC (pHRodo) and UV-Jurkat (CTFR) by macrophages (CTV) after consecutive co-incubations. (D) Percentage of macrophages with internalized UV-AC or CoV2-AC (gated on total cells/single cells/live cells/CTV+/CTV+ pHRodo+); gating strategy is displayed in Figure 4—figure supplement 1B. (E) Percentage of macrophages that engulfed UV-Jurkat within pHRodo+ populations (gated on total cells/single cells/live cells/CTV+/pHRodo+/pHRodo+ CTFR+). (F) Percentage of macrophages that engulfed UV-Jurkat within pHRodo+ populations (gates as in (E)) wherein macrophages were treated with Remdesivir (Remd, 20 μM) following stimulation with CoV2-AC. Boxes represent the mean of three (A) or four (D–F) biological replicates using cells from a single donor in (A) or THP-1-derived macrophages (D–F), and error bars are ± S.E.M. Each biological replicate is shown as a circle. Significance was calculated by ANOVA (A, F) or Student’s t-test (D, E). *p<0.05, **p<0.001, ***p<0.0001, comparing the indicated groups. Data shown are from one representative out of three experiments performed independently with similar results.
-
Figure 4—source data 1
Source data for Figure 4.
- https://cdn.elifesciences.org/articles/74443/elife-74443-fig4-data1-v2.xlsx
Figure 4—figure supplement 1

Support data for Figure 4.
(A) THP-1-derived macrophages were incubated with UV-AC or CoV2-AC obtained from infected Vero CCL81 cells or infected with CoV2. Expression of the efferocytic receptors CD36, SRA-I, ITGB5, TIMD4, and MERTK showed as fold change relative to Cntrl was assessed 24 hr after stimulation. mRNA levels were determined by RT-qPCR and normalized to GAPDH. (B) Representative gating strategy used to determine CTV-labeled macrophage populations for the two-step efferocytosis experiment showed in Figure 4D and E. (C) THP-1-derived macrophages (CTV-labeled) were infected or not with SARS-CoV-2 (CoV2) for 18 hr and subsequently were incubated with CTFR-labeled, UV-irradiated apoptotic Jurkat cells (UV-Jurkat) for 2 hr. UV-Jurkat uptake is shown as the percentage of CTFR+ (gated on total cells/single cells/live cells/CTV+/CTV+ CTFR+). Boxes represent the mean of three biological replicates, and error bars are ± S.E.M. Each biological replicate is shown as a circle. Significance was calculated by ANOVA (A) or Student’s t-test (C). *p<0.05, **p<0.001, ***p<0.0001, comparing the indicated groups; ns: non-significant. Data shown are from one representative out of at least two experiments performed independently with similar results.
-
Figure 4—figure supplement 1—source data 1
Source data for Figure 4—figure supplement 1.
- https://cdn.elifesciences.org/articles/74443/elife-74443-fig4-figsupp1-data1-v2.xlsx
Figure 5

Lung monocytes and macrophages of severe COVID-19 patients express reduced levels of efferocytic receptors.
(A–B) Representative histological findings in post-mortem lung tissue from control patients (Cntrl) and COVID-19 patients, obtained by ultrasound-guided minimally invasive autopsy. Tissue samples were immunolabeled with anti-S100A9 (phagocytes, green), (A) anti-CD36 (red), or (B) anti-MERTK (red) and stained with DAPI (nuclei, blue). Representative images show cropped details of lung tissues scanned by wide-field epifluorescence imaging. Scale bar: 10 μm. The mean fluorescence intensity (MFI) of CD36 and MERTK of at least 300 S1009+ cells are shown (n=6 control and four COVID-19 patient samples). Dots represent an S1009+ cell (A and B), the crossing line represents the mean, and error bars are ± S.E.M. Significance was calculated by Mann-Whitney test (A and B), *p<0.05, **p<0.001, ***p<0.0001, comparing the indicated groups. (C) Gene set enrichment analysis for efferocytosis-related gene sets in early infiltrating phagocytes (S1009+ CCL18-) and in anti-inflammatory monocytes-derived macrophages (CD14+ S11009- CCL18+) clusters from the bronchoalveolar lavage of mild (-M Figure) and severe (-S) COVID-19 patients versus healthy individuals. The corrplot depicts the normalized enrichment score (NES), and p value for the gene sets indicated on the y-axis. (D) Enriched efferocytosis-related gene ontology (GO) terms in genes repressed in virus-positive versus virus-negative alveolar macrophages.
-
Figure 5—source data 1
Source data for Figure 5.
- https://cdn.elifesciences.org/articles/74443/elife-74443-fig5-data1-v2.xlsx
Tables
Key resources table
| Reagent type (species) or resource | Designation | Source or reference | Identifiers | Additional information |
|---|---|---|---|---|
| Antibody | anti-Sars-CoV-2 Spike (rabbit polyclonal) | Abcam | Cat: #ab272504 RRID: AB_2847845 | WB and FACS (1:1000); Immunofluorescence (1:1000) |
| Antibody | anti-CD11b+CD11 c (mouse monoclonal) | Abcam | Cat: #ab1211 RRID: AB_442947 | Immunofluorescence (1:300) |
| Antibody | anti-human CD68 (mouse monoclonal) | Abcam | Cat: #ab955 RRID: AB_307338 | Immunofluorescence (1:100) |
| Antibody | anti-CD206-FITC (mouse monoclonal) | BD Biosciences | Cat: #551135 RRID: AB_394065 | FACS (1:200) |
| Antibody | anti-caspase-3 (rabbit polyclonal) | Cell Signaling | Cat: #9662 RRID: AB_331439 | WB (1:1000) |
| Antibody | anti-cleaved caspase-3 (rabbit monoclonal) | Cell Signaling | Cat: #9664 RRID: AB_10694088 | WB and Immunofluorescence (1:1000); FACS (1:200) |
| Antibody | anti-caspase-8 (rabbit monoclonal) | Cell Signaling | Cat: #4790 RRID: AB_10545768 | WB (1:1000) |
| Antibody | anti-cleaved caspase-8 (rabbit monoclonal) | Cell Signaling | Cat: #9496 RRID: AB_561381 | WB (1:1000) |
| Antibody | anti-βactin HRP conjugate (mouse monoclonal) | Cell Signaling | Cat: #12262 RRID: AB_2566811 | WB (1:5000) |
| Antibody | anti-human CD36 (rabbit polyclonal) | Thermo Fisher Scientific | Cat: # PA5-81996 RRID: AB_2789157 | Immunofluorescence (1:100) |
| Antibody | anti-human Mertk (rabbit monoclonal) | Thermo Fisher Scientific | Cat: # MA5-31991 RRID: AB_2809285 | Immunofluorescence (1:150) |
| Antibody | anti-human cytokeratin 18 (rabbit polyconal) | GeneTex | Cat: #GTX112977 RRID: AB_10719880 | Immunofluorescence (1:500) |
| Antibody | anti-dsRNA J2 (mouse monoclonal) | SCICONS English & Scientific Consulting Kft | Cat: #10010200 RRID: AB_2651015 | Immunofluorescence (1:1000) |
| Antibody | donkey anti-rabbit IgG HRP (donkey polyclonal) | Jackson ImmunoResearch | Cat: #711-036-152 RRID: AB_2340590 | WB (1:5000) |
| Antibody | Alexa-594 goat-anti mouse IgG (goat polyclonal) | Thermo Fisher Scientific | Cat: #A11005 RRID: AB_2534073 | Immunofluorescence (1:500) |
| Antibody | Alexa-488 donkey-anti rabbit IgG (donkey polyclonal) | Thermo Fisher Scientific | Cat: #A21206 RRID: AB_2535792 | FACS (1:2500) and Immunofluorescence (1:500) |
| Antibody | Alexa-594 goat-anti rabbit IgG (goat polyclonal) | Thermo Fisher Scientific | Cat: #A11012 RRID: AB_141359 | Immunofluorescence (1:500 or 1:1000) |
| Antibody | Alexa-488 F(ab)'2 goat-anti mouse IgG (goat polyclonal) | Thermo Fisher Scientific | Cat: #A11017 RRID: AB_2534084 | Immunofluorescence (1:500) |
| Antibody | Alexa-647 donkey-anti mouse IgG (donkey polyclonal) | Thermo Fisher Scientific | Cat: #A31571 RRID: AB_162542 | Immunofluorescence (1:500 or 1:1000) |
| Antibody | Alexa-647 goat anti-rabbit IgG (goat polyclonal) | Thermo Fisher Scientific | Cat: #A21244 RRID: AB_2535812 | Immunofluorescence (1:500) |
| Cell line (Homo sapiens) | Calu-3 | BCRJ #0264 | ATCC #HTB-55 | |
| Cell line (H. sapiens) | Jurkat E6-1 | BCRJ #0125 | ATCC #TIB-152 | |
| Cell line (H. sapiens) | THP-1 | Dario Zamboni’s lab | ATCC: #TIB-202 | |
| Cell line (Cercopithecus aethiops) | Vero CCL81 | Dario Zamboni’s lab | ATCC: #CCL-81 | |
| Strain, strain background (human) | SARS-CoV-2 | Brazil/SPBR-02/2020 | ||
| Strain, strain background (human) | Coxsackievirus B5 | Roger M. Loria’s lab | ||
| Chemical compound, drug | FITC Annexin V | BD Biosciences | Cat: #556,420 | FACS (1:200) |
| Chemical compound, drug | Purified Recombinant Annexin V | BD Biosciences | Cat: #556,416 | |
| Chemical compound, drug | Zombie NIR Fixable Viability | Biolegend | Cat: #423,106 | FACS (1:400) |
| Chemical compound, drug | Zombie Violet Fixable Viability Kit | Biolegend | Cat: #423,114 | FACS (1:400) |
| Chemical compound, drug | Remdesivir | BOC Sciences | Cat: #1809249-37-3 | |
| Chemical compound, drug | phorbol 12-myristate 13-acetate (PMA) | InvivoGen | Cat: #Tlrl-pma | |
| Chemical compound, drug | Annexin V MicroBeads | Miltenyi Biotec | Cat: #130-090-201 | |
| Chemical compound, drug | Z-VAD-FMK | Selleckchem | Cat: #S7023 | |
| Chemical compound, drug | Glycine | Sigma | Cat: #G7126 | |
| Chemical compound, drug | complete, Mini Protease Inhibitor Cocktail | Sigma | Cat: #11836153001 | |
| Chemical compound, drug | Cytochalasin D | Sigma | Cat: #C8273 | |
| Chemical compound, drug | CellTrace CFSE Cell Proliferation Kit | Thermo Fisher Scientific | Cat: #C34554 | |
| Chemical compound, drug | CellTrace Far Red Cell Proliferation Kit | Thermo Fisher Scientific | Cat: #C34564 | |
| Chemical compound, drug | CellTrace Violet Cell Proliferation Kit | Thermo Fisher Scientific | Cat: #C34557 | |
| Chemical compound, drug | pHrodo Red AM Intracellular pH Indicator | Thermo Fisher Scientific | Cat: #P35372 | |
| Chemical compound, drug | Hoechst 33,342 | Thermo Fisher Scientific | Cat: #H3570 | |
| Commercial assay or kit | BD Cytofix/Cytoperm Fixation/Permeabilization Kit | BD Biosciences | Cat: #554,715 | |
| Commercial assay or kit | CytoTox 96 Non-Radioactive Cytotoxicity Assay | BD Biosciences | Cat: #G1780 | |
| Commercial assay or kit | Human Inflammatory Cytokine Cytometric Bead Array (CBA) | BD Biosciences | Cat: #551,811 | |
| Commercial assay or kit | Human IL-6 DuoSet ELISA | R&D Systems | Cat: #DY206-05 | |
| Commercial assay or kit | PowerUp SYBR Green Master Mix | Thermo Fisher Scientific | Cat: #A25742 | |
| Commercial assay or kit | Zenon Rabbit IgG Labeling Kits | Thermo Fisher Scientific | Cat: #Z25306 | |
| Commercial assay or kit | Direct-zol RNA Miniprep Kits | Zymo Research | Cat: #R2052 | |
| Software, algorithm | Adobe Photoshop | Adobe Inc | ||
| Software, algorithm | FlowJo v10.8.0 | FlowJo, LLC | ||
| Software, algorithm | Graphpad PRISM 8.0 | GraphPad Software, Inc | ||
| Software, algorithm | ImageJ (Fiji) | National Institutes of Health | ||
| Software, algorithm | NIS Elements | Nikon Instruments Inc. | ||
| Software, algorithm | ClusterProfiler | Wu et al., 2021 | ||
| Software, algorithm | fgsea R | Korotkevich et al., 2016 | ||
| Software, algorithm | R v4.0.4 | |||
| Software, algorithm | Seurat v4.1.0 | Stuart et al., 2019 | ||
| Software, algorithm | Enrichr | Chen et al., 2013 |
Additional files
-
Supplementary file 1
Custom gene sets incorporating associated to efferocytic pathway and related to human diseases (related to Figure 5C).
- https://cdn.elifesciences.org/articles/74443/elife-74443-supp1-v2.docx
-
Supplementary file 2
Medical characteristics of COVID-19 patients.
- https://cdn.elifesciences.org/articles/74443/elife-74443-supp2-v2.docx
-
Transparent reporting form
- https://cdn.elifesciences.org/articles/74443/elife-74443-transrepform1-v2.pdf
Download links
A two-part list of links to download the article, or parts of the article, in various formats.
Downloads (link to download the article as PDF)
Open citations (links to open the citations from this article in various online reference manager services)
Cite this article (links to download the citations from this article in formats compatible with various reference manager tools)
Efferocytosis of SARS-CoV-2-infected dying cells impairs macrophage anti-inflammatory functions and clearance of apoptotic cells
eLife 11:e74443.
https://doi.org/10.7554/eLife.74443


