Single-cell atlas of early chick development reveals gradual segregation of neural crest lineage from the neural plate border during neurulation
- California Institute of Technology, Division of Biology and Biological engineering, United States
- University of Oxford, MRC Weatherall Institute of Molecular Medicine, Radcliffe Department of Medicine, United Kingdom
Figures
Figure 1 with 2 supplements

Single-cell RNA-seq of avian epiblast from HH4 through HH7.
(A) Tfap2A expression at HH4, detected by HCR. (B) UMAP plot depicting five clusters resolved from 2064 epiblast cells at HH4. (C) Feature plots of selected genes in HH4 clusters. (D) Pax7 and Tfap2A expression at HH5 detected by HCR. (E) UMAP plot depicting eight clusters resolved from 6363 cells from dissected neural plate border regions at HH5, black dotted region in (D). (F) Feature plots of selected genes in HH5 clusters. (G) Pax7 and Tfap2A expression at HH6 detected by HCR. (H) UMAP plot depicting 12 clusters resolved from 4294 epiblast cells at HH6. (I) Feature plots of selected genes in HH6 clusters. (J) Pax7 and Tfap2A expression at HH7 detected by HCR. (K) UMAP plot depicting 11 clusters resolved from 4000 epiblast cells at HH7. (L) Feature plots of selected genes in HH7 clusters.
Figure 1—figure supplement 1
Quality control and supporting data for HH4 and HH5 10 X data.
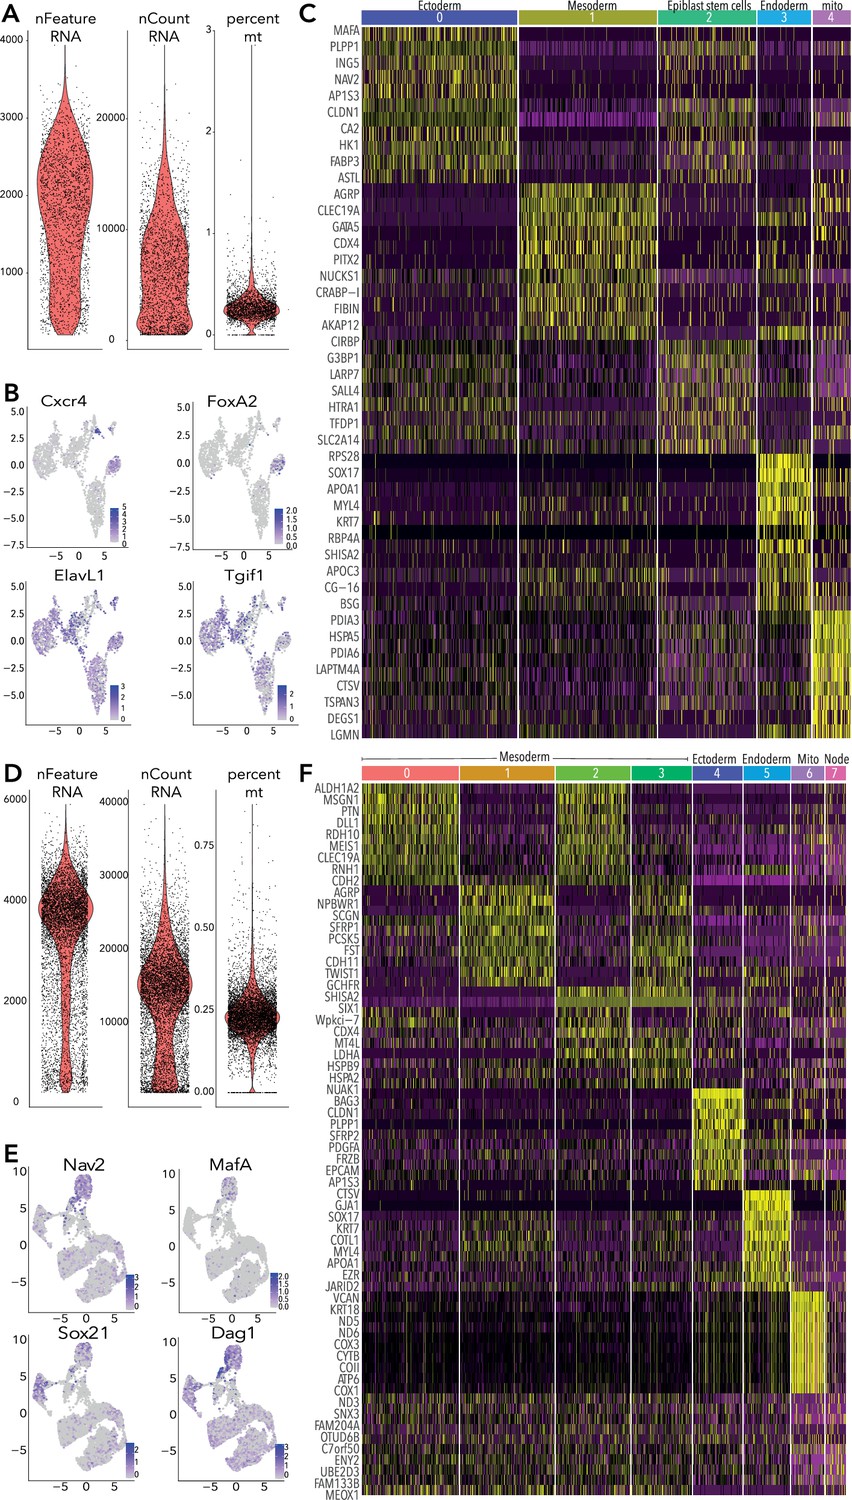
(A) Violin plots showing RNA features, counts and percentage of mitochondrial reads per cell from HH4 data. Cells were filtered to exclude those with <500 and > 3500 features (genes) and >0.5% mitochondrial gene content. (B) Feature plots of selected genes in HH4 clusters. (C) Heatmap depicting top 10 differentially expressed genes across each cluster from HH4. (D) Violin plots showing RNA features, counts and percentage of mitochondrial reads per cell from HH5 data. Cells were filtered to exclude those with <500 and > 5500 features (genes) and >0.5% mitochondrial gene content. (E) Feature plots of selected genes in HH5 subclusters. (F) Heatmap depicting top 10 differentially expressed genes across each cluster from HH5.
Figure 1—figure supplement 2
Quality control and supporting data for HH6 and HH7 10 X data.
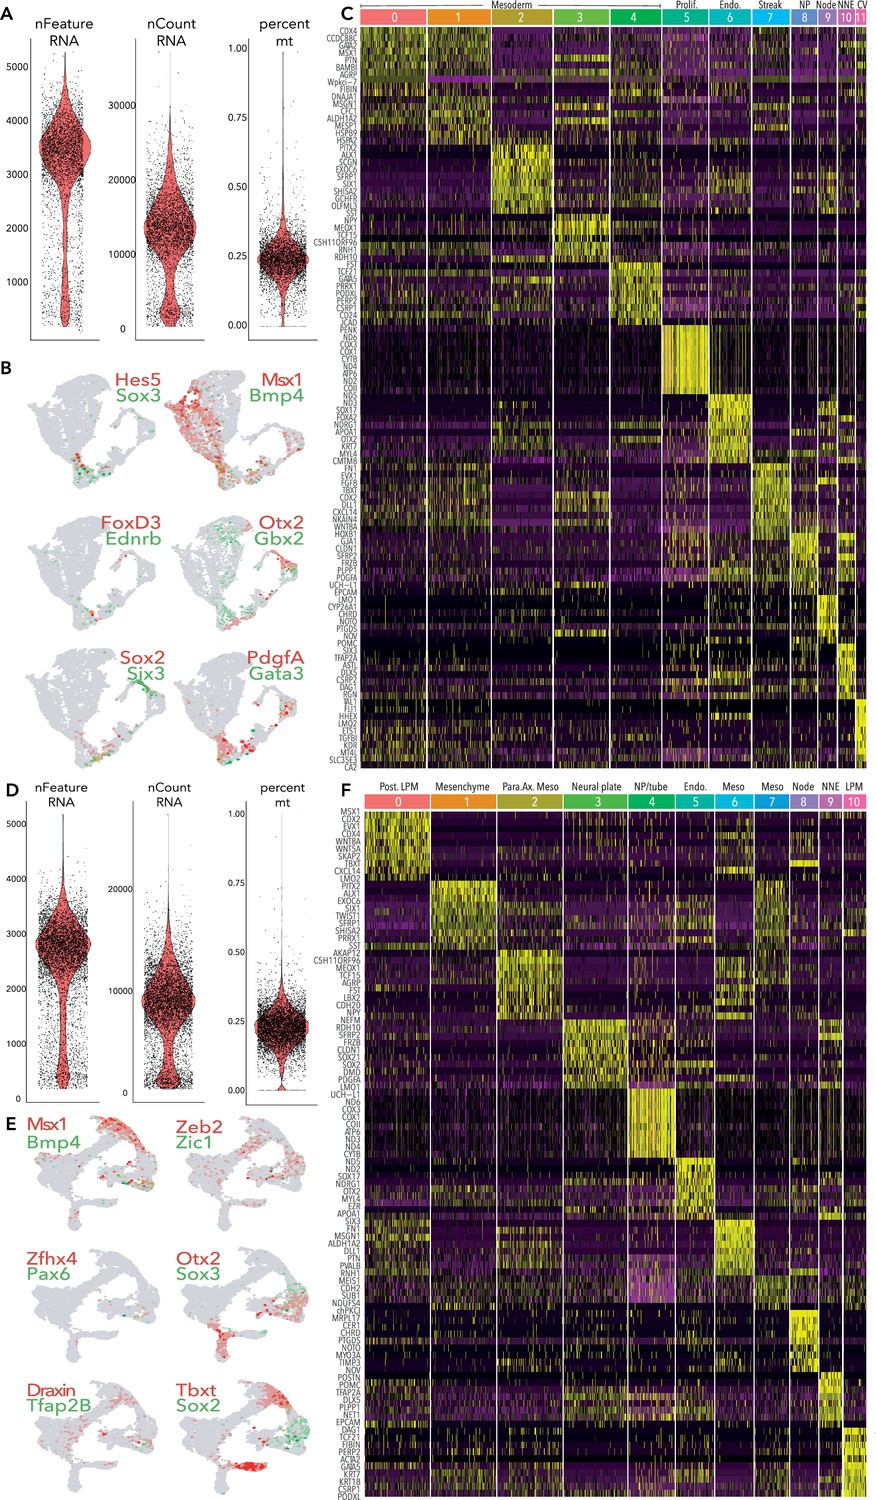
(A) Violin plots showing RNA features, counts and percentage of mitochondrial reads per cell from HH6 data. Cells were filtered to exclude those with <500 and > 5000 features (genes) and >0.5% mitochondrial gene content. (B) Feature plots of selected genes in HH6 clusters. (C) Heatmap depicting top 10 differentially expressed genes across each cluster from HH6. (D) Violin plots showing RNA features, counts and percentage of mitochondrial reads per cell from HH7 data. Cells were filtered to exclude those with <500 and > 4000 features (genes) and >0.5% mitochondrial gene content. (E) Feature plots of selected genes in HH7 clusters. (F) Heatmap depicting top 10 differentially expressed genes across each cluster from HH7.
Figure 2 with 1 supplement
Subclustering ectoderm clusters extracted from whole epiblast data.
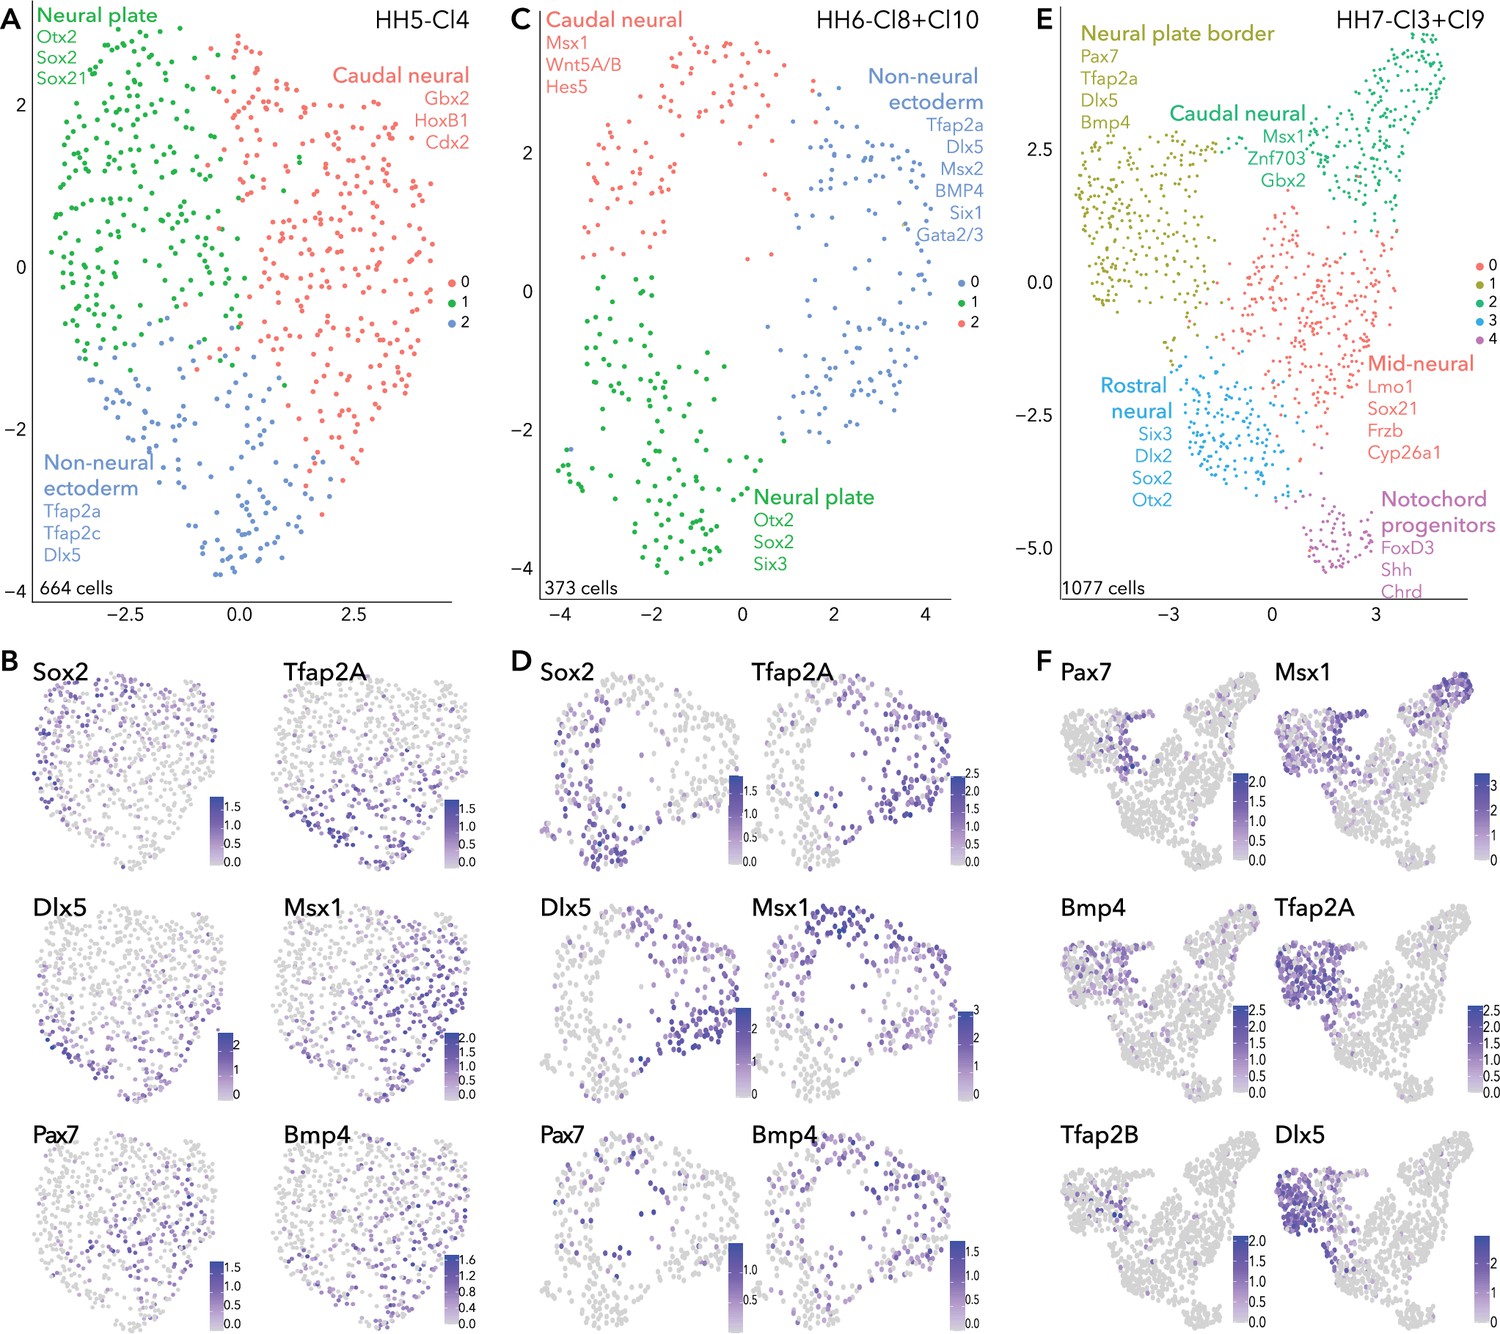
(A) UMAP plot depicting three clusters resolved from HH5-Cl4. (B) Feature plots of selected genes in HH5 subclusters. (C) UMAP plot depicting three clusters resolved from HH6-Cl8 and HH6-Cl10. (D) Feature plots of selected genes in HH6 subclusters. (E) UMAP plot depicting five clusters resolved from HH7-Cl3 and HH7-Cl9. (F) Feature plots of selected genes in HH7 subclusters.
Figure 2—figure supplement 1
Supporting data for subclustering HH5, HH6, and HH7 ectoderm clusters.
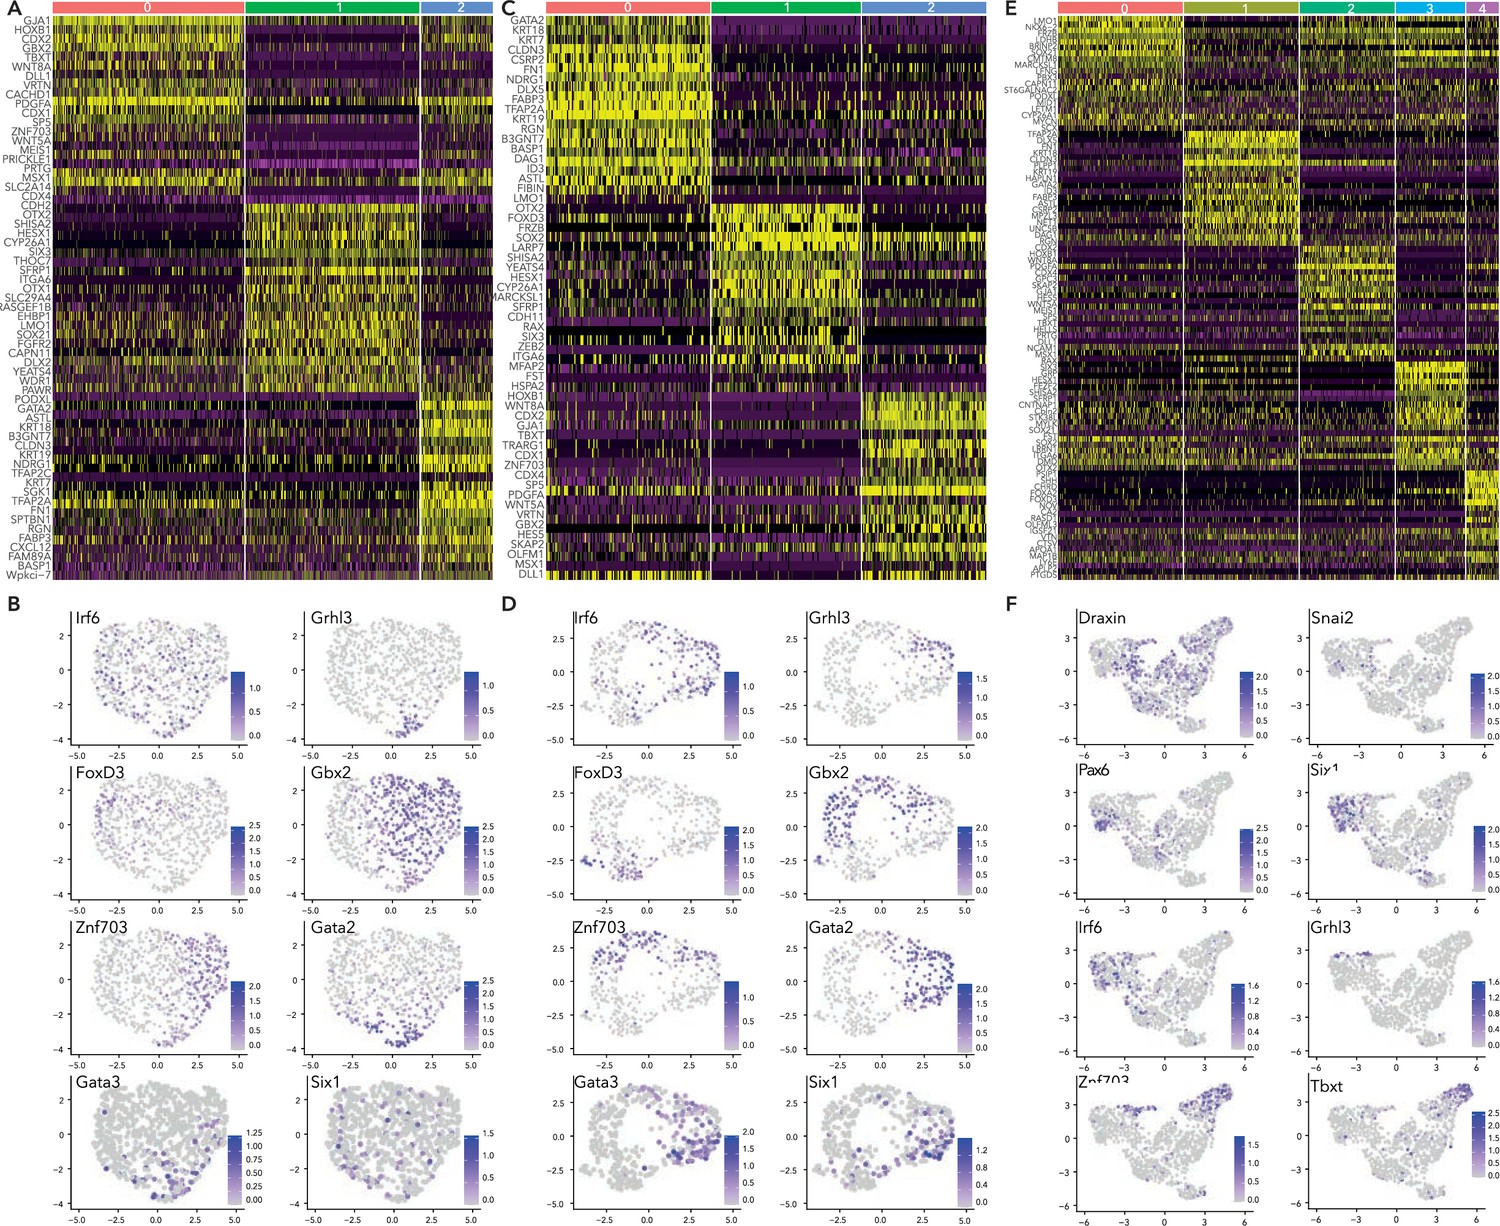
(A) Heatmap depicting top 20 differentially expressed genes across HH5 subclusters. (B) Feature plots of selected genes in HH5 subclusters. (C) Heatmap depicting top 20 differentially expressed genes across HH6 subclusters, (D) Feature plots of selected genes in HH6 subclusters. (E) Heatmap depicting top 20 differentially expressed genes across HH7 subclusters. (F) Feature plots of selected genes in HH7 subclusters.
Figure 3 with 1 supplement
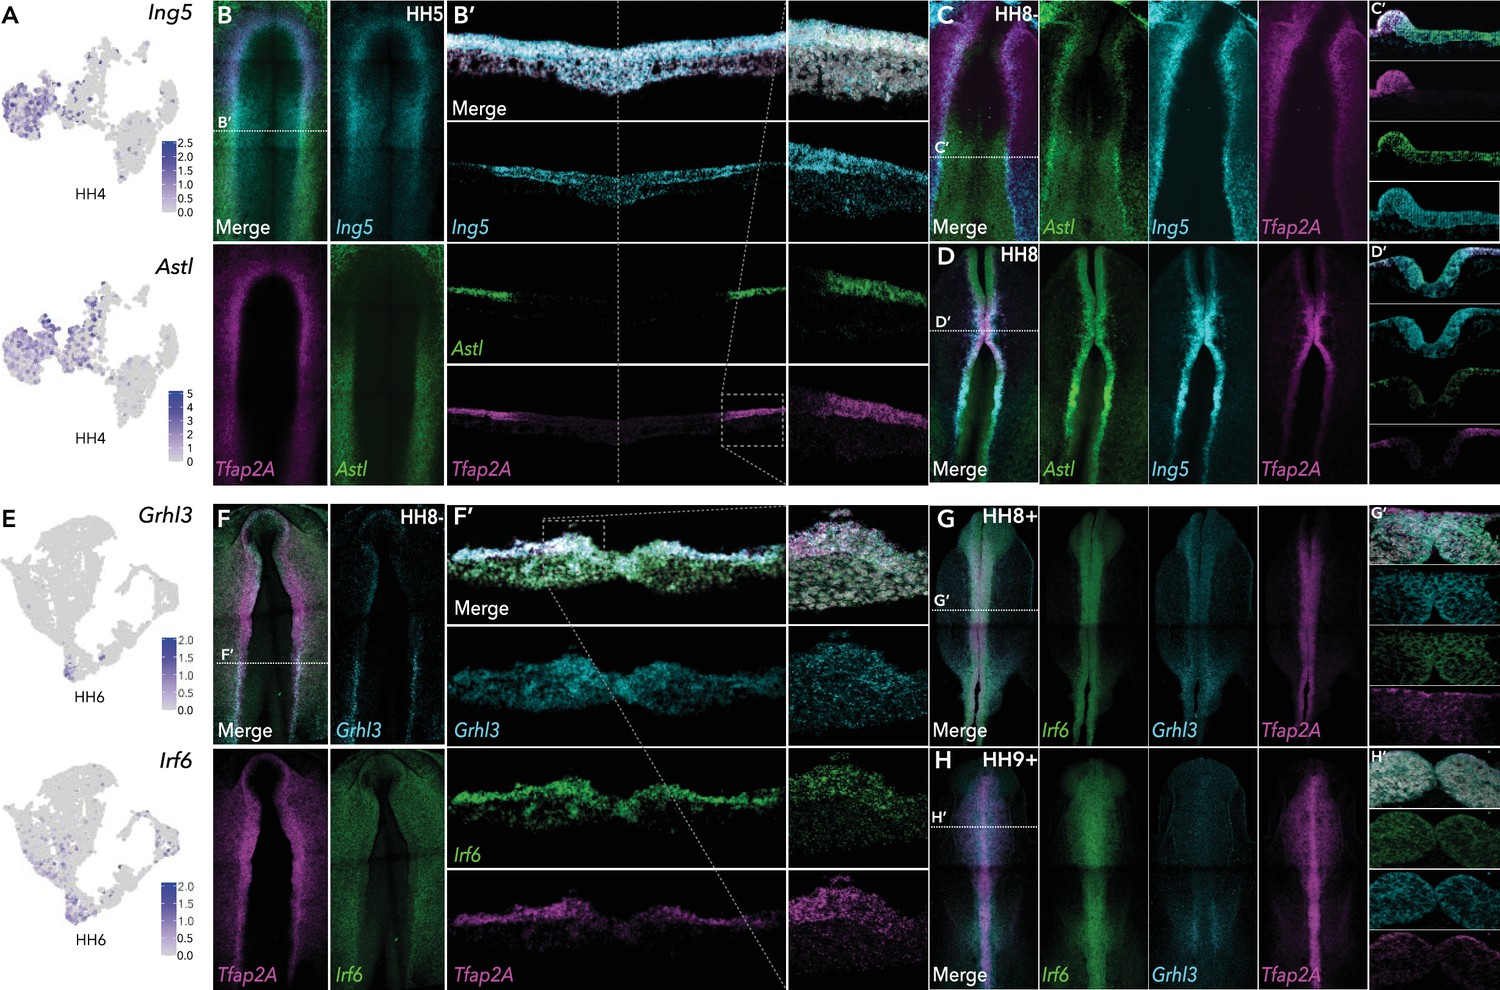
HCR validation of novel genes identified from whole epiblast data.
(A) Feature plots of Ing5 and Astl in HH4 data. (B) Whole mount HCR shows co-expression of Ing5 and Astl with neural plate border marker Tfap2A at HH5. (B’) Transverse cryosection of (B) (dashed line). Dashed boxed region shown at high magnification in right panel. (C–D) Whole mount HCR shows co-expression of Ing5 and Astl with neural plate border marker Tfap2A at HH8- (C) and HH8 (D). (C’-D’) Transverse cryosections of (C) and (D), respectively. (E) Feature plots of Grhl3 and Irf6 in HH6 data. (F) Whole mount HCR shows co-expression of Grhl3 and Irf6 with neural plate border marker Tfap2A at HH8-. (F’) Transverse cryosection of (F) (dashed line). Dashed boxed region shown at high magnification in right panel. (G–H) Whole mount HCR shows co-expression of Grhl3 and Irf6 with neural plate border marker Tfap2A at HH8+ (G) and HH9+ (H). (G’-H’) Transverse cryosections of (G) and (H), respectively.
Figure 3—figure supplement 1
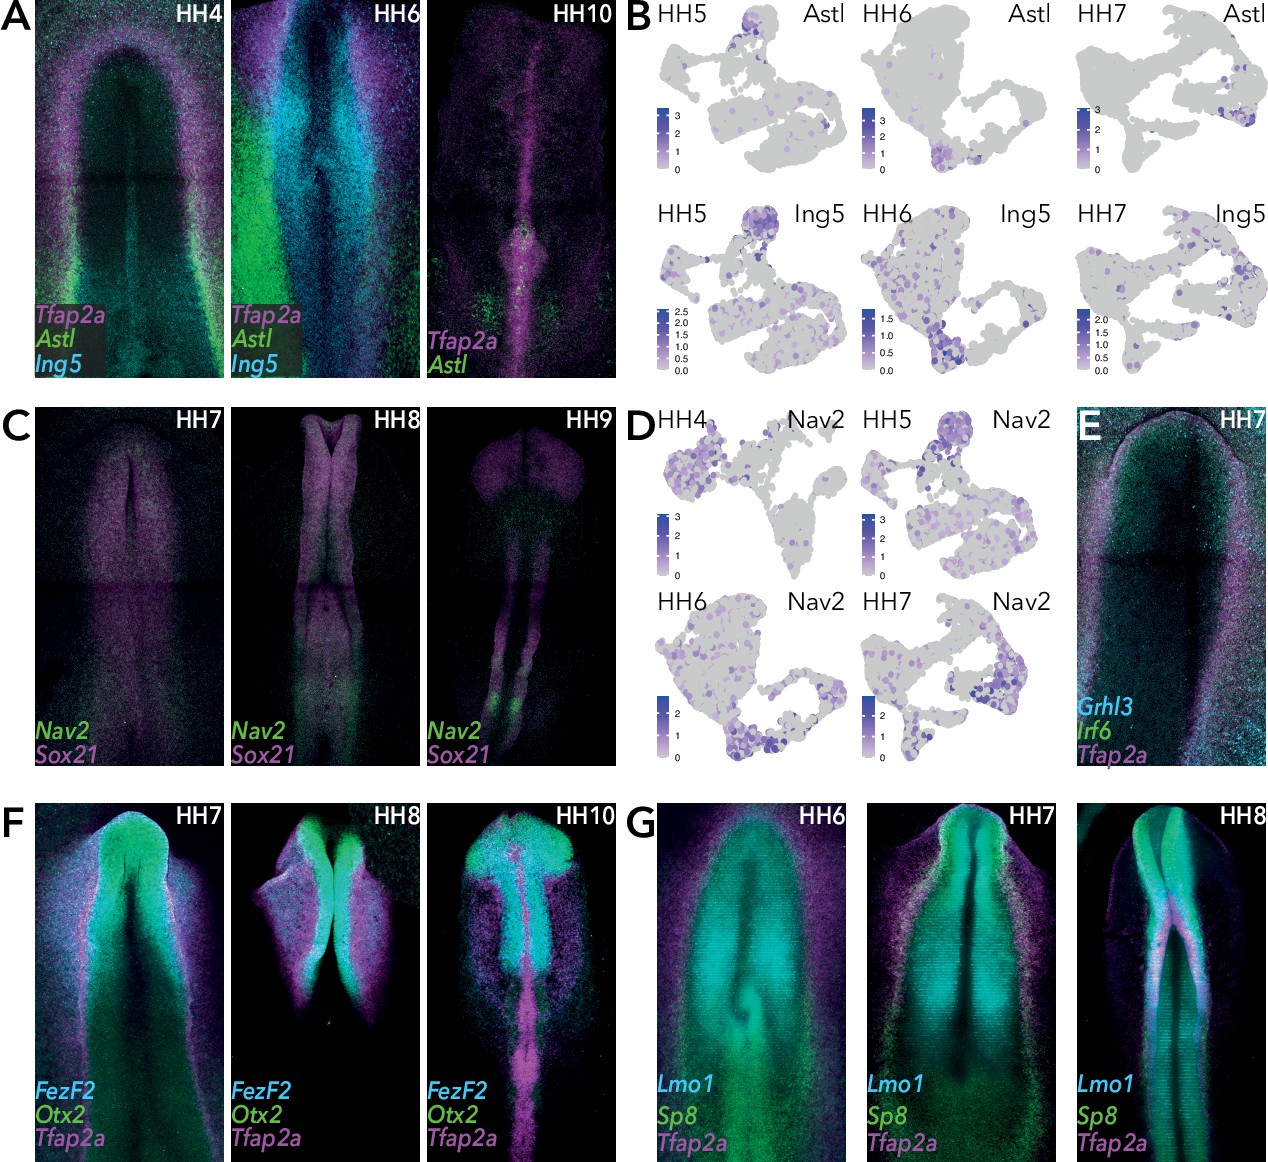
HCR validation of selected genes.
(A) Whole mount HCR shows co-expression of Astl and Ing5 with neural plate border marker Tfap2A at stages HH4, HH6, HH10. (B) Feature plots of Astl and Ing5 across whole epiblast data sets at stages HH5, HH6, and HH7. (C) Whole mount HCR shows co-expression of Nav2 and Sox21 at stages HH7, HH8, and HH9. (D) Feature plots of Nav2 across whole epiblast data sets. (E) Whole mount HCR shows co-expression of Grhl3, Irf6 and Tfap2A at HH7. (F) Whole mount HCR shows co-expression of FezF2 and Otx2 with neural plate border markers Tfap2A at stages HH7, HH8, and HH10. (G) Whole mount HCR shows co-expression of Lmo1 and Sp8 with neural plate border markers Tfap2A at stages HH6, HH7, and HH8.
Figure 4
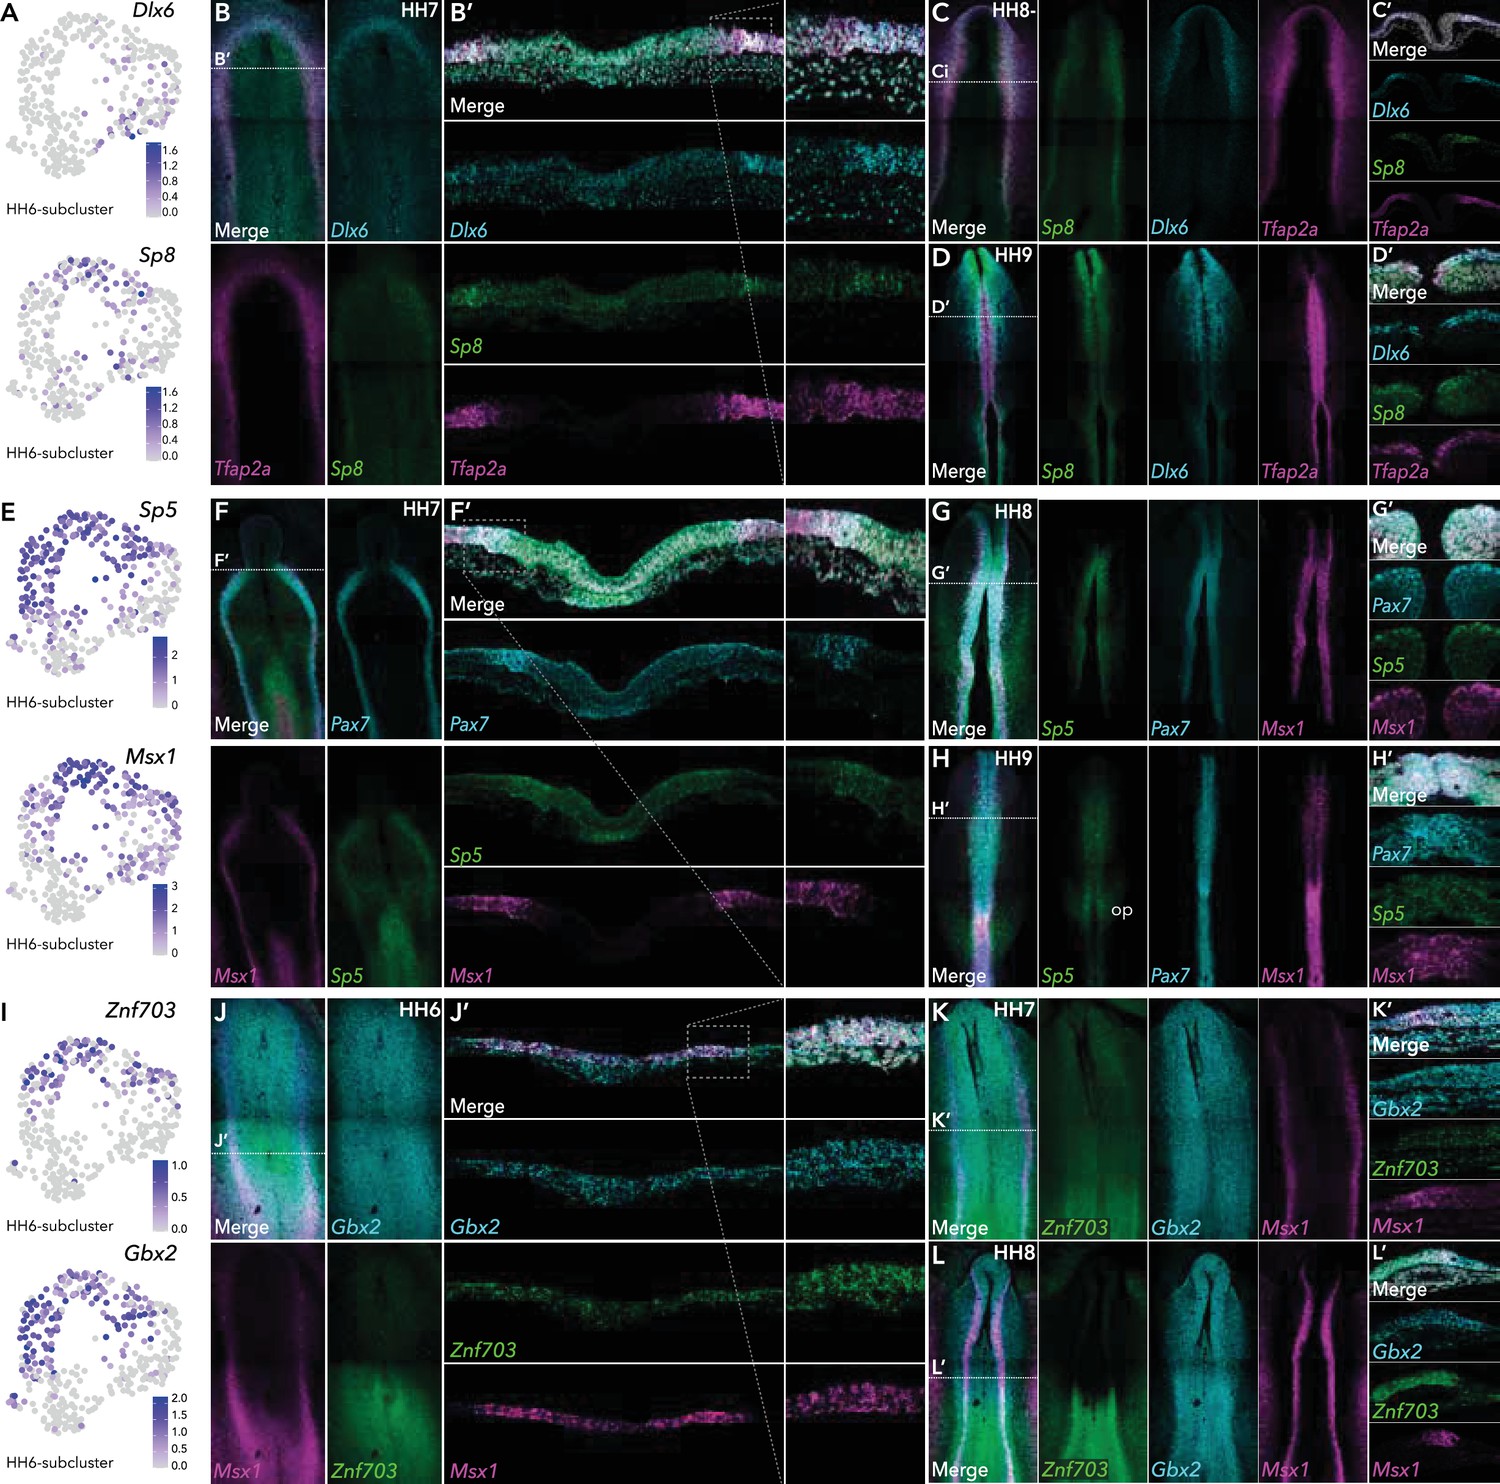
HCR validation of novel genes identified from extracted ectoderm clusters.
(A) Feature plots of Dlx6 and Sp8 in HH6 subclusters. (B) Whole mount HCR shows co-expression of Dlx6 and Sp8 with neural plate border marker Tfap2A at HH7. (B’) Transverse cryosection of (B) (dashed line). Dashed boxed region shown at high magnification in right panel. (C–D) Whole mount HCR shows co-expression of Dlx6 and Sp8 with neural plate border marker Tfap2A at HH8- (C) and HH9 (D). (C’-D’) Transverse cryosections of (C) and (D), respectively. (E) Feature plots of Sp5 and Msx1 in HH6 subclusters. (F) Whole mount HCR shows co-expression of Sp5 with neural plate border markers Msx1 and Pax7 at HH7. (F’) Transverse cryosection of (E) (dashed line). Dashed boxed region shown at high magnification in right panel. (G–H) Whole mount HCR shows co-expression of Sp5 with neural plate border markers Msx1 and Pax7 at HH8 (G) and HH9 (H). (G’-H’) Transverse cryosections of (G) and (H) respectively. (I) Feature plots of Znf703 and Gbx2 in HH6 subclusters. (J) Whole mount HCR shows co-expression of Znf703 and Gbx2 with neural plate border marker Msx1 at HH6. (J’) Transverse cryosection of (J) (dashed line). Dashed boxed region shown at high magnification in right panel. (K–L) Whole mount HCR shows co-expression of Znf703 and Gbx2 with neural plate border marker Msx1 at HH7 (K) and HH8 (L). (K’-L’) Transverse cryosections of (K) and (L) respectively. Op; otic placode.
Figure 5 with 2 supplements
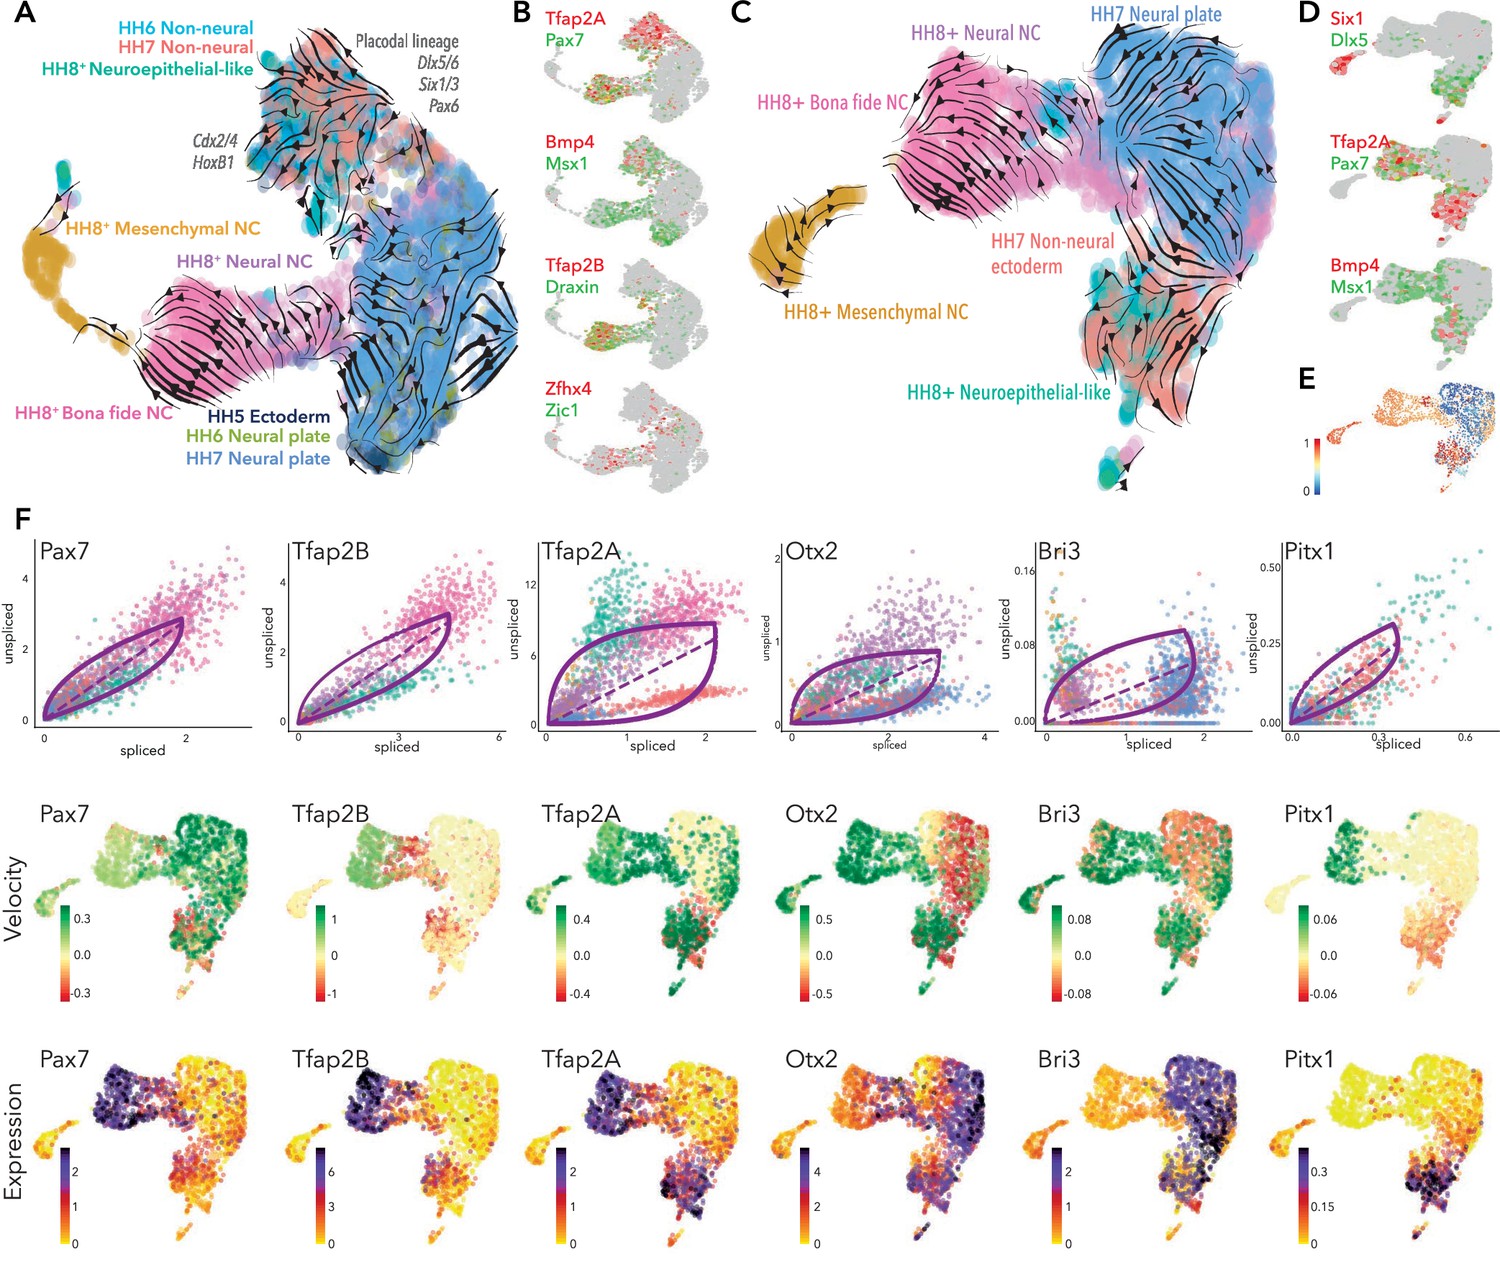
Developmental trajectory predictions from the neural plate border to premigratory neural crest.
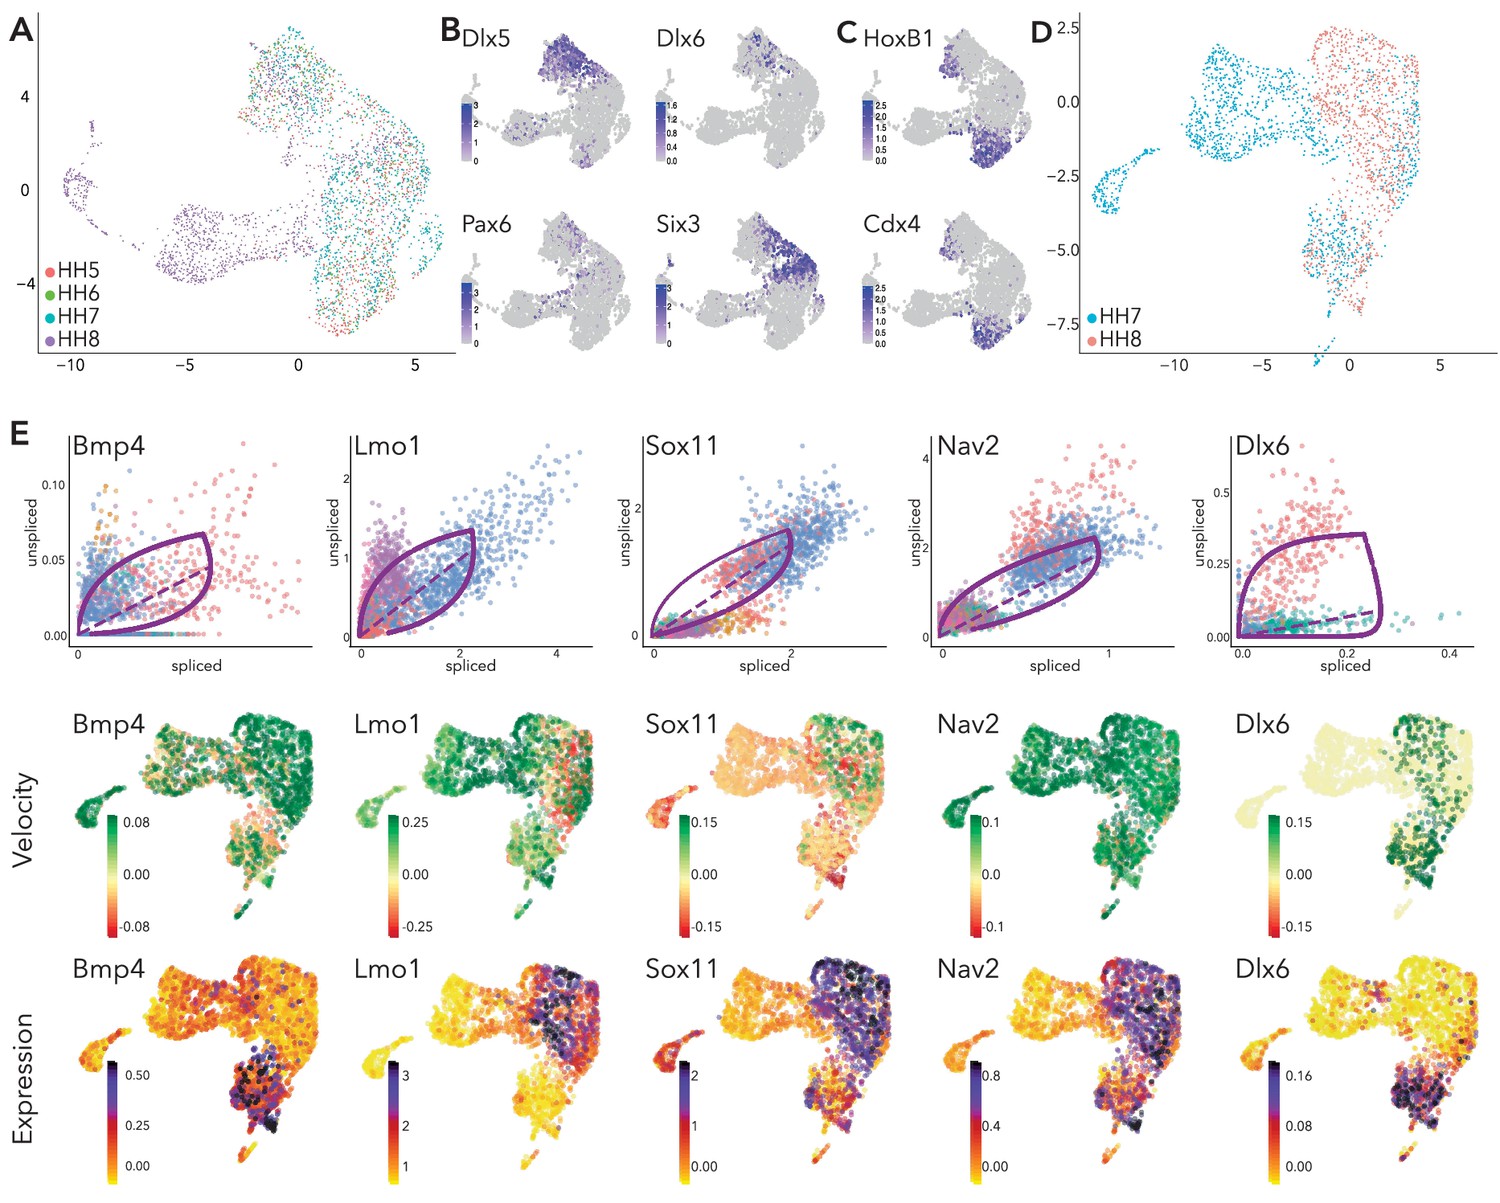
(A) UMAP embedding of ectoderm clusters combined with premigratory neural crest data showing predicted trajectories. (B) Colocalization of selected genes across the combined data set. (C) UMAP embedding of HH7 ectoderm clusters combined with premigratory neural crest data showing predicted trajectories. (D) Colocalization of selected genes across HH7/premigratory neural crest combined data set. (E) Latent time data from HH7/premigratory neural crest combined data-set. Scale represents oldest (0, blue) to newest cells (1, red). (F) Phase portraits (top row) colors correlate with those in A/C, velocity plots (middle row) and expression plots (bottom row) of selected genes across the HH7/ premigratory neural crest combined data sets. NC; neural crest.
Figure 5—figure supplement 1
Supporting data for combined data set scVelo analysis.
(A) UMAP embedding of clusters from all combined data sets showing stages. (B–C) Feature plots of selected genes in combined dataset. (D) UMAP embedding of clusters from HH7 and HH8 combined data sets showing stages. (E) Phase portraits (top row), colors correlate with those in Figure 5A/C. Velocity plots (middle row) and expression plots (bottom row) of selected genes across the HH7/premigratory NC combined data sets.
Figure 5—figure supplement 2
scVelo analysis at individual time points.
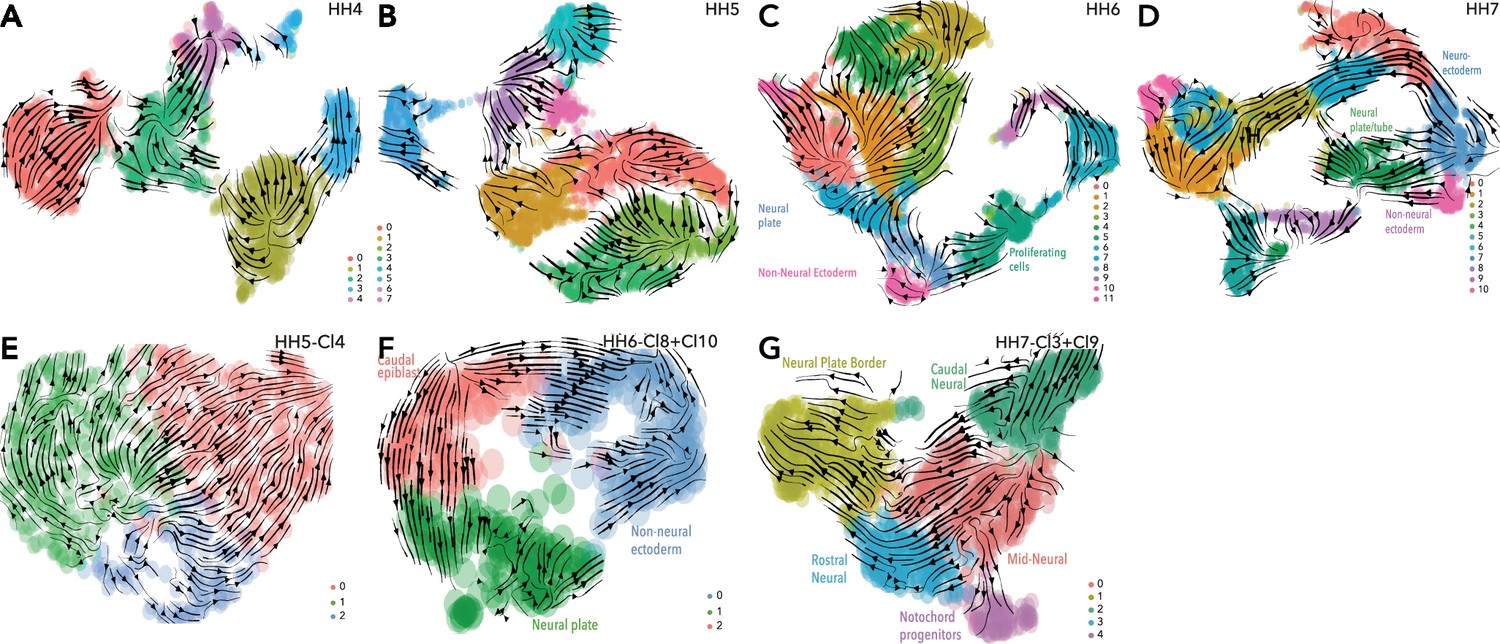
(A) UMAP embedding of clusters from whole epiblast data at HH4 showing scVelo predicted trajectories. (B) UMAP embedding of clusters from whole epiblast data at HH5 showing scVelo predicted trajectories. (C) UMAP embedding of clusters from whole epiblast data at HH6 showing scVelo predicted trajectories (D) UMAP embedding of clusters from whole epiblast data at HH7 showing predicted trajectories. (E) UMAP embedding of subclusters from HH5 ectoderm cluster (HH5-Cl4) showing scVelo predicted trajectories. (F) UMAP embedding of extracted ectoderm subclusters from HH6 showing predicted trajectories. (G) UMAP embedding of extracted ectoderm subclusters from HH7 showing predicted trajectories.
Tables
Key resources table
| Reagent type (species) or resource | Designation | Source or reference | Identifiers | Additional information |
|---|---|---|---|---|
| Gene (Gallus gallus) | Fertilized hens eggs | Sunstate Ranch Sylmar CA | ||
| Commercial assay or kit | Chromium Single Cell 3’ v3 Library | 10 X Genomics | Cat. #1000075 | |
| Software, algorithm | Seurat v3CellRanger v3.1.0 | Stuart et al., 2019 Doi:10.1016/j.cell.2019.05.031Zheng et al., 2017 DOI: 10.1038/ncomms14049 |
Additional files
-
Transparent reporting form
- https://cdn.elifesciences.org/articles/74464/elife-74464-transrepform1-v1.docx
-
Source data 1
10X summary.
- https://cdn.elifesciences.org/articles/74464/elife-74464-supp1-v1.xlsx
Download links
A two-part list of links to download the article, or parts of the article, in various formats.
Downloads (link to download the article as PDF)
Open citations (links to open the citations from this article in various online reference manager services)
Cite this article (links to download the citations from this article in formats compatible with various reference manager tools)
Single-cell atlas of early chick development reveals gradual segregation of neural crest lineage from the neural plate border during neurulation
eLife 11:e74464.
https://doi.org/10.7554/eLife.74464


