History-dependent physiological adaptation to lethal genetic modification under antibiotic exposure
- Department of Basic Science, Graduate School of Arts and Sciences, The University of Tokyo, Japan
- Research Center for Complex Systems Biology, The University of Tokyo, Japan
- Department of Life Sciences, Graduate School of Arts and Sciences, The University of Tokyo, Japan
- Universal Biology Institute, The University of Tokyo, Japan
Figures
Figure 1 with 2 supplements
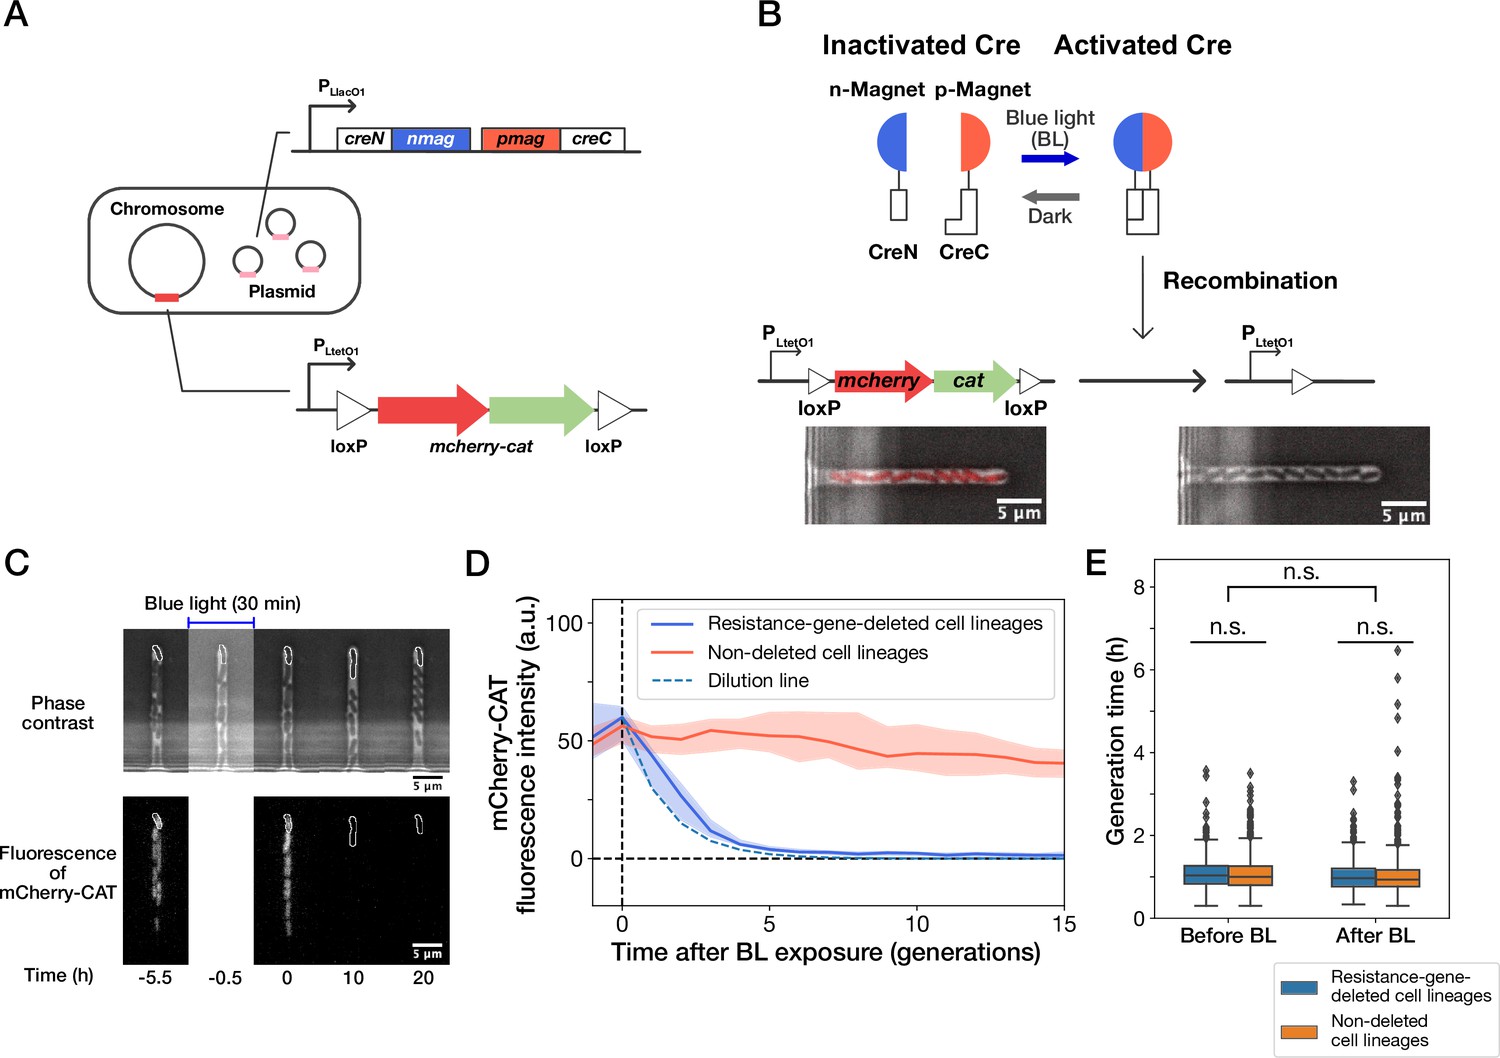
Live-cell monitoring of phenotypic transitions in response to gene deletion.
(A) Schematic drawing of an E. coli strain, YK0083. This strain harbors the photo-removable mcherry-cat gene on the chromosome and a low-copy plasmid carrying the pa-cre genes (creN-nmag and pmag-creC). (B) The PA-Cre system. Blue-light illumination provokes the dimerization of two PA-Cre fragments and induces the deletion of the mcherry-cat gene. The micrographs represent the combined images of phase contrast and mCherry-CAT fluorescence channels. Left and right images show the cells before and after blue-light illumination, respectively. (C) Representative time-lapse images of gene-deletion experiments. The upper and lower images show the cells in phase contrast and mCherry-CAT fluorescence channels, respectively. The cell lineages at the closed end of the growth channel (outlined in white) were monitored. A 30-min blue-light illumination starting at = –0.5 hr led to the loss of mCherry-CAT fluorescence signals in this cell lineage. (D) The transitions of mCherry-CAT fluorescence intensities in resistance-gene-deleted (blue) and non-deleted (red) cell lineages. Lines and shaded areas represent the medians and the 25–75% ranges, respectively. The cyan broken line represents the expected fluorescence decay curve when the fluorescence intensity decreases to half in each generation. (E) Generation time of resistance-gene-deleted and non-deleted cells 10 generations before and after blue-light illumination. The middle line and both edges of the boxes represent the medians and the 25–75% ranges of generation time. Whiskers indicate the minimum and maximum of the data except for the outliers. The points represent the outliers. No significant differences in generation time were detected between the groups at the significance level of 0.01 (p = 0.47 for before BL, p = 0.027 for after BL, p = 0.055 for before BL vs after BL, Mann-Whitney U test).
Figure 1—figure supplement 1
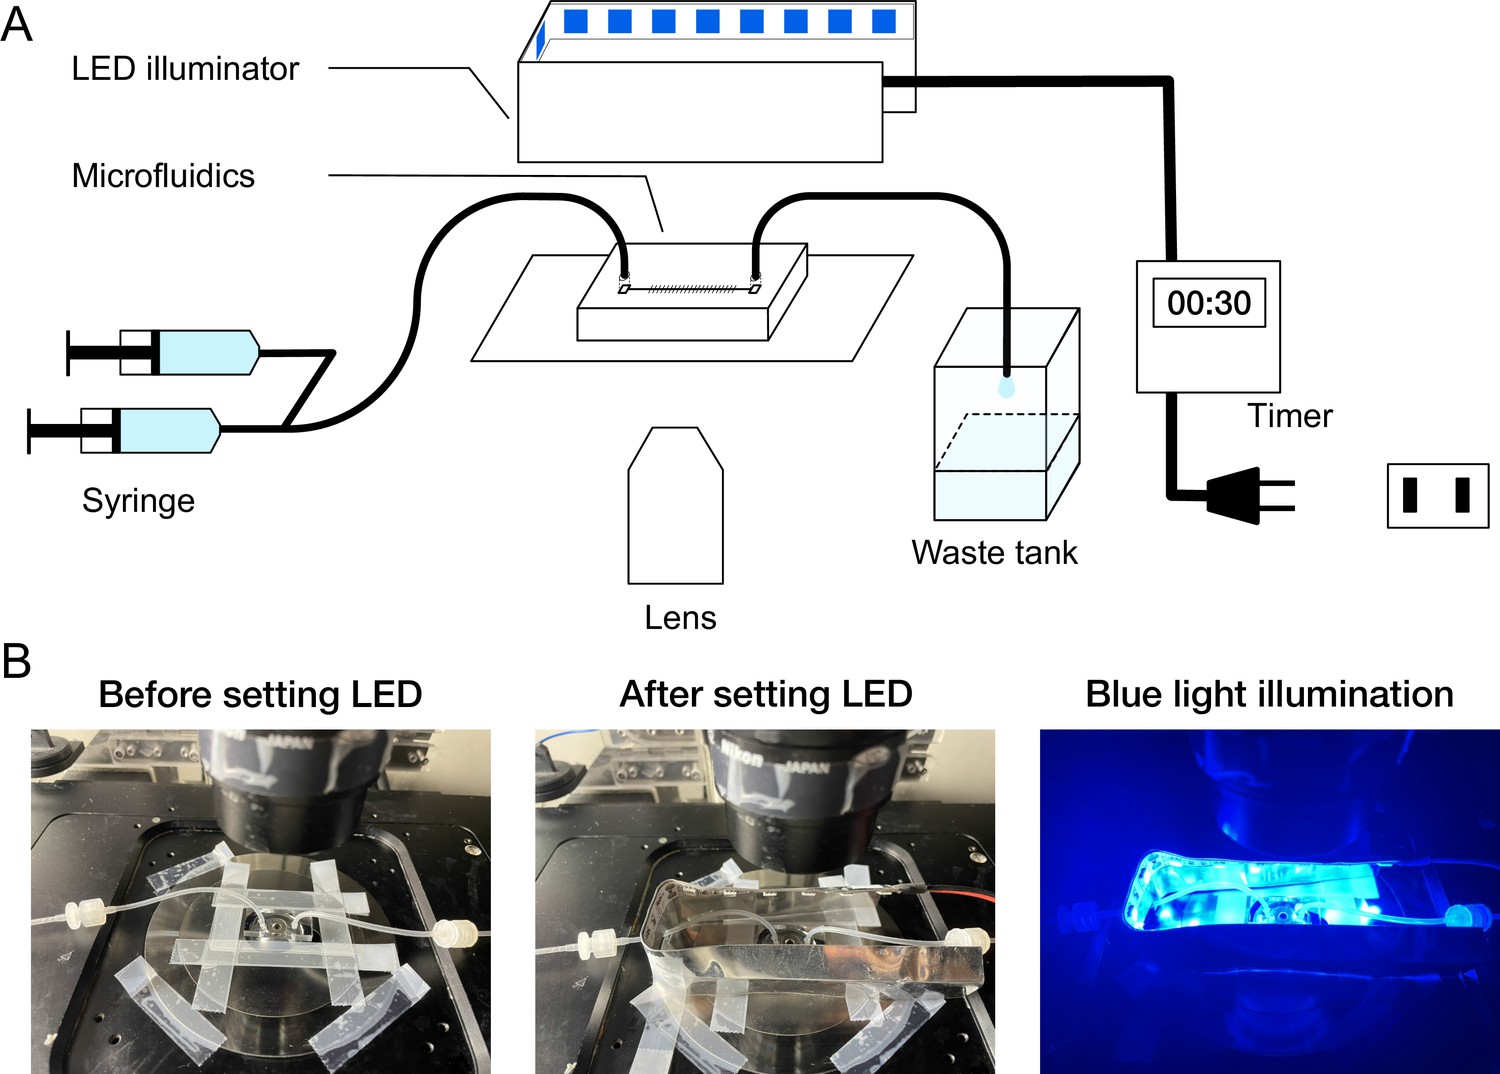
On-stage blue-light LED illuminator.
(A) Schematic diagram of microscope setup. A custom blue-light LED illuminator was placed on the microscope stage to illuminate the microfluidic device. The timing and duration of illumination were controlled by an external timer. (B) Photo images of the microfluidic device and LED illuminator mounted on the microscope stage.
Figure 1—figure supplement 2
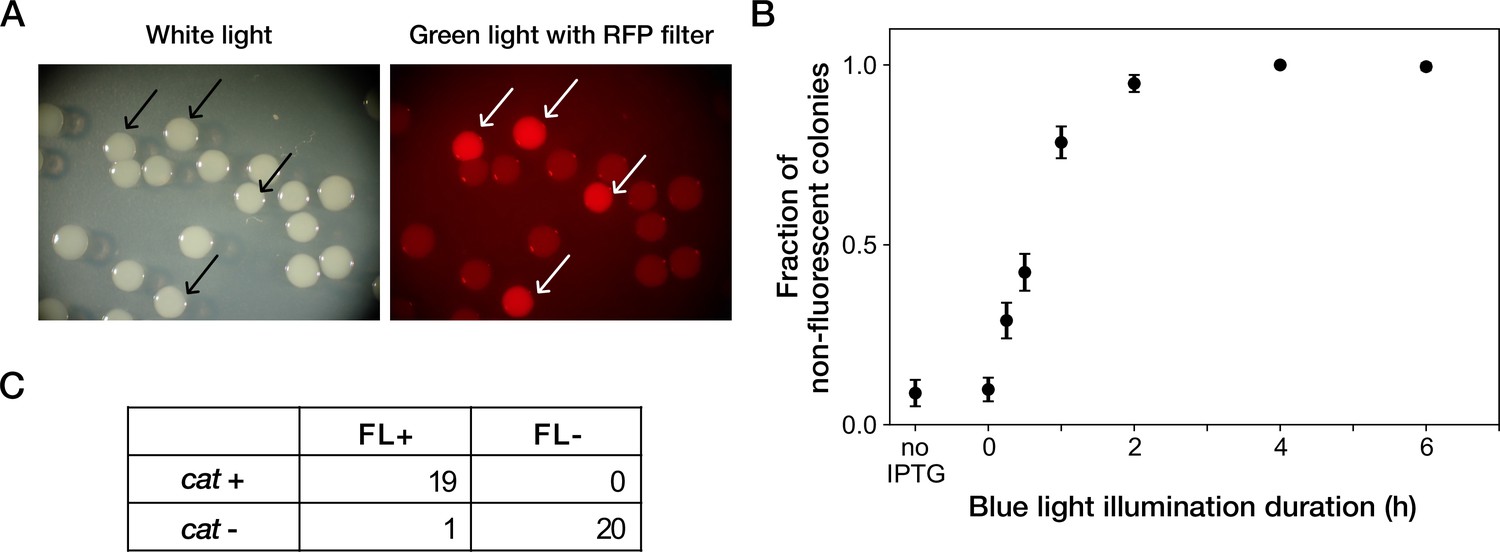
Resistance gene deletion by blue-light illumination in batch cultures.
(A) Colonies of YK0083 cells inoculated after blue-light illumination. The YK0083 cells were exposed to blue light for 1 hr in batch culture and spread on agar. The colonies were photographed under the exposure of ambient light (left) and excitation light (right). The colonies of the cells retaining the mcherry-cat gene were visually detectable under the excitation light (arrows). (B) Relationship between blue-light illumination duration and fractions of non-fluorescent colonies. Black points represent the means. Error bars represent standard errors ( = 239 for no IPTG; = 327 for 0 hr; = 335 for 0.25 hr; = 373 for 0.5 hr; = 344 for 1 hr; = 350 for 2 hr; = 296 for 4 hr; = 209 for 6 hr). ‘no IPTG’ represents the condition where the cells were cultured in the M9 medium without IPTG and not exposed to blue light. (C) The correspondence between mCherry-CAT fluorescence and presence of the cat resistance gene. FL +and FL- represent the presence/absence of mCherry fluorescence visually inspected for the colonies. cat +and cat- represent the presence/absence of the cat gene detected by colony PCR. All non-fluorescent colonies had lost the cat gene. All but one fluorescent colony retained the cat gene.
Figure 2 with 1 supplement

MIC tests.
Gray points represent the OD600 of the indicated strains after a 23 hr incubation period in the M9 media containing the corresponding concentrations of Cp. The minimum concentration where OD600 became lower than 0.01 was adopted as the MIC for each strain. A total of 15 µg/mL of Cp was used in the time-lapse experiments (dashed line). The measurements were repeated at least thrice.
Figure 2—figure supplement 1
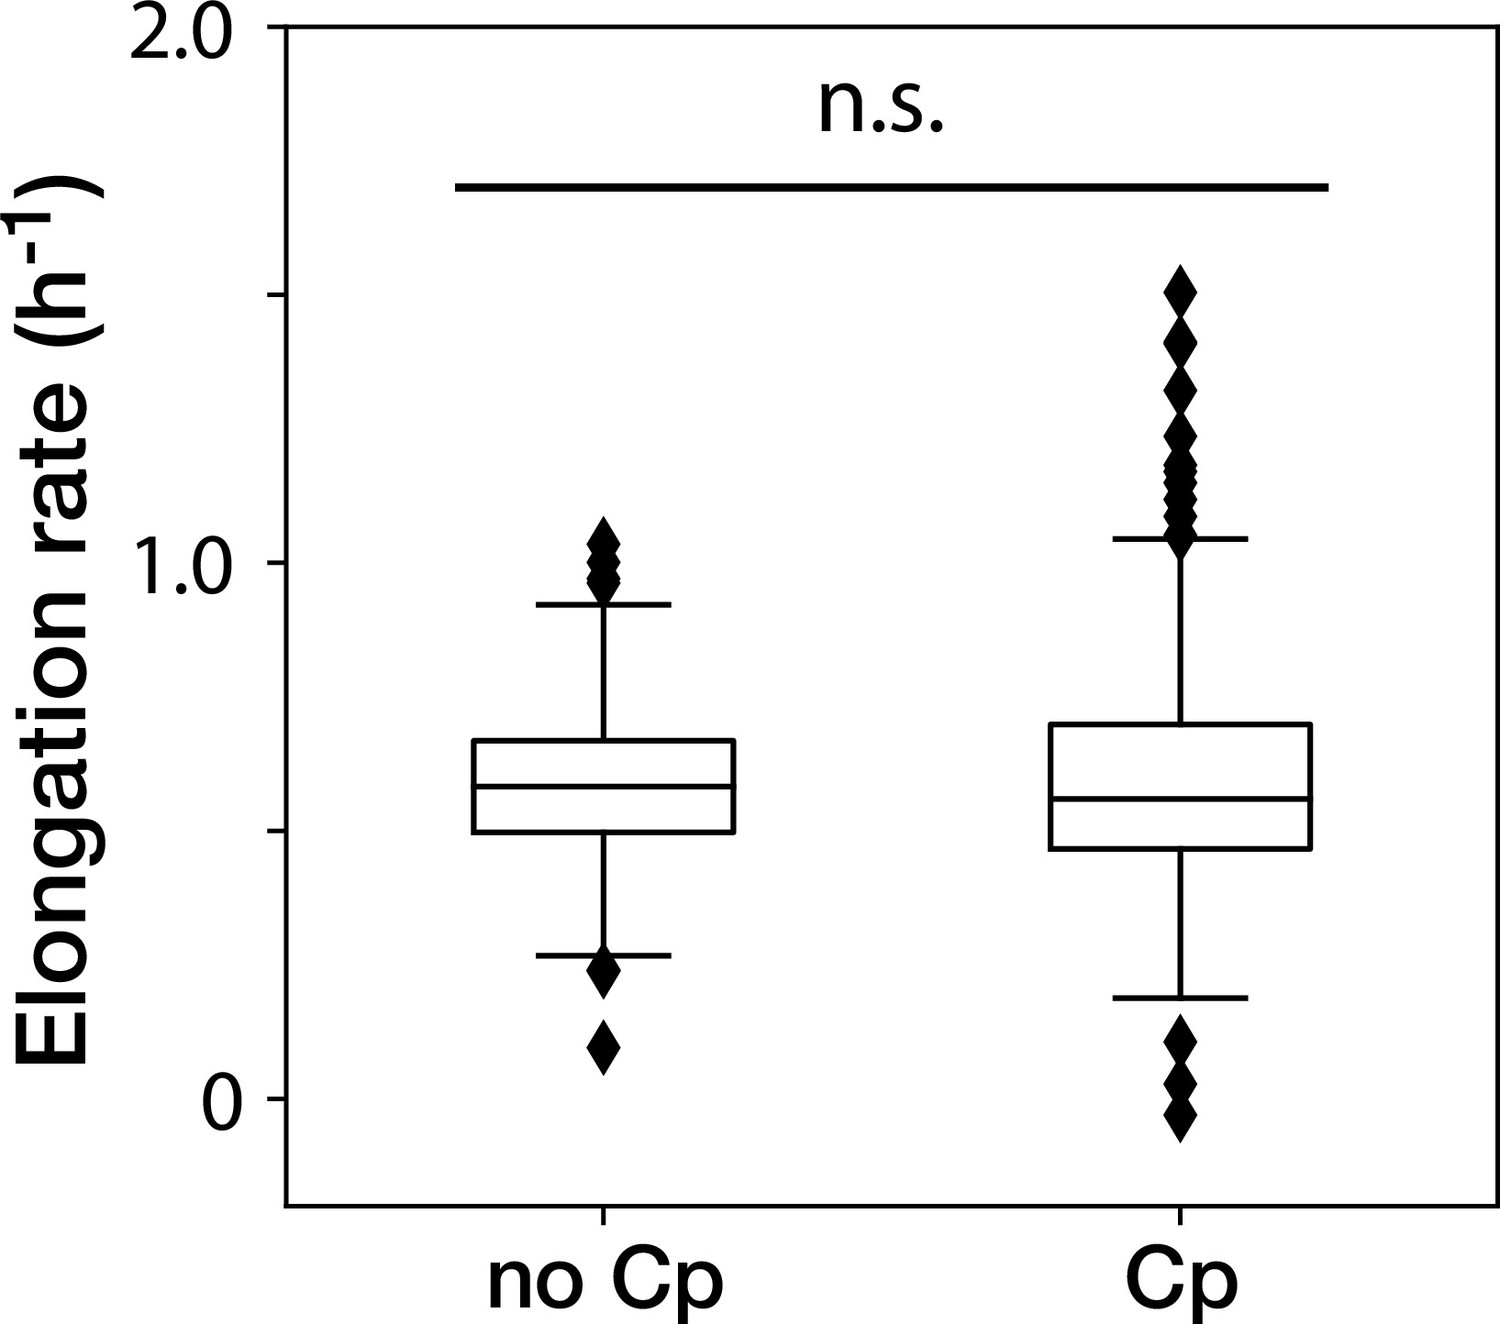
The Cp concentration used in the time-lapse measurements caused no significant effect on the growth of non-deleted YK0083 cells.
Box plots show the elongation rates of the YK0083 cells growing in the mother machine. ‘no Cp’ denotes the drug-free condition; ‘Cp’ denotes the condition under the exposure of 15 µg/mL of Cp. The elongation rates were obtained from the non-deleted cell lineages up to 10 generations after blue-light illumination. We detected no significant differences in elongation rates between the two conditions (p = 0.63, Welch’s -test).
Figure 3 with 5 supplements
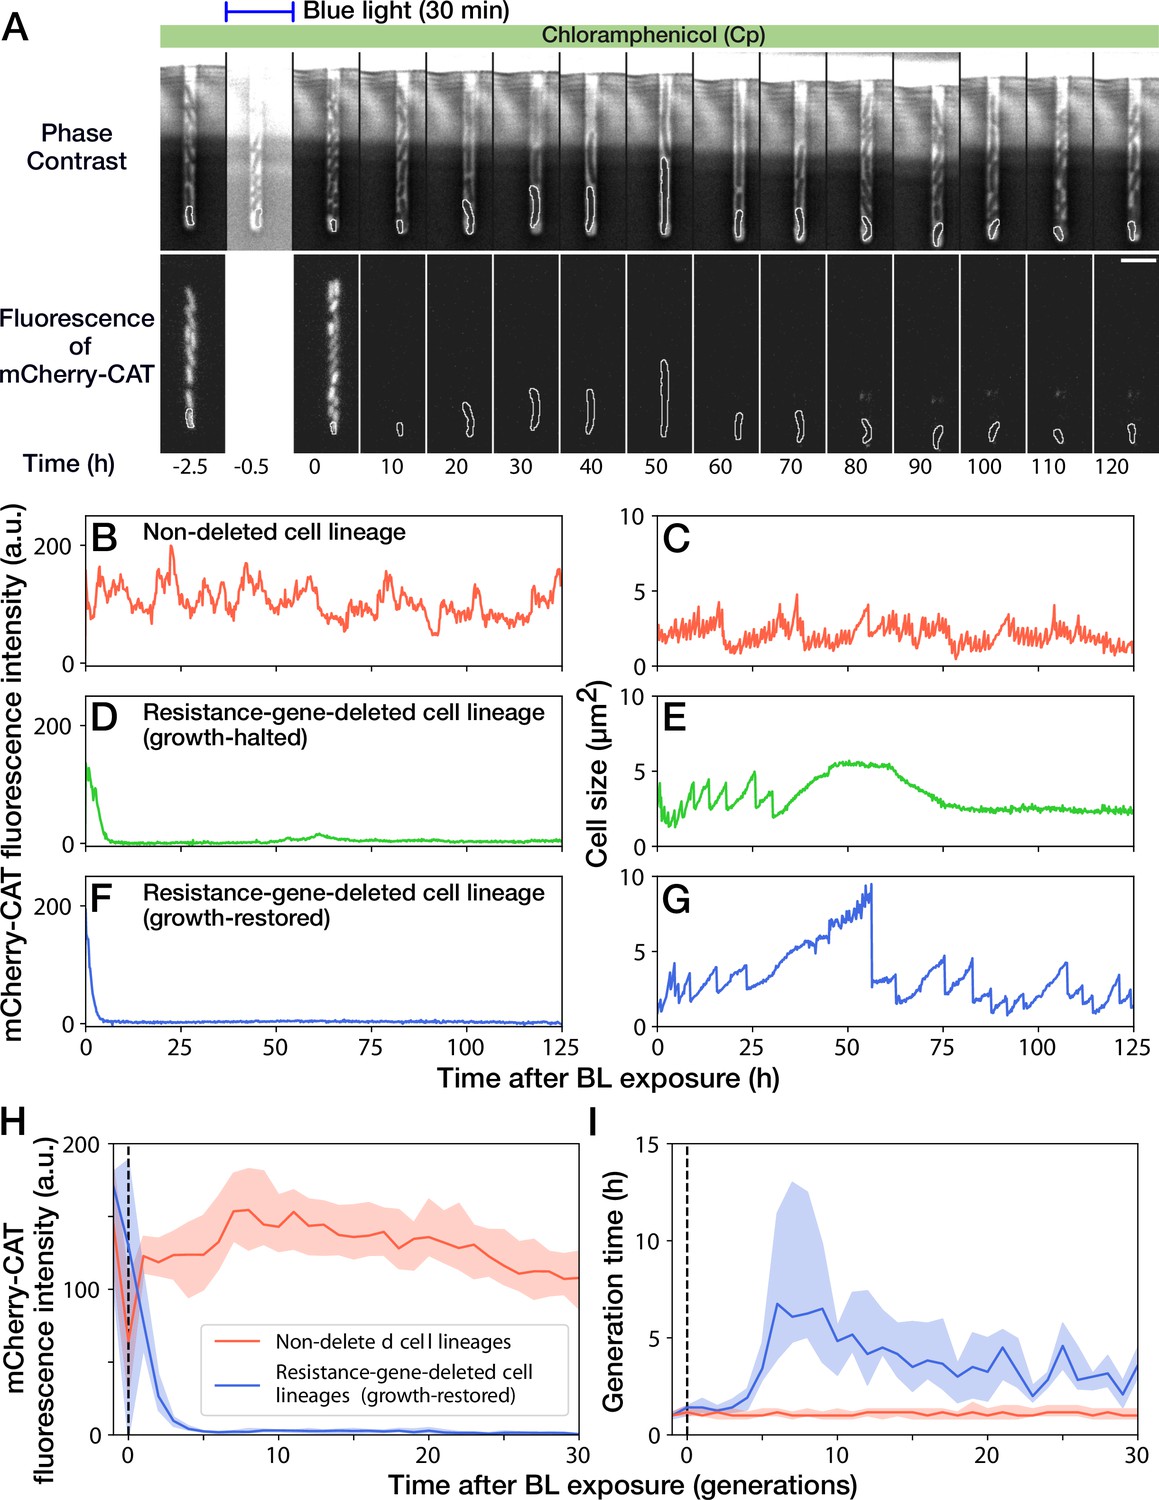
Growth continuation under Cp exposure against cat gene deletion.
(A) Time-lapse images of a cell lineage that continued growth and division against mcherry-cat gene deletion. The upper and lower sequences show phase contrast and mCherry fluorescence images, respectively. Blue light was illuminated from = -0.5 h to 0 hr. The cells at the closed end of the growth channel were monitored during the experiment, which are outlined in white on the images. Scale bar, 5 µm. (B–G) The transitions of mCherry-CAT fluorescence intensities and cell size in single-cell lineages. (B, C) Non-deleted cell lineage. (D, E) Growth-halted resistance-gene-deleted cell lineage. The decrease in cell size after 60 hr was due to the shrinkage of the cell body. (F, G) Growth-restored resistance-gene-deleted cell lineage. (H, I) The transitions of mCherry-CAT fluorescence intensities (H) and generation time (I). The lines and shaded areas represent the medians and the 25–75% ranges, respectively. Red represents non-deleted cell lineages. Blue represents growth-restored resistance-gene-deleted cell lineages. The transitions are shown in generations.
Figure 3—figure supplement 1
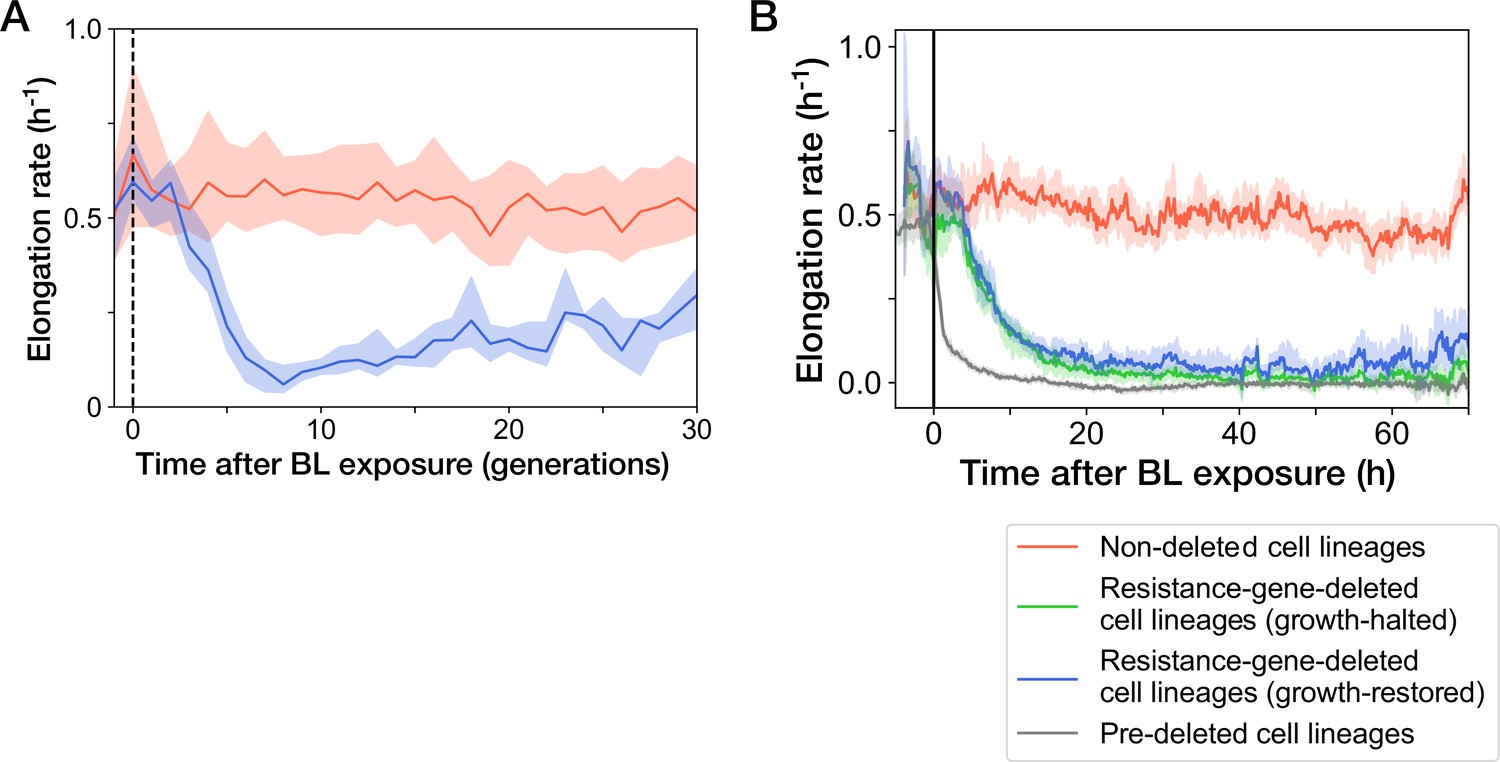
Transitions of elongation rates after blue-light illumination.
The YK0083 cells were exposed to blue light for 30 min from = -0.5 hr to 0 hr. (A) Transitions of elongation rates of resistance-gene-deleted YK0083 cell lineages in generations. The lines and shaded areas represent the medians and the 25–75% data ranges, respectively. (B) Transitions of elongation rates in hours after blue-light illumination. The lines represent the medians of elongation rate at each time point. The shaded areas show the 95% error ranges of the median estimated by resampling the cell lineages 1000 times. Red represents the non-deleted cell lineages. Blue represents the growth-restored resistance-gene-deleted cell lineages. Green represents the growth-halted resistance-gene-deleted cell lineages. Gray represents the pre-deleted YK0085 cell lineages.
Figure 3—figure supplement 2
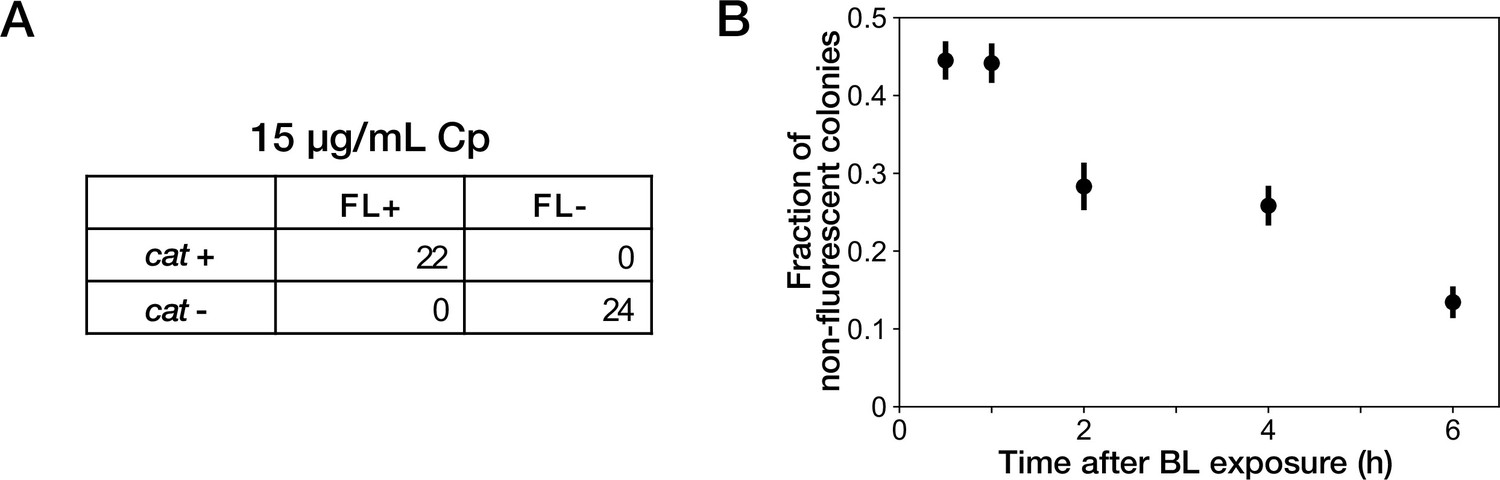
Resistance gene deletion in batch cultures under Cp exposure.
(A) The correspondence between mCherry-CAT fluorescence and presence of the cat resistance gene. Deletions of resistance gene were induced under exposure to 15 µg/mL of Cp. FL +and FL- represent the presence/absence of mCherry fluorescence visually inspected for the colonies. cat +and cat- represent the presence/absence of the cat gene detected by colony PCR. All non-fluorescent colonies had lost the cat gene. All fluorescent colonies retained the cat gene. (B) Competition between resistance-gene-deleted and non-deleted cells under Cp exposure. Batch cultures of YK0083 cells were illuminated by blue light for 30 min, and the fractions of resistance-gene-deleted cells were quantified by the proportions of non-fluorescence colonies in the cultures sampled at several time points after blue-light illumination. Black points represent the means. Error bars represent standard errors ( = 409 for 0.5 hr; = 385 for 1 hr; = 219 for 2 hr; = 298 for 4 hr; = 283 for 6 hr).
Figure 3—figure supplement 3
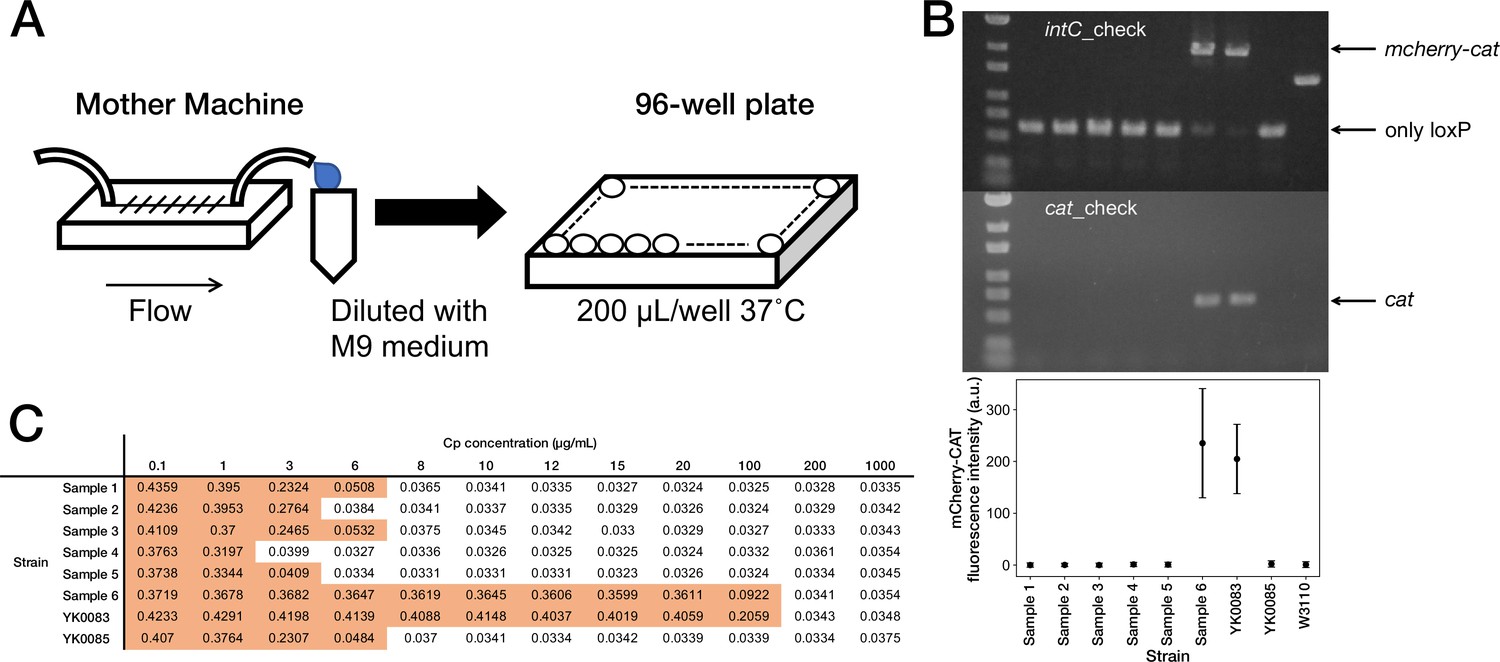
Correspondence between fluorescence loss and mcherry-cat gene deletion in the cells sampled from the mother machine.
(A) The scheme for acquiring the resistance-gene-deleted cells from the mother machine. The culture media flowing out from the mother machine were sampled to obtain the cells that lost the mcherry-cat gene. The media were diluted serially, and the limited-diluted media were taken in 96-well plates and incubated. (B) Correspondence between fluorescence loss and gene deletion. The cell populations were collected from the 96-well plates, and the deletion of mcherry-cat gene was examined by PCR. We detected no bands of both mcherry-cat and cat for Samples 1–5. Sample 6 retained the mcherry-cat gene. The bottom plot shows that the absence of mcherry-cat gene corresponds to the loss of mCherry-CAT fluorescence. (C) MIC test. The OD600 values of Samples 1–6, YK0083 and YK0085 after a 23 hr incubation period at the indicated Cp concentrations are shown (Start OD600, 0.001). The entries with colored backgrounds indicate OD600>0.04.
Figure 3—figure supplement 4
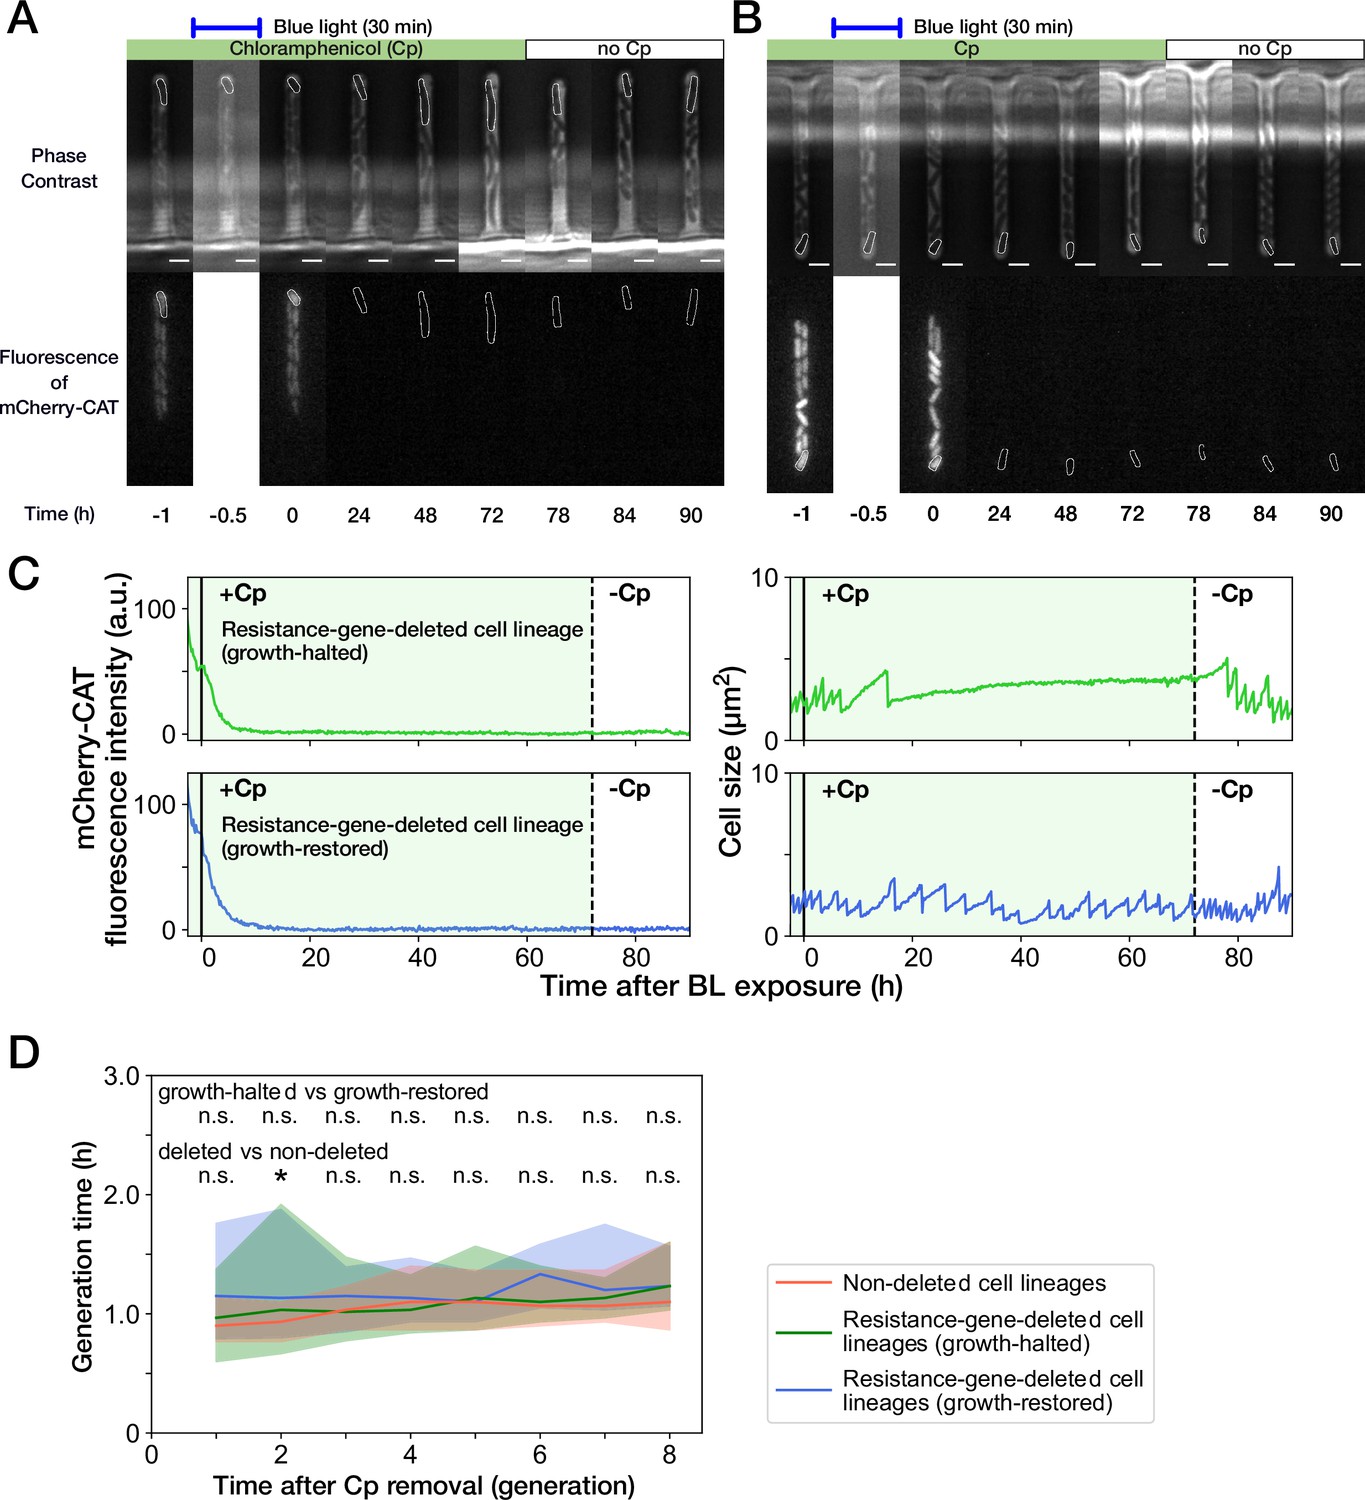
Growth recovery of resistance-gene-deleted cell lineages after Cp removal.
(A,B) Representative time-lapse images of cell lineages that lost mcherry-cat resistance gene. (A) For growth-halted cell lineages; (B) for growth-restored cell lineages. The upper and lower sequences show phase contrast and mCherry fluorescence images, respectively. Blue light was illuminated from t = -0.5 hr to 0 hr. Cp was removed at t = 72 hr. The cells at the closed end of the growth channel were monitored during the experiment, which are outlined in white on the images. Scale bars, 2.5 µm. (C) Transitions of mCherry-CAT fluorescence intensities and cell size in single-cell lineages. The upper plots show the transitions in a growth-halted resistance-gene-deleted cell lineage; the lower plots show those of a growth-restored resistance-gene-deleted cell lineage. The solid black lines represent the end time of blue light illumination. The dashed black lines represent the time of Cp removal. (D) Transition of generation time after Cp removal. The lines and shaded areas represent the medians and the 25–75% ranges, respectively. The transitions are shown in generations after first cell divisions. Red, blue, and green represent non-deleted cell lineages, growth-restored resistance-gene-deleted cell lineages, and growth-halted resistance-gene-deleted cell lineages, respectively. The p-values of Mann-Whitney test were 0.11, 0.31, 0.45, 0.089, 0.50, 0.012, 0.038, and 0.27 for growth-halted vs growth-restored cell lineages for the generations from 1st to 8th, respectively. Also, the p-values were 0.057, 0.0070, 0.23, 0.48, 0.17, 0.032, 0.14, and 0.063 for resistance-gene-deleted vs non-deleted cell lineages. The p-values below 0.01 were assumed significant and indicated by asterisk.
Figure 3—figure supplement 5
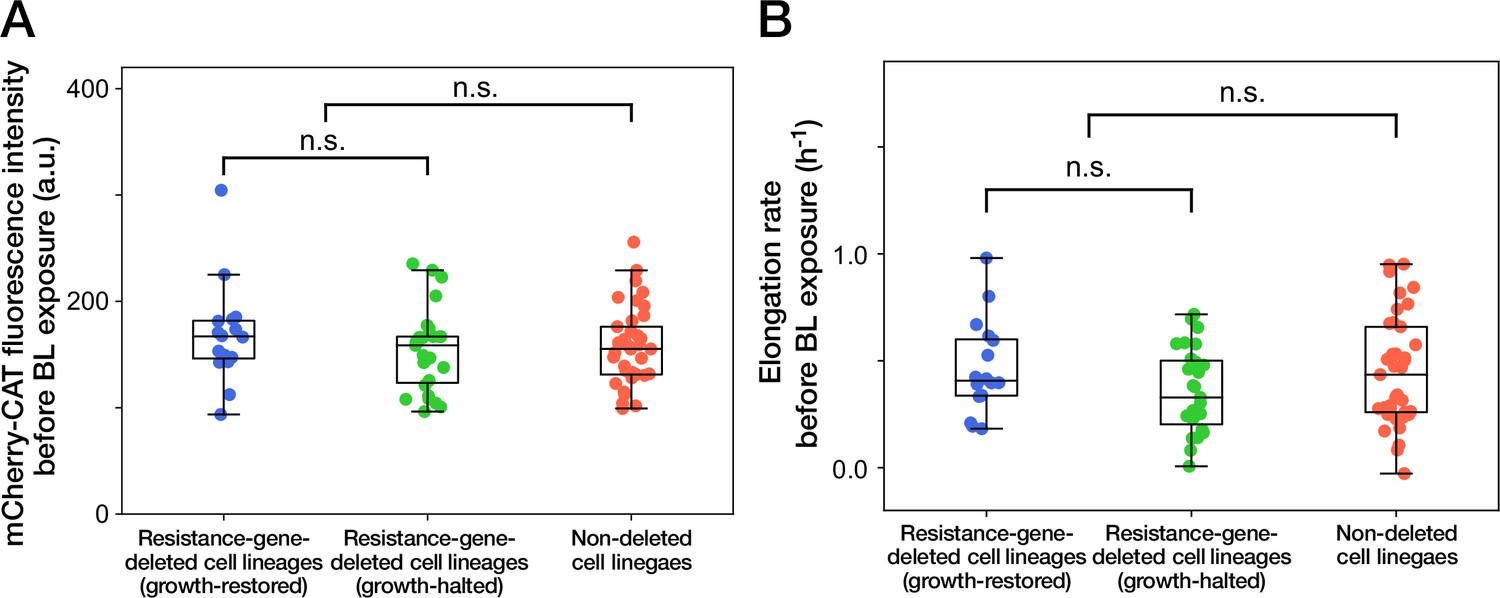
Cellular phenotypes before blue-light illumination do not correlate with the cellular fates.
(A) mCherry-CAT fluorescence before blue-light illumination. Each point represents the fluorescence intensity of single-cell lineage averaged over the 1 hr period immediately before blue-light illumination. Blue points represent the growth-restored resistance-gene-deleted cell lineages. Green points represent the growth-halted resistance-gene-deleted cell lineages. Red points represent the non-deleted cell lineages. p = 0.30 for growth-restored resistance-gene-deleted cell lineages vs growth-halted resistance-gene-deleted cell lineages; p = 0.85 for resistance-gene-deleted cell lineages vs non-deleted cell lineages, Welch’s t-test. (B) Elongation rates before blue-light illumination. Each point represents the elongation rate of single-cell lineage averaged over the 1 h period immediately before blue-light illumination. The color correspondence remains the same as A. p = 0.12 for growth-restored resistance-gene-deleted cell lineages vs growth-halted resistance-gene-deleted cell lineages; p = 0.35 for resistance-gene-deleted cell lineages vs non-deleted cell lineages, Welch’s t-test.
Figure 4
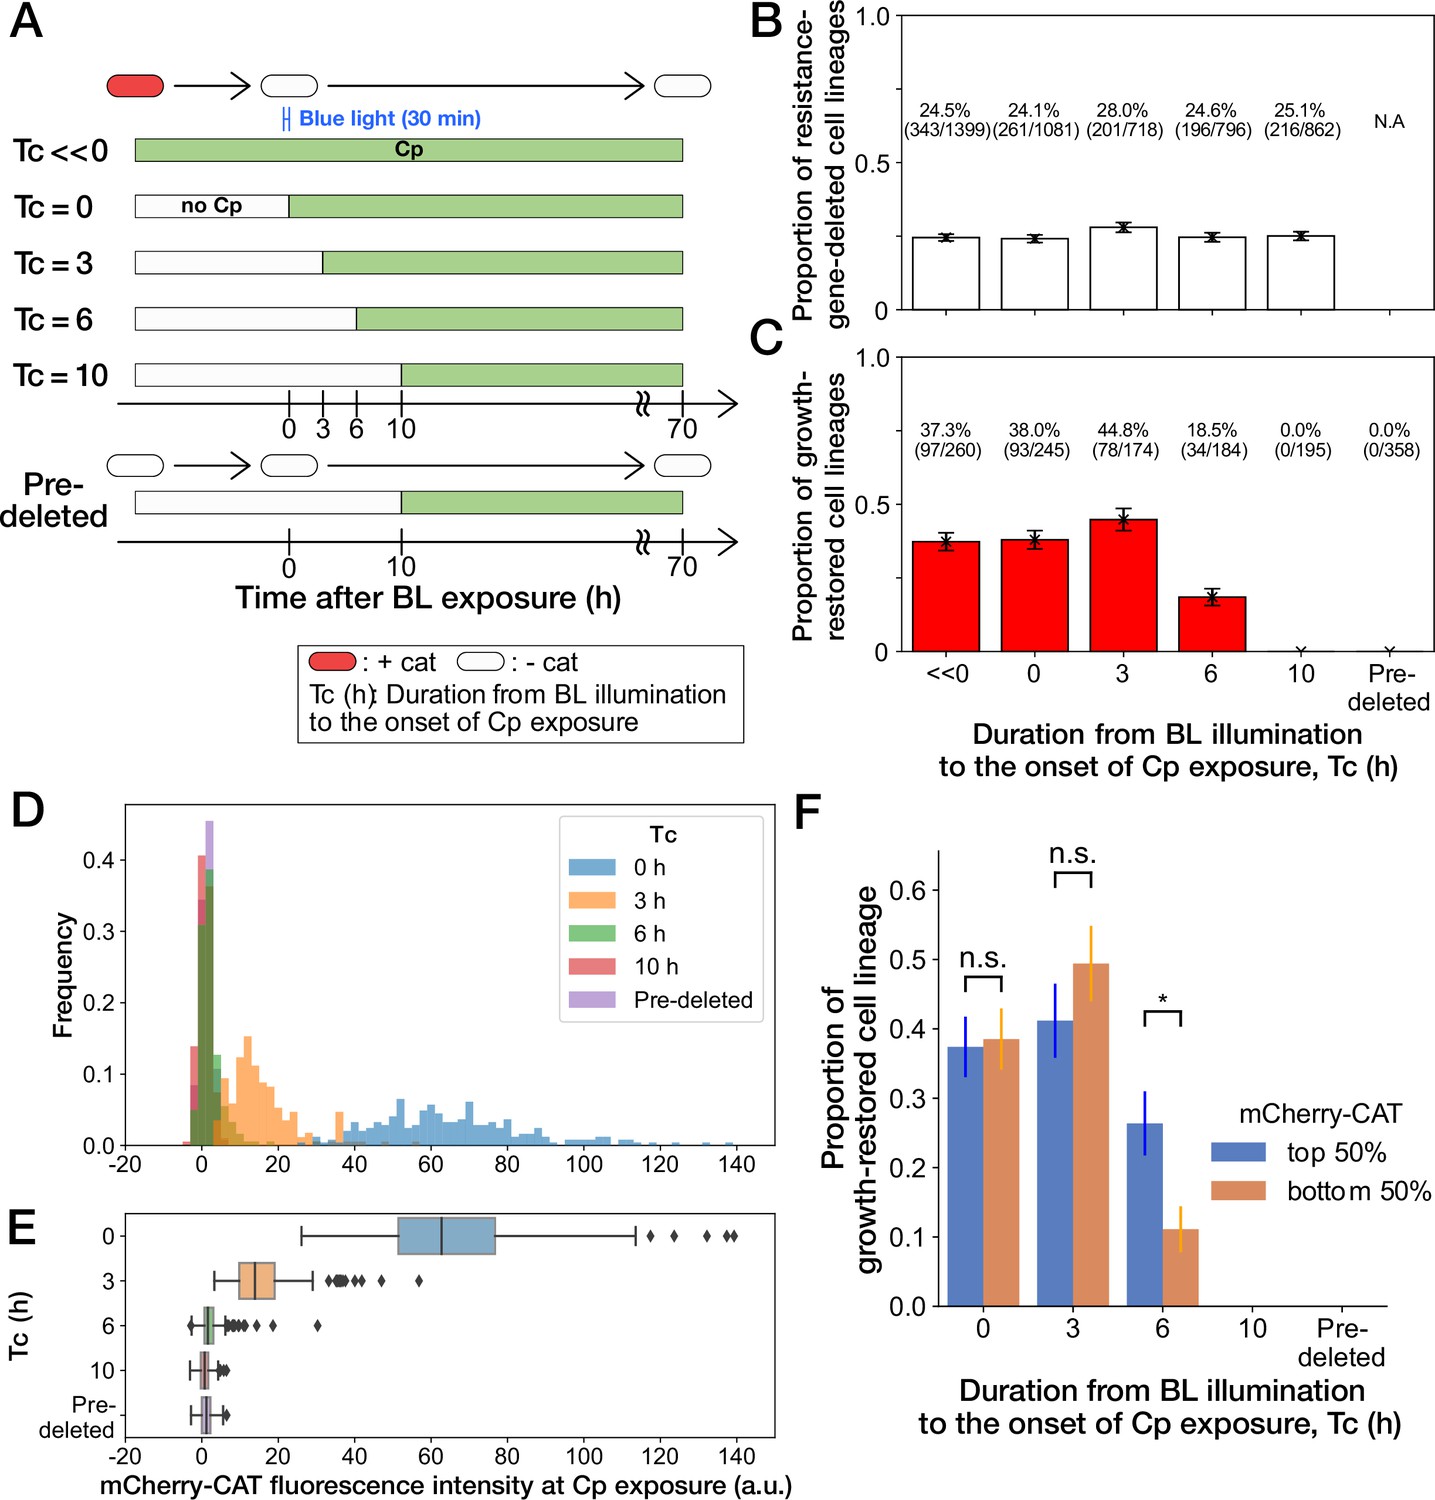
History-dependent maintenance of Cp resistance.
(A) The schematic diagram of experiments. The duration from the end of blue-light illumination to the onset of Cp exposure () was varied from 0 to 10 h. represents the continuous Cp-exposure condition. “Pre-deleted” denotes the results of the experiments performed with the mcherry-cat-deleted YK0085 strain. The non-resistant YK0085 cells were not exposed to blue light. (B) Fractions of mcherry-cat-deleted cell lineages across different conditions. The numbers of resistance-gene-deleted cell lineages among the total numbers of cell lineages observed during the measurements are shown above the bars. Error bars represent standard errors. (C) Fractions of growth-restored cell lineages among resistance-gene-deleted cell lineages. The numbers of growth-restored cell lineages among all the resistance-gene-deleted cell lineages are shown above the bars. Error bars represent standard errors. The numbers of resistance-gene-deleted cell lineages are different from those in B because some cell lineages were flushed away from the growth channels at the later time points of the measurements, and their fates could not be determined. (D, E) The distributions of the mCherry-CAT fluorescence intensities at the onset of Cp exposure across the different conditions represented by histograms (D) and box plots (E). (F) Fractions of growth-restored cell lineages and their dependence on the mCherry-CAT fluorescence at the onset of Cp exposure. Blue and orange bars indicate the fractions of growth-restored cells among cell lineages whose mCherry-CAT fluorescence intensities were higher and lower than the median, respectively. Error bars represent standard errors. The growth-restored cell lineages were not detected under the = 10 h and “Pre-deleted” conditions. Fractional differences between the top 50% and the bottom 50% of cell lineages were statistically significant only for the = 6 h condition (p = 0.86 for = 0 hr; p = 0.28 for = 3 hr; and p = 8.6 × 10⁻³ for = 6 hr, two proportional z-test).
Figure 5 with 5 supplements
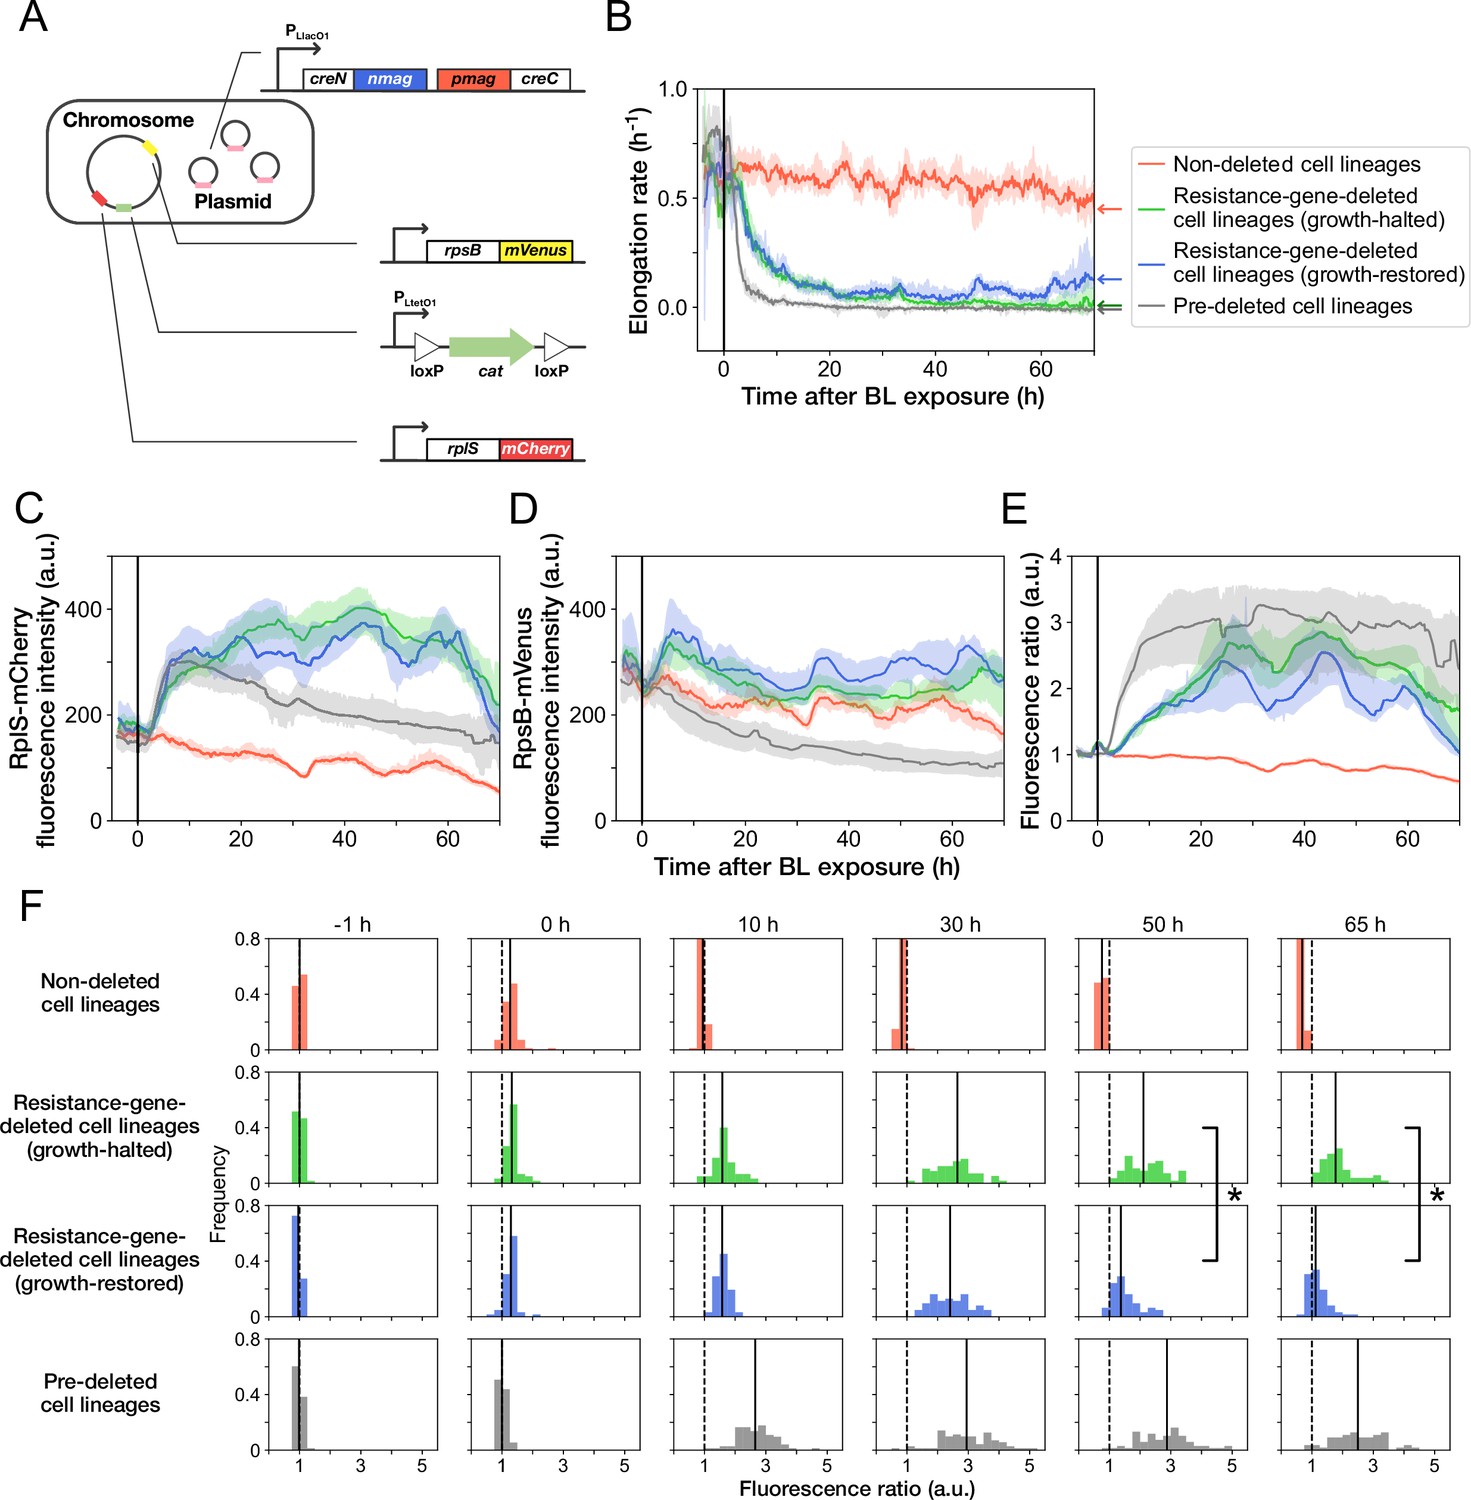
Disruption and restoration of ribosomal proteins’ stoichiometry.
(A) Schematic diagram of the ribosome reporter strain, YK0136. Fluorescently tagged ribosomal protein genes (rplS and rpsB) are expressed from the native loci on the chromosomes. Additionally, the photo-removable cat gene was integrated into the intC locus on the chromosome. The PA-Cre fragments were expressed via low-copy plasmids. (B) Transitions of elongation rates. Lines represent the medians of elongation rates at each time point, and shaded areas show the 95% error ranges of the medians estimated by resampling the cell lineages 1000 times. Red represents non-deleted cell lineages. Green shows growth-halted resistance-gene-deleted cell lineages. Blue represents growth-restored resistance-gene-deleted cell lineages. Gray represents pre-deleted cell lineages. Color correspondence remains the same in the following figures. The end of blue-light illumination was set to 0 hr on the horizontal axis. (C–E) Transitions of RplS-mCherry fluorescence intensities (C), RpsB-mVenus fluorescence intensities (D), and the fluorescence ratio of RplS-mCherry/RpsB-mVenus (E). The fluorescence intensities of RplS-mCherry and RpsB-mVenus were normalized by the intensity observed before blue light illumination to calculate the ratio in E. (F) Transitions of the RplS-mCherry/RpsB-mVenus fluorescence ratio distributions. The vertical dashed lines represent the position of ratio = 1; the solid lines represent the medians of the distributions. Significant differences in fluorescence ratio were detected between the growth-restored and growth-halted cell lineages at 50 hr and 65 hr (p = 5.6 × 10 –10 at 50 hr, p = 1.9 × 10 –13 at 65 hr, Mann-Whitney U test).
Figure 5—figure supplement 1
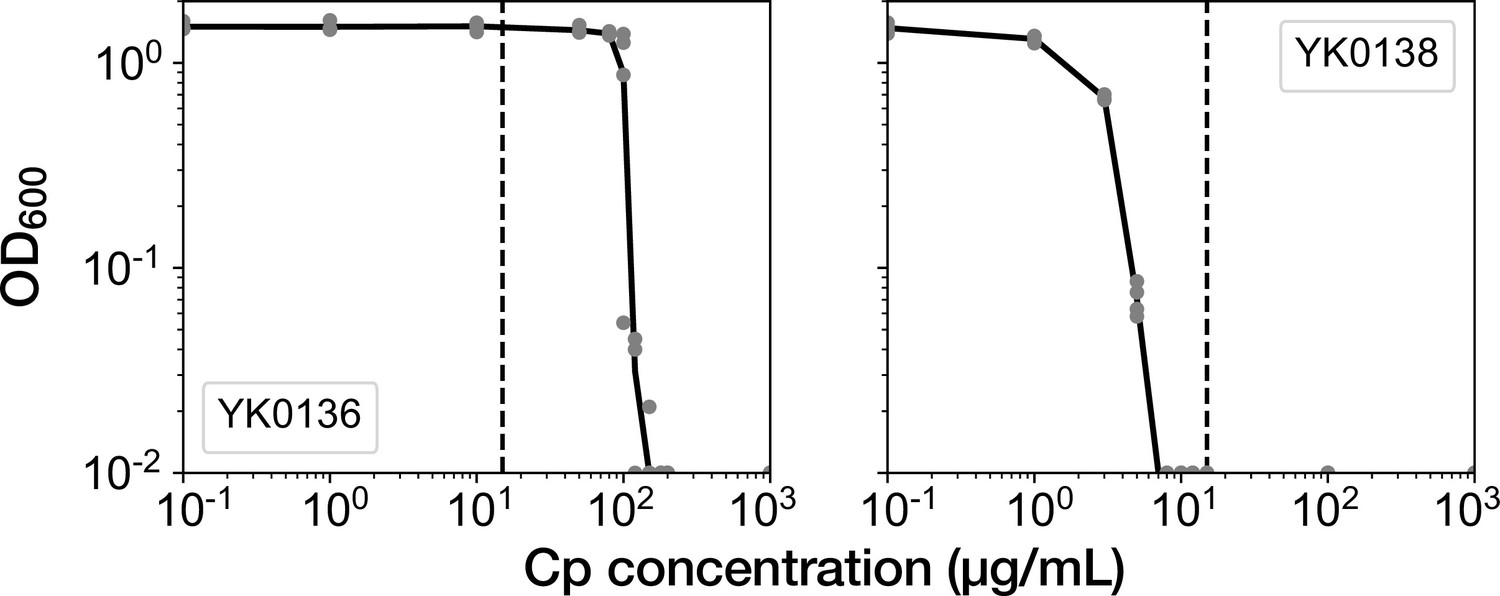
MIC tests of the ribosome reporter strains.
Gray points indicate the OD600 of the cell cultures after a 23 hr incubation period in the media containing the corresponding concentrations of Cp. The left shows the result of YK0136. The right shows the result of YK0138. The minimum concentration where OD600 became lower than 0.01 was adopted as the MIC for each strain. 15 µg/mL of Cp was used in the experiments (dashed line). The measurements were repeated at least thrice.
Figure 5—figure supplement 2
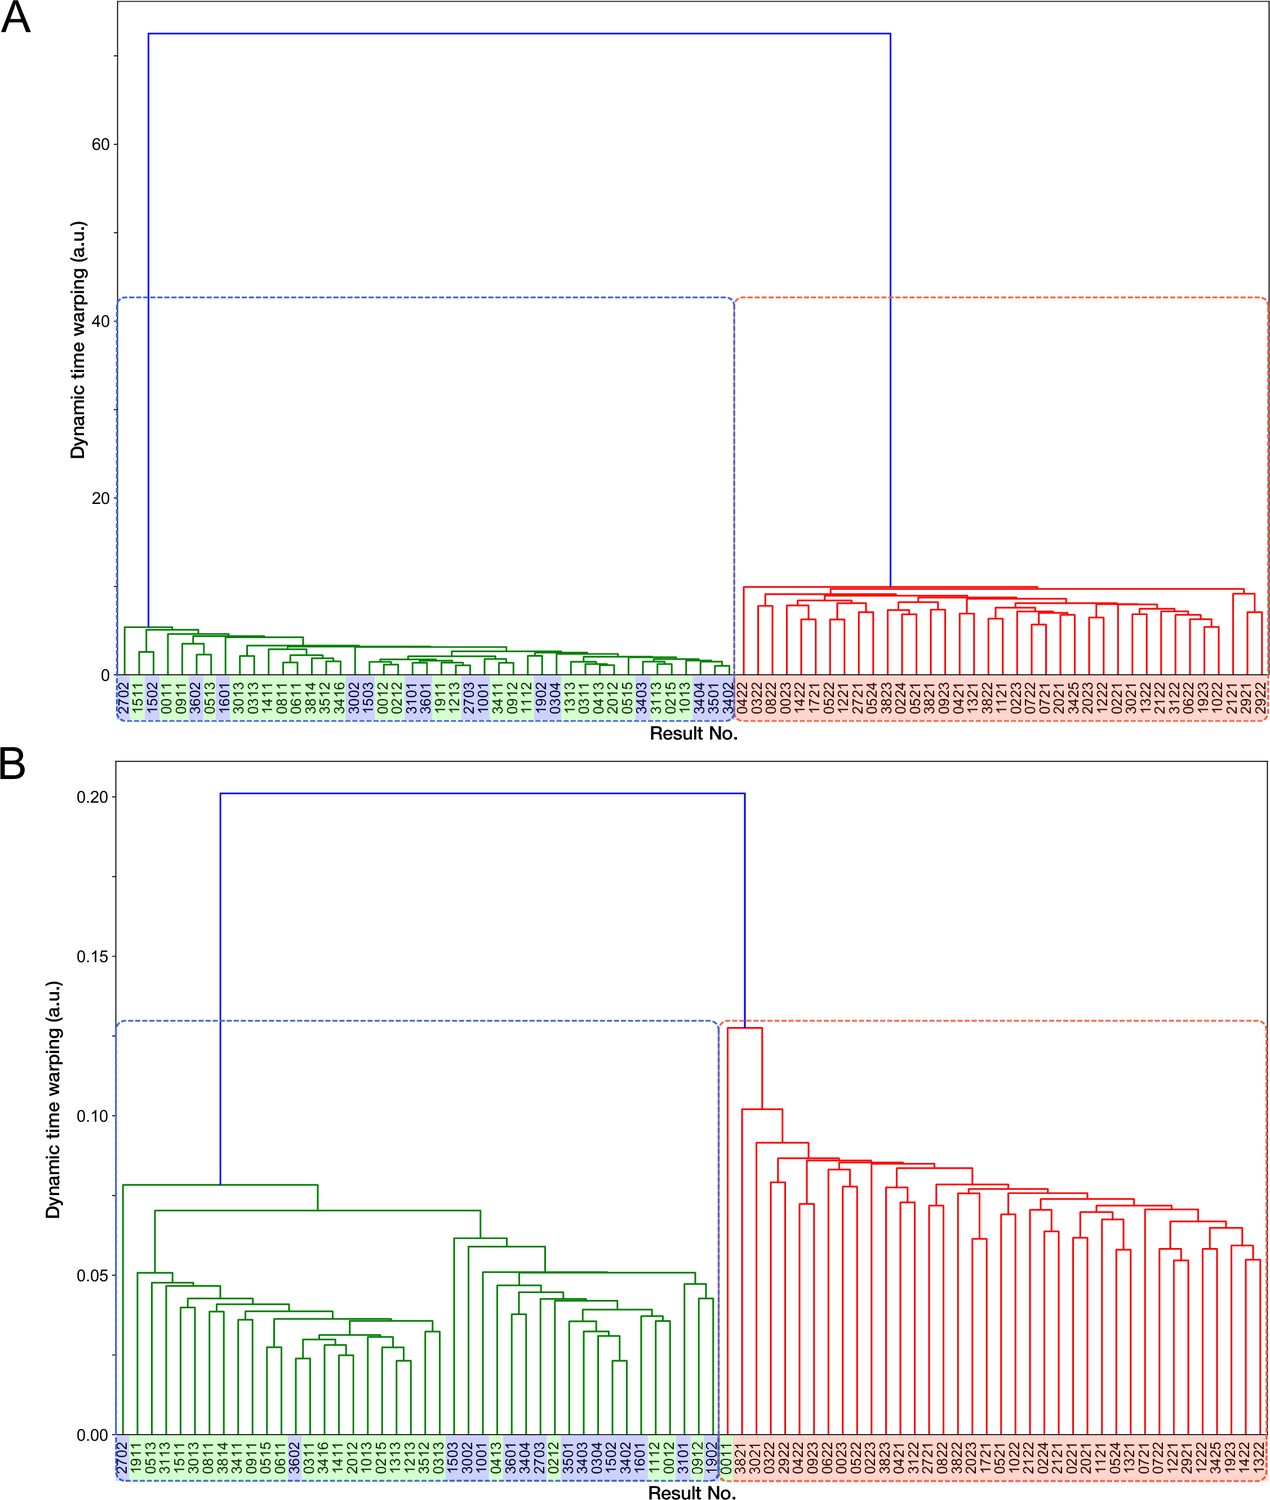
Time-course transitions of elongation rates are sufficient for classifying resistance-gene-deleted and non-deleted cell lineages.
(A) Hierarchical clustering of single-cell lineages based on the transitions of mCherry-CAT fluorescence intensities. The mCherry-CAT fluorescence transitions in single-cell lineages over the entire periods of measurement were used for clustering. The distances between cell lineages were calculated by dynamic time warping. The numbers shown on the horizontal axis represent cell lineage IDs. The background colors behind the cell lineage IDs represent the fates of cell lineages assigned manually by the experimenters: Blue corresponds to growth-restored resistance-gene-deleted cell lineages; Green represents growth-halted resistance-gene-deleted cell lineages; Red represents non-deleted cell lineages. (B) Hierarchical clustering of single-cell lineages based on the transitions of elongation rates. The cell lineage clusters indicated by the blue and red dotted lines constitute two main groups, corresponding to resistance-gene-deleted and non-deleted cell lineages, respectively. Only one resistance-gene-deleted cell lineage (0011) was assigned wrongly as a non-deleted cell lineage. Therefore, the transitions of elongation rates are sufficient for classifying the resistance-gene-deleted and non-deleted cell lineages at high precision.
Figure 5—figure supplement 3
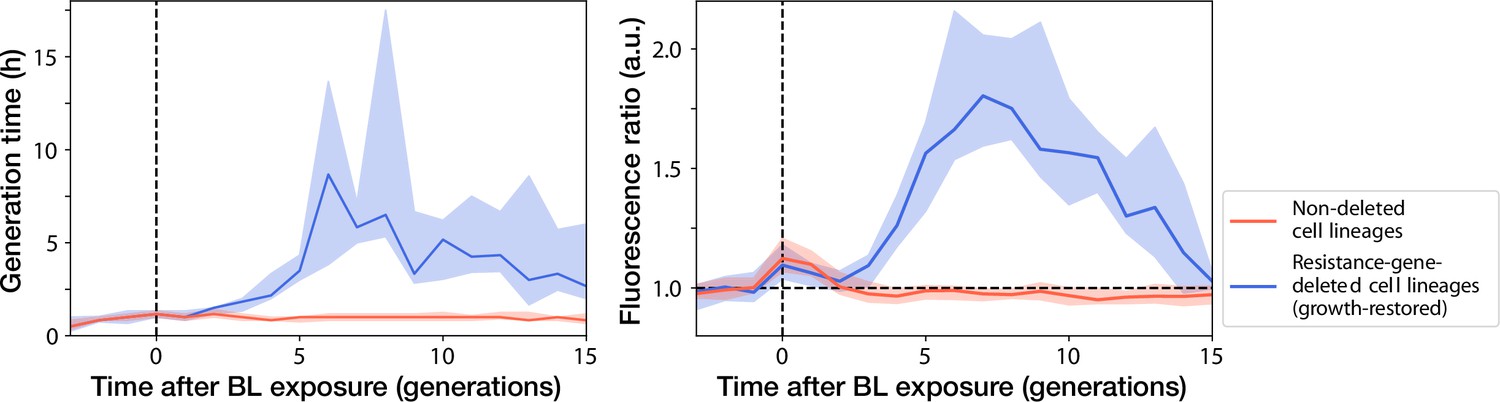
Transitions of generation time and RplS-mCherry/RpsB-mVenus fluorescence ratio observed in ribosome reporter strain shown in generation.
Left: Generation time transitions; Right: RplS-mCherry/RpsB-mVenus fluorescence ratio transitions. The lines and shaded areas represent the medians and the 25%–75% data ranges, respectively. Blue corresponds to growth-restored resistance-gene-deleted cell lineages. Red corresponds to non-deleted cell lineages.
Figure 5—figure supplement 4
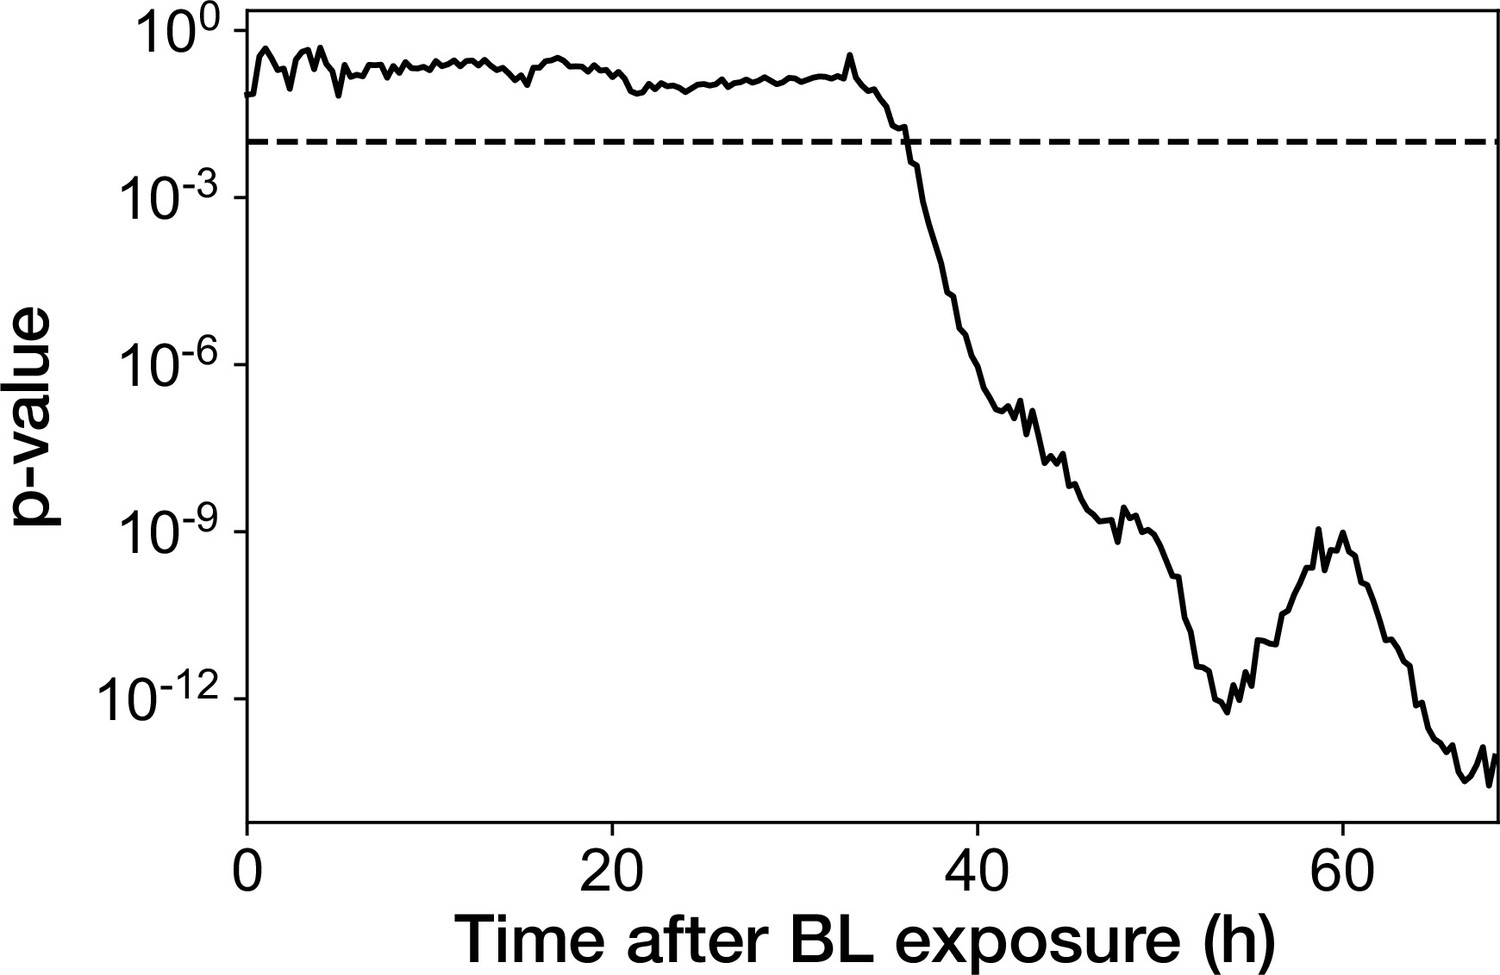
Transition of p-value from the Mann-Whitney U test applied for the RplS-mCherry/RpsB-mVenus fluorescence ratio.
Mann-Whitney U test was performed for the fluorescence ratio between growth-restored resistance-gene-deleted cell lineages and growth-halted resistance-gene-deleted cell lineages at each time point after blue-light illumination. Dashed horizontal line represents the p-value of 0.01.
Figure 5—figure supplement 5
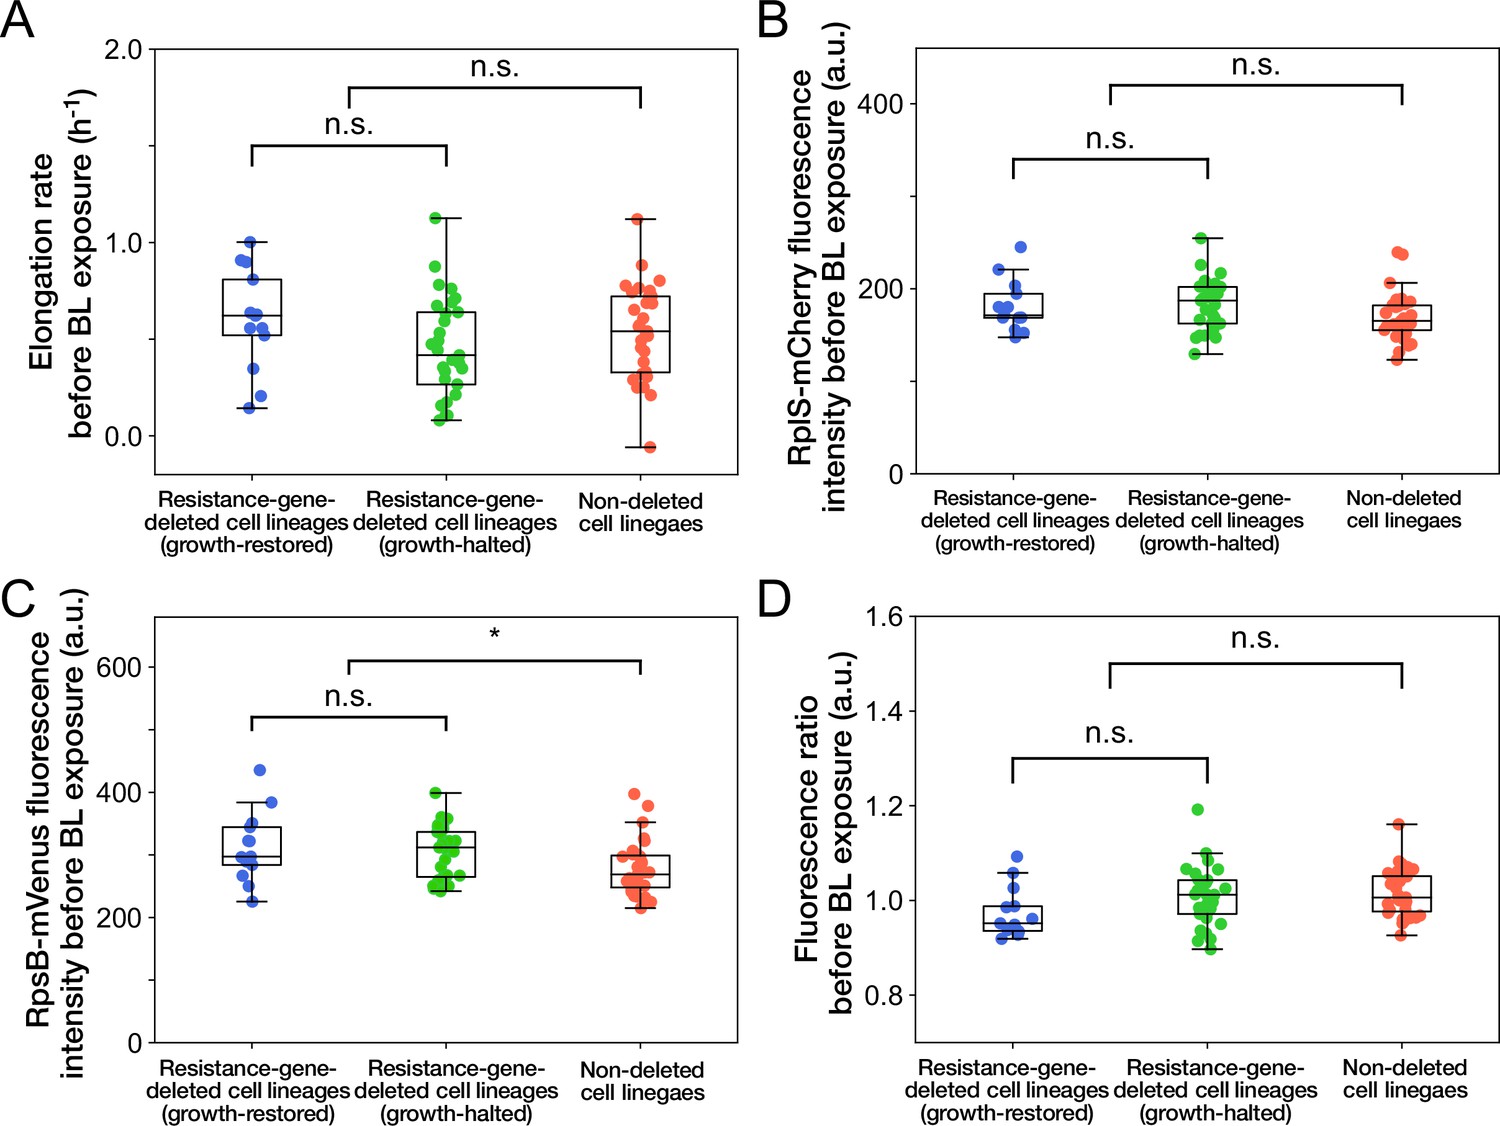
Relationships between cellular phenotypes before blue-light illumination and cellular fates.
(A) Relationship between elongation rates before blue-light illumination and cellular fates. Blue represents growth-restored resistance-gene-deleted cell lineages. Green represents growth-halted resistance-gene-deleted cell lineages. Red represents non-deleted cell lineages (Color correspondence remains the same in the following figures). Each point represents the elongation rate of single-cell lineage averaged over the 1 hr period immediately before blue-light illumination. p = 0.10 for growth-restored vs growth-halted cell lineages; p = 0.54 for resistance-gene-deleted vs non-deleted cell lineages, Welch’s t-test. (B) Relationship between RplS-mCherry fluorescence intensities averaged over the 1 hr period before blue-light illumination and cellular fates. p = 0.87 for growth-restored vs growth-halted cell lineages; p = 0.038 for resistance-gene-deleted vs non-deleted cell lineages, Welch’s t-test. (C) Relationship between RpsB-mVenus fluorescence intensities averaged over the 1 hr period before blue-light illumination and cellular fates. p = 0.60 for growth-restored vs growth-halted cell lineages; p = 0.010 for resistance-gene-deleted vs non-deleted cell lineages, Welch’s t-test. Asterisk denotes the statistical difference judged at the significance level of 0.01. (D) Relationship between RplS-mCherry/RpsB-mVenus fluorescence ratio averaged over the 1 hr period before blue-light illumination and cellular fates. p = 0.098 for growth-restored vs growth-halted cell lineages; p = 0.15 for resistance-gene-deleted vs non-deleted cell lineages, Welch’s t-test.
Figure 6
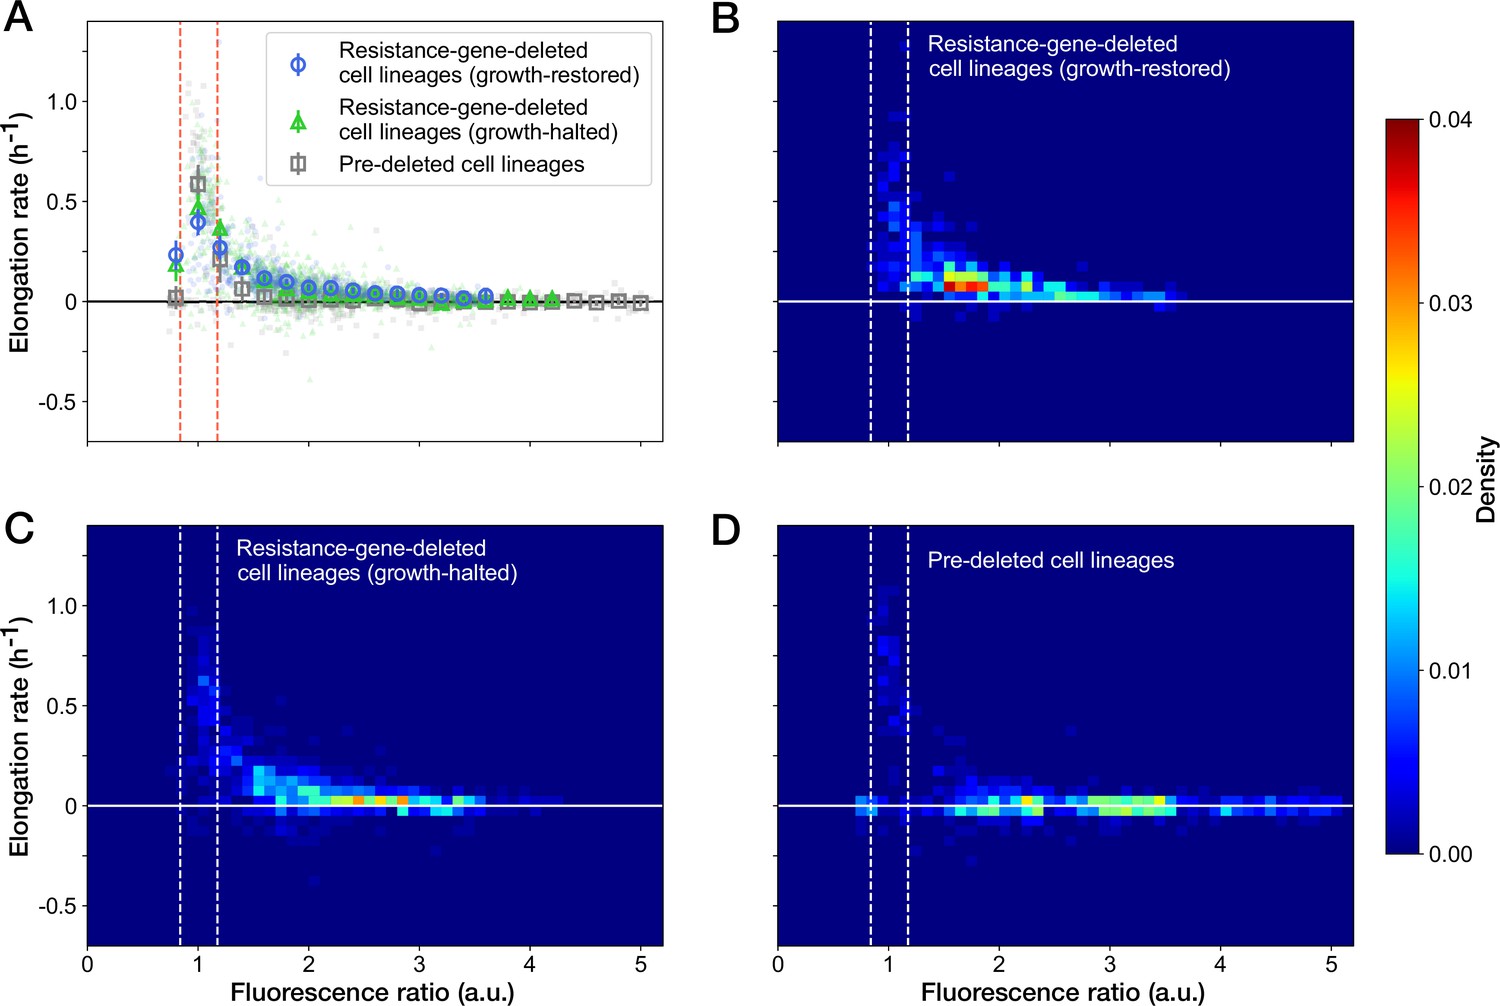
Relationship between the RplS-mCherry/RpsB-mVenus fluorescence ratio and elongation rate under Cp exposure.
(A) Scatter plot of the RplS-mCherry/RpsB-mVenus fluorescence ratio and elongation rate. Small points represent the relations between the fluorescence ratio and elongation rates averaged over the two-hour periods at the different time points on the single-cell lineages. The larger open point represents the mean elongation rate in each bin of fluorescence ratio (bin width, 0.2 a.u.). Error bars represent the 1.96× standard error ranges. Blue represents growth-restored resistance-gene-deleted cell lineages. Green represents growth-halted resistance-gene-deleted cell lineages. Gray represents pre-deleted cell lineages. Dashed lines indicate the mean ± 1.96× standard error range of fluorescence ratio of non-deleted cell lineages before blue-light illumination. (B–D) Density plots of the points for the relationships between fluorescence ratio and elongation rate. (B) Growth-restored resistance-gene-deleted cell lineages. (C) Growth-halted resistance-gene-deleted cell lineages. (D) Pre-deleted cell lineages. Color represents the density of the points for each type of cell lineages shown in (A). Bin size was 0.05 hr-1 for elongation rate and 0.1 a.u. for fluorescence ratio.
Videos
Video 1
Deletion of mcherry-cat gene by blue-light illumination under drug-free conditions.
YK0083 cells were cultured in the mother machine flowing the M9 minimal medium and exposed to blue light from = –30 min to 0 min (marked with ‘ + BL’). The merged images of phase contrast (grayscale) and mCherry-CAT fluorescence (red) channels are shown. The fluorescence of mCherry-CAT was gradually lost after blue-light illumination in this cell lineage. Scale bar, 5 µm.
Video 2
Growth restoration under Cp exposure after resistance gene deletion.
YK0083 cells were cultured in the mother machine flowing the M9 minimal medium containing 15 µg/mL of Cp. Blue light was illuminated from = –30 min to 0 min (marked with ‘ + BL’). The merged images of phase contrast (grayscale) and mCherry-CAT fluorescence (red) channels are shown. The illumination caused the loss of fluorescence signals, that is, the deletion of the mcherry-cat gene, in this cell lineage. Nevertheless, the cell gradually restored growth and division under continuous Cp exposure. Scale bar, 5 µm.
Video 3
Growth recovery of resistance-gene-deleted cells after Cp removal.
Left, growth-halted resistance-gene-deleted cell; Right, Growth-restored resistance-gene-deleted cells. Cp was removed at = 0 min (72 hr after blue light illumination). The merged images of phase contrast (grayscale) and mCherry-CAT fluorescence (red) channels are shown. Scale bar, 5 µm.
Video 4
No growth restoration of YK0085 strain under Cp exposure.
YK0085 cells were cultured in the mother machine flowing the M9 minimal medium and exposed to 15 µg/mL of Cp at = 0 min (marked with ‘ + Cp’). The Cp exposure caused growth arrest, and, unlike the YK0083 cells, the cell did not restore growth. We found no growth-restored cell lineages in this experimental condition. Scale bar, 5 µm.
Video 5
Recovery of the balance of ribosomal proteins alongside growth restoration.
YK0136 cells were cultured in the mother machine flowing the M9 minimal medium containing 15 µg/mL of Cp. Blue light was illuminated from = –30 min to 0 min (marked with ‘ + BL’). The merged images of phase contrast (grayscale), RplS-mCherry fluorescence (red), and RpsB-mVenus fluorescence (green) channels are shown. The growth of the cell markedly slowed down after blue-light illumination, indicating the loss of the cat gene. The cell became red in response to blue-light illumination, indicating that the relative expression level of RplS-mCherry became higher than that of RpsB-mVenus. However, the balance was restored alongside growth restoration. Scale bar, 5 µm.
Video 6
No recovery of the balance of ribosomal proteins in the YK0138 strain.
YK0138 cells were cultured in the mother machine flowing the M9 minimal medium and exposed to 15 µg/mL of Cp at = 0 min (marked with ‘ + Cp’). The Cp exposure caused growth arrest and disruption of ribosomal proteins’ expression balance. No restoration of growth and ribosomal balance was observed. Scale bar, 5 µm.
Tables
Table 1
Mutations detected by whole-genome sequencing.
We obtained isolated cellular populations derived from single or few cells by limiting dilution of the culture media flowing out from the mother machine. We detected only one point mutation in Sample 3.
| Sample no. | Mutation | Position | Base | Annotation |
|---|---|---|---|---|
| Sample 1 | No mutation | |||
| Sample 2 | No mutation | |||
| Sample 3 | Mutation in leuC site | 80,471 | G - > T | A132S |
| Sample 4 | No mutation | |||
| Sample 5 | No mutation |
Key resources table
| Reagent type (species) or resource | Designation | Source or reference | Identifiers | Additional information |
|---|---|---|---|---|
| Strain,strain background (Escherichia coli) | F3 | [31] | W3110 ΔfliC::FRT ΔfimA::FRT Δflu::FRT | |
| Strain,strain background (Escherichia coli) | YK0083 | This study | F3 intC::PLtetO1-loxP-RBS4-mcherry-cat-loxP-FRT/pYK022 | |
| Strain,strain background (Escherichia coli) | MUS6 | This study | F3 rplS-mcherry-FRT rpsB-mvenus-FRT | |
| Strain,strain background (Escherichia coli) | YK0136 | This study | MUS6 intC::PLtetO1-loxP-RBS4-cat-loxP-FRT/pYK022 | |
| Recombinant DNA reagent | pmag-creC | [12] | gifted from Sato lab. | |
| Recombinant DNA reagent | nmag-creN | [12] | gifted from Sato lab. | |
| Recombinant DNA reagent | pYK022 | This study | plasmid expressing PA-Cre genes. | |
| Sequence-based reagent | intC_check_F | This study | PCR primerfor intC check | GATCGATACTTG CTGTGGTTGATG |
| Sequence-based reagent | intC_check_R2 | This study | PCR primerfor intC check | CCTCTTAGTTAAATG GATATAACGAGCCCC |
| Sequence-based reagent | YKp0077 | This study | PCR primerfor cat check | CACCGTTGATA TATCCCAATGGC |
| Sequence-based reagent | YKp0115 | This study | PCR primerfor cat check | CACTCATCG CAGTACTGTTG |
| Commercial assay or kit | Wizard SVGel and PCRClean-Up System | Promega | Cat.# A9281 | |
| Commercial assay or kit | PureYieldPlasmid MiniprepSystem | Promega | Cat.# A1223 | |
| Commercial assay or kit | WizardGenomic DNAPurification Kit | Promega | Cat.# A1120 | |
| Chemical compound, drug | chloramphenicol | Wako | 030-19452 | |
| Chemical compound, drug | isopropyl-β-D-thiogalactopyranoside | Wako | 094-05144 | |
| Chemical compound, drug | Bovine Serum Albumin | Sigma-Aldrich | Cat.# A6003 | |
| Chemical compound, drug | polydimethylsiloxane | Dow Corning | SYLGARD 184 | |
| Software, algorithm | FastDTW | [32] | ||
| Software, algorithm | HyperStackReg | [33] |
Table 2
Strain list used in this study.
| mCherry-CAT deletion | ||
|---|---|---|
| Name | Genotype | Sourse |
| F3 | W3110 ΔfliC::FRT ΔfimA::FRT Δflu::FRT | Hashimoto et al., 2016 |
| YK0080 | F3 intC::PLtetO1-loxP-RBS4-mcherry-cat-loxP-FRT | This study |
| YK0083 | F3 intC::PLtetO1-loxP-RBS4-mcherry-cat-loxP-FRT/pYK022 | This study |
| YK0085 | F3 intC::PLtetO1-FRT/pYK022 | This study |
| Ribosome reporter | ||
| Name | Genotype | Sourse |
| MUS3 | BW25113 rplS-mcherry-FRT-kan-FRT | This study |
| MUS13 | BW25113 rpsB-mvenus-FRT-kan-FRT | This study |
| MUS5 | F3 rplS-mcherry-FRT | This study |
| MUS6 | F3 rplS-mcherry-FRT rpsB-mvenus-FRT | This study |
| YK0134 | MUS6 intC::PLtetO1P-loxP-RBS4-cat-loxP-FRT | This study |
| YK0136 | MUS6 intC::PLtetO1-loxP-RBS4-cat-loxP-FRT/pYK022 | This study |
| YK0138 | MUS6 intC::PLtetO1-loxP-FRT/pYK022 | This study |
Table 3
Plasmid list used in this study.
| Name | Backbone | Gene | Sourse |
|---|---|---|---|
| pKD46 | CGSC | ||
| pCP20 | CGSC | ||
| pcDNA3.1 | pCMV-lox2272-loxP-inversed mvenus-lox2272-loxP | Sato lab | |
| pcDNA3.1 | pCMV-rfp-pmag-creC | Sato lab | |
| pcDNA3.1 | pCMV-rfp-nmag-creN | Sato lab | |
| pTmCherryK3 | pMW118 | PLtetO1 -RBS3-mcherry-FLP-kan-FLP | Wakamoto lab |
| pLVK4 | pMW118 | PLlacO1 -RBS4-mvenus-FLP-kan-FLP | Wakamoto lab |
| pTVCK4 | pMW118 | PLtetO1 -RBS4-mvenus-cat-FLP-kan-FLP | Wakamoto lab |
| pKK1 | pMW118 | PLlacO1-rfp-pmag-creC-FLP-kan-FLP | This study |
| pKK2 | pMW118 | PLlacO1 -rfp-nmag-creN-FLP-kan-FLP | This study |
| pYK001 | pMW118 | PLlacO1-RBS3-pmag-creC-FLP-kan-FLP | This study |
| pYK002 | pMW118 | PLlacO1-RBS3-nmag-creN-FLP-kan-FLP | This study |
| pYK006 | pMW118 | PLtetO1-RBS3-lox2272-mvenus-loxP-FLP-kan-FLP | This study |
| pYK007 | pMW118 | PLtetO1-RBS3-lox2272-mcherry-loxP-FLP-kan-FLP | This study |
| pYK008 | pMW118 | PLtetO1-RBS3-lox2272-mcherry-loxP-FLP-kan-FLP | This study |
| pYK009 | pMW118 | PLtetO1-RBS3-lox2272-mcherry-loxP-FLP-kan-FLP | This study |
| pYK010 | pMW118 | PLtetO1-RBS4-lox2272-mcherry-loxP-FLP-kan-FLP | This study |
| pYK011 | pMW118 | PLtetO1-lox2272-RBS4-mcherry-loxP-FLP-kan-FLP | This study |
| pYK016 | pMW118 | PLlacO1-RBS3-pmag-creC-FLP-kan-FLP | This study |
| pYK017 | pMW118 | PLlacO1-RBS3-creN-nmag-FLP-kan-FLP | This study |
| pYK018 | pMW118 | PLlacO1-RBS3-creN-nmag-pmag-creC-FLP-kan-FLP | This study |
| pYK022 | pMW118 | PLlacO1-RBS3-creN-nmag-pmag-creC-FLP-kan-FLP | This study |
| pYK023 | pMW118 | PLtetO1-loxP-RBS4-mcherry-loxP-FLP-kan-FLP | This study |
| pYK028 | pMW118 | PLtetO1-loxP-RBS4-mcherry-loxP-FLP-kan-FLP | This study |
| pYK029 | pMW118 | PLtetO1-loxP-RBS4-mcherry-cat-loxP-FLP-kan-FLP | This study |
| pYK035 | pMW118 | PLtetO1-loxP-RBS4-cat-loxP-FLP-kan-FLP | This study |
| pMU1 | pMW118 | PLlacO1-RBS4-mcherry-FLP-kan-FLP | This study |
| pMU2 | pMW118 | PLlacO1-RBS4-mvenus-FLP-kan-FLP | This study |
Table 4
Primer list used in this study.
| PA-Cre plasmid construction | ||
|---|---|---|
| Name | Sequence | Usage |
| pLVK_pTVK_F | CAGGCATCAAATAAAACGAAAGGCTCAGTC | For constructing pKK1 and pKK2 plasmids using ExoIII cloning (Li and Evans, 1997). Templates: pLVK3 (pLVK_pTVK_F & pLVK3_pTVK3_R), pCMV-rfp-pmag-creC (L3_TagRFP_F & Crec_Term_R), and pCMV-rfp-nmag-creN (L3_TagRFP_F & nMagCreN-R) |
| pLVK3_pTVK3_R | GGTACCTTTCTCCTCTTTAATGTTTTCGG | |
| L3_TagRFP_F | GGACGCACTGACCGAAAACATTAAAGAG GAGAAAGGTACCATGGTGTCTAAGGGCGAAG | |
| Crec_Term_R | CCAGTCTTTCGACTGAGCCTTTCGTTTT ATTTGATGCCTGTTAGTCCCCATCTTCGAGCAG | |
| nMagCreN-R | TTCGTTTTATTTGATGCCTGTTAGTTCAGCTTGCACCAGG | |
| YKp0001 | ATGCATACTCTTTATGCCCCCGG | For constructing pYK001 and pYK002 plasmids by removing the rfp gene from pKK1 and pKK2. |
| YKp0002 | GGTACCTTTCTCCTCTTTAATG | |
| YKp0053 | AACAGGAAATGGTTCCCTGCTGAACC | For constucting pYK016 plasmid by changing the linker between pmag and creC on pYK001. |
| YKp0054 | GGTACCTTCTGTTTCGCACTGGAATC | |
| YKp0022 | GTGTAGGCTGGAGCTGCTTCG | For constructing pYK017 plasmid using ExoIII cloning. PCR was conducted with the template pYK002 using YKp0022 & YKp0052, YKp0049 & YKp0056 and YKp0055 & YKp0057 to change the order of nmag and creN. |
| YKp0049 | AAGAGGAGAAAGGTACCATGACCTCTGATGAAGTCAGG | |
| YKp0052 | CATGGTACCTTTCTCC | |
| YKp0055 | CATACTCTTTATGCCCCCGGTGG | |
| YKp0056 | GCATAAAGAGTATGGGTACCGTTCAGCTTGCACCAG | |
| YKp0057 | CTCCAGCCTACACTTATTCTGTTTCGCACTGGAATC | |
| YKp0058 | TTATTCTGTTTCGCACTGGAATCCC | For constructing pYK018 plasmid using ExoIII cloning. PCR was conducted on the template pYK016 with YKp0059 & YKp0060 and pYK017 with YKp0022 & YKp0058 to combine pmag-creC and creN-nmag. |
| YKp0059 | GCGAAACAGAATAAAGGAGAAAGGTACCATGCATAC | |
| YKp0060 | GCTCCAGCCTACACTTAGTCCCCATCTTCGAGCAGC | |
| YKp0006 | CAGGCATCAAATAAAACGAAAGGCTCAGTCG | For constructing pYK022 plasmid using ExoIII cloning. PCR was conducted on the template pYK001 with YKp0006 & YKp0052 and pYK018 with YKp0049 & YKp0061 to add a terminator. |
| YKp0061 | TTATTTGATGCCTGTTAGTCCCCATCTTCGAGCAGC | |
| Floxed cat plasmid construction | ||
| Name | Sequence | Usage |
| YKp0026 | CGTTTTATTTGATGCCTGATAACTTCGTATAGCATAC | For constructing pYK006 plasmid. Template: pCMV_lox2272_loxp_inverse-mvenus_lox2272_loxp. |
| YKp0027 | CATTAAAGAGGAGAAAGGTACCATAACTTCGTATAGGATAC | |
| YKp0029 | CTTATTAGAATTCGCCGCCATGGTGAGCAAGGGCGAG | For constructing pYK007 plasmid using ExoIII cloning. PCR was conducted on the template pTmCherryK3 with YKp0029 & YKp0030 and pYK006 with YKp0031 & YKp0032 to convert mvenus to mcherry. |
| YKp0030 | CATTATACGAAGTTATCTCGAGTTATCCACGCGTGAGC | |
| YKp0031 | CTCGAGATAACTTCGTATAATG | |
| YKp0032 | GGCGGCGAATTCTAATAAGG | |
| YKp0035 | ATAACTTCGTATAAAGTATCCTATACGAAGTTATGGTACC | For constructing pYK008 plasmid. PCR was conducted on the template pYK007 to delete spacer sequence. |
| YKp0036 | ATGGTGAGCAAGGGCGAGGAGGATAACATGGCCATCATC | |
| YKp0037 | TAACTCGAGATAACTTCGTATAATG | For constructing pYK009 plasmid with the template pYK008 to delete SacI and MluI restriction sites. |
| YKp0038 | CTTGTACAGCTCGTCCATGC | |
| YKp0039 | GAAAAAAATAACTTCGTATAGGATAC | For constructing pYK010 plasmid with the template pYK009 to change the ribosomal binding site (RBS). |
| YKp0040 | CTCCTCTTTAATGTTTTCGGTCAGTGCG | |
| YKp0041 | GAAGTTATAGGAGGAAAAAAATGGTGAGCAAGGGCGAGGAGG | For constructing pYK011 plasmid with the template pYK010 to transfer RBS in floxed site. |
| YKp0042 | GTATAAAGTATCCTATACGAAGTTATCTTTAATGTTTTCGGTCAGTGCG | |
| YKp0069 | CCGAAAACATTAAAGATAACTTCGTATAGCATACATTATACG | For constructing pYK023 with the template pYK011 (YKp0041 & YKp0069) to change lox2272 to loxP. |
| YKp0083 | ATACATTATACGAAGTTATCAGGCATCAAATAAAACG | For constructing pYK028 plasmid with the template pYK023 to change the direction of loxP site. |
| YKp0084 | GCTATACGAAGTTATCTCGAGTTACTTGTACAGCTC | |
| YKp0072 | CGAGCTGTACAAGGAGCTCGAGAAAAAAATCACTGG | For constructing pYK029 plasmid using ExoIII cloning. PCR was conducted on the template pYK028 (YKp0072 YKp0089) and pTVCK4 (YKp0075 & YKp0083) to insert cat gene. |
| YKp0075 | CTTGTACAGCTCGTCCATGCCGCCGGTGG | |
| YKp0089 | CGTATAATGTATGCTATACGAAGTTATCTCGAGTTATCCAC | |
| YKp0109 | GAGAAAAAAATCACTGG | For constructing pYK035 plasmid with the template pYK029 to remove mcherry gene. |
| YKp0110 | CATTTTTTTCCTCCTATAAC | |
| Genome integration by λ-Red recombination | ||
| Name | Sequence | Usage |
| intC_PtetO1_F3 | AGTTGTTAAGGTCGCTCACTCCACCTTC TCATCAAGCCAGTCCGCCCATCCCTATCAGTGATAGAGATTG | For genome integration of floxed mcherry-cat-FRT-kan-FRT or cat-FRT-kan-FRT at intC site by λ-Red recombination. PCR was conducted on the template pYK029 or pYK035. |
| intC_R | CCGTAGATTTACAGTTCGTCATGGTTCG CTTCAGATCGTTGACAGCCGCAATTCCGGGGATCCGTCGACC | |
| oMU94 | ACCTGCGTGAGCGTACTGGTAAGGCTGC TCGTATCAAAGAGCGTCTTAACGTGAGCAAGGGCGAGGA | For integrating mcherry-FRT-kan-FRT fragment at rplS site. Template: pMU1. |
| oMU107 | GCCAGCCAATTGGCCAGCCCTTCTTAAC AGGATGTCGCTTAAGCGAAATCTTGTGTAGGCTGGAGCTGCT | |
| oMU92 | GTTCTCAGGATCTGGCTTCCCAGGCGG AAGAAAGCTTCGTAGAAGCTGAGGTGAGCAAGGGCGAGGA | For integrating mvenus-FRT-kan-FRT fragment at rpsB site. Template: pMU2. |
| oMU108 | TTGCCGCCTTTCTGCAACTCGAACTATT TTGGGGGAGTTATCAAGCCTTATTGTGTAGGCTGGAGCTGCT | |
| Primers for sequence check | ||
| Name | Sequence | Usage |
| M13F | CAGGAAACAGCTATGAC | Sequence check for the pMW118 derivative plasmids. |
| pM1_pVT_seq_primer1 | GGCACCCCAGGCTTTAC | |
| intC_check_F | GATCGATACTTGCTGTGGTTGATG | Sequence check for the intC site. |
| intC_check_R2 | CCTCTTAGTTAAATGGATATAACGAGCCCC | |
| YKp0077 | CACCGTTGATATATCCCAATGGC | Sequence check for the cat gene. |
| YKp0115 | CACTCATCGCAGTACTGTTG | |
| oMU96 | TCCAGACTCACTCTCCGGTAGT | Sequence check for the rplS site. For the BW25113 derivative strains oMU96 & oMU97; For the W3110 derivative strains oMU96 & oMU110 |
| oMU97 | ATAGCCAGTAACAAGACCGCCC | |
| oMU110 | GACAAATTCCACGCAGCAATCTCAC | |
| oMU26 | AAGCAAACAACCTGGGTATTCCGGT | Sequence check for the rpsB site |
| oMU28 | CTCGCTCATCCCGGTCACTTACTGA | |
Additional files
Download links
A two-part list of links to download the article, or parts of the article, in various formats.
Downloads (link to download the article as PDF)
Open citations (links to open the citations from this article in various online reference manager services)
Cite this article (links to download the citations from this article in formats compatible with various reference manager tools)
History-dependent physiological adaptation to lethal genetic modification under antibiotic exposure
eLife 11:e74486.
https://doi.org/10.7554/eLife.74486


