Cytoplasmic dynein-1 cargo diversity is mediated by the combinatorial assembly of FTS–Hook–FHIP complexes
- Department of Cellular and Molecular Medicine, United States
- Department of Biochemistry and Molecular Genetics, University of Colorado Denver, United States
- Howard Hughes Medical Institute, United States
- Division of Biological Sciences, Cell and Developmental Biology Section, United States
Figures
Figure 1 with 2 supplements
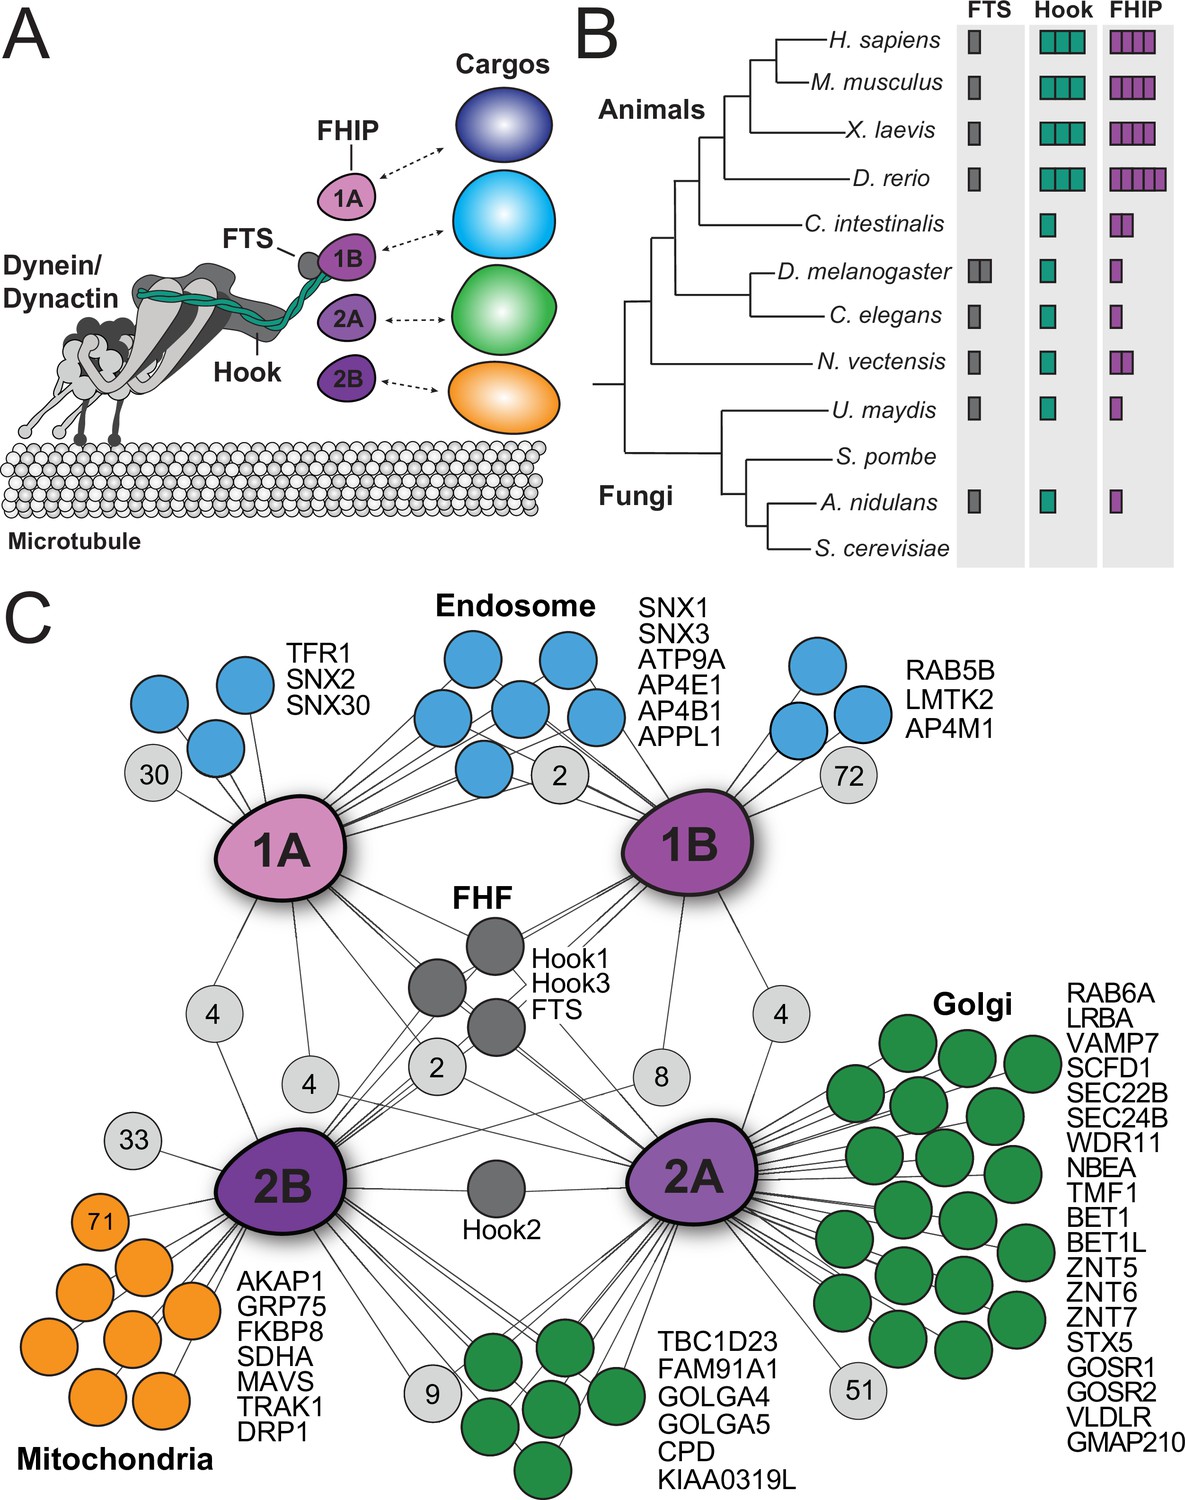
Proximity biotinylation reveals different FHIP protein interactomes.
(A) Schematic of the dynein complex and interactions with potential cargo adaptor complexes. (B) Phylogenetic tree showing the number of FTS (gray), Hook (green), and FHIP (purple) protein homologs presents in each animal or fungal species listed. Each colored box denotes a putative homolog identified by reciprocal protein BLAST search. H. sapiens, Homo sapiens; M. musculus, Mus musculus; X. laevis, Xenopus laevis; D. rerio, Danio rerio; C. intestinalis, Ciona intestinalis; D. melanogaster, Drosophila melanogaster; C. elegans, Caenorhabditis elegans; N. vectensis, Nematostella vectensis; U. maydis, Ustilago maydis; S. pombe, Schizosaccharomyces pombe; A. nidulans, Aspergillus nidulans; S. cerevisiae, Saccharomyces cerevisiae. (C) Interaction diagram for FHIP carboxy-terminal BioID datasets. Oblong purple shapes represent FHIP1A (‘1A’), FHIP1B (‘1B’), FHIP2A (‘2A’), and FHIP2B (‘2B’) datasets. Significant protein hits present in a FHIP BioID dataset that are known to be associated with specific organelles (based on gene ontology analysis) are indicated by colored circles connected by lines. Light gray circles with numbers inside represent the number of other significant protein hits in that dataset or combination of datasets. For mitochondria-associated proteins in the FHIP2B dataset, proteins known to associate with the outer mitochondrial membrane are listed by name. The orange circle with ‘71’ denotes the number of other mitochondria-associated proteins (not outer membrane associated) found in the FHIP2B dataset. Significant hits displayed in the diagram showed a ≥threefold enrichment over the cytoplasmic BioID2 control or absence in the cytoplasmic BioID2 control, significance of p < 0.05 by Student’s two-tailed t-test, and presence in three out of four technical replicates.
Figure 1—figure supplement 1
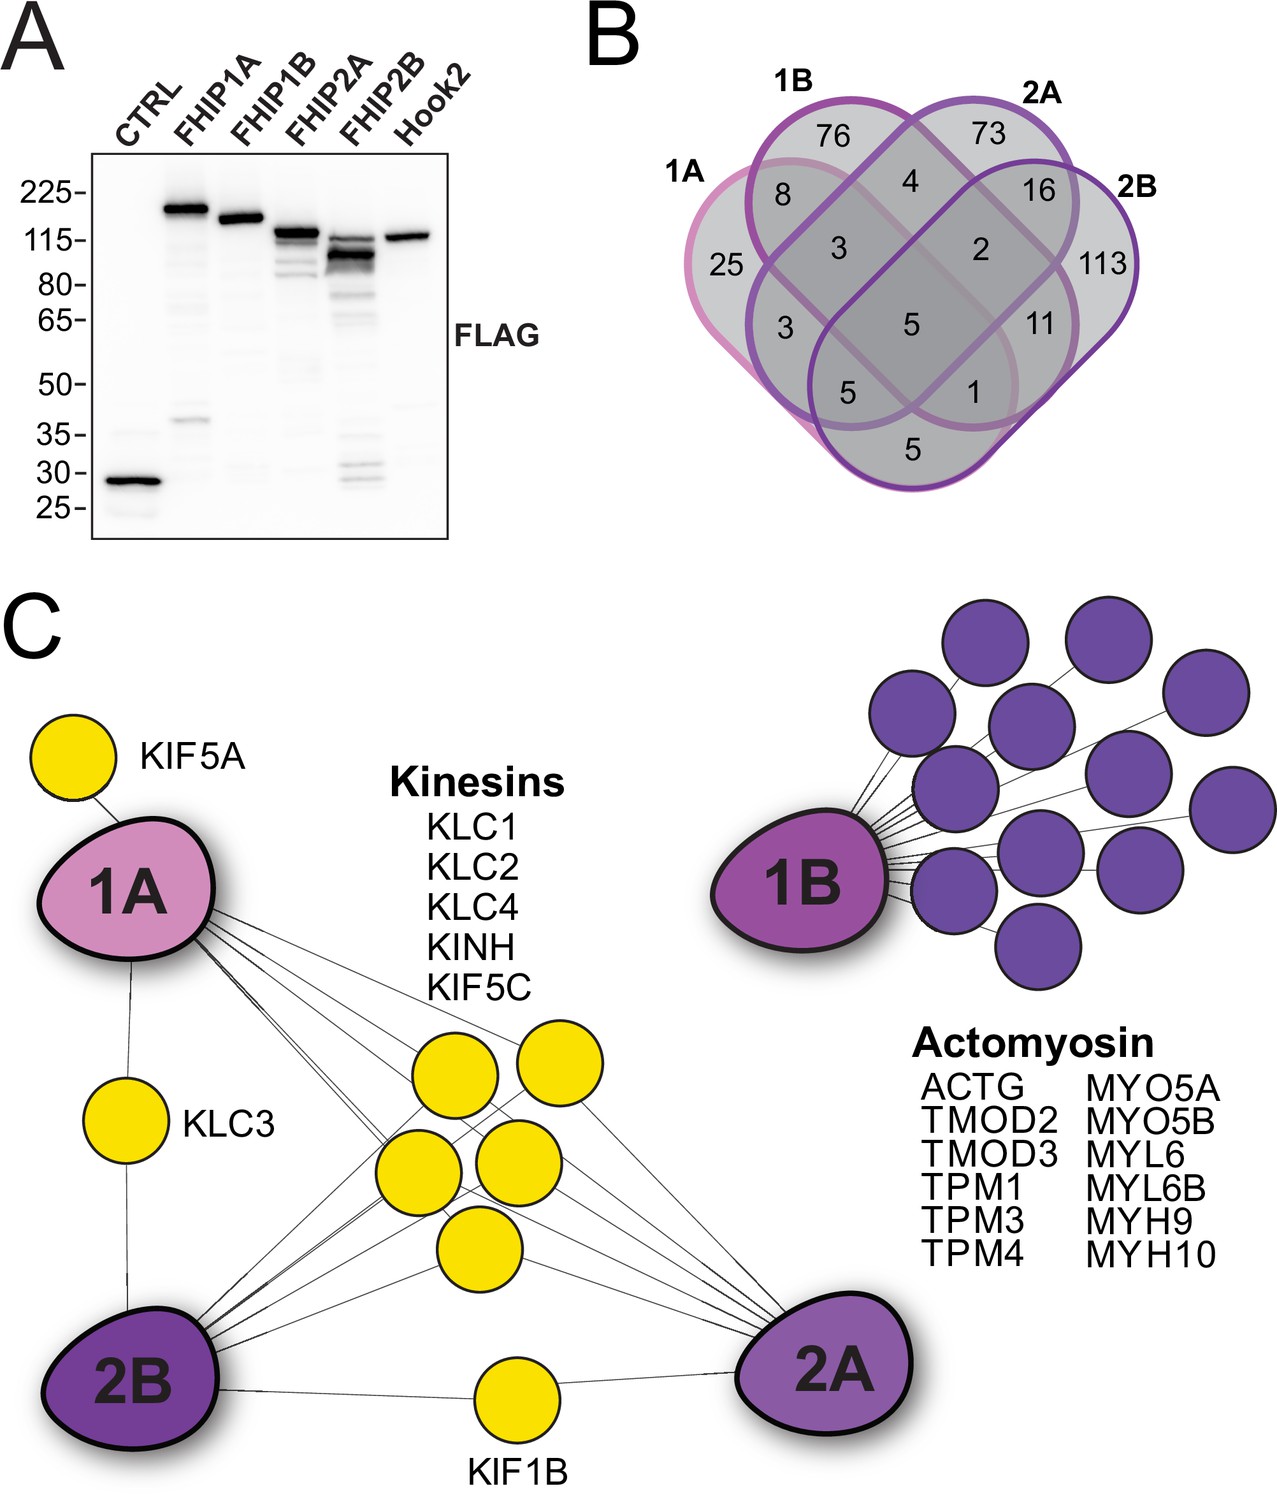
Proximity biotinylation identifies different FHIP protein interactomes.
(A) Human FHIP1A, FHIP1B, FHIP2A, FHIP2B, and human Hook2 tagged at the carboxy termini with 3XFLAG-BioID2 were immunoprecipitated with FLAG affinity resin (FLAG-IP) from stable 293T cell lines. Immunoblots were probed with anti-FLAG antibody. Protein molecular weight markers are shown in kilo-Daltons to the left of the immunoblot. BioID-3xFLAG provided a control (CTRL). Representative images from three biological replicates are shown. (B) Venn diagram showing the overlap between all significant hits in all FHIP BioID datasets. Significant hits displayed in the diagram showed a ≥threefold enrichment over cytoplasmic BioID control, significance of p < 0.05 by Student’s two-tailed t-test, and presence in three out of four technical replicates. (C) Interaction diagram for FHIP carboxy-terminal BioID2 datasets. Oblong purple shapes represent FHIP1A (‘1A’), FHIP1B (‘1B’), FHIP2A (‘2A’), and FHIP2B (‘2B’) datasets. Significant kinesin or actomyosin hits present in a FHIP BioID dataset (based on gene ontology analysis) are indicated by colored circles connected by lines. Significant hits displayed in diagram showed a ≥threefold enrichment over cytoplasmic BioID control, significance of p < 0.05 by Student’s two-tailed t-test, and presence in three out of four technical replicates.
-
Figure 1—figure supplement 1—source data 1
Raw uncropped immunoblot image (Figure 1—figure supplement 1.scn) from Figure 1—figure supplement 1A probed with anti-FLAG antibody.
- https://cdn.elifesciences.org/articles/74538/elife-74538-fig1-figsupp1-data1-v2.pdf
Figure 1—figure supplement 2
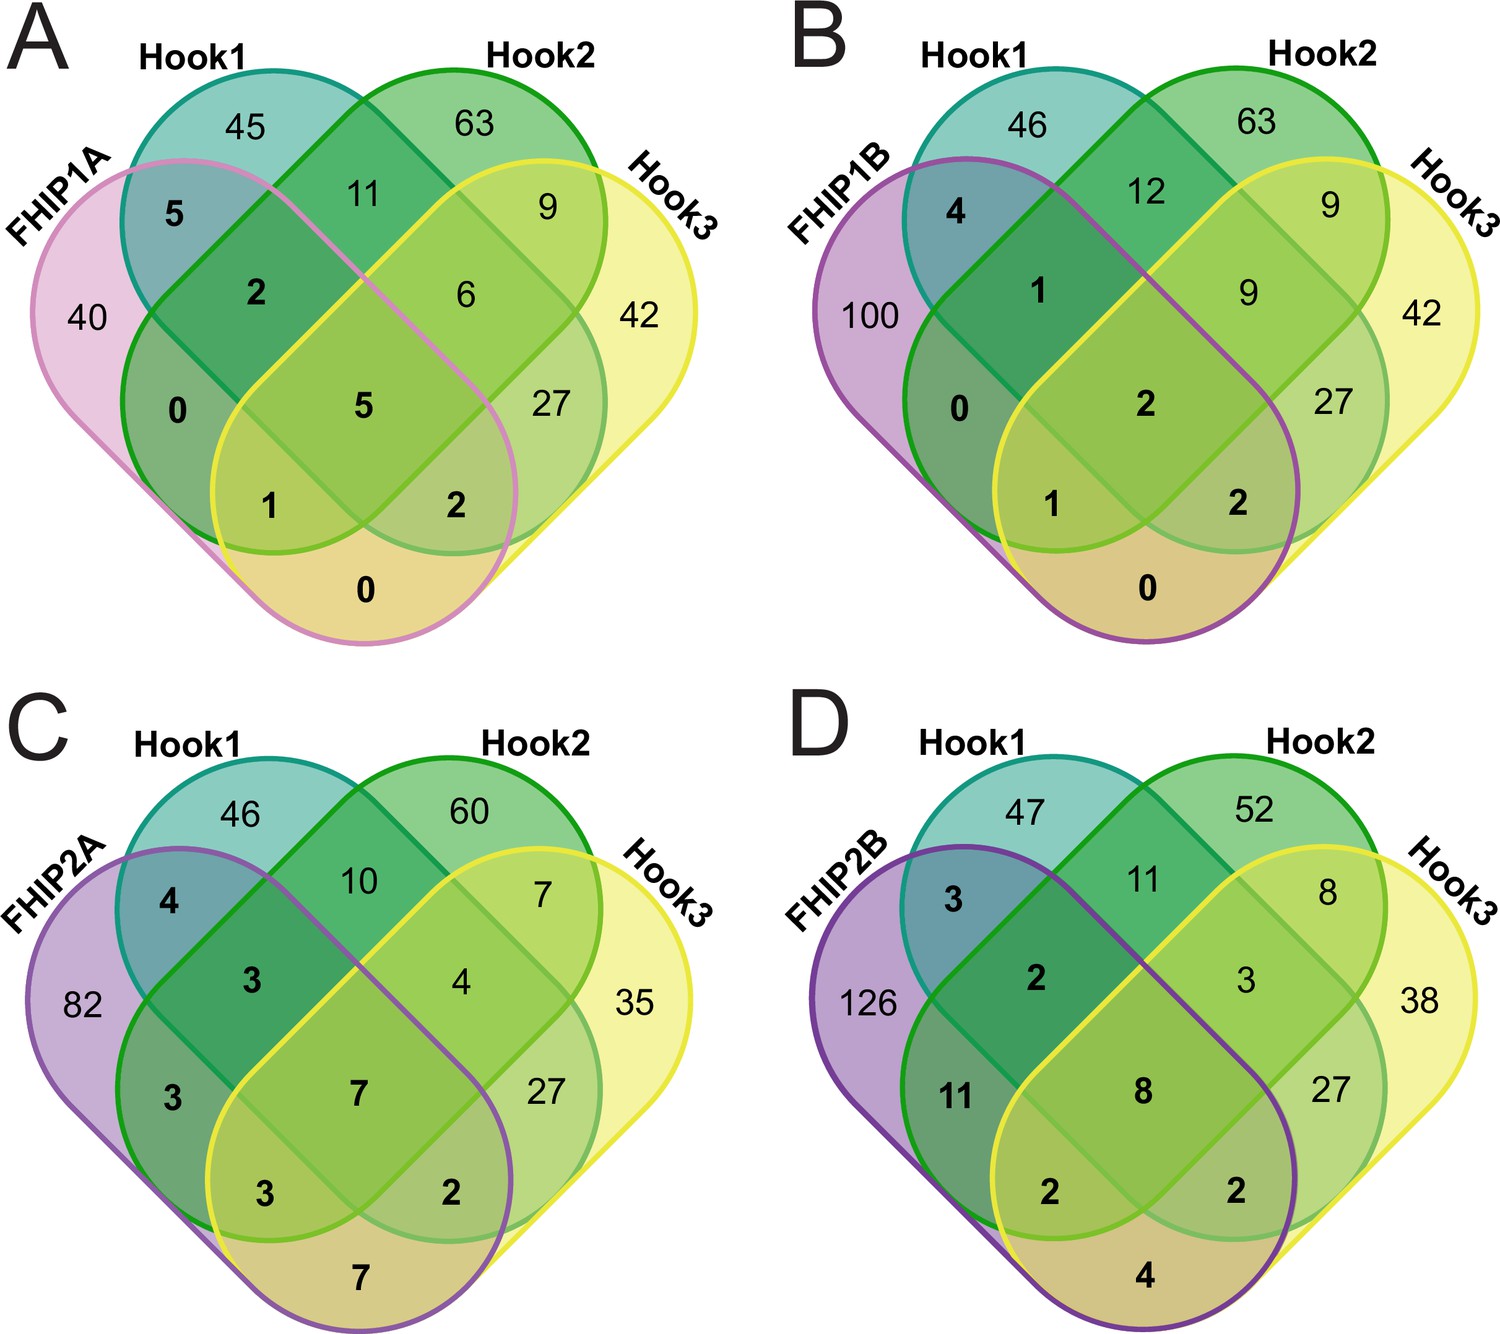
Overlap between significant hits from the different FHIP BioID datasets.
Venn diagram showing the overlap between all significant hits from the different FHIP BioID datasets (FHIP2A – A, FHIP2B – B, FHIP2A – C, and FHIP2B – D) and the different carboxy-terminal BioID Hook datasets. The numbers of significant hits that are common between FHIP and Hook datasets are shown in bold in the Venn diagram. Significant hits displayed in the diagram showed a ≥threefold enrichment over cytoplasmic BioID control, significance of p < 0.05 by Student’s two-tailed t-test, and presence in three out of four technical replicates. Hook1 and Hook3 datasets are from Redwine et al., 2017.
Figure 2 with 1 supplement
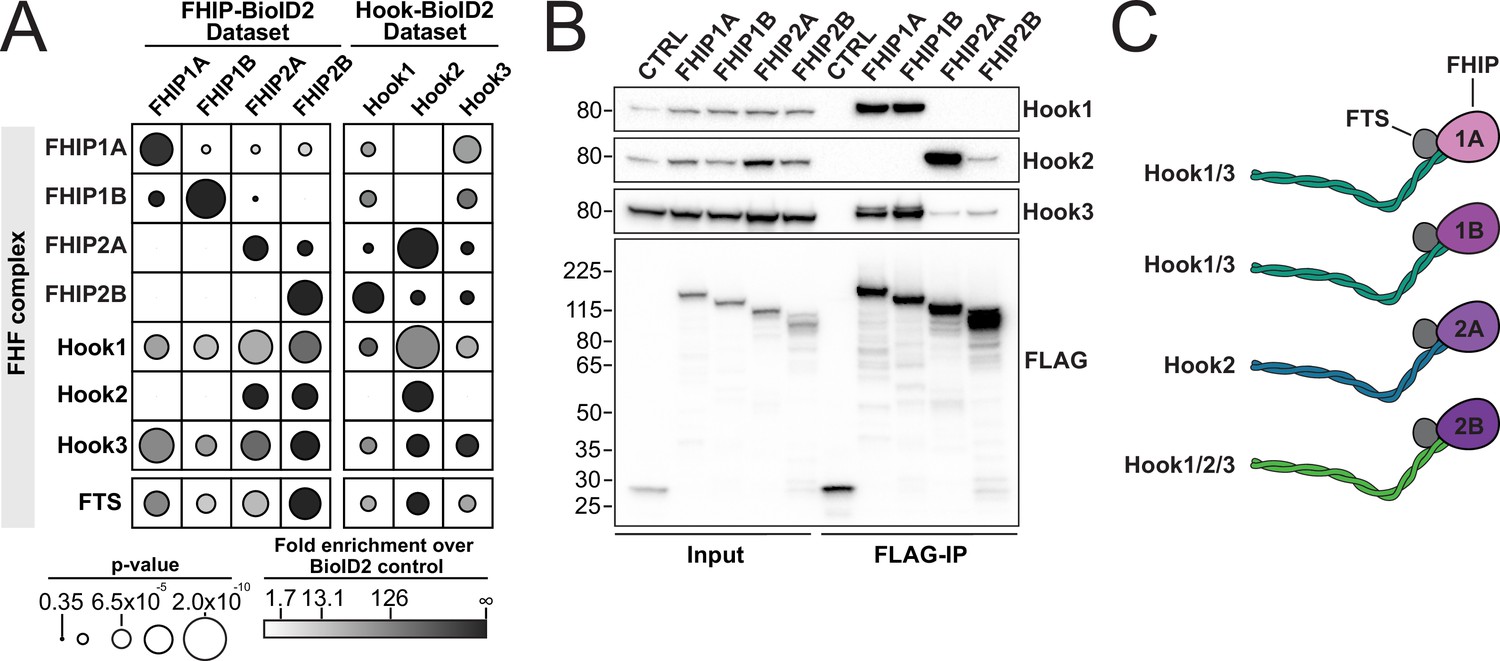
FHIP proteins preferentially interact with different Hook proteins to form different FHF complexes.
(A) Fold-enrichment over cytoplasmic BioID2 control (grayscale intensity) and p value (circle size) for FHF complex proteins identified in carboxy-terminal FHIP and carboxy-terminal Hook BioID datasets. Hook1 and Hook3 datasets are from Redwine et al., 2017. (B) Human FHIP1A, FHIP1B, FHIP2A, and FHIP2B tagged at their carboxy termini with BioID2 and 3xFLAG were immunoprecipitated with FLAG affinity resin (FLAG-IP) from stable 293T cell lines. Immunoblots were probed with anti-Hook1, anti-Hook2, anti-Hook3, and anti-FLAG antibodies. Protein molecular weight markers are shown in kilo-Daltons to the left of each immunoblot. BioID2-3xFLAG provided a control (CTRL). Representative images from three biological replicates are shown. (C) Cartoon representation of the possible FHF complexes formed.
-
Figure 2—source data 1
Raw uncropped immunoblot images from Figure 2 (Figure 2B_Hook3.scn – anti-Hook3; Fig2B_Hook1_Hook2.scn – anti-Hook1, left side of the image and anti-Hook2, right side of the image; Fig2B_FLAG.scn – anti-FLAG) probed with the indicated antibodies.
Relevant lanes are marked on the images.
- https://cdn.elifesciences.org/articles/74538/elife-74538-fig2-data1-v2.pdf
Figure 2—figure supplement 1
Different Hook proteins coimmunoprecipitate different FHIP proteins.
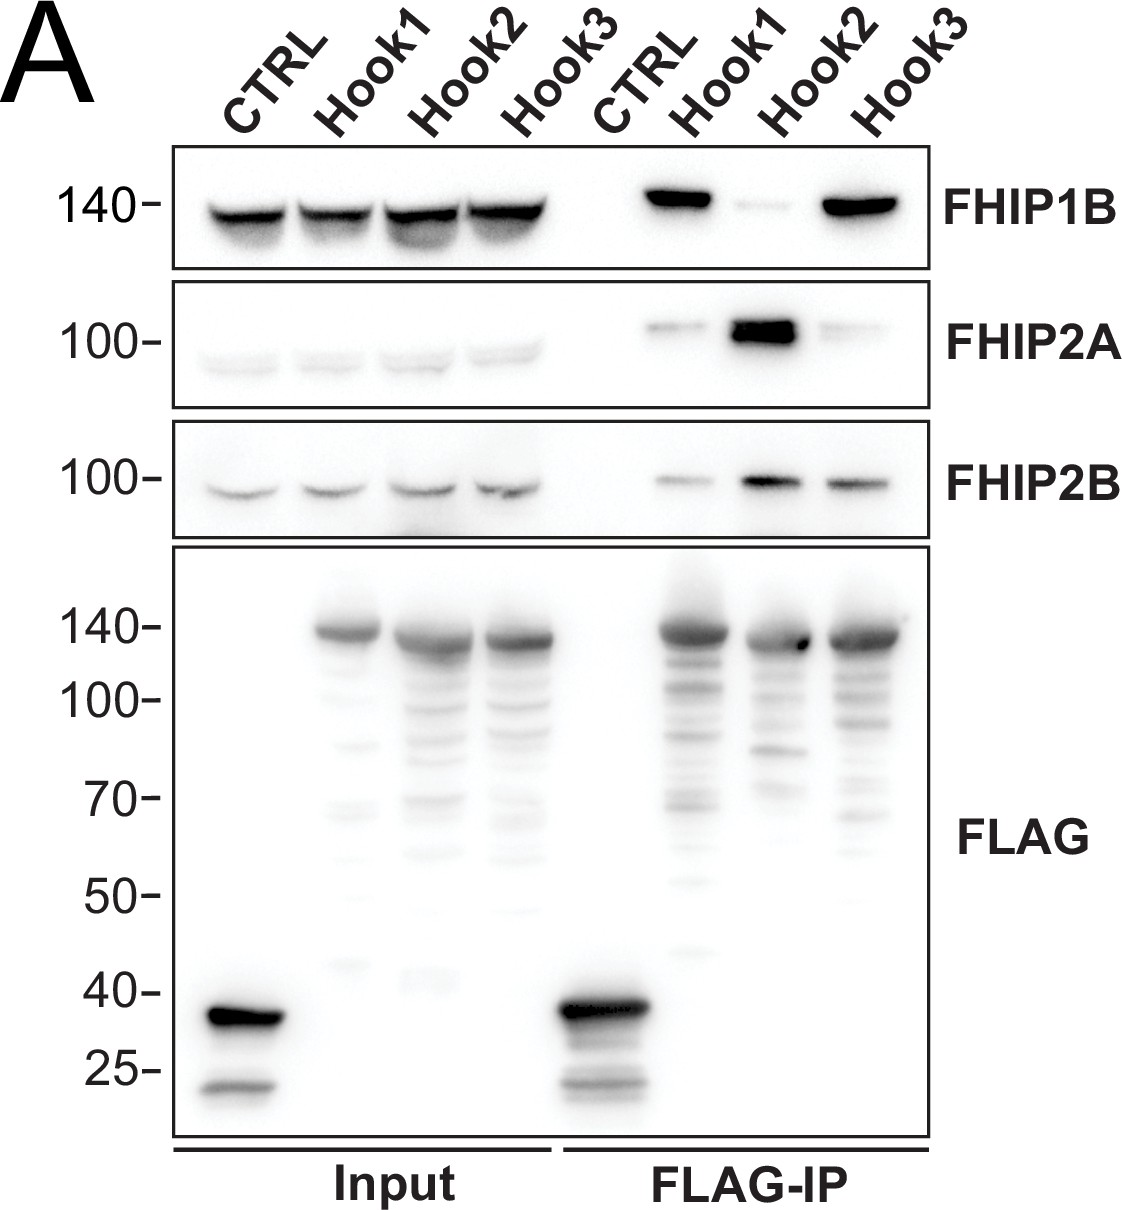
(A) Human Hook1, Hook2, and Hook3 tagged at the amino termini with HaloTag and the carboxy termini with 3xFLAG were immunoprecipitated with FLAG affinity resin (FLAG-IP) from 293T cell lines transiently transfected with these constructs. Immunoblots were probed with anti-FHIP1B, anti-FHIP2A, anti-FHIP2B, and anti-FLAG antibodies. Protein molecular weight markers are shown in kilo-Daltons to the left of each immunoblot. sfGFP-3xFLAG provided a control (CTRL). Representative images from three biological replicates are shown.
-
Figure 2—figure supplement 1—source data 1
Raw uncropped immunoblot images from Figure 2—figure supplement 1A (Fig2supp1_FHIP1B.scn – anti-FHIP1B; Fig2supp1_FHIP2A.scn – anti-FHIP2A; Fig2supp1_FHIP2B.scn – anti-FHIP2B; Fig2supp1_FLAG.scn – anti-FLAG) probed with the indicated antibodies.
Relevant lanes are marked on the images.
- https://cdn.elifesciences.org/articles/74538/elife-74538-fig2-figsupp1-data1-v2.pdf
Figure 3 with 3 supplements
FHF complexes comigrate with moving dynein/ dynactin on microtubules.
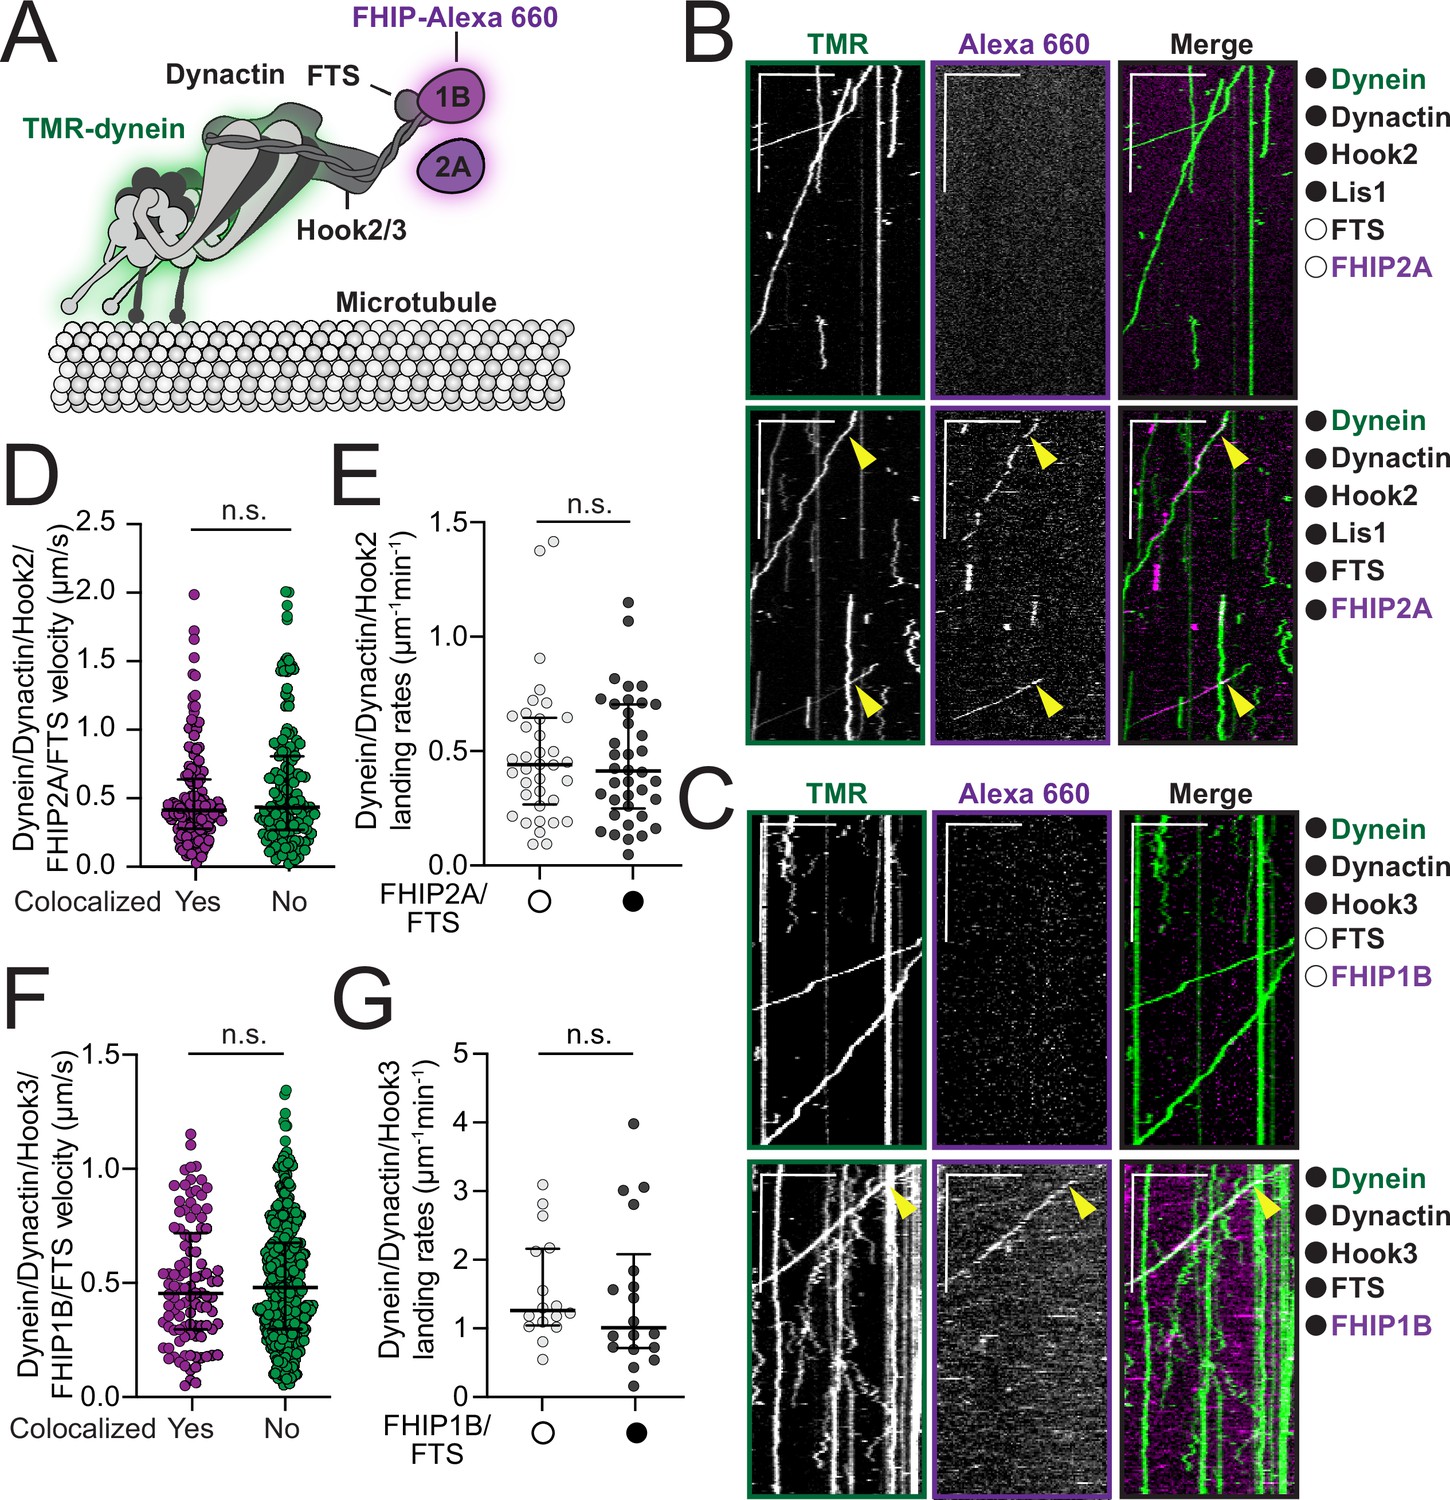
(A) Schematic of the dynein, dynactin, and FHF (FTS, Hook2 or Hook3, and FHIP1B or FHIP2A) complexes used in reconstitution experiments. Proteins labeled with fluorophores in motility assay are highlighted (dynein – green and FHIP1B and FHIP2A – magenta). (B) Representative kymographs from single-molecule motility assays with purified TMR-labeled dynein (green), unlabeled dynactin, unlabeled full-length Hook2, and unlabeled Lis1 in the absence (top panel, white circle) or presence (bottom panel, black circle) of unlabeled FTS and Alexa-660-labeled FHIP2A (magenta). Two-color colocalized runs are marked with yellow arrows on each single-channel image and in the merge. Scale bars, 10 μm (x) and 40 s (y). (C) Representative kymographs from single-molecule motility assays with purified TMR-labeled dynein (green), unlabeled dynactin, and unlabeled full-length Hook3 in the absence (top panel, white circle) or presence (bottom panel, black circle) of unlabeled FTS and Alexa-660-labeled -FHIP1B (magenta). A two-color colocalized run is marked with yellow arrows on each single-channel image and in the merge. Scale bars, 10 μm (x) and 40 s (y). (D) Single-molecule velocity (median ± interquartile range) of TMR-dynein/dynactin/Hook2 runs in the presence of FHIP2A-Alexa-660 and FTS, either colocalized with FHIP2A-Alexa-660 (yes, n = 140) or not (no, n = 150). n.s., no significance, p = 0.1193, t-test with Welch’s correction. (E) Landing rates (median ± interquartile range) from TMR-dynein/dynactin/Hook2 experiments performed in the absence (white circle, n = 36) or in the presence of FHIP2A-Alexa-660 and FTS (black circle, n = 38). n.s., no significance, p = 0.9272, Mann–Whitney test. (F) Single-molecule velocity (median ± interquartile range) of TMR-dynein/dynactin/Hook3 runs in the presence of FHIP1B-Alexa-660 and FTS, either colocalized with FHIP1B-Alexa-660 (yes, n = 102) or not (no, n = 430). n.s., no significance, p = 0.8328, t-test with Welch’s correction. (G) Landing rates (median ± interquartile range) from TMR-dynein/dynactin/Hook3 experiments performed in the absence (white circle, n = 16) or in the presence of FHIP1B-Alexa-660 and FTS (black circle, n = 18). n.s., no significance, p = 0.3653, Mann–Whitney test.
Figure 3—figure supplement 1
Motile properties of dynein/dynactin complexes activated by full-length Hook2 and full-length Hook3.
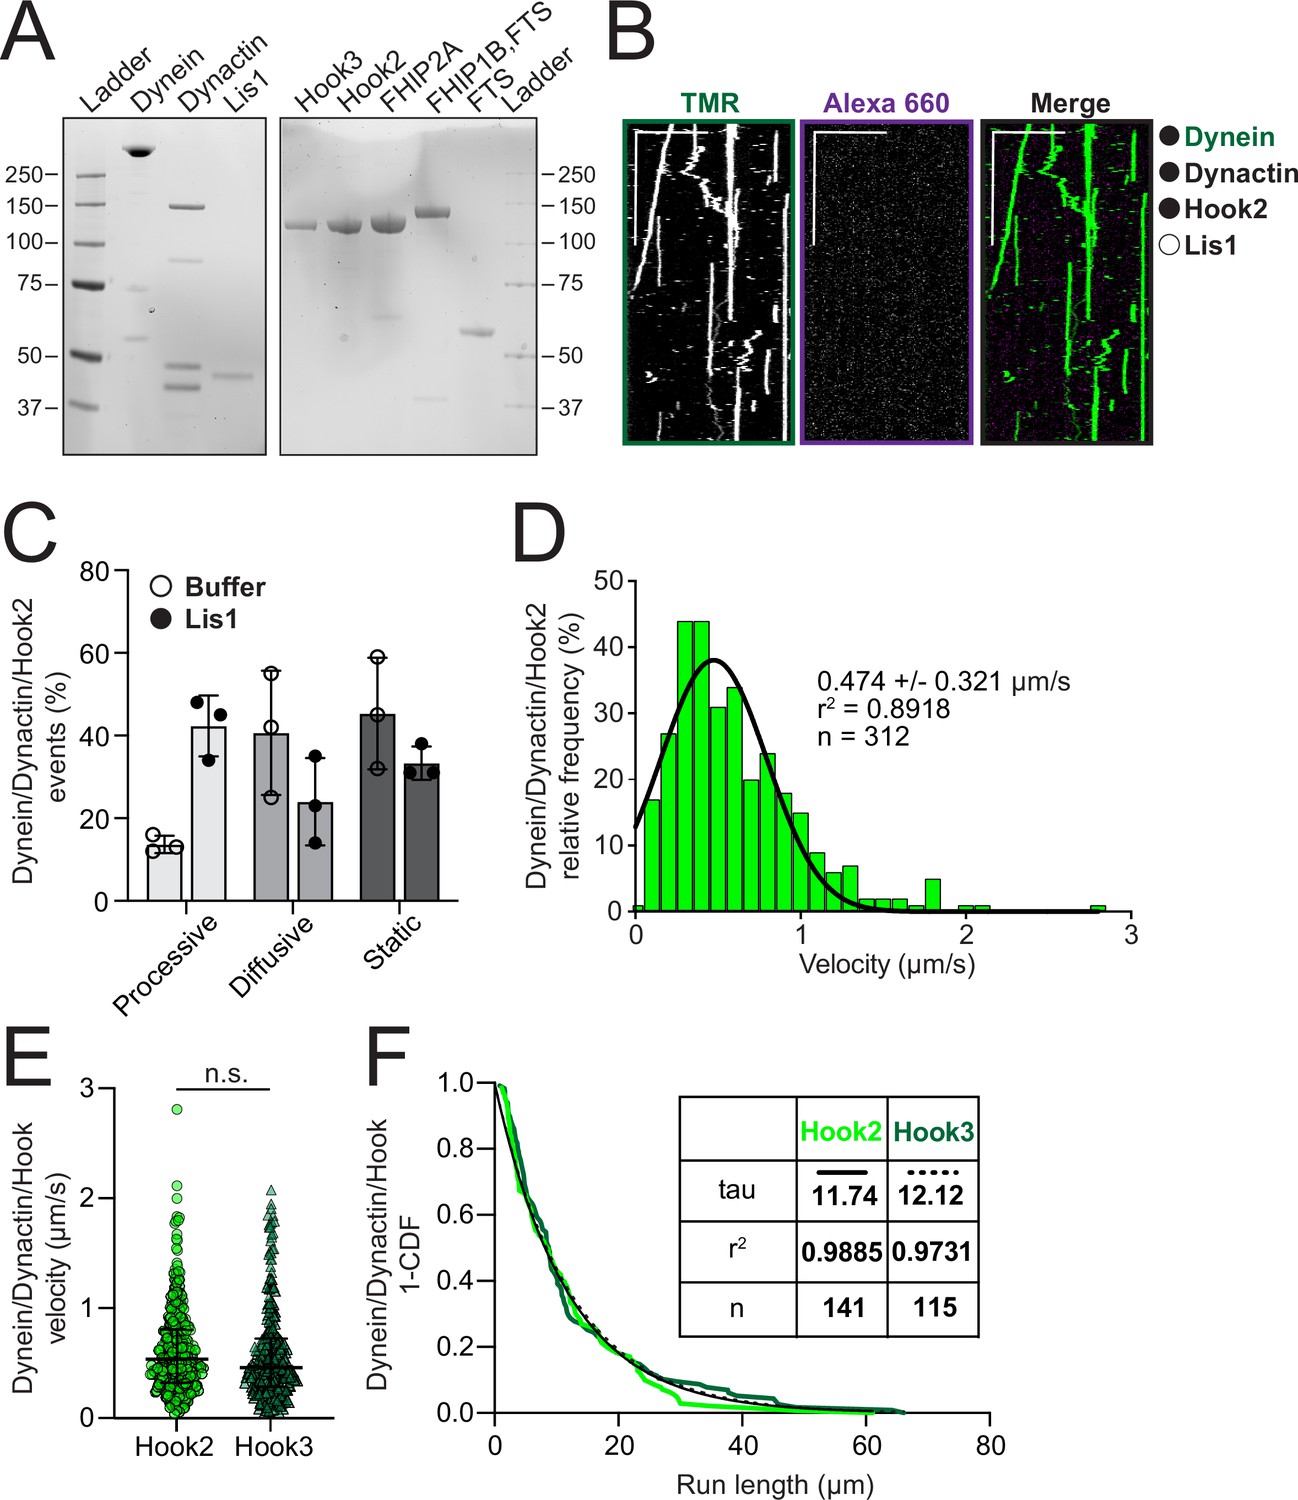
(A) Sodium dodecyl sulfate–polyacrylamide gel electrophoresis (SDS–PAGE) of purified proteins used for motility assays. (B) Representative kymographs from single-molecule motility assays with purified (black circles) TMR-labeled dynein (green), unlabeled dynactin and unlabeled full-length Hook2 in the absence of Lis1 (white circle). Scale bars, 10 μm (x) and 40 s (y). (C) Comparison of percent processive, diffusive, and static events ± SEM from single-molecule TMR-dynein/dynactin/Hook2 performed in the absence (white circle, n = 18) or presence (black circle, n = 36) of Lis1. (D) A histogram of dynein/dynactin/Hook2 velocity fit to a Gaussian (black line, 0.4743 ± 0.3213 μm /s, mean ± SD, r2 = 0.8918, n = 312). (E) Single-molecule velocity (median ± interquartile range) of TMR-dynein/dynactin activated by full-length unlabeled Hook2 (light green circles, 0.4743 ± 0.3213 μm/s, mean ± SD, n = 312) or Hook3 (dark green triangles, 0.3901 ± 0.2525 μm/s, mean ± SD, n = 283) in the presence of Lis1. n.s., no significance, p = 0.2854, t-test with Welch’s correction. (F) Run length analysis of dynein/dynactin activated by full-length unlabeled Hook2 (light green, n = 141) or Hook3 (dark green, n = 115) in the presence of Lis1. The 1-cumulative frequency distribution (1-CDF) was fit to a one phase exponential decay (black line – Hook2, dotted black line – Hook3). The representative mean decay constants (tau) are listed in the table.
-
Figure 3—figure supplement 1—source data 1
Raw uncropped sodium dodecyl sulfate–polyacrylamide gel electrophoresis (SDS–PAGE) gel images from Figure 3A (Figure 3 supp1left.scn and Figure 3 supp1right.scn).
Relevant lanes are marked on the images.
- https://cdn.elifesciences.org/articles/74538/elife-74538-fig3-figsupp1-data1-v2.pdf
Figure 3—figure supplement 2
Motile properties of dynein/dynactin complexes activated by full-length Hook2 and full-length Hook3 in the presence of FHIP and FTS proteins.
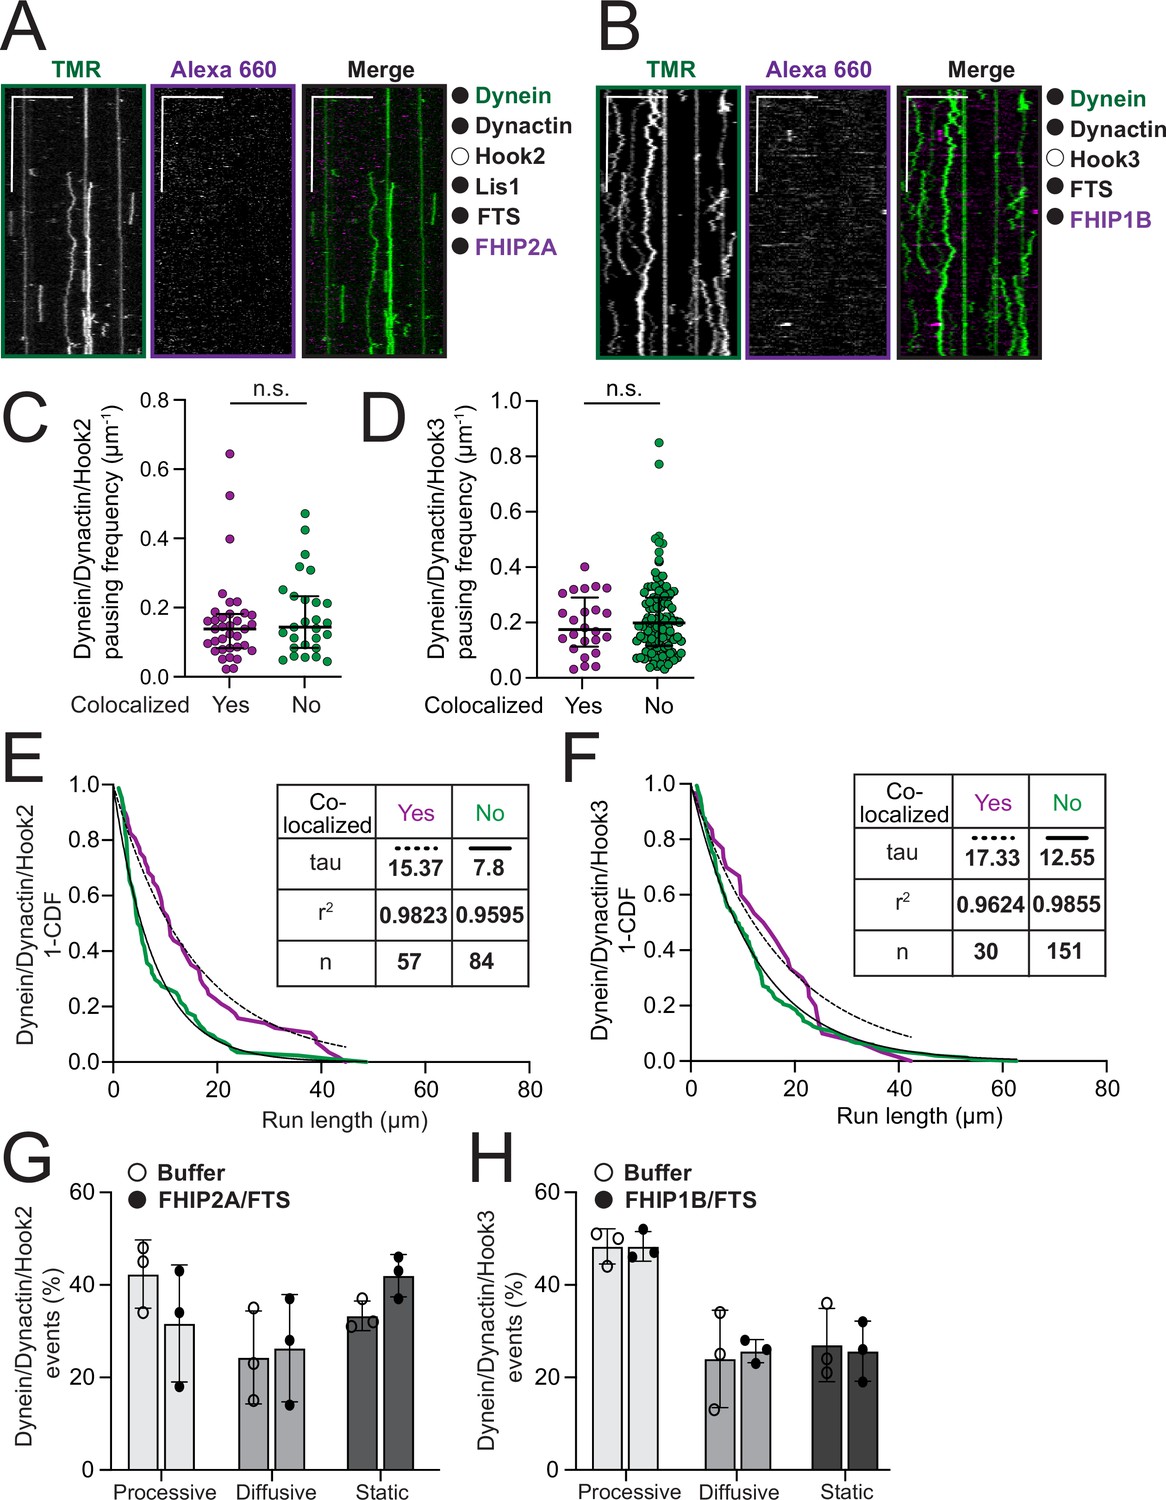
(A) Representative kymographs from single-molecule motility assays with purified (black circle) TMR-dynein (green), unlabeled dynactin, unlabeled Lis1, unlabeled FTS and FHIP2A-Alexa-660 (magenta) in the absence (white circle) of Hook2. Scale bars, 10 μm (x) and 40 s (y). (B) Representative kymographs from single-molecule motility assays with purified (black circle) TMR-dynein (green), unlabeled dynactin, unlabeled FTS and FHIP1B-Alexa-660 (magenta) in the absence (white circle) of Hook3. Scale bars, 10 μm (x) and 40 s (y). (C) Pausing frequency of motile events (median ± interquartile range) from TMR-dynein/dynactin/Hook2 experiments performed in the absence (white circle, n = 71) or in the presence of FHIP2A-Alexa 660 and FTS (black circle, n = 62). n.s., no significance, p = 0.4872, Mann–Whitney test. (D) Pausing frequency analysis of TMR-dynein/dynactin/Hook3 runs in the presence of FHIP1B-Alexa-660 and FTS, either colocalized with FHIP1B-Alexa-660 (yes, n = 24) or not (no, n = 103). n.s., no significance, p = 0.3947, Mann–Whitney test. (E) Run length analysis of TMR-dynein/dynactin/Hook2 runs in the presence of FHIP2A-Alexa-660 and FTS, either colocalized with FHIP2A-Alexa-660 (yes – magenta) or not (no – green). The 1-cumulative frequency distributions (1-CDF) were fit to a one phase exponential decay. The representative mean decay constants (tau) are listed in the table. p = 0.003, Kolmogorov–Smirnov test. (F) Run length analysis of TMR-dynein/dynactin/Hook3 runs in the presence of FHIP1B-Alexa-660 and FTS, either colocalized with FHIP1B-Alexa-660 (yes – magenta) or not (no – green). The 1-cumulative frequency distributions (1-CDF) were fit to a one phase exponential decay. The representative mean decay constants (tau) are listed in the table. p = 0.0768, Kolmogorov–Smirnov test. (G) Comparison of percent processive, diffusive, and static events ± SEM from single-molecule TMR-dynein/dynactin/Hook2 performed in the absence (white circle, n = 36) or presence (black circle, n = 39) of FHIP2A and FTS. (H) Comparison of percent processive, diffusive, and static events ± SEM from single-molecule TMR-dynein/dynactin/Hook3 performed in the absence (white circle, n = 16) or presence (black circle, n = 18) of FHIP1B and FTS.
Figure 3—figure supplement 3

Example kymographs of moving dynein/dynactin complexes in the presence of full-length Hook2, FTS and FHIP1B or full-length Hook3, FTS and FHIP2A.
(A) Representative kymographs from single-molecule motility assays with purified (black circles) TMR-dynein (green), unlabeled dynactin, unlabeled full-length Hook2, unlabeled Lis1, unlabeled FTS, and FHIP1B-Alexa-660. Two examples are shown. A two-color colocalized static event is marked with yellow arrows on each single-channel image and in the merge. Scale bars, 10 μm (x) and 40 s (y). (B) Representative kymographs from single-molecule motility assays with purified (black circles) TMR-dynein (green), unlabeled dynactin, unlabeled full-length Hook3, unlabeled FTS, and FHIP2A-Alexa-660. Two examples are shown. A two-color colocalized run is marked with yellow arrows on each single-channel image and in the merge. Scale bars, 10 μm (x) and 40 s (y).
Figure 4 with 1 supplement
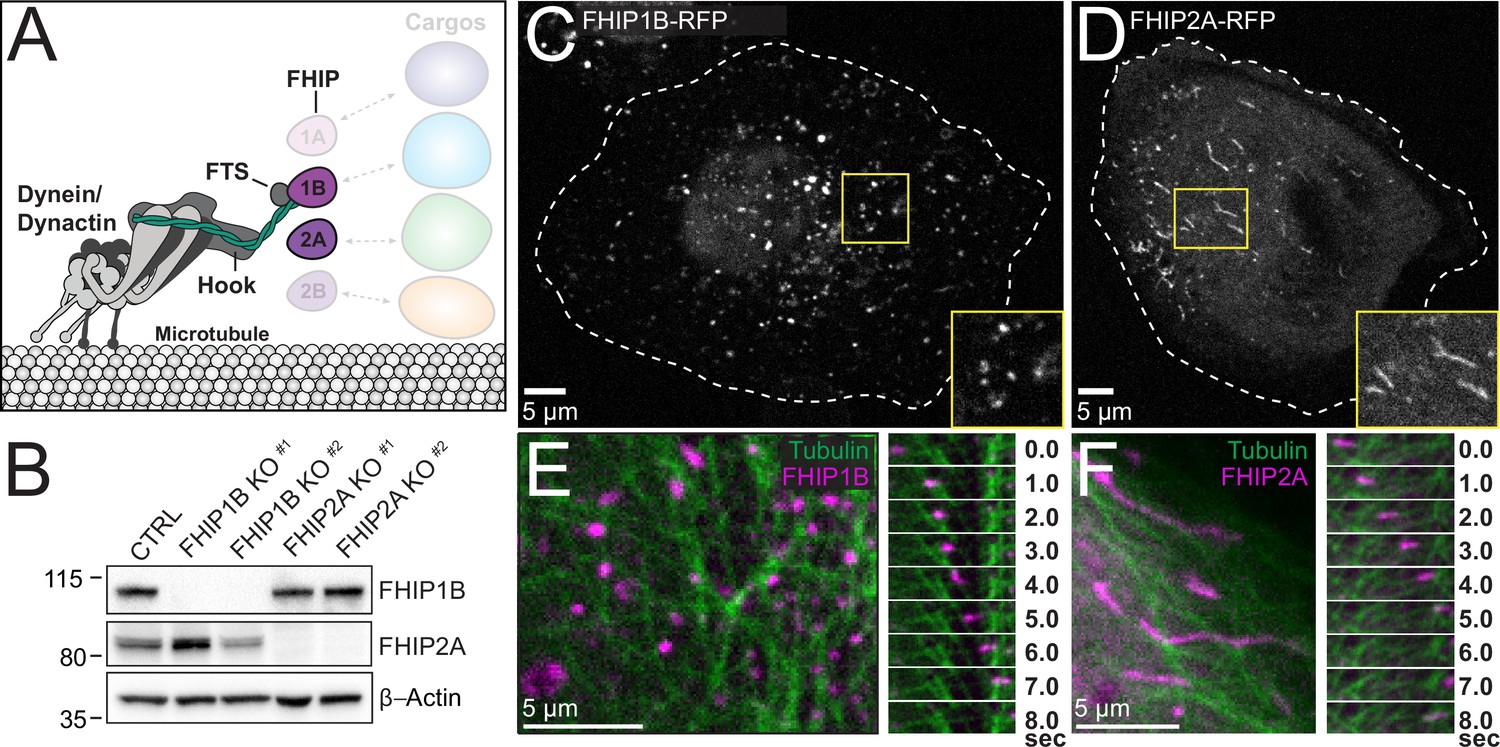
FHIP1B and FHIP2A localize to motile cargos with different morphologies.
(A) Schematic of FHIP proteins (FHIP1B and FHIP2A) further examined in this study. (B) U2OS cells were transfected with control CRISPR/Cas9 (CTRL) or with two different CRISPR/Cas9-gRNAs specific for FHIP1B and FHIP2A. Knockouts were confirmed by immunoblotting with anti-FHIP1B and anti-FHIP2A antibodies. β-Actin provided a loading control. Representative images from three biological replicates are shown. Single-plane confocal micrograph of FHIP1B KO U2OS cells expressing FHIP1B-TagRFP-T-V5 (FHIP1B-RFP) (C) or FHIP2A KO U2OS cells expressing FHIP2A-TagRFP-T-V5 (FHIP2A-RFP) (D). Yellow rectangles denote region of cropped inset. Dotted lines denote cell outline. Single-plane confocal micrograph crop (left panels) and corresponding time-lapse montage (right panels) of FHIP1B KO U2OS cells expressing FHIP1B-TagRFP-T-V5 (FHIP1B) and mEmerald-tubulin (E) or FHIP2A KO U2OS cells expressing FHIP2A-TagRFP-T-V5 (FHIP2A) and mEmerald-tubulin (F).
-
Figure 4—source data 1
Raw uncropped immunoblot images from Figure 4B (Figure 4B_FHIP1B.scn – anti-FHIP1B; Figure 4B_Actin.scn – anti-β-actin; Figure 4B_FHIP2A.scn– anti-FHIP2A) probed with the indicated antibodies.
Relevant lanes are marked on the images.
- https://cdn.elifesciences.org/articles/74538/elife-74538-fig4-data1-v2.pdf
Figure 4—figure supplement 1
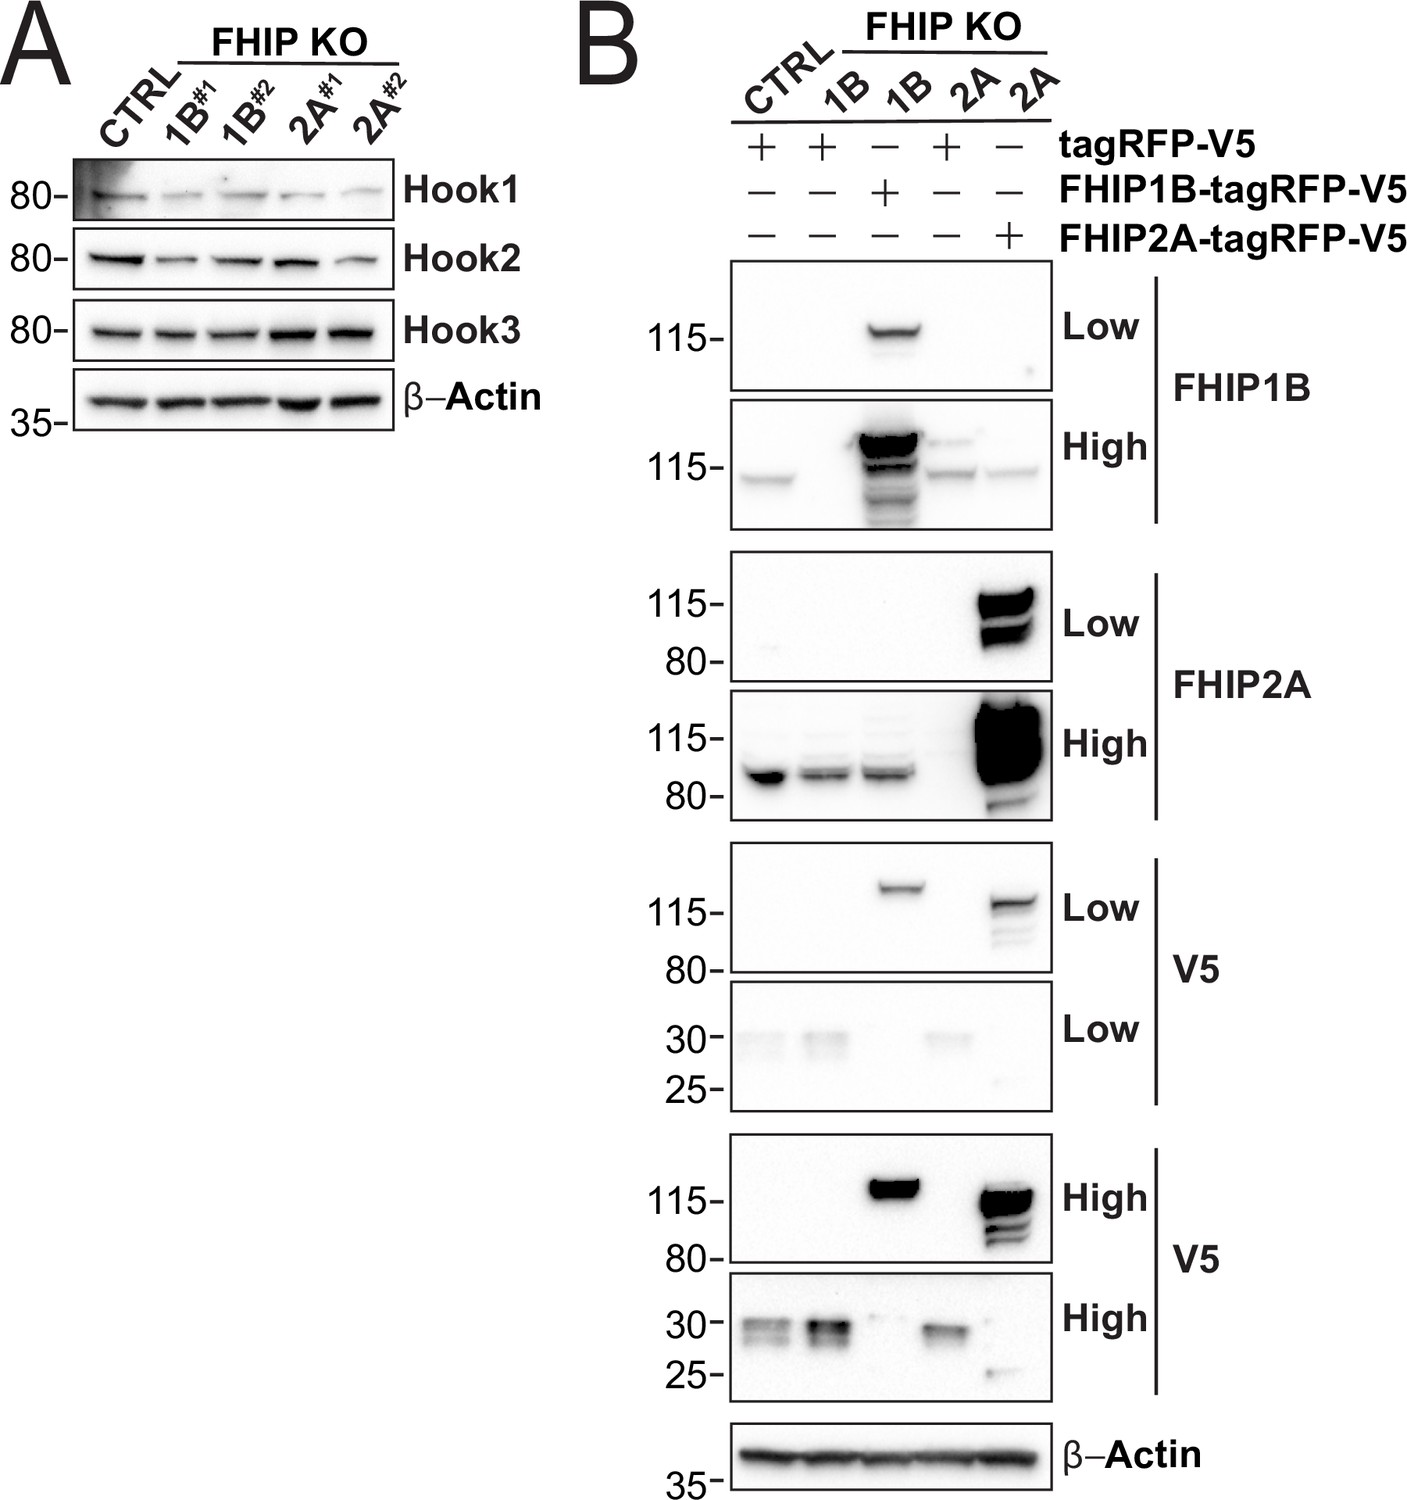
Protein expession levels in CRISPR/Cas9 FHIP1B and CRISPR/Cas9 FHIP2A knockout and rescue cell lines.
(A) Whole cell lysates from stable U2OS FHIP1B, FHIP2A knockout cells, and Cas9 control cells (CTRL) immunoblotted with anti-Hook1, anti-Hook2, anti-Hook3, and β-actin antibodies. β-Actin provided a loading control. Protein molecular weight markers are shown in kilo-Daltons to the left of each immunoblot. Representative images from three biological replicates are shown. (B) Stable U2OS Cas9 control (CTRL) and FHIP1B and FHIP2A knockout (KO) cell lines expressing the indicated constructs. Immunoblots were probed with anti-FHIP1B, anti-FHIP2A, anti-V5, and anti-β-actin antibodies. High and low exposures are shown. β-Actin provided a loading control. Protein molecular weight markers are shown in kilo-Daltons to the left of each immunoblot. Representative image from three biological is shown.
-
Figure 4—figure supplement 1—source data 1
Raw uncropped immunoblot images from Figure 4—figure supplement 1A.
(A) Raw uncropped immunoblot images from Figure 4—figure supplement 1A (Fig4supp1A_Hook1.scn – anti-Hook1; Fig4supp1A_Hook3.scn – anti-Hook3; Fig4supp1A_Hook2.scn – anti-Hook2; Fig4supp1A_Actin.scn – anti-β-actin) probed with the indicated antibodies. Relevant lanes are marked on the images. (B) Raw uncropped immunoblot images from Figure 4—figure supplement 1B (Fig4supp1B_V5_high.scn – anti-V5; Fig4supp1B_FHIP1B_FHIP2A_high.scn – anti-FHIP1B, left side of the image and anti-FHIP2A, right side of the image; Fig4supp1B_Actin_V5_low.scn – anti-V5, left side of the image and anti-β-actin, right side of the image; Fig4supp1B_FHIP2A_low.scn – anti-FHIP2A; Fig4supp1B_FHIP1B_low.scn – anti-FHIP1B) probed with the indicated antibodies. Relevant lanes are marked on the images with numbers 1–5 as outlined in the schematic.
- https://cdn.elifesciences.org/articles/74538/elife-74538-fig4-figsupp1-data1-v2.pdf
Figure 5 with 1 supplement
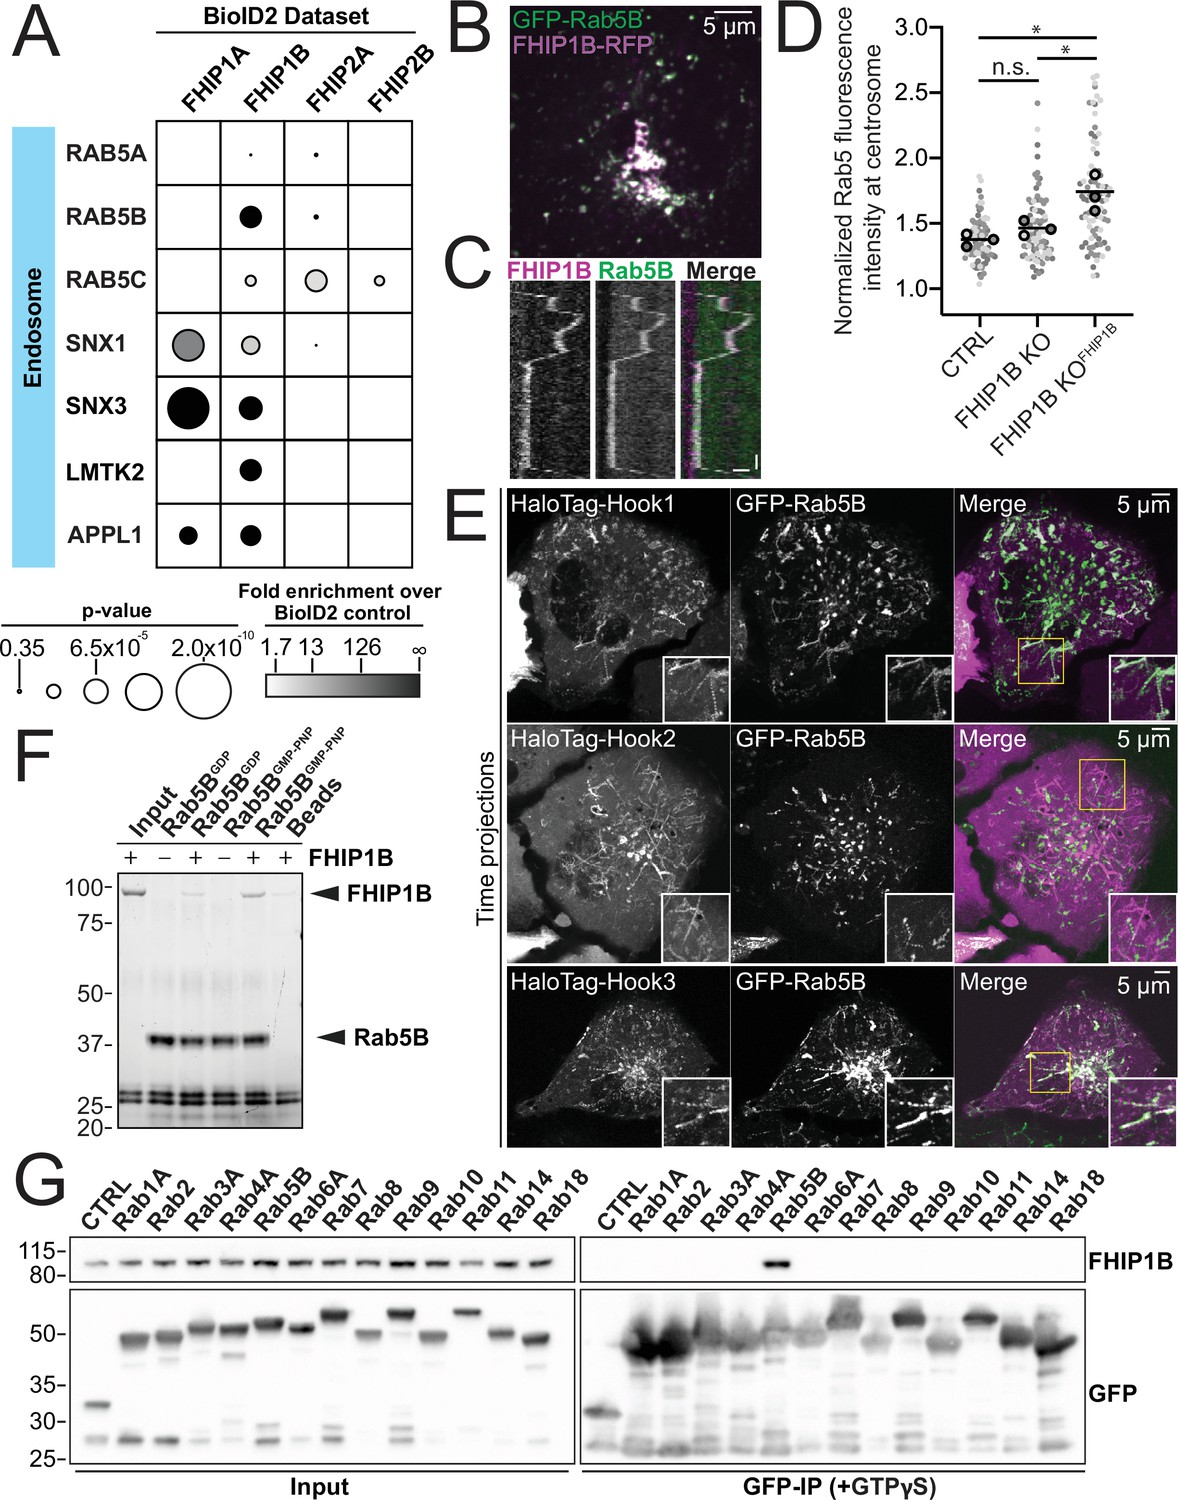
FHIP1B and Hook1/3 colocalize with early endosomes via a direct interaction between FHIP1B and GTP-bound Rab5.
(A) Fold-enrichment over cytoplasmic BioID2 control (grayscale intensity) and p value (circle size) for selected known endosome-associated proteins identified in the indicated FHIP BioID2 datasets. (B) Single-plane confocal micrograph of FHIP1B KO U2OS cell expressing FHIP1B-TagRFP-T-V5 (FHIP1B-RFP) and GFP-Rab5B. (C) Representative kymograph of moving Rab5B puncta colocalized with FHIP1B. Scale bar, 1 μm. Time bar, 2 s. (D) Quantification of Rab5 fluorescence at the centrosome in Cas9 control cells expressing cytoplasmic TagRFP-T (CTRL), FHIP1B KO cells expressing cytoplasmic TagRFP-T (FHIP1B KO), or FHIP1B KO cells expressing FHIP1B-TagRFP-T-V5 (FHIP1B KOFHIP2A). Fluorescence intensity at the centrosome was normalized to the whole cell fluorescence, and to the areas of the regions of interest used to quantify centrosome versus whole cell fluorescence. Bold line denotes mean. Bolded circles denote means for each biological replicate. Differently shaded circles correspond to individual datapoints for cells from different biological replicates. N = 77 Cas9 control, 81 FHIP1B KO, and 88 FHIP1B KOFHIP1B. Cells from three biological replicates. n.s., no significance, p = 0.1, *p < 0.0001, Kruskal–Wallis with Dunn’s post hoc test for multiple comparisons. (E) Single-plane time-lapse projections of U2OS cells expressing GFP-Rab5B and HaloTag-Hook1 tagged with Janelia Fluor (JF) 646 (top), HaloTag(JF646)-Hook2 (middle), or HaloTag(JF646)-Hook3. Time-lapse movies obtained by triggered acquisition. Yellow rectangle denotes region of cropped inset shown. (F) Purified 6His-Rab5B-SNAP preloaded with GDP or GMPPNP was bound to Ni-NTA beads and incubated with purified FHIP1B. Elutions were resolved on an sodium dodecyl sulfate–polyacrylamide gel electrophoresis (SDS–PAGE) gel. Representative image from three biological replicates is shown. (G) Indicated human Rab proteins tagged at the amino termini with EGFP were transiently expressed in 293T cells and immunoprecipitated with GFP nanonbody affinity resin (GFP-IP) in the presence of GTPγS. Immunoblots were probed with anti-FHIP1B and anti-GFP antibodies. Protein molecular weight markers are shown in kilo-Daltons to the left of each immunoblot. 3xHA-sfGFP provided a control (CTRL). Representative images from two biological replicates are shown.
-
Figure 5—source data 1
(F) Raw uncropped sodium dodecyl sulfate–polyacrylamide gel electrophoresis (SDS–PAGE) gel image from Figure 5F (Fig5F.scn) Relevant lanes are marked on the images.
(G) Raw uncropped immunoblot images from Figure 5G (Fig5G_FHIP1Binput.scn – anti-FHIP1B; Fig5G_FHIP1BIP.scn – anti-FHIP1B; Fig5G_GFP.scn – anti-GFP) probed with the indicated antibodies. Relevant lanes are marked on the images. Red lines outline the parts of the image used for figures.
- https://cdn.elifesciences.org/articles/74538/elife-74538-fig5-data1-v2.pdf
Figure 5—figure supplement 1
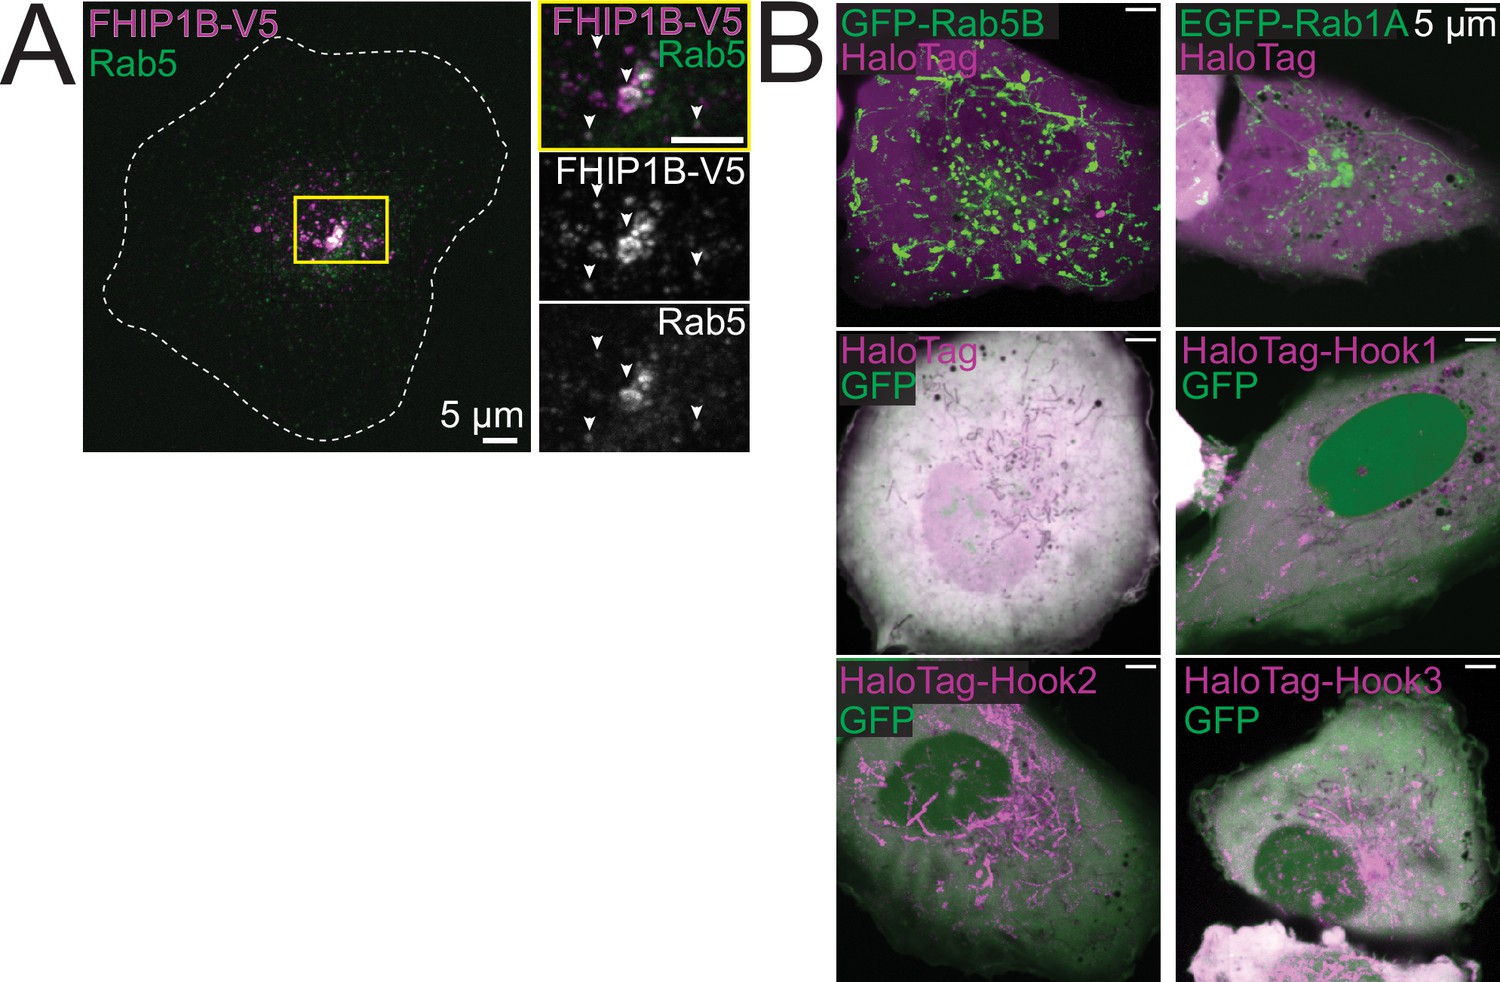
FHIP1B and Hook1/3 colocalize with Rab5.
(A) Z-projection of FHIP1B KO cells expressing FHIP1B-TagRFP-T-V5 and stained with V5 and Rab5-specific antibodies. Yellow rectangle denotes cropped region. (B) Single-plane time-lapse projections of U2OS cells expressing EGFP-Rab5B or EGFP-Rab1A and HaloTag-3XFLAG (control) tagged with Janelia Fluor (JF) 646 (top), or U2OS cells expressing cytoplasmic GFP and HaloTag-3XFLAG, HaloTag(JF646)-Hook1, HaloTag(JF646)-Hook2, or HaloTag(JF646)-Hook3.
Figure 6 with 3 supplements
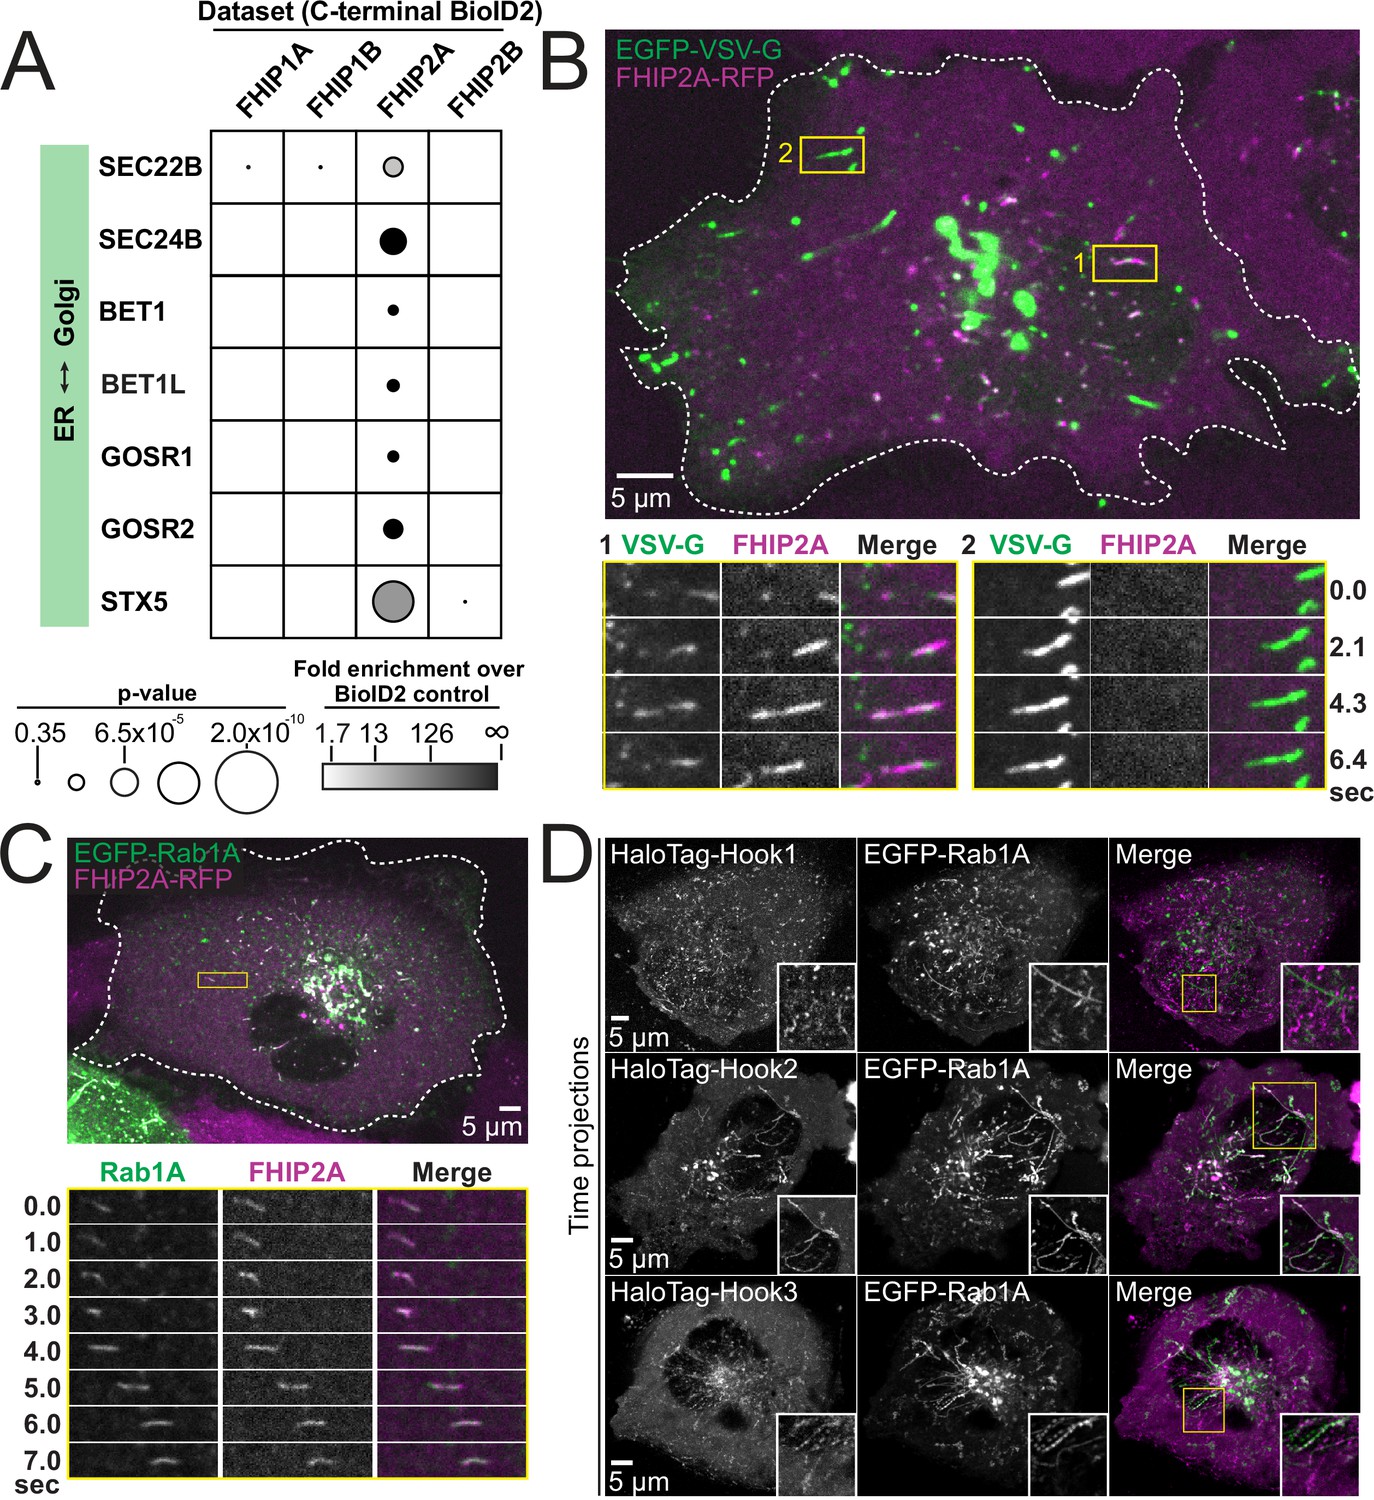
FHIP2A and Hook2 colocalize with Rab1A-associated ER-to-Golgi tubular intermediates.
(A) Fold-enrichment over cytoplasmic BioID2 control (grayscale intensity) and p value (circle size) for selected known ER-to-Golgi proteins identified in the indicated FHIP BioID2 datasets. (B) Single-plane confocal micrograph of FHIP2A KO U2OS cell expressing FHIP2A-TagRFP-T-V5 (FHIP2A-RFP) and temperature-sensitive EGFP-VSV-G following temperature shift from 40°C to 32°C. Yellow rectangle (1) and corresponding time-lapse montages denote EGFP-VSV-G tubule moving from the ER to the Golgi, while (2) denotes EGFP-VSV-G tubule moving from the Golgi to the plasma membrane. (C) Single-plane confocal micrograph of FHIP2A KO U2OS cell expressing FHIP2A-TagRFP-T-V5 (FHIP2A-RFP) and EGFP-Rab1A. Dotted line denotes cell edge and yellow rectangle denotes region of time-lapse montage below. (D) Single-plane time-lapse projections of U2OS cells expressing EGFP-Rab1A and HaloTag-Hook1 tagged with Janelia Fluor (JF) 646 (top), HaloTag(JF646)-Hook2 (middle), or HaloTag(JF646)-Hook3. Time-lapse movies obtained by triggered acquisition. Yellow rectangle denotes region of cropped inset shown.
Figure 6—figure supplement 1
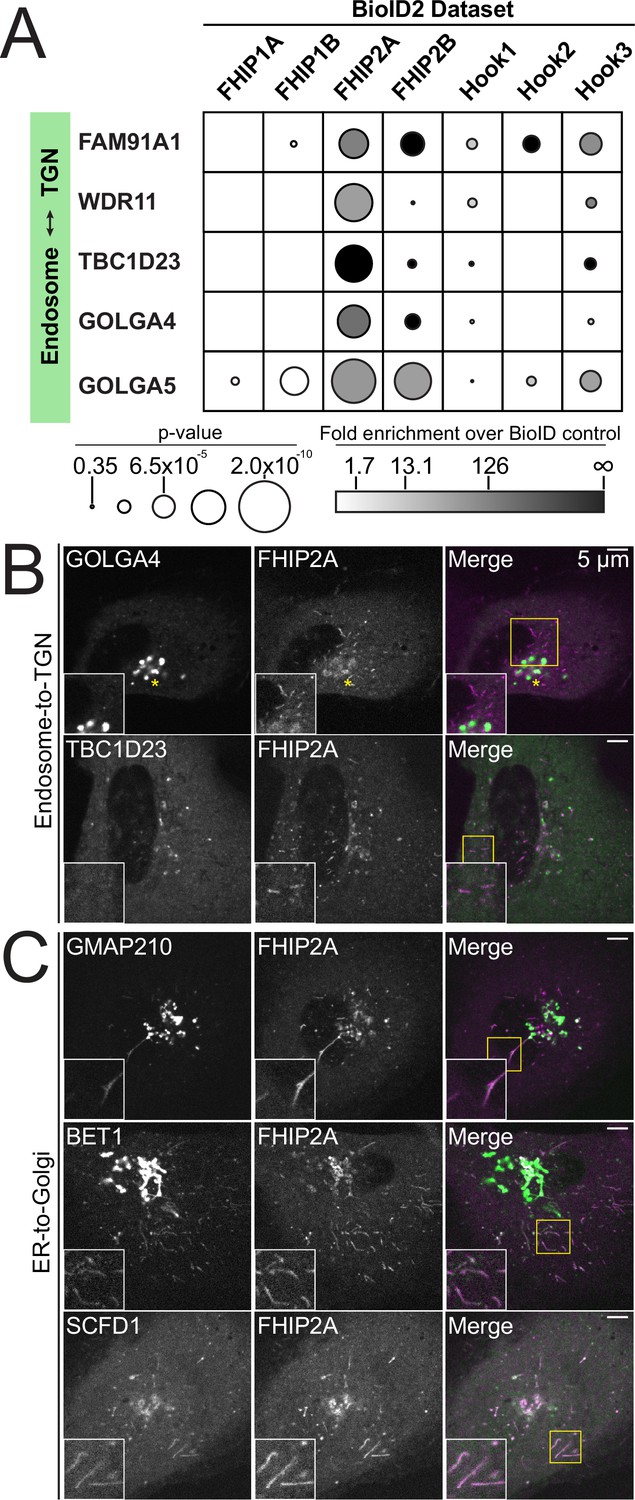
FHIP2A is involved in ER-to-Golgi but not endosome-to-TGN transport.
(A) Fold-enrichment over cytoplasmic BioID2 control (grayscale intensity) and p value (circle size) for selected known endosome-to-trans-Golgi-network (TGN) transport-associated proteins identified in the indicated carboxy-terminal FHIP BioID2 datasets. (B) Single-plane confocal micrographs of FHIP2A KO U2OS cells expressing FHIP2A-TagRFP-T-V5 (FHIP2A) and TBC1D23-GFP or EGFP-GOLGA4, two proteins important for endosome-to-Golgi transport identified in FHIP2A BioID dataset. Yellow rectangle denotes region of cropped inset shown. (C) Single-plane time-lapse projections of FHIP2A KO U2OS cells expressing FHIP2A-TagRFP-T-V5 (FHIP2A) and GFP-GMAP210, GFP-BET1, or GFP-SCFD1, proteins important for ER-to-Golgi transport identified in FHIP2A BioID dataset. Yellow rectangle denotes region of cropped inset shown.
Figure 6—figure supplement 2
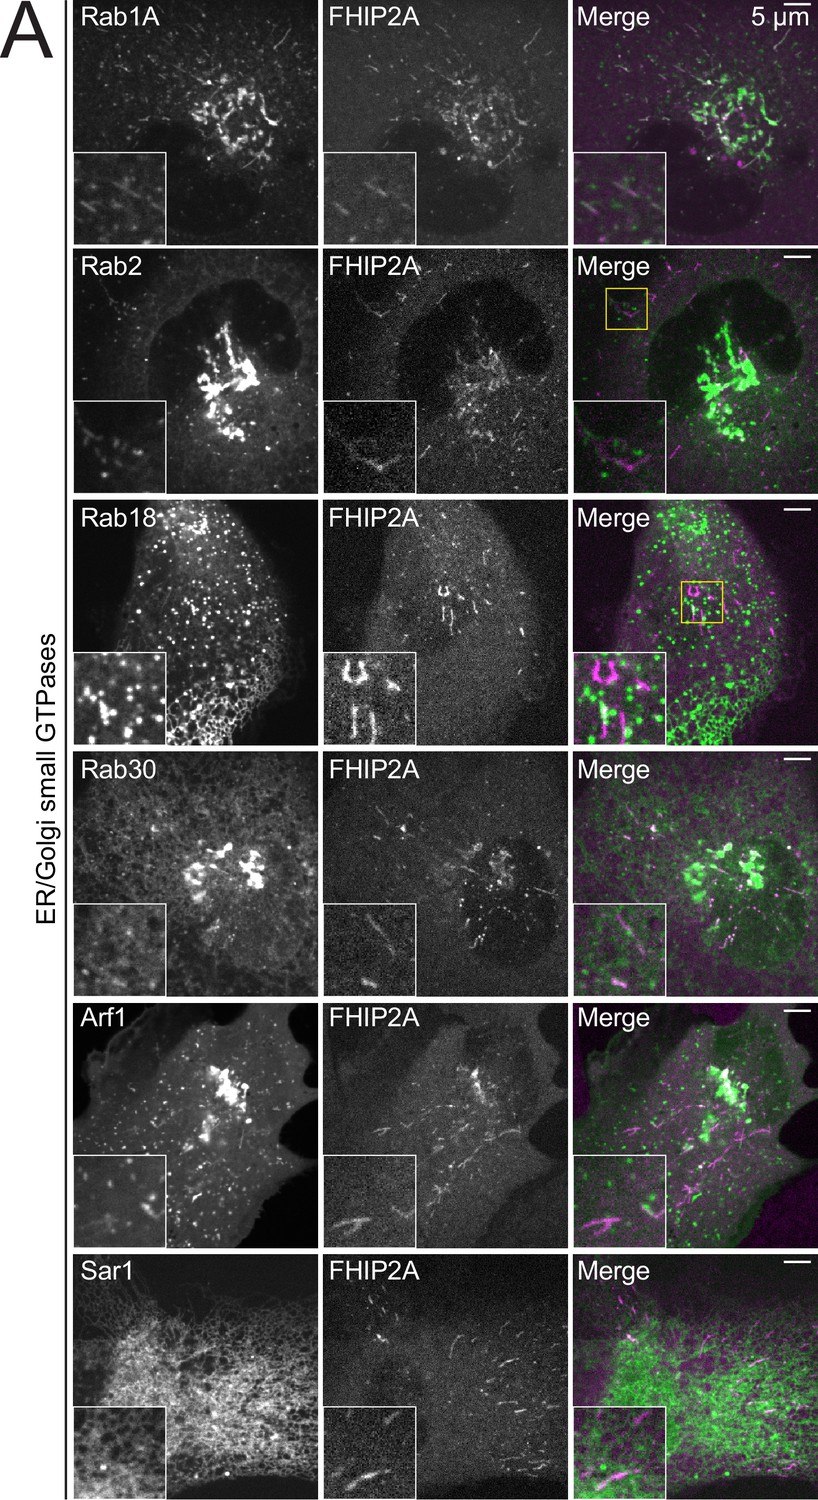
FHIP2A colocalizes with Rab1A.
(A) Single-plane confocal micrographs of FHIP2A KO U2OS cells expressing FHIP2A-TagRFP-T-V5 (FHIP2A) and EGFP-Rab1A, EGFP-Rab2, EGFP-Rab18, GFP-Rab30, Sar1-GFP, or Arf1-GFP, known or putative small GTPases associated with the ER or Golgi. Yellow rectangle denotes region of cropped inset shown.
Figure 6—figure supplement 3
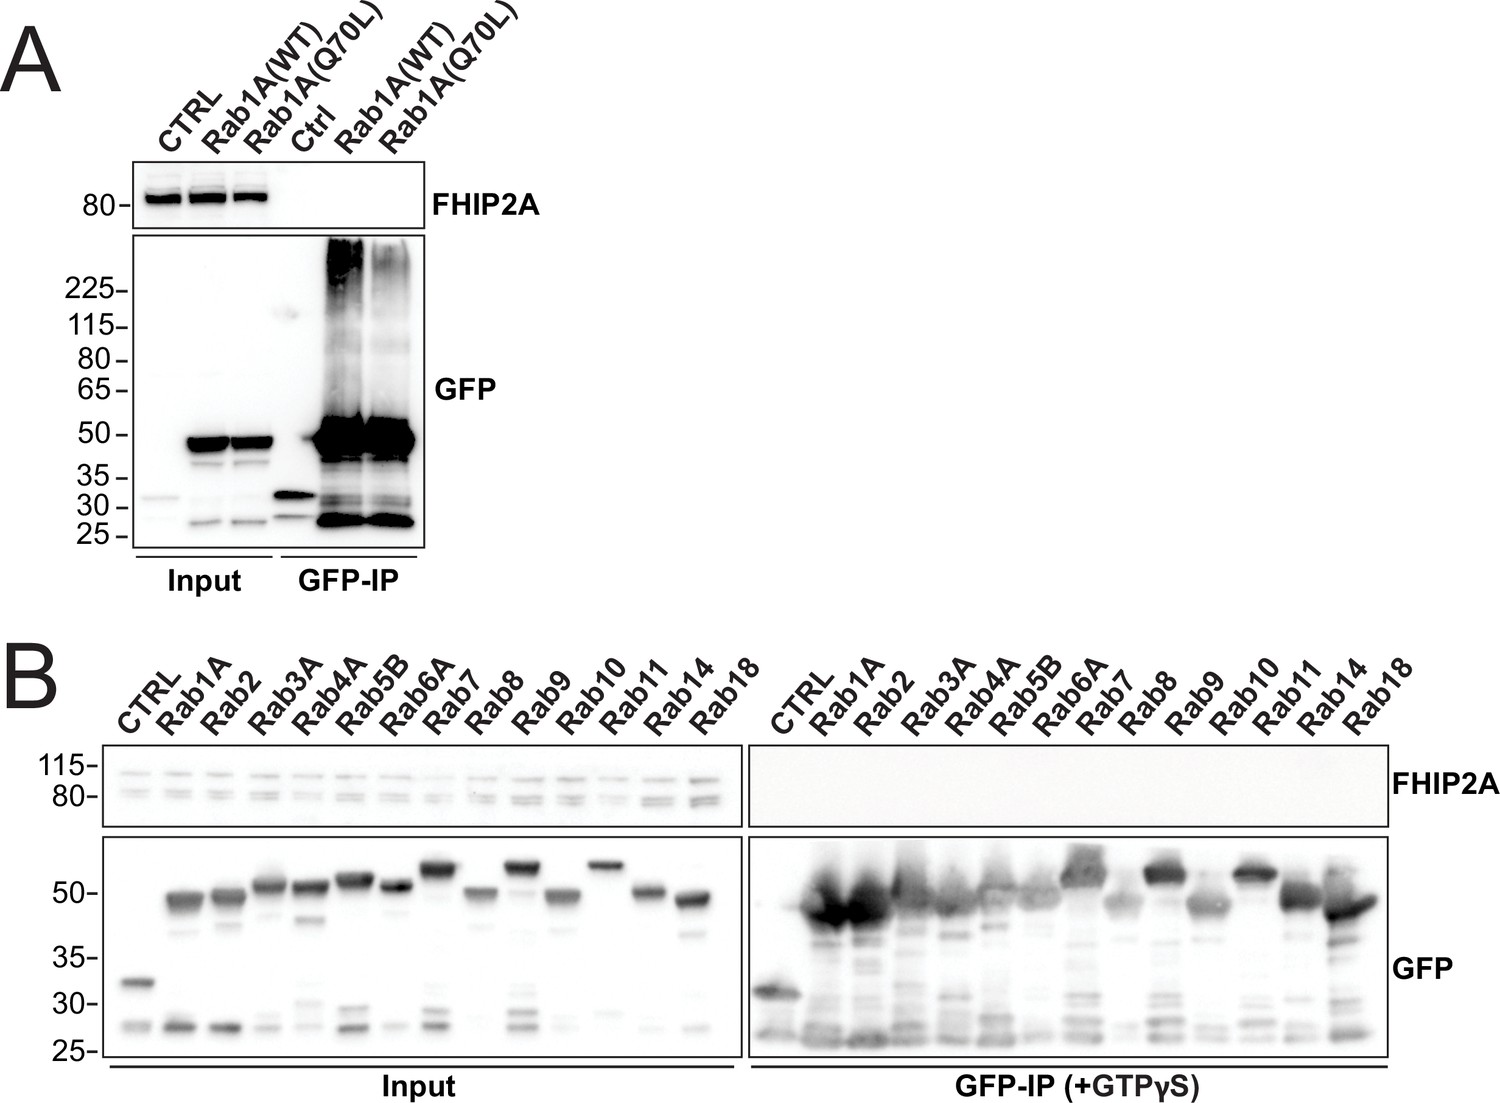
Screen for potential interactions between FHIP2A and Rab-GTPases.
(A) Human Rab1A proteins (wild type – WT or GTP-locked mutant Q80L) tagged at the amino termini with EGFP were transiently expressed in 293T cells and immunoprecipitated with GFP nanobody affinity resin (GFP-IP). Immunoblots were probed with anti-FHIP2A and anti-GFP antibodies. Protein molecular weight markers are shown in kilo-Daltons to the left of each immunoblot. 3xHA-sfGFP provided a control (CTRL). Representative images from three biological replicates are shown. (B) Indicated human Rab proteins tagged at the amino termini with EGFP were transiently expressed in 293T cells and immunoprecipitated with GFP nanobody affinity resin (GFP-IP) in the presence of GTPγS. Immunoblots were probed with anti-FHIP2A and anti-GFP antibodies. Protein molecular weight markers are shown in kilo-Daltons to the left of each immunoblot. 3xHA-sfGFP provided a control (CTRL). Representative image from two biological replicates is shown.
-
Figure 6—figure supplement 3—source data 1
(A) Raw uncropped immunoblot images from Figure 6—figure supplement 3A (Fig6supp3A_FHIP1B.scn – anti-FHIP1B; Fig6supp3A_GFP.scn– anti-GFP) probed with the indicated antibodies.
Relevant lanes are marked on the images. (B) Raw uncropped immunoblot images from Figure 6—figure supplement 3B (Fig5G_FHIP1BIP.scn – anti-FHIP2A; Fig5G_GFP.scn – anti-GFP) probed with the indicated antibodies. Relevant lanes are marked on the images. Red lines outline the parts of the image used for figures.
- https://cdn.elifesciences.org/articles/74538/elife-74538-fig6-figsupp3-data1-v2.pdf
Figure 7 with 1 supplement
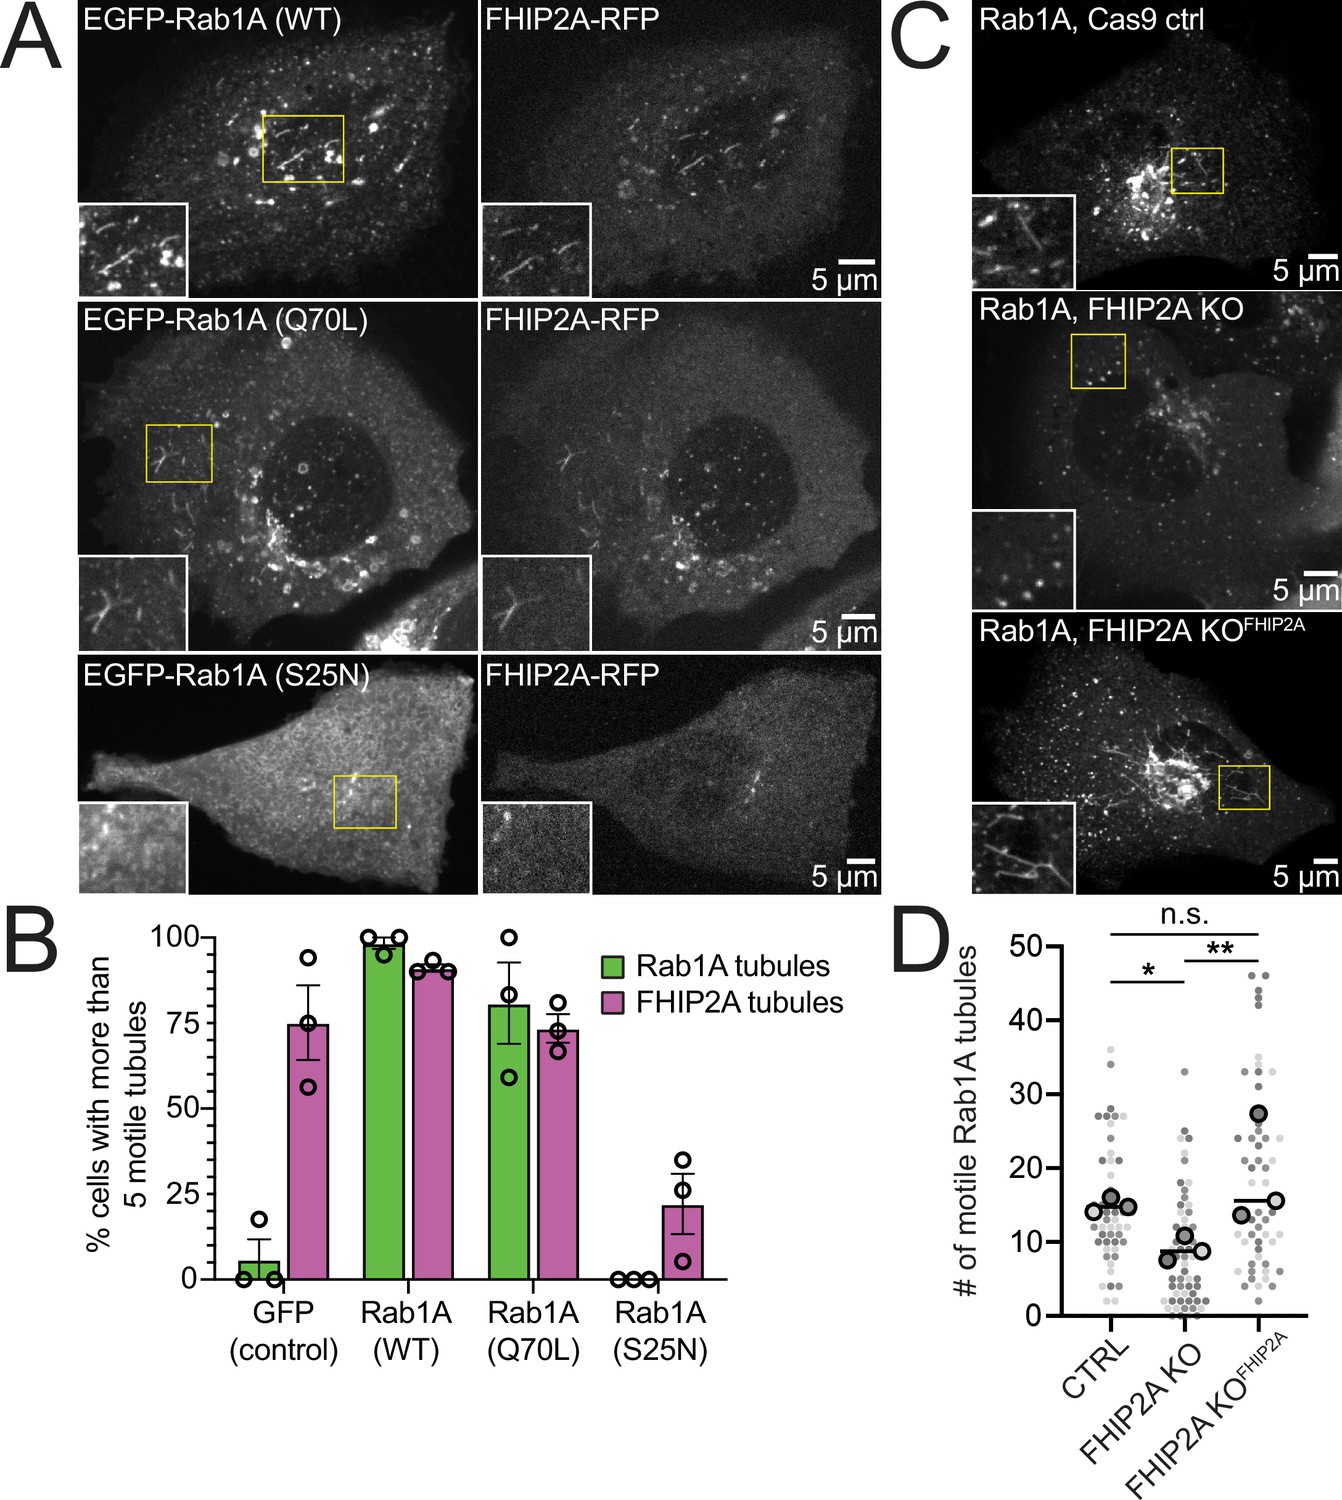
FHIP2A affects Rab1A-associated tubule formation.
(A) Single-plane confocal micrographs of FHIP2A KO U2OS cells expressing FHIP2A-TagRFP-T-V5 (FHIP2A-RFP, right panels) and EGFP-Rab1A (WT) (top), EGFP-Rab1A (Q70L) (middle), or EGFP-Rab1A (S25N) (bottom, left panels). Yellow rectangles denote region of cropped inset. (B) Quantification of percentage of cells expressing more than five motile GFP/EGFP-Rab1A-positive (green) or FHIP2A-RFP positive (magenta) tubules. Error bars = mean ± SEM. N = 53 GFP (control), 55 EGFP-Rab1A (WT), 61 EGFP-Rab1A (Q70L), and 62 EGFP-Rab1A (S25N)-expressing cells from three biological replicates. Open circles denote mean of each biological replicate. (C) Single-plane confocal micrographs of EGFP-Rab1A(WT) (Rab1A) in Cas9 control cells expressing cytoplasmic TagRFP-T (top), FHIP2A KO cells expressing cytoplasmic TagRFP-T (middle), or FHIP2A KO cells expressing FHIP2A-TagRFP-T-V5 (bottom). TagRFP-T panels not shown. (D) Quantification of the number of motile Rab1A tubules in Cas9 control cells expressing cytoplasmic TagRFP-T (Ctrl), FHIP2A KO cells expressing cytoplasmic TagRFP-T (FHIP2A KO), or FHIP2A KO cells expressing FHIP2A-TagRFP-T-V5 (FHIP2A KOFHIP2A). Bold line denotes median. Bolded circles denote means for each biological replicate. Differently shaded circles correspond to individual datapoints for cells from different biological replicates. N = 55 Cas9 control, 59 FHIP2A KO, and 54 FHIP2A KOFHIP2A. Cells from three biological replicates. *p=0.0001, **p=<0.0001. Kruskal–Wallis with Dunn’s post hoc test for multiple comparisons.
Figure 7—figure supplement 1
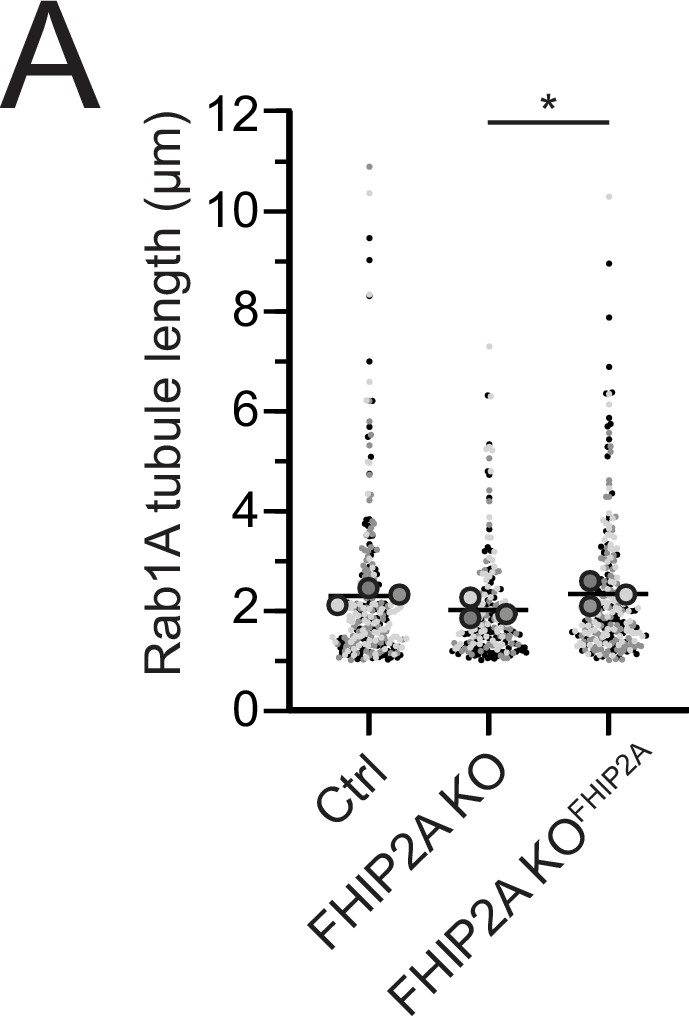
Motile Rab1A tubule length in control, FHIP2A knockout, and FHIP2A rescue cells.
(A) Quantification of tubule length of motile Rab1A tubules in Cas9 control cells expressing cytoplasmic TagRFP-T (Ctrl), FHIP2A KO cells expressing cytoplasmic TagRFP-T (FHIP2A KO), or FHIP2A KO cells expressing FHIP2A-TagRFP-T-V5 (FHIP2A KOFHIP2A). Line denotes mean. Bolded circles denote means for each biological replicate. Differently shaded circles correspond to individual datapoints for cells from different biological replicates. N = 55 Cas9 control cells (258 motile tubules), 59 FHIP2A KO cells (219 motile tubules), and 54 FHIP2A KOFHIP2A cells (251 motile tubules) from three biological replicates.*p=0.0256 Kruskal–Wallis with Dunn’s post hoc test for multiple comparisons.
Figure 8
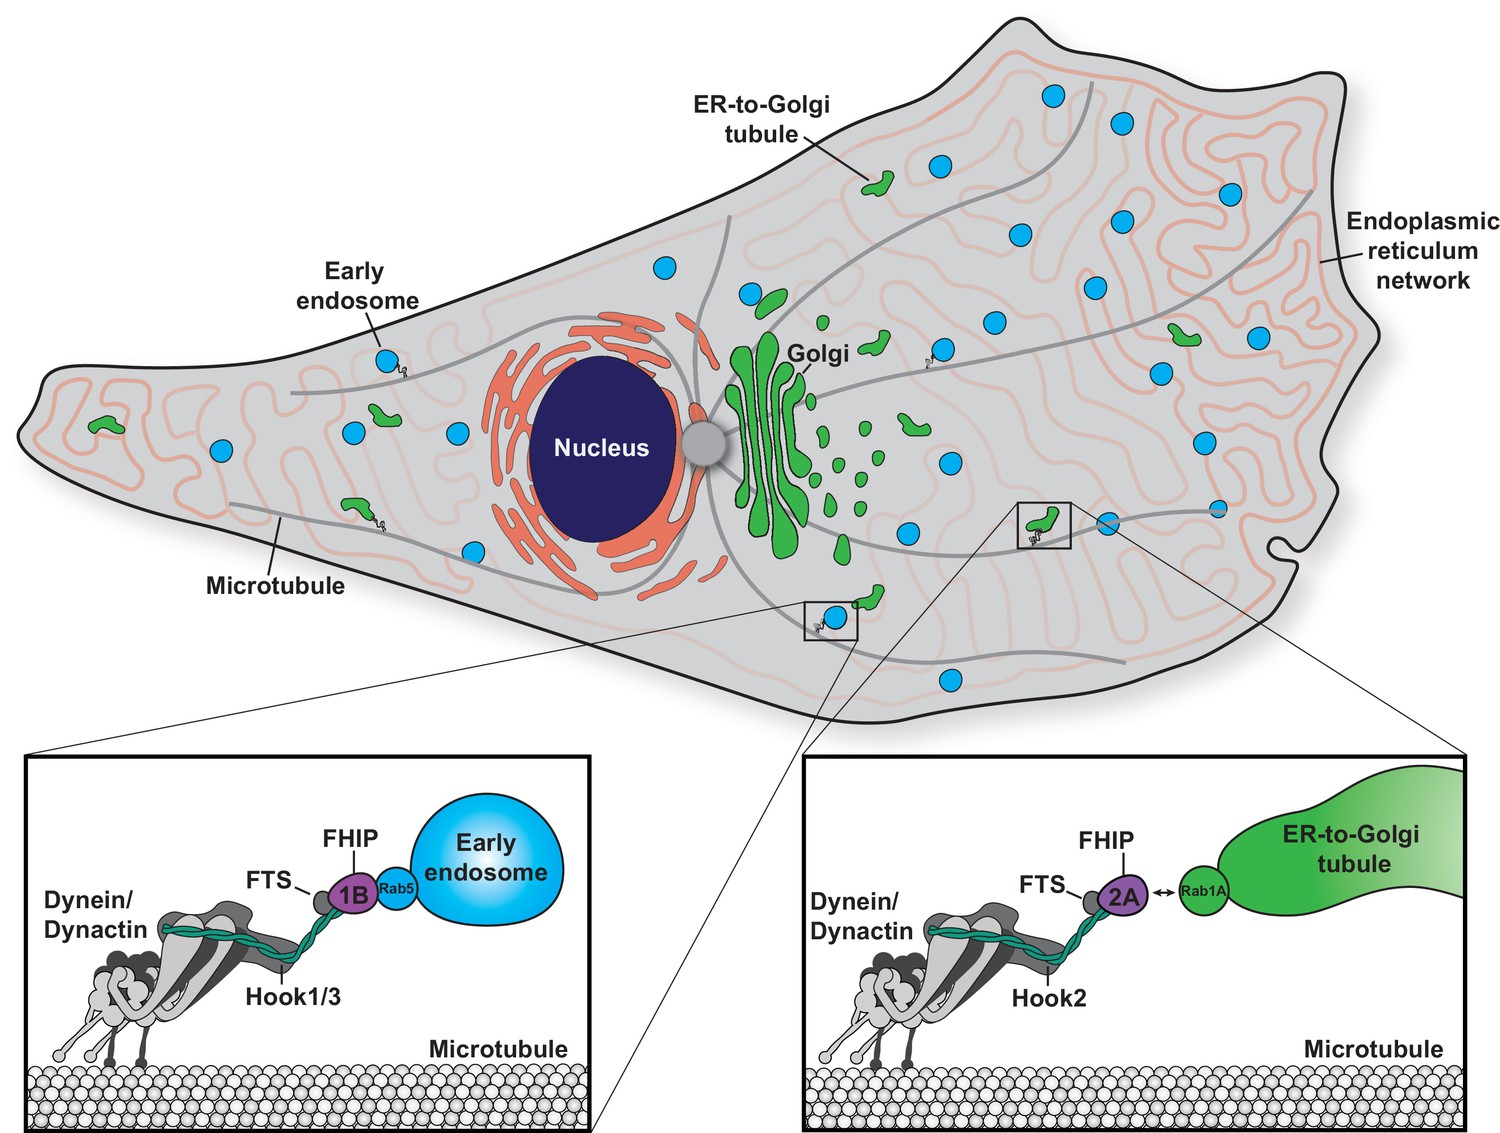
Model of the biological functions of distinct FHF complexes.
Dynein/dynactin associates with each FHF complex via a direct interaction with a Hook protein. The FHF complex composed of FTS, Hook1 and/or Hook3, and FHIP1B links dynein/dynactin with early endosomes via a direct interaction between FHIP1B and Rab5. The FHF complex composed of FTS, Hook2, and FHIP2A links dynein/dynactin to Rab1A-associated ER-to-Golgi tubular transport intermediates.
Videos
Video 1
FHIP1B and FHIP2A localize to motile cargos with different morphologies.
Live-cell spinning-disk confocal microscopy of FHIP1B KO U2OS cells expressing FHIP1B-TagRFP-T-V5 (FHIP1B) or FHIP2A KO U2OS cells expressing FHIP2A-TagRFP-T-V5 (FHIP2A). Dotted lines denote cell outline.
Video 2
FHIP1B and FHIP2A move along microtubules.
Live-cell sequential acquisition spinning-disk confocal microscopy of FHIP1B KO U2OS cells expressing FHIP1B-TagRFP-T-V5 (FHIP1B-RFP, magenta) and mEmerald-Tubulin (green) or FHIP2A KO U2OS cells expressing FHIP2A-TagRFP-T-V5 (FHIP2A-RFP, magenta) and mEmerald-Tubulin (green).
Video 3
FHIP1B colocalizes with early endosomes.
Live-cell simultaneous acquisition spinning-disk confocal microscopy of FHIP1B KO U2OS cells expressing FHIP1B-TagRFP-T-V5 (FHIP1B, left panel, magenta in merge) and GFP-Rab5B (Rab5B, middle panel, green in merge).
Video 4
Hook1 colocalizes with Rab5B early endosomes.
Live-cell triggered acquisition spinning-disk confocal microscopy of U2OS cells expressing GFP-Rab5B (Rab5B, left panel, green in merge) and HaloTag-Hook1(JF646) (Hook1, middle panel, magenta in merge).
Video 5
Hook2 does not colocalize with Rab5B early endosomes.
Live-cell triggered acquisition spinning-disk confocal microscopy of U2OS cells expressing GFP-Rab5B (Rab5B, left panel, green in merge) and HaloTag-Hook2(JF646) (Hook2, middle panel, magenta in merge).
Video 6
Hook3 colocalizes with Rab5B early endosomes.
Live-cell triggered acquisition spinning-disk confocal microscopy of U2OS cells expressing GFP-Rab5B (Rab5B, left panel, green in merge) and HaloTag-Hook3(JF646) (Hook3, middle panel, magenta in merge).
Video 7
FHIP2A colocalizes with a subset of VSV-G cargo.
Live-cell sequential acquisition spinning-disk confocal microscopy of FHIP2A KO U2OS cell expressing FHIP2A-TagRFP-T-V5 (FHIP2A) and temperature-sensitive EGFP-VSV-G (VSV-G) following temperature shift from 40 to 32°C. In each of the two crops on righthand side, the top panel shows the VSV-G channel, the middle panel shows the FHIP2A channel, and the bottom panel shows the merge. The yellow rectangle and top crop series denote an EGFP-VSV-G tubule moving from the ER to the Golgi. The white rectangle and bottom crop series denote an EGFP-VSV-G tubule moving from the Golgi to the plasma membrane.
Video 8
Hook1 does not colocalize with Rab1A tubules.
Live-cell triggered acquisition spinning-disk confocal microscopy of U2OS cells expressing EGFP-Rab1A (Rab1A, left panel, green in merge) and HaloTag-Hook1(JF646) (Hook1, middle panel, magenta in merge).
Video 9
Hook2 colocalizes with Rab1A tubules.
Live-cell triggered acquisition spinning-disk confocal microscopy of U2OS cells expressing EGFP-Rab1A (Rab1A, left panel, green in merge) and HaloTag-Hook2(JF646) (Hook2, middle panel, magenta in merge).
Video 10
Hook3 partially colocalizes with Rab1A tubules.
Live-cell triggered acquisition spinning-disk confocal microscopy of U2OS cells expressing EGFP-Rab1A (Rab1A, left panel, green in merge) and HaloTag-Hook3(JF646) (Hook3, middle panel, magenta in merge).
Video 11
FHIP2A has a functional relationship with Rab1A.
Live-cell triggered acquisition spinning-disk confocal microscopy of FHIP2A KO U2OS cells expressing FHIP2A-TagRFP-T-V5 (FHIP2A-TagRFPT, middle panels, magenta in merge) and EGFP-Rab1A (WT) (top), EGFP-Rab1A (Q70L) (middle), or EGFP-Rab1A (S25N) (bottom, left panels, green in merge).
Video 12
FHIP2A affects Rab1A tubule motility.
Live-cell spinning-disk confocal microscopy of EGFP-Rab1A(WT) in Cas9 control cells expressing cytoplasmic TagRFP-T (EGFP-Rab1A, Cas9 ctrl, left), FHIP2A KO cells expressing cytoplasmic TagRFP-T (EGFP-Rab1A, FHIP2A KO, middle), or FHIP2A KO cells expressing FHIP2A-TagRFP-T-V5 (EGFP-Rab1A, FHIP2A KOFHIP2A, right). TagRFP-T channels not shown.
Tables
Table 1
Plasmids used in this study.
| Plasmid | Source or reference | Addgene # (if applicable) |
|---|---|---|
| GFP-HA | This study | N/A |
| sfGFP-3XFLAG | Kendrick et al., 2019 | N/A |
| pMX-GFP | Cell Biolabs, Cat. #RTV-050 | N/A |
| 3XHA-Rab5A | This study | N/A |
| 3XHA-Rab5A (Q79L) | This study | N/A |
| 3XHA-Rab5A (N113I) | This study | N/A |
| 3XHA-Rab5B | This study | N/A |
| 3XHA-Rab5B (Q79L) | This study | N/A |
| 3XHA-Rab5B (S34N) | This study | N/A |
| 3XHA-Rab5C | This study | N/A |
| 3XHA-Rab5C (Q80L) | This study | N/A |
| 3XHA-Rab5C (S35N) | This study | N/A |
| EGFP-Rab1A | Marci Scidmore (Rzomp et al., 2003) | https://www.addgene.org/49467/ |
| EGFP-Rab1A(Q70L) | Marci Scidmore (Huang et al., 2010) | https://www.addgene.org/49537/ |
| EGFP-Rab1A(S25N) | Marci Scidmore (Huang et al., 2010) | https://www.addgene.org/49539/ |
| EGFP-Rab2 | Marci Scidmore (Huang et al., 2010) | https://www.addgene.org/49541/ |
| EGFP-Rab3A | Marci Scidmore (Huang et al., 2010) | https://www.addgene.org/49542/ |
| EGFP-Rab4A | Marci Scidmore (Rzomp et al., 2003) | https://www.addgene.org/49434/ |
| GFP-Rab5B | Gia Voeltz (Rowland et al., 2014) | https://www.addgene.org/61802/ |
| EGFP-Rab6A | Marci Scidmore (Rzomp et al., 2003) | https://www.addgene.org/49469/ |
| EGFP-Rab7 | Richard Pagano (Choudhury et al., 2002) | https://www.addgene.org/12605/ |
| EGFP-Rab8 | Marci Scidmore (Huang et al., 2010) | https://www.addgene.org/49543/ |
| EGFP-Rab9 | Richard Pagano (Choudhury et al., 2002) | https://www.addgene.org/12663/ |
| EGFP-Rab10 | Marci Scidmore (Rzomp et al., 2003) | https://www.addgene.org/49472/ |
| EGFP-Rab11 | Richard Pagano (Choudhury et al., 2002) | https://www.addgene.org/12674/ |
| EGFP-Rab14 | Marci Scidmore (Huang et al., 2010) | https://www.addgene.org/49549/ |
| EGFP-Rab18 | Marci Scidmore (Huang et al., 2010) | https://www.addgene.org/49550/ |
| EGFP-Rab30 | Marci Scidmore | https://www.addgene.org/49607/ |
| Arf1-GFP | Paul Melancon (Chun et al., 2008) | https://www.addgene.org/39554/ |
| pDEST47-Sar1-GFP | Richard Kahn | https://www.addgene.org/67409/ |
| pcDNA5-HaloTag-3xFLAG | Kendrick et al., 2019 | N/A |
| pcDNA5-HaloTag-Hook1-3xFLAG | This study | N/A |
| pcDNA5-HaloTag-Hook2-3xFLAG | This study | N/A |
| pcDNA5-HaloTag-Hook3-3xFLAG | Kendrick et al., 2019 | N/A |
| mEmerald-Tubulin-6 | Michael Davidson (Day and Davidson, 2009) | https://www.addgene.org/54291/ |
| pEGFP-VSVG | Jennifer Lippincott-Schwartz (Presley et al., 1997) | https://www.addgene.org/11912/ |
| BioID G2 | Kyle Roux (Kim et al., 2014) | N/A |
| pLenti_CMVRO3_FHIP1B_ TagRFPT-V5 | This study | N/A |
| pLenti_CMVRO3_FHIP2A_ TagRFPT-V5 | This study | N/A |
| TBC1D23-GFP | This study | N/A |
| EGFP-GOLGA4 | This study | N/A |
| GMAP210-HA-GFP | This study | N/A |
| BET1-GFP | This study | N/A |
| SCFD1-HA-GFP | This study | N/A |
| pSpCas9(BB)–2A-Puro (PX459) V2.0 | Feng Zhang | https://www.addgene.org/62988/ |
| His-Rab5B(A15-G191) | Cheryl Arrowsmith | https://www.addgene.org/25251/ |
| 6xHis-SNAP-Rab5B(A2-G191) | This study | N/A |
| pDyn3 | Schlager et al., 2014 | N/A |
| pcDNA5-p62-HaloTag-3xFLAG | Redwine et al., 2017 | N/A |
| pFastBac-Hook2-HaloTag-TEV-ZZ | This study | N/A |
| pFastBac-Hook3-HaloTag-TEV-ZZ | This study | N/A |
| pBIG-ZZ-TEV-HaloTag-FHIP2A-3xFLAG-FTS | This study | N/A |
| pFastBac-FHIP1B-HaloTag-TEV-ZZ | This study | N/A |
| pLIB-3xFLAG-SNAP-FTS | This study | N/A |
| pFastBac-ZZ-TEV-Lis1 | Baumbach et al., 2017 | N/A |
| pOPINE GFP-nanobody-6xHis | Brett Collins | https://www.addgene.org/49172/ |
Additional files
-
Supplementary file 1
BioID2 mass spectrometry datasets.
All BioID2 mass spectrometry data referenced in the manuscript in Figure 1C, Figure 1—figure supplement 1B, C, Figures 2A, 5A and 6A, and Figure 6—figure supplement 1A. The first five tabs correspond to the FHIP1A, FHIP1B, FHIP2A, FHIP2B, and Hook2 carboxy-terminal BioID2 datasets from this study. The sixth and seventh tabs are the Hook1 and Hook3 carboxy-terminal datasets from Redwine et al., 2017 for comparison.
- https://cdn.elifesciences.org/articles/74538/elife-74538-supp1-v2.xlsx
-
Supplementary file 2
Gene ontology (GO) analysis for FHIP BioID2 datasets.
The results of GO searches using GOrilla (Eden et al., 2009; Eden et al., 2007). Enriched GO terms were identified by using the Homo sapiens database and by comparing two unranked lists of genes, using any significant hits in each dataset as the ‘Target set’ and any nonsignificant hits in the same dataset as the ‘Background set’ and searching for GO terms for process, function, and component. Standard search parameters (p value threshold of 10−3) were used. Each tab corresponds to the component, function, or process search results for one FHIP carboxy-terminal dataset.
- https://cdn.elifesciences.org/articles/74538/elife-74538-supp2-v2.xlsx
-
Supplementary file 3
Comparison between the different FHIP and Hook BioID2 mass spectrometry datasets.
The first tab corresponds to the comparison between FHIP1A, FHIP1B, FHIP2A, and FHIP2B carboxy-terminal BioID2 datasets shown in a Venn diagram in Figure 1—figure supplement 1B. The following four tabs correspond to the comparison between individual FHIP carboxy-terminal BioID2 datasets with Hook carboxy-terminal BioID2 datasets shown in Figure 1—figure supplement 2. The Hook1 and Hook3 carboxy-terminal datasets are from Redwine et al., 2017.
- https://cdn.elifesciences.org/articles/74538/elife-74538-supp3-v2.xlsx
-
Transparent reporting form
- https://cdn.elifesciences.org/articles/74538/elife-74538-transrepform1-v2.pdf
Download links
A two-part list of links to download the article, or parts of the article, in various formats.
Downloads (link to download the article as PDF)
Open citations (links to open the citations from this article in various online reference manager services)
Cite this article (links to download the citations from this article in formats compatible with various reference manager tools)
Cytoplasmic dynein-1 cargo diversity is mediated by the combinatorial assembly of FTS–Hook–FHIP complexes
eLife 10:e74538.
https://doi.org/10.7554/eLife.74538


