CLUH controls astrin-1 expression to couple mitochondrial metabolism to cell cycle progression
- Institute for Genetics, University of Cologne, Germany
- Cologne Excellence Cluster on Cellular Stress Responses in Aging-Associated Diseases, University of Cologne, Germany
- Institute for Mitochondrial Diseases and Ageing, Medical Faculty, University of Cologne, Germany
- Center for Molecular Medicine, University of Cologne, Germany
- Max Planck Institute for Biology of Ageing, Germany
Figures
Figure 1 with 1 supplement

CLUH interacts with astrin-1 and kinastrin.
(A, B) Western blots of reciprocal co-IPs of endogenous CLUH, astrin, and kinastrin in HeLa cells. Two different antibodies have been used to pull down CLUH (1, 2). Asterisk marks IgG light chain. (C) Scheme of human SPAG5 cDNA with indicated UTRs and ORFs. Closeup shows positions of the uATG and ATG1–6 with surrounding Kozak sequences. (D, E) Western blots of HeLa cells overexpressing FLAG-tagged astrin constructs. Pan-actin was used as loading control. (F) Western blots of reciprocal co-IPs of endogenous CLUH and overexpressed FLAG-tagged astrin full length (ATG1-SPAG5) or a N-terminal deleted variant (Δ151-SPAG5) in WT and CLUH KO HeLa cells. Pan-actin was used as loading control for input samples. Asterisks indicate additional astrin bands appearing upon overexpression of the N-terminal deleted variant. (G) Confocal immunofluorescence pictures of HeLa cells overexpressing FLAG-tagged astrin-1 and astrin-2 (SPAG5), astrin-1 (ATG3 + 4 + 5GGG-SPAG5) or astrin-2 (ATG1GGG-SPAG5) alone stained for FLAG (green) and CLUH (red). DAPI was used to stain nuclei (blue). Small boxes in left corners show a ×4 magnified area of boxed regions. Scale bar, 10 µm. (H) Polysome profiling of HeLa cells chemically crosslinked with dithiobis succinimidyl propionate (DSP). At the top, absorbance profile at 254 nm of the fractions is shown with indicated peaks of 40S and 60S ribosomal subunits, 80S monosome and polysomes; at the bottom the corresponding western blots of the fractions are shown. RPL7 was used as a marker for ribosomes.
-
Figure 1—source data 1
Uncropped blots for Figure 1A,B,D,E, F.
- https://cdn.elifesciences.org/articles/74552/elife-74552-fig1-data1-v2.pdf
-
Figure 1—source data 2
Uncropped blots for Figure 1H.
- https://cdn.elifesciences.org/articles/74552/elife-74552-fig1-data2-v2.pdf
-
Figure 1—source data 3
Unedited blots for Figure 1A,B,D,E, F,H.
- https://cdn.elifesciences.org/articles/74552/elife-74552-fig1-data3-v2.zip
Figure 1—figure supplement 1
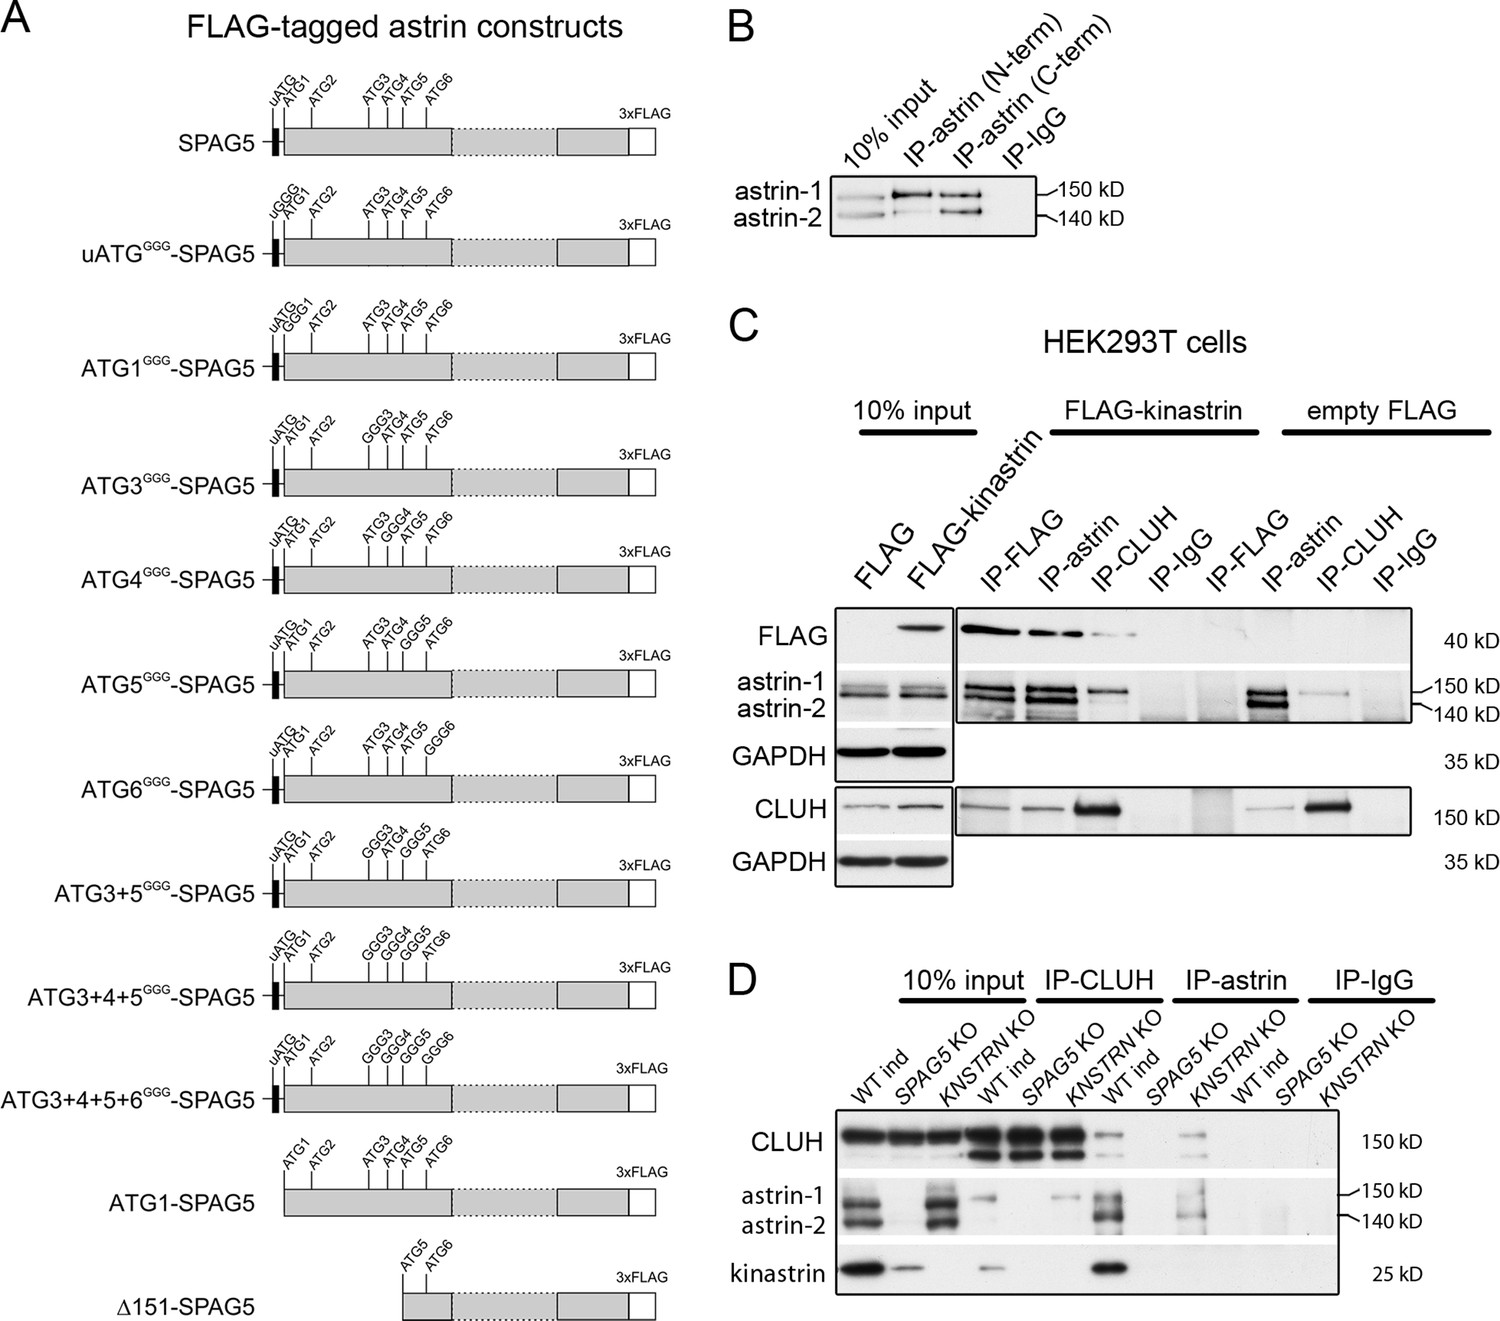
CLUH interacts with full-length astrin independently of kinastrin.
(A) Scheme of C-terminally FLAG-tagged astrin constructs used for overexpression in this study. Positions of ATGs and mutagenized ATGs are indicated. (B) Western blot of IP of endogenous astrin using antibodies binding N- or C-terminal epitopes of astrin in HeLa cells. (C) Western blots of reciprocal co-IPs in HEK293T cells stably overexpressing FLAG-kinastrin or empty FLAG using antibodies against endogenous CLUH, astrin, and overexpressed kinastrin. GAPDH was used as loading control for input samples. (D) Western blots of reciprocal co-IPs of endogenous CLUH and astrin in WT, SPAG5, and KNSTRN ind-KO HeLa cells.
-
Figure 1—figure supplement 1—source data 1
Uncropped blots for Figure 1—figure supplement 1B–D.
- https://cdn.elifesciences.org/articles/74552/elife-74552-fig1-figsupp1-data1-v2.pdf
-
Figure 1—figure supplement 1—source data 2
Unedited blots for Figure 1—figure supplement 1B–D.
- https://cdn.elifesciences.org/articles/74552/elife-74552-fig1-figsupp1-data2-v2.zip
Figure 2 with 1 supplement
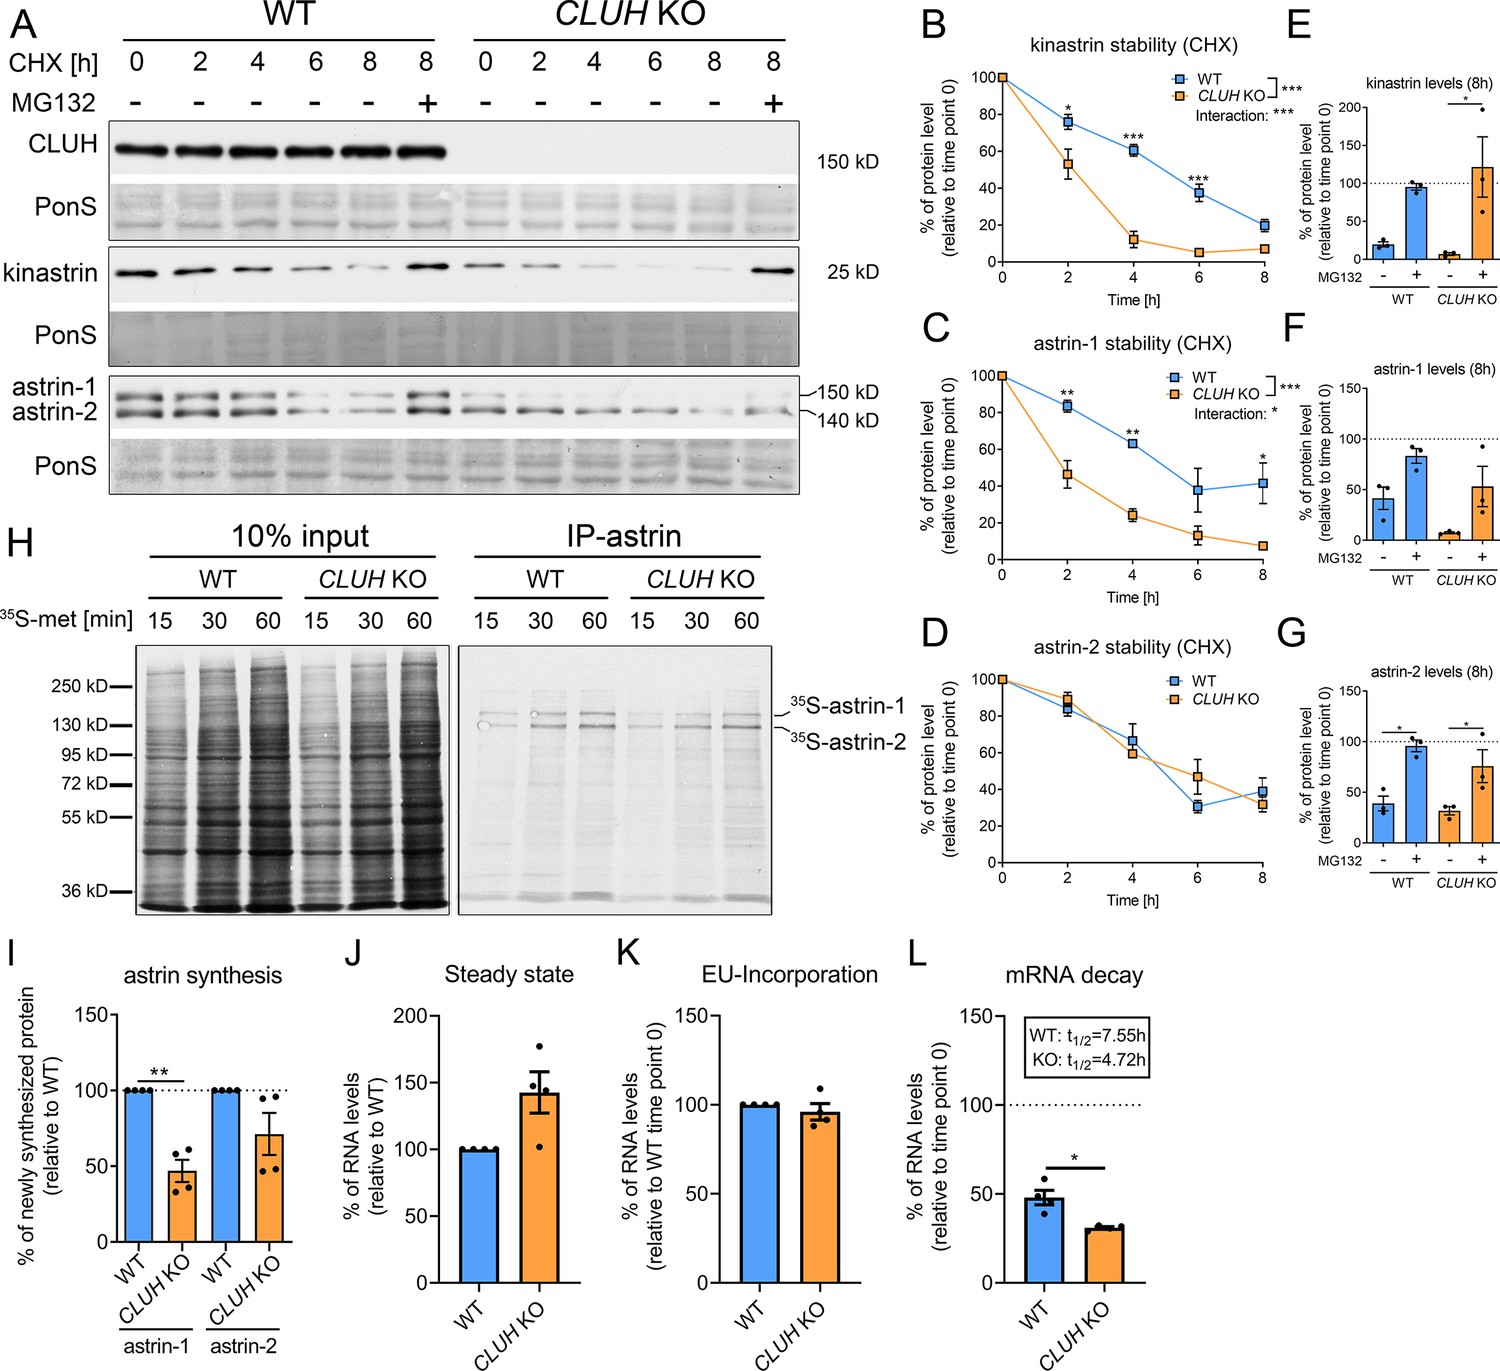
CLUH controls astrin-1 and kinastrin stability and astrin expression.
(A) Western blots of WT and CLUH KO HeLa cells treated with CHX for indicated time points with or w/o additional MG132 treatment. Ponceau S staining was used as loading control. (B–D) Quantification of CHX chase western blots as shown in A (n = 3 independent experiments). Two-way analysis of variance (ANOVA) with post hoc Tukey’s multiple comparison tests were performed with *p ≤ 0.05; **p ≤ 0.01; ***p ≤ 0.001. Genotype × time interaction significance is also shown. Error bars represent standard error of the mean (SEM). (E–G) Quantification of proteins levels after 8 hr CHX treatment of western blots as shown in A (n = 3 independent experiments). Bars show the mean ± SEM. Dotted lines indicate protein levels at 0 hr time points. One-way ANOVA with post hoc Tukey’s multiple comparison tests were performed with *p ≤ 0.05. (H) Autoradiograms of IP of newly synthesized astrin labeled with 35S-methionine for indicated time points in WT and CLUH KO HeLa cells. (I) Quantification of immunoprecipitated newly synthesized astrin after 60 min labeling of experiments as shown in H (n = 4 independent experiments). Bars show the mean ± SEM. Two-tailed paired Student’s t-test was performed with **p ≤ 0.01. (J) Steady-state mRNA levels of SPAG5 in WT and CLUH KO HeLa cells (n = 4 independent experiments). Bars show mean ± SEM. RPL13 levels have been used for normalization. Levels of EU-incorporation (K) and mRNA decay (L) of SPAG5 mRNA in WT and CLUH KO HeLa cells after specific labeling and pull down of newly synthesized RNA (n = 4 independent experiments). GAPDH levels have been used for normalization. Calculated half-lives are indicated. Bars show the mean ± SEM. Two-tailed paired Student’s t-test was performed with *p ≤ 0.05.
-
Figure 2—source data 1
Uncropped blots for Figure 2A,H.
- https://cdn.elifesciences.org/articles/74552/elife-74552-fig2-data1-v2.pdf
-
Figure 2—source data 2
Unedited blots for Figure 2A, H.
- https://cdn.elifesciences.org/articles/74552/elife-74552-fig2-data2-v2.zip
Figure 2—figure supplement 1
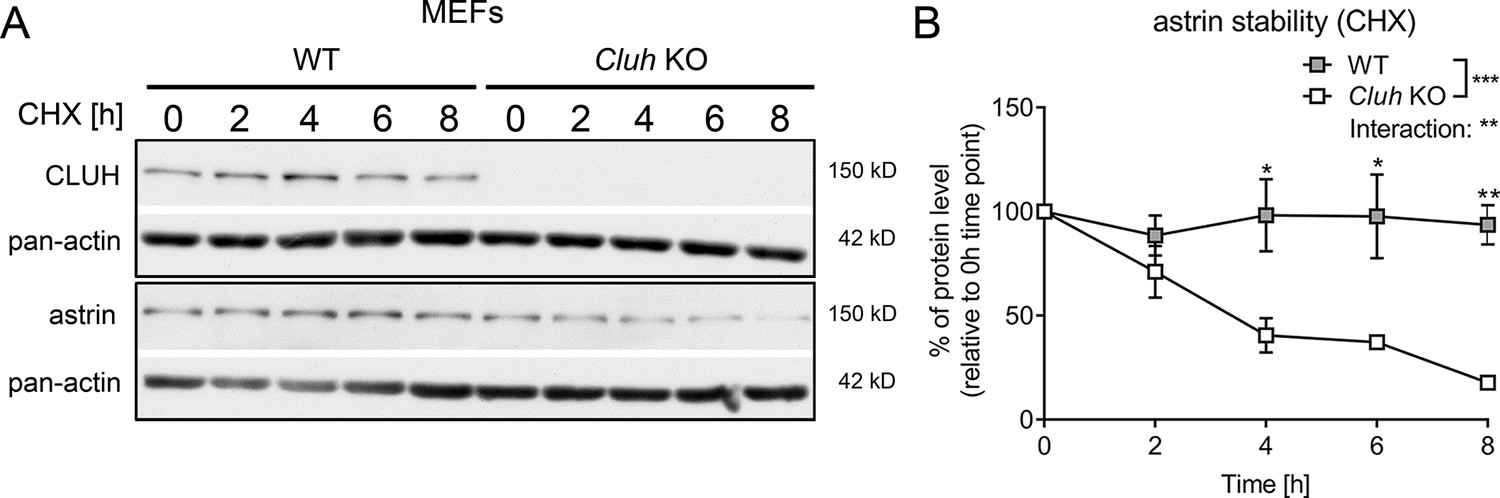
Astrin is unstable in Cluh KO MEFs.
(A) Western blots of CHX chase in WT and Cluh KO MEFs treated for indicated time points. Pan-actin staining was used as loading control. (B) Quantification of CHX chase western blots as shown in A (n = 3 independent experiments). Two-way analysis of variance (ANOVA) with post hoc Tukey’s multiple comparison test was performed with *p ≤ 0.05; **p ≤ 0.01; ***p ≤ 0.001. Genotype × time interaction significance is also shown. Graphs show mean ± standard error of the mean (SEM).
-
Figure 2—figure supplement 1—source data 1
Uncropped blots for Figure 2—figure supplement 1A.
- https://cdn.elifesciences.org/articles/74552/elife-74552-fig2-figsupp1-data1-v2.pdf
-
Figure 2—figure supplement 1—source data 2
Unedited blots for Figure 2—figure supplement 1A.
- https://cdn.elifesciences.org/articles/74552/elife-74552-fig2-figsupp1-data2-v2.zip
Figure 3 with 1 supplement
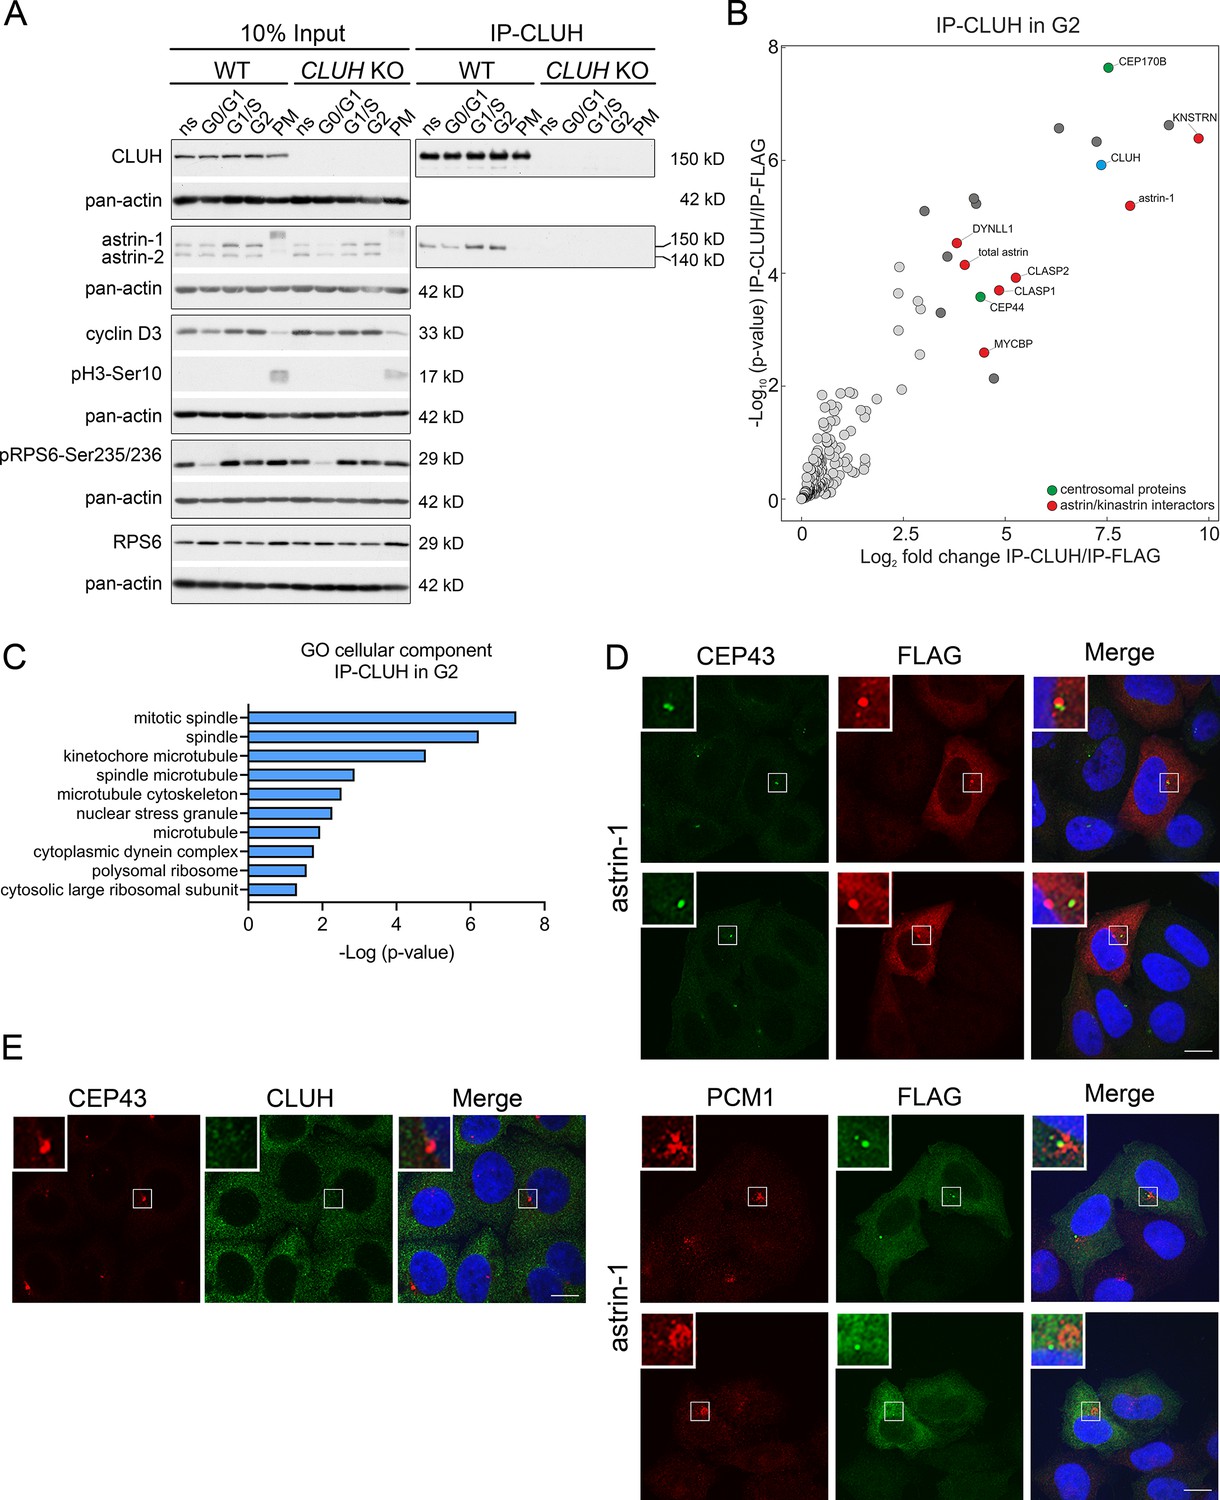
The astrin-1/CLUH complex is enriched in interphase.
(A) Western blots of co-IPs of endogenous CLUH in WT and CLUH KO HeLa cells. Cells have been synchronized as shown in Figure 3—figure supplement 1A. Pan-actin was used as loading control and cyclin D3 as G2 phase marker, pH3-Ser10 as M phase marker and pRPS6-Ser235/236 to assess effective starvation of input samples. (B) Enriched proteins immunoprecipitated with an antibody against endogenous CLUH in G2-synchronized HeLa cells and detected by mass spectrometry (n = 4 independent replicates). Highlighted are all proteins enriched with a log2FC ≥ 3 and q ≤ 0.05. Marked in green are centrosomal proteins; marked in red are previously identified astrin/kinastrin interactors. (C) GO cellular component analysis of enriched proteins highlighted in B analyzed using the EnrichR webtool. (D) Confocal immunofluorescence pictures of HeLa cells overexpressing FLAG-tagged astrin-1 (ATG3 + 4 + 5GGG-SPAG5) stained for CEP43 (green) and FLAG (red) or PCM1 (red) and FLAG (green). DAPI was used to stain nuclei (blue). Scale bar, 10 µm. Small boxes in left corners show a ×4 magnified area of boxed regions. (E) Confocal immunofluorescence pictures of HeLa cells stained for CEP43 (green) and CLUH (red). DAPI was used to stain nuclei (blue). Scale bar, 10 µm. Small boxes in left corners show a ×4 magnified area of boxed regions.
-
Figure 3—source data 1
Uncropped blots for Figure 3A.
- https://cdn.elifesciences.org/articles/74552/elife-74552-fig3-data1-v2.pdf
-
Figure 3—source data 2
Unedited blots for Figure 3A.
- https://cdn.elifesciences.org/articles/74552/elife-74552-fig3-data2-v2.zip
Figure 3—figure supplement 1
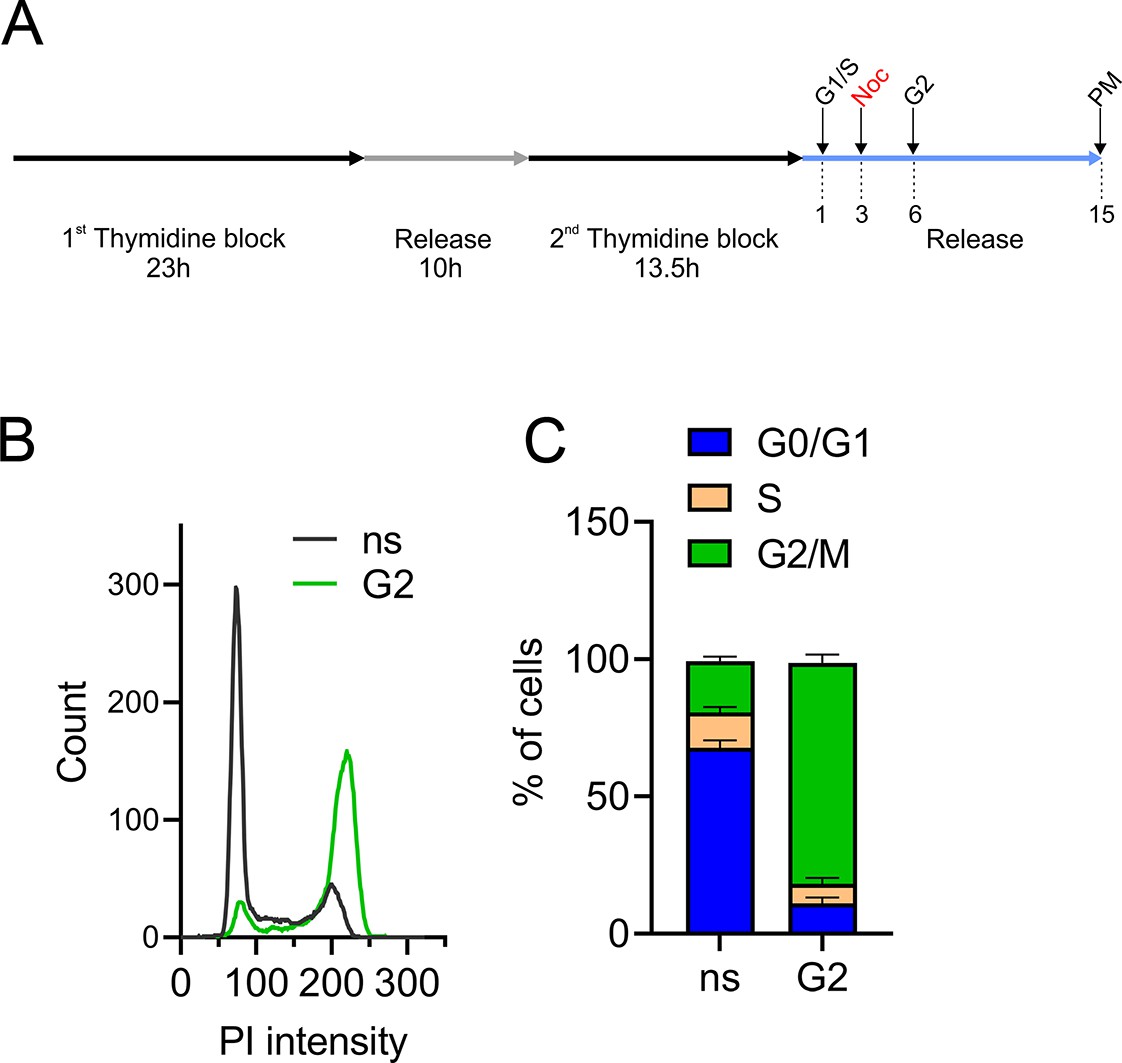
Controls of effective synchronization of immunoprecipitation (IP) samples.
(A) Synchronization protocol used for IP experiments. Cells enriched in G1/S and G2 were collected after 1 and 6 hr after release of the second thymidine block, respectively. Cells enriched in prometaphase (PM) were treated with nocodazole (noc) after 3 hr of release and collected after additional 12 hr. Propidium iodide (PI) intensity profiles (B) and cell cycle distribution analysis (C) of nonsynchronized (ns) or G2-enriched WT cells used for IP followed by mass spectrometry (n = 4 independent replicates).
Figure 4 with 1 supplement
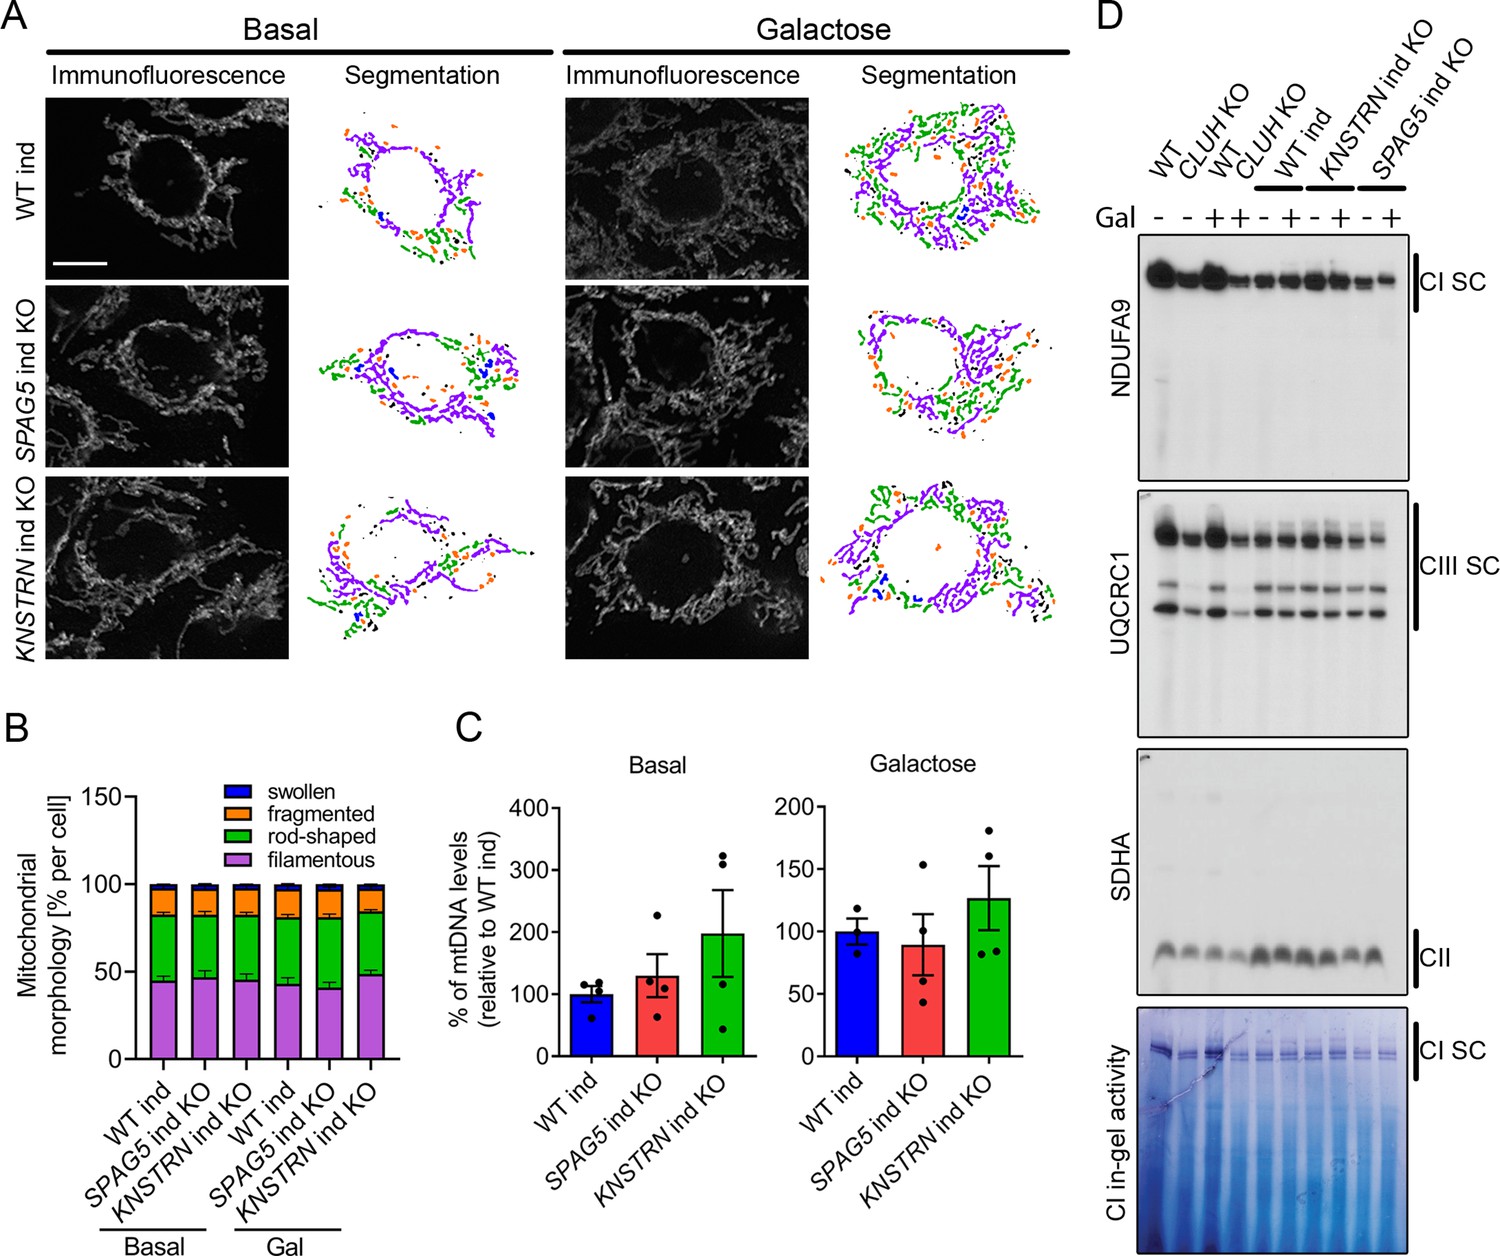
Astrin and kinastrin depletion does not mimic mitochondrial phenotypes seen upon absence of CLUH.
(A) Mitochondrial network of WT, SPAG5, and KNSTRN ind-KO HeLa cells grown in basal or galactose media for 16 hr. Mitochondria were stained with an antibody against TOMM20. Scale bar, 10 µm. On the left side, confocal immunofluorescence pictures are shown, on the right side, mitochondrial network is shown after segmentation. Color code for different mitochondrial morphologies: purple: filamentous; green: rod-shaped; orange: fragmented; blue: swollen; black: unclassifiable. (B) Quantification of mitochondrial morphology of experiments as shown in A (n = 3 independent experiments; at least 66 in basal or 44 cells in galactose have been analyzed per genotype per replicate). Bars show the mean of each morphological class with standard error of the mean (SEM). (C) mtDNA levels of WT, SPAG5, and KNSTRN ind-KO HeLa cells grown in basal or galactose media for 16 hr (n = 4 independent experiments). Bars show mean ± SEM and dots represent values of individual replicates. (D) Blue native polyacrylamide gel electrophoresis (BN-PAGE) analysis of respiratory chain supercomplexes and complex I activity staining of isolated mitochondria of WT, CLUH KO and WT, SPAG5, and KNSTRN ind-KO HeLa cells grown in basal or galactose media for 16 hr.
-
Figure 4—source data 1
Uncropped blots for Figure 4D.
- https://cdn.elifesciences.org/articles/74552/elife-74552-fig4-data1-v2.pdf
-
Figure 4—source data 2
Unedited blots for Figure 4D.
- https://cdn.elifesciences.org/articles/74552/elife-74552-fig4-data2-v2.zip
Figure 4—figure supplement 1
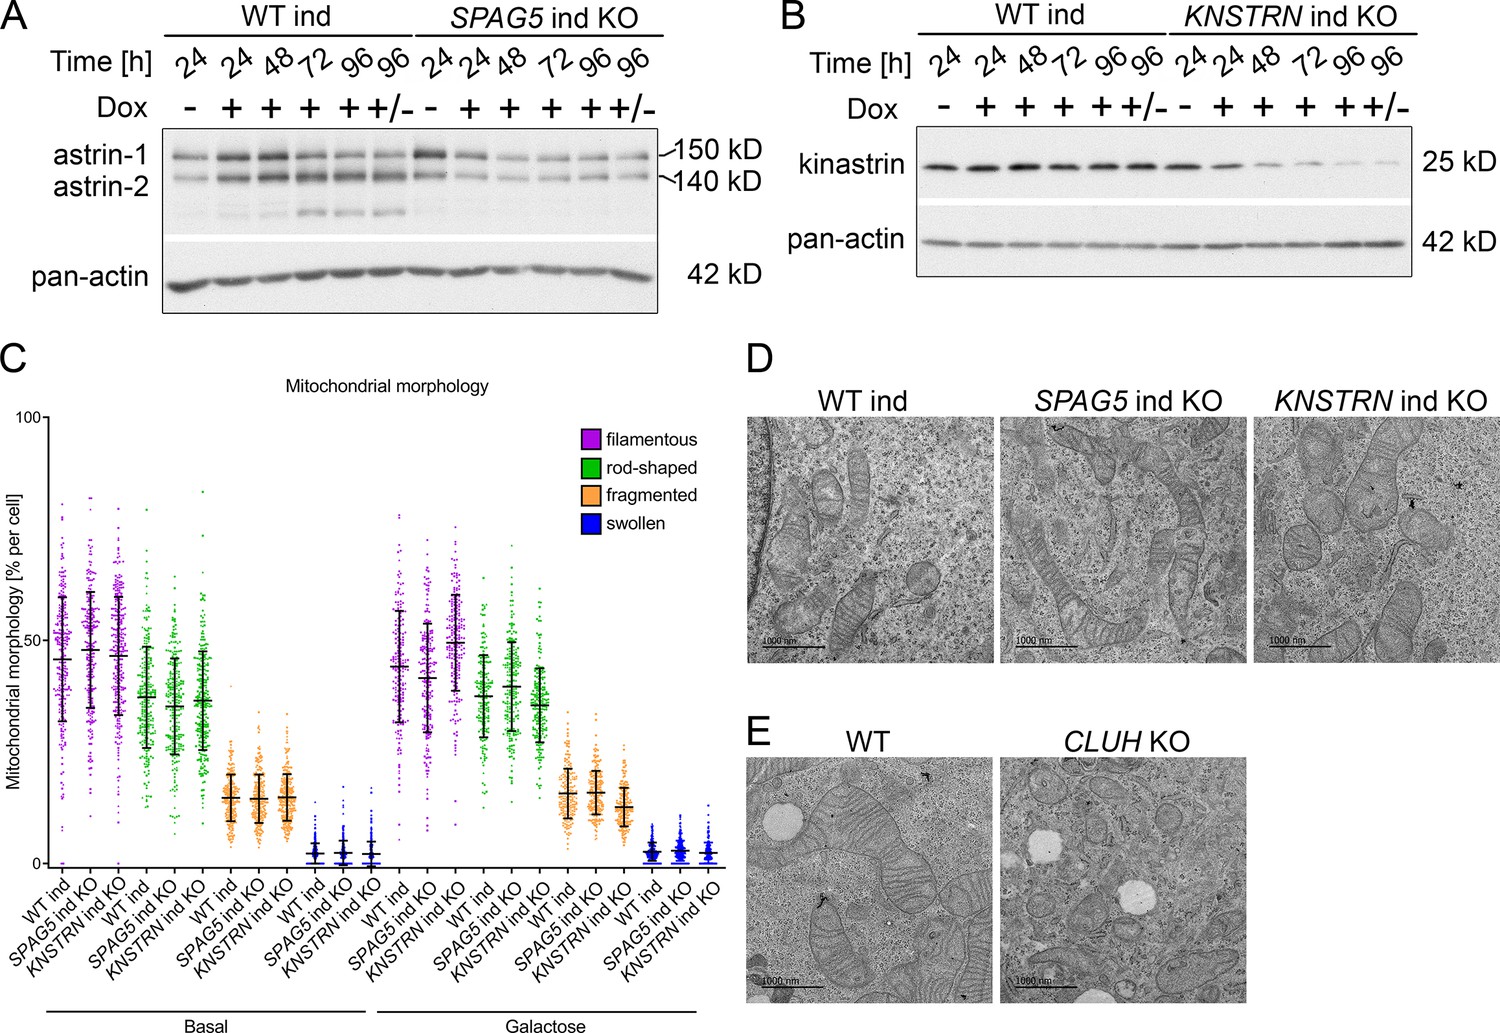
SPAG5 and KNSTRN ind KO HeLa cells show normal mitochondrial morphology.
Western blots of induction time course in WT and SPAG5 (A) or KNSTRN (B) ind-KO HeLa cells. Cells were treated with doxycycline for indicated time points.± means that cells were treated with doxycycline for 72 hr and not treated for the remaining 24 hr. Pan-actin was used as loading control. (C) Quantification of mitochondrial morphology of experiments shown in Figure 5A (n = 3 independent experiments; in total the following number of cells has been analyzed: basal: WT ind: 248, SPAG5 ind KO: 244, KNSTRN ind KO: 274; galactose: WT ind: 186, SPAG5 ind KO: 214, KNSTRN ind KO: 202). Scatter dots represent cells of all three replicates and symbols differ for cells belonging to different replicates. Graph shows mean ± standard deviation (SD). Representative electron micrographs of WT, SPAG5, and KNSTRN ind-KO (D) or WT and CLUH KO (E) HeLa cells. Scale bar, 1000 nm.
-
Figure 4—figure supplement 1—source data 1
Uncropped blots for Figure 4—figure supplement 1A, B.
- https://cdn.elifesciences.org/articles/74552/elife-74552-fig4-figsupp1-data1-v2.pdf
-
Figure 4—figure supplement 1—source data 2
Unedited blots for Figure 4—figure supplement 1A, B.
- https://cdn.elifesciences.org/articles/74552/elife-74552-fig4-figsupp1-data2-v2.zip
Figure 5 with 2 supplements
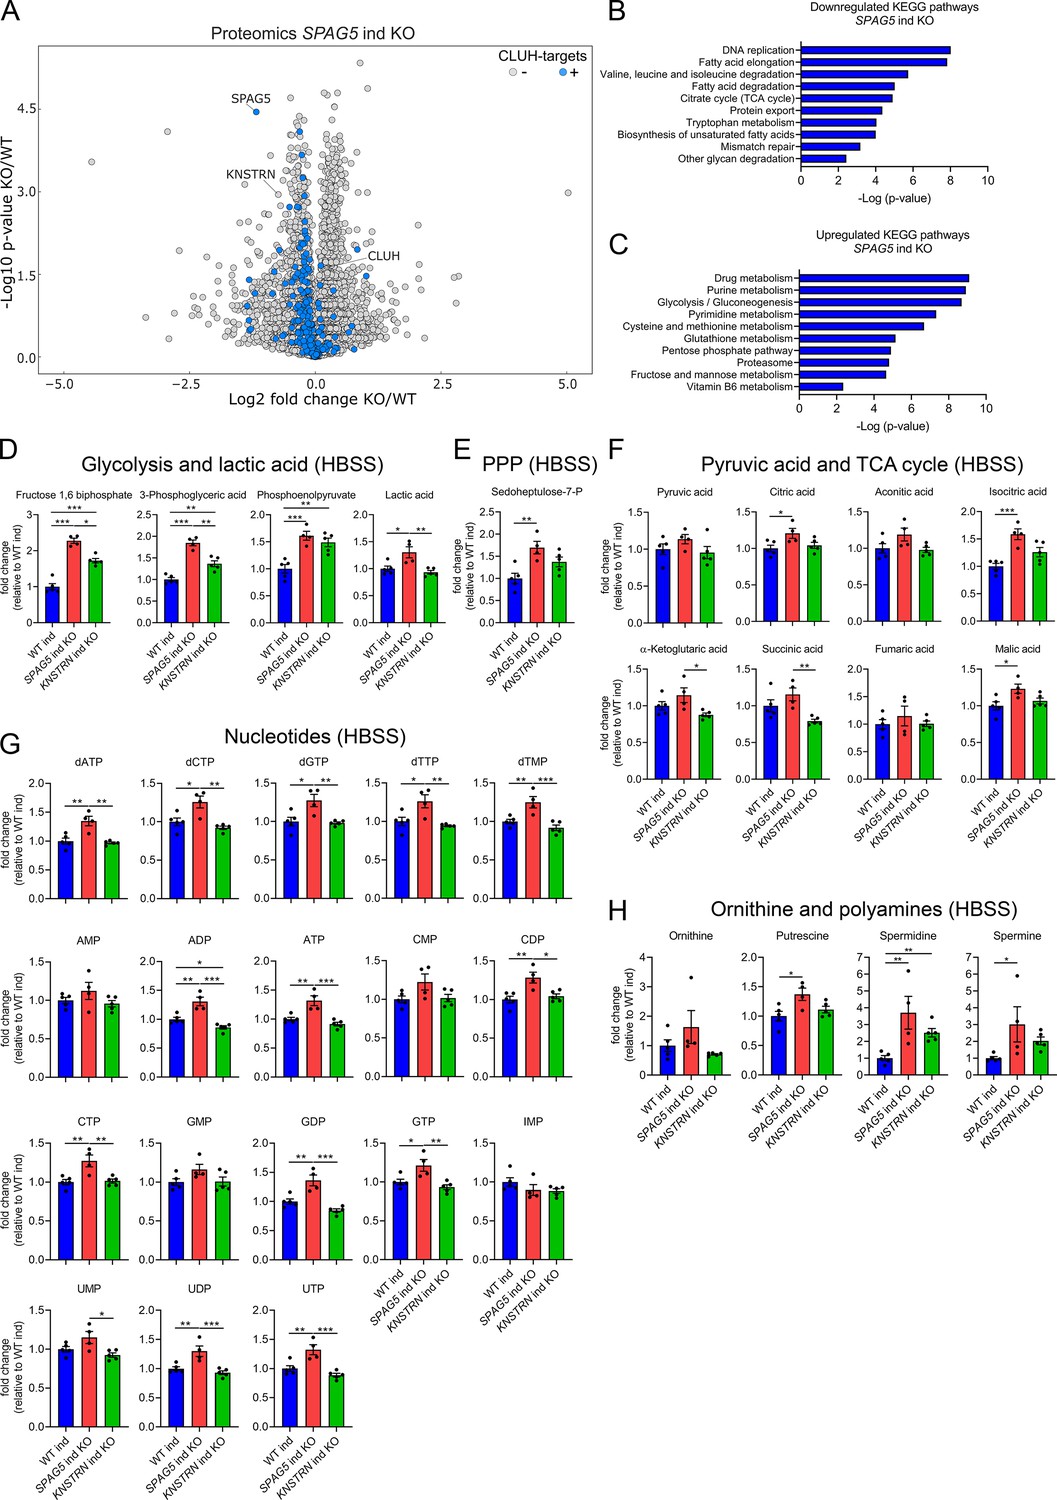
Astrin loss promotes anabolic pathways.
(A) Volcano plot of label-free proteomics of WT and SPAG5 ind KO HeLa cells (n = 4 independent replicates). CLUH targets are marked in blue. KEGG pathways of downregulated (B) or upregulated (C) proteins (with a cutoff of p ≤ 0.05; q ≤ 0.15) detected in proteomics analysis of SPAG5 ind-KO cells (A and Supplementary file 3) using the EnrichR webtool. Targeted metabolomics of WT, SPAG5, and KNSTRN ind-KO cells after 8 hr Hanks' Balanced Salt Solution (HBSS) starvation showing glycolytic intermediates and lactic acid (D), sedoheptulose-7-P (E), pyruvic acid and TCA cycle intermediates (F), nucleotide levels (G), and ornithine and polyamine levels (H). Bars show mean ± standard error of the mean (SEM) and dots represent values of individual replicates. One-way analysis of variance (ANOVA) with post hoc Tukey’s multiple comparison tests on log converted fold changes were performed with *p ≤ 0.05; **p ≤ 0.01; ***p ≤ 0.001.
Figure 5—figure supplement 1
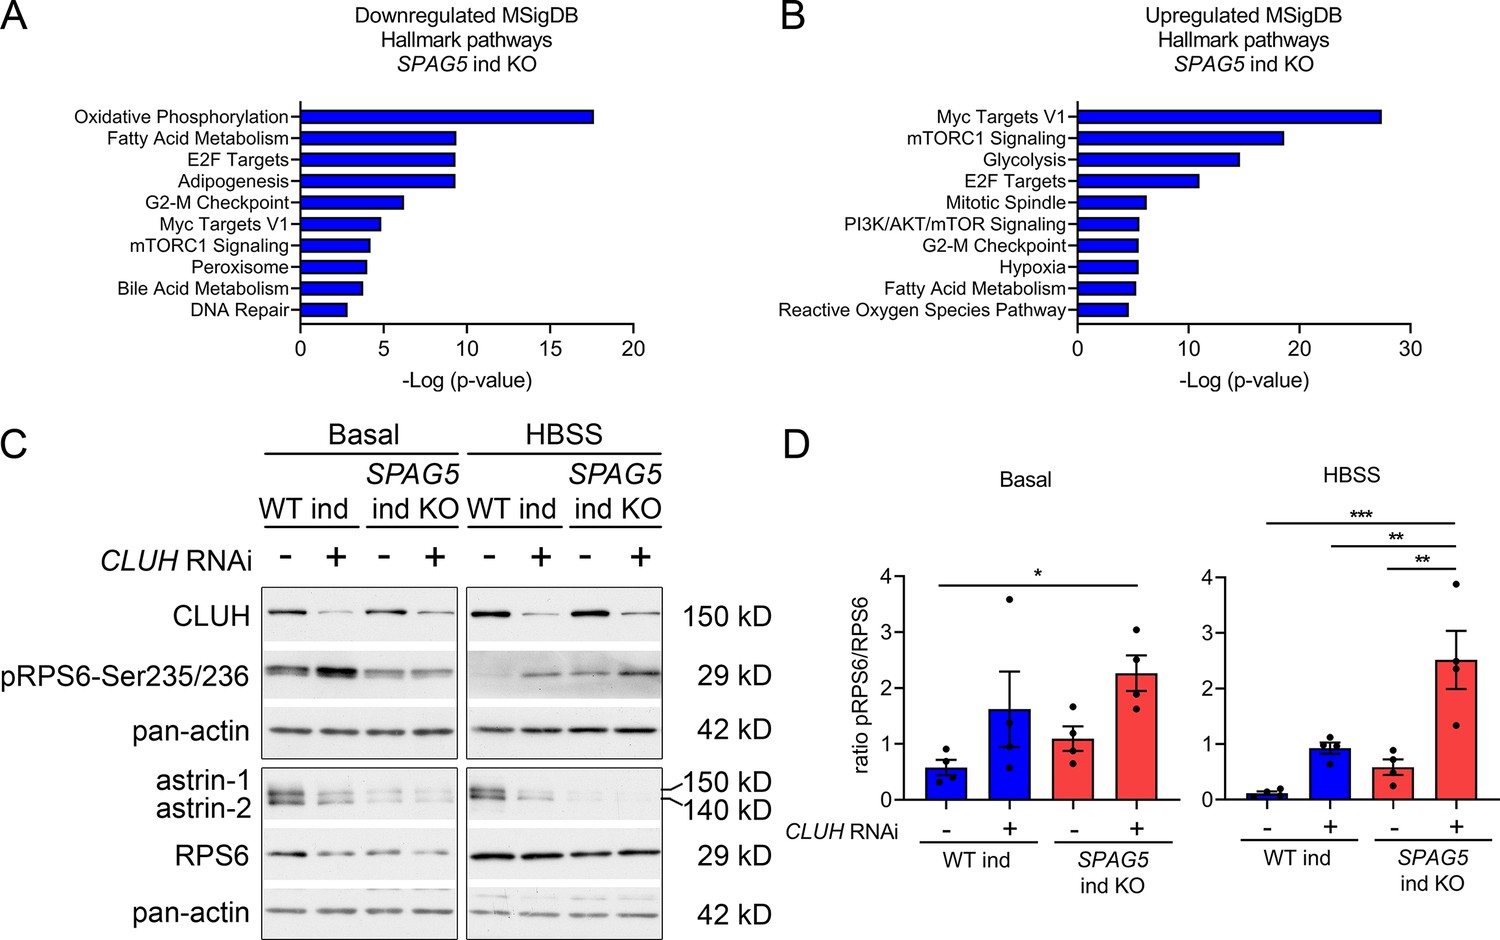
Loss of SPAG5 and CLUH lead to hyperactivation of mTORC1 signaling.
(A, B) MSigDB Hallmark pathways of downregulated (E) or upregulated (F) proteins (with a cutoff of p ≤ 0.05; q ≤ 0.15) detected in proteomics analysis of SPAG5 ind-KO cells (Figure 4A, Supplementary file 3) using the EnrichR webtool. (C) Western blots of WT and SPAG5 ind-KO HeLa cells transfected with siRNA against CLUH or untargeted control siRNA. Cells were induced for 4 days with doxycycline, additionally downregulated for the last 3 days and grown for the last 8 hr in basal or HBSS media without doxycycline. Pan-actin was used as loading control. (D) Quantification of experiments as shown in C (n = 4 independent experiments). Antibody signal was normalized to pan-actin signal, and signal of phospho-protein was normalized to signal of the total protein. Bars show mean ± standard error of the mean (SEM) and dots represent values of individual replicates. One-way analysis of variance (ANOVA) with post hoc Tukey’s multiple comparison tests were performed with *p ≤ 0.05; **p ≤ 0.01; ***p ≤ 0.001.
-
Figure 5—figure supplement 1—source data 1
Uncropped blots for Figure 5—figure supplement 1C.
- https://cdn.elifesciences.org/articles/74552/elife-74552-fig5-figsupp1-data1-v2.pdf
-
Figure 5—figure supplement 1—source data 2
Unedited blots for Figure 5—figure supplement 1C.
- https://cdn.elifesciences.org/articles/74552/elife-74552-fig5-figsupp1-data2-v2.zip
Figure 5—figure supplement 2
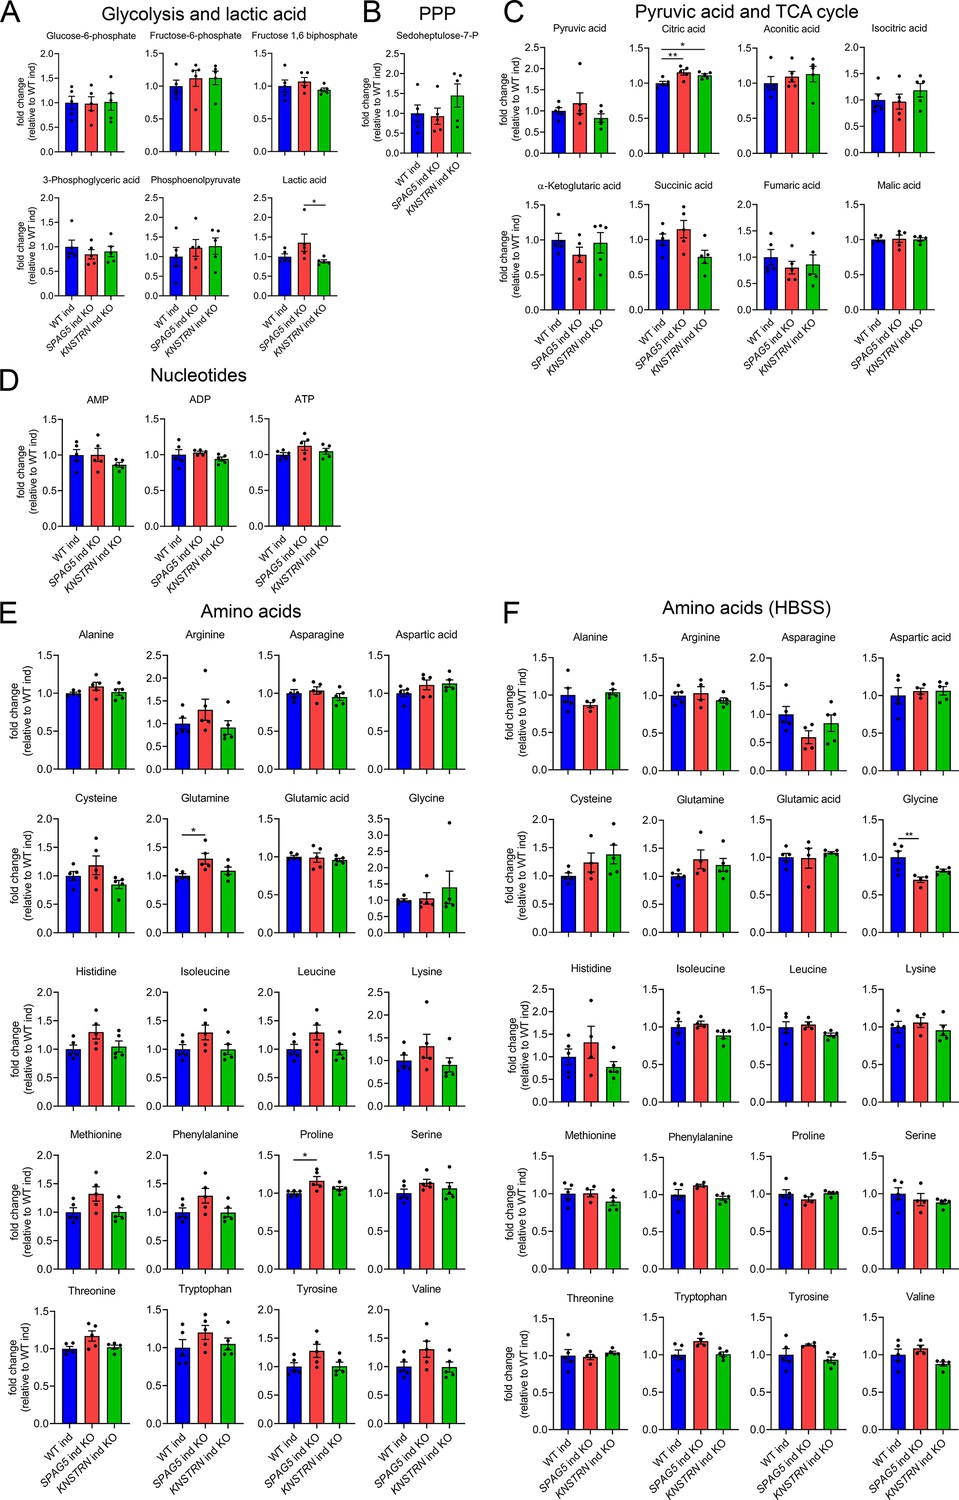
Astrin and kinastrin depletion does not affect cellular metabolism under basal conditions.
Targeted metabolomics of WT, SPAG5, and KNSTRN ind-KO HeLa cells under basal conditions (A–E) or after 8 hr HBSS starvation (F) showing glycolytic intermediates and lactic acid (A), sedoheptulose-7-P (B), pyruvic acid and TCA cycle intermediates (C), nucleotide (D), and amino acid levels (E, F). Bars show mean ± standard error of the mean (SEM) and dots represent values of individual replicates. One-way analysis of variance (ANOVA) with post hoc Tukey’s multiple comparison tests were performed on log converted fold changes with *p ≤ 0.05; **p ≤ 0.01.
Figure 6
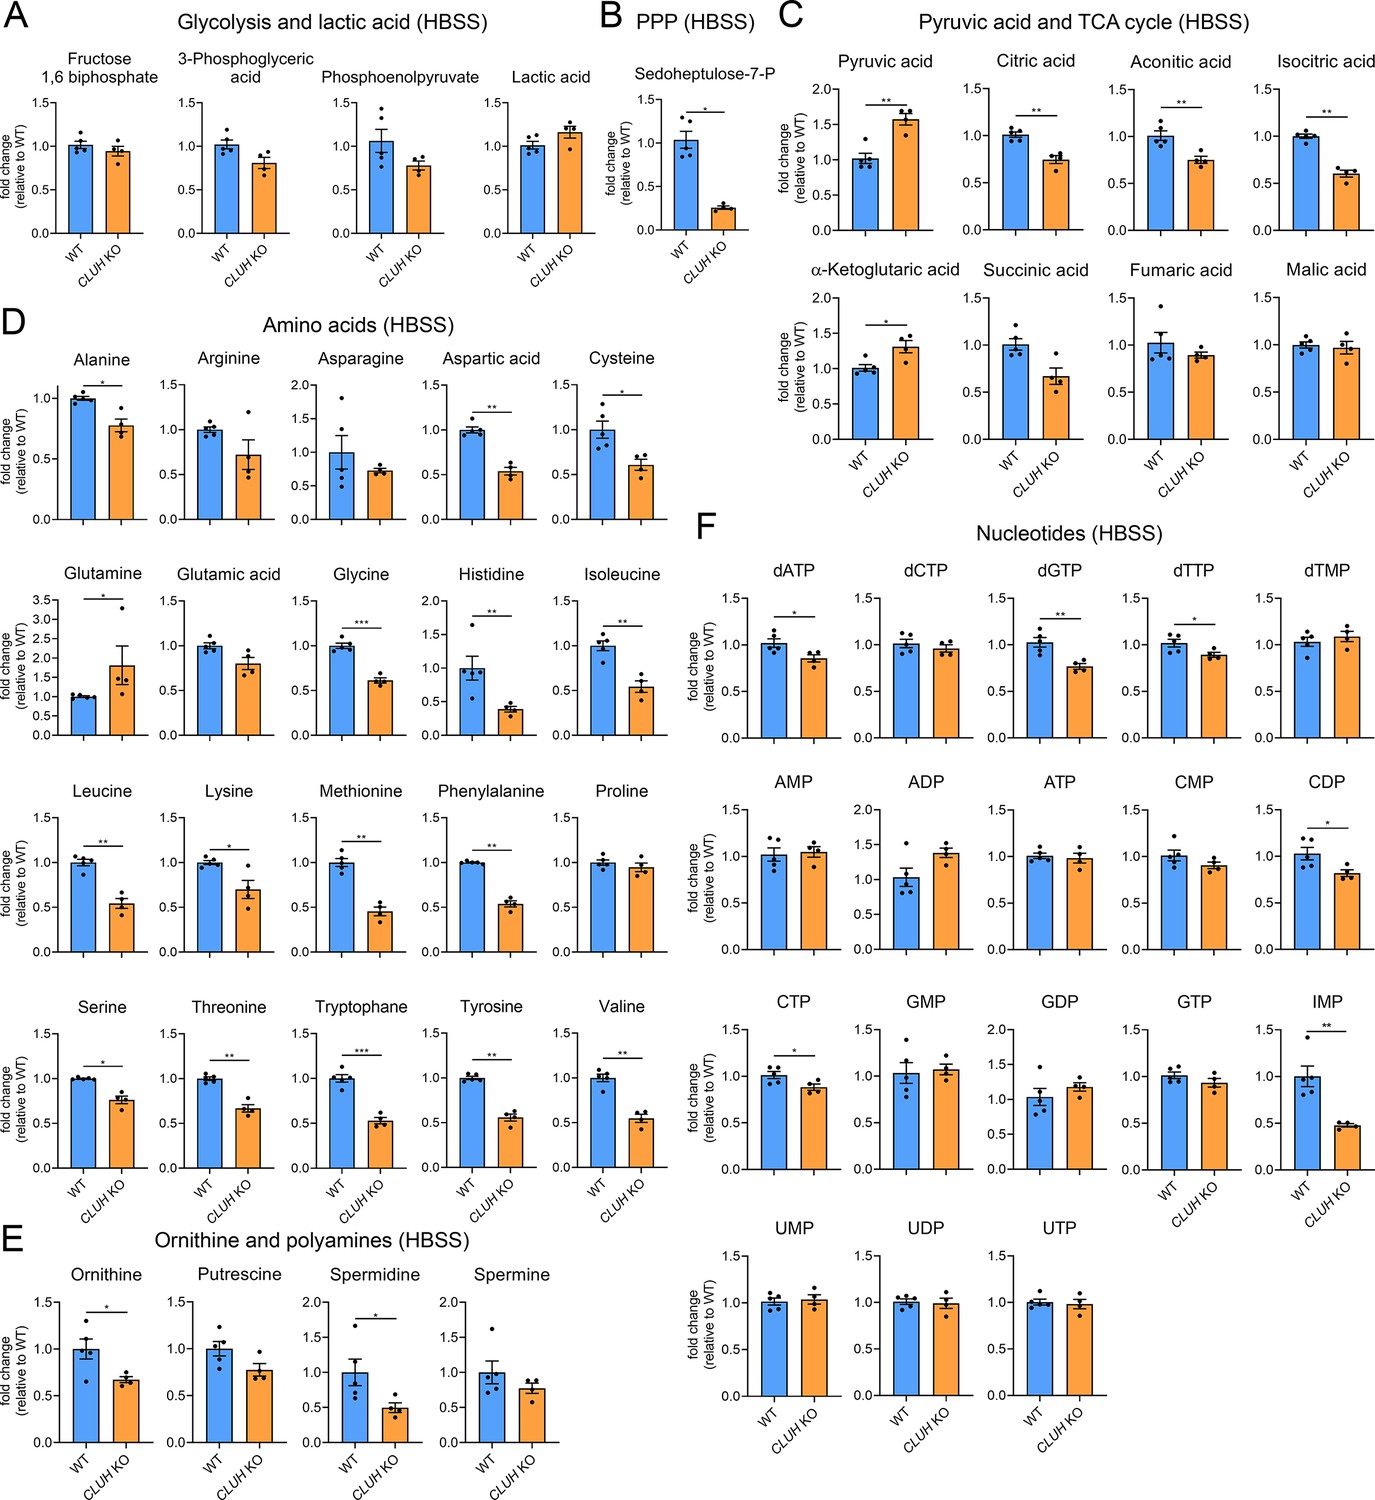
Depletion of CLUH impairs anabolic pathways.
Targeted metabolomics of WT and CLUH KO HeLa cells after 8 hr HBSS starvation showing glycolytic intermediates and lactic acid (A), sedoheptulose-7-P (B), pyruvic acid and TCA cycle intermediates (C), amino acid levels (D), ornithine and polyamine levels (E), and nucleotide levels (F). Bars show mean ± standard error of the mean (SEM) and dots represent values of individual replicates. Two-tailed unpaired Student’s t-tests on log converted fold changes were performed with *p ≤ 0.05; **p ≤ 0.01; ***p ≤ 0.001.
Figure 7 with 1 supplement
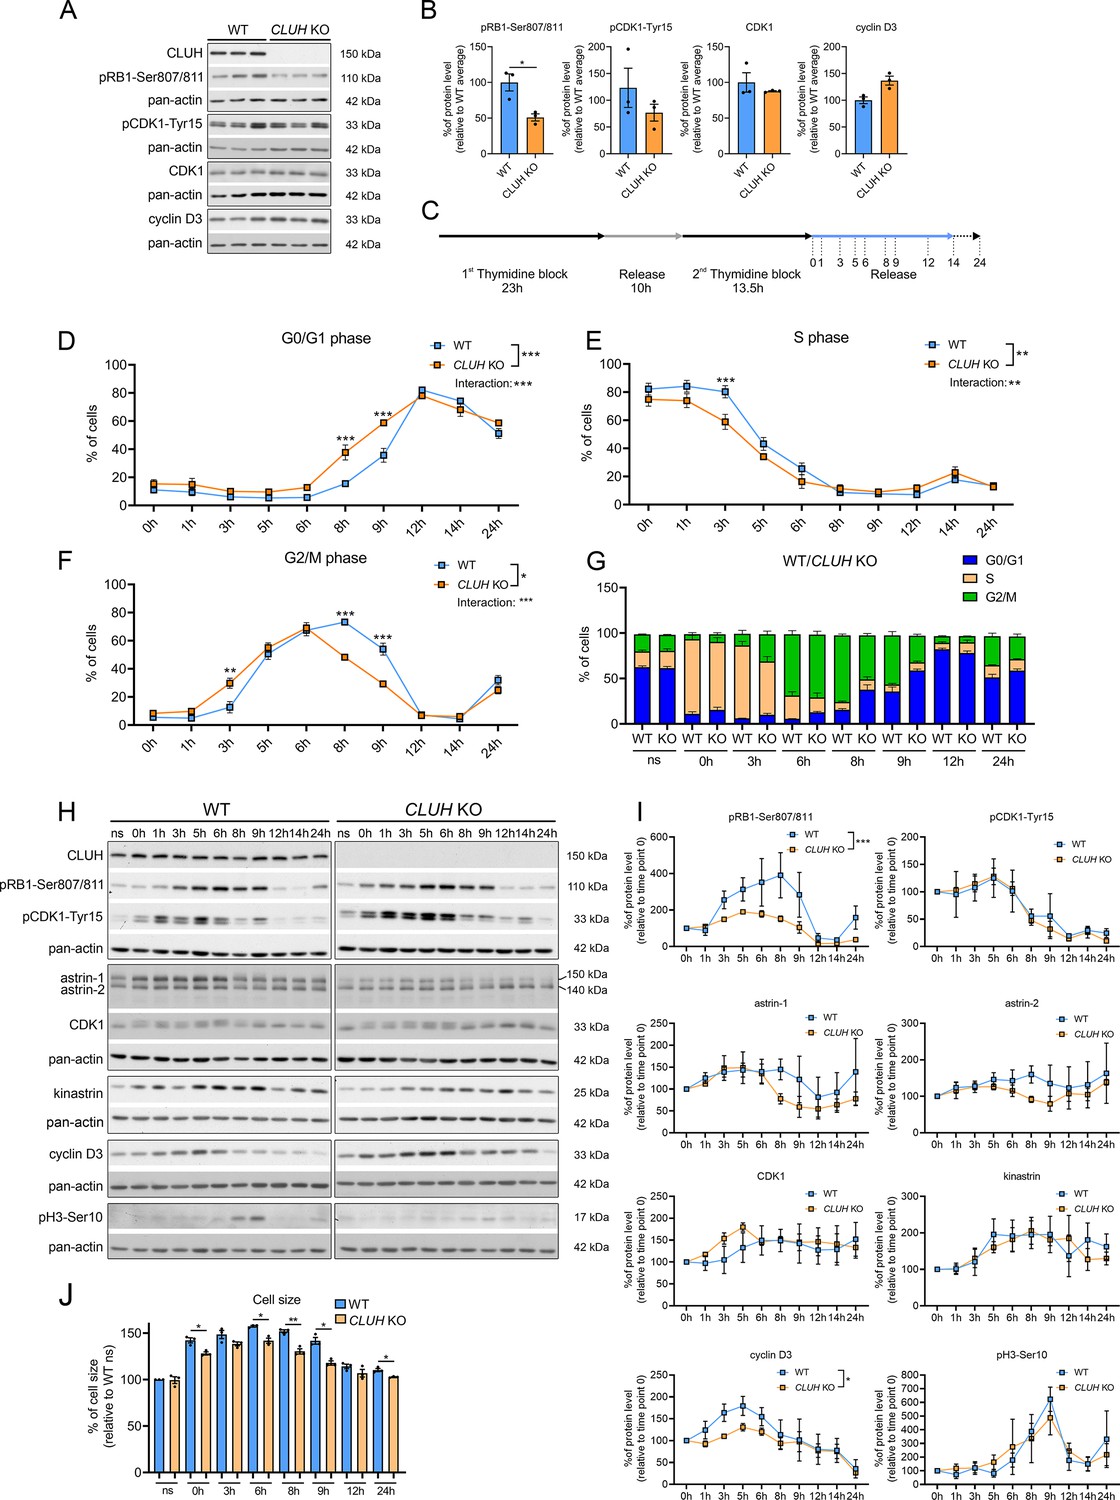
CLUH controls cell cycle progression at the G1/S boundary.
(A) Western blots of unsynchronized WT and CLUH KO HeLa cells. Pan-actin was used as loading control. (B) Quantification of western blots shown in A (n = 3 independent replicates). Two-tailed paired Student’s t-tests were performed with *p ≤ 0.05. Error bars represent standard error of the mean (SEM). (C) Double thymidine block (DTB) synchronization protocol used for cell cycle progression analysis. Cells were collected after release of second thymidine block at indicated time points. Percentage of WT and CLUH KO HeLa cells in G0/G1 (D) in S (E) and G2/M phase (F) and cell cycle distribution analysis (G) after DTB synchronization, collection at indicated time points and propidium iodide (PI) staining followed by flow cytometric analysis (n = 3 independent experiments). For D–F, two-way analysis of variance (ANOVA) with post hoc Tukey’s multiple comparison tests were performed with *p ≤ 0.05; **p ≤ 0.01; ***p ≤ 0.001. Genotype × time interaction significance is also shown. Graphs and bars show mean ± SEM. (H) Western blots of WT and CLUH KO HeLa cells collected after DTB synchronization at indicated time points. Pan-actin was used as loading control. (I) Quantification of western blots as shown in H (n = 3 independent experiments). Two-way ANOVA tests were performed with *p ≤ 0.05; ***p ≤ 0.001. Error bars represent SEM. (J) Cell size analysis of WT and CLUH KO HeLa cells of experiments shown in D–G. Bars show mean ± SEM and dots represent values of individual replicates. Two-tailed paired Student’s t-tests were performed with *p ≤ 0.05; **p ≤ 0.01.
-
Figure 7—source data 1
Uncropped blots for Figure 7A,H.
- https://cdn.elifesciences.org/articles/74552/elife-74552-fig7-data1-v2.pdf
-
Figure 7—source data 2
Unedited blots for Figure 7A,H.
- https://cdn.elifesciences.org/articles/74552/elife-74552-fig7-data2-v2.zip
Figure 7—figure supplement 1
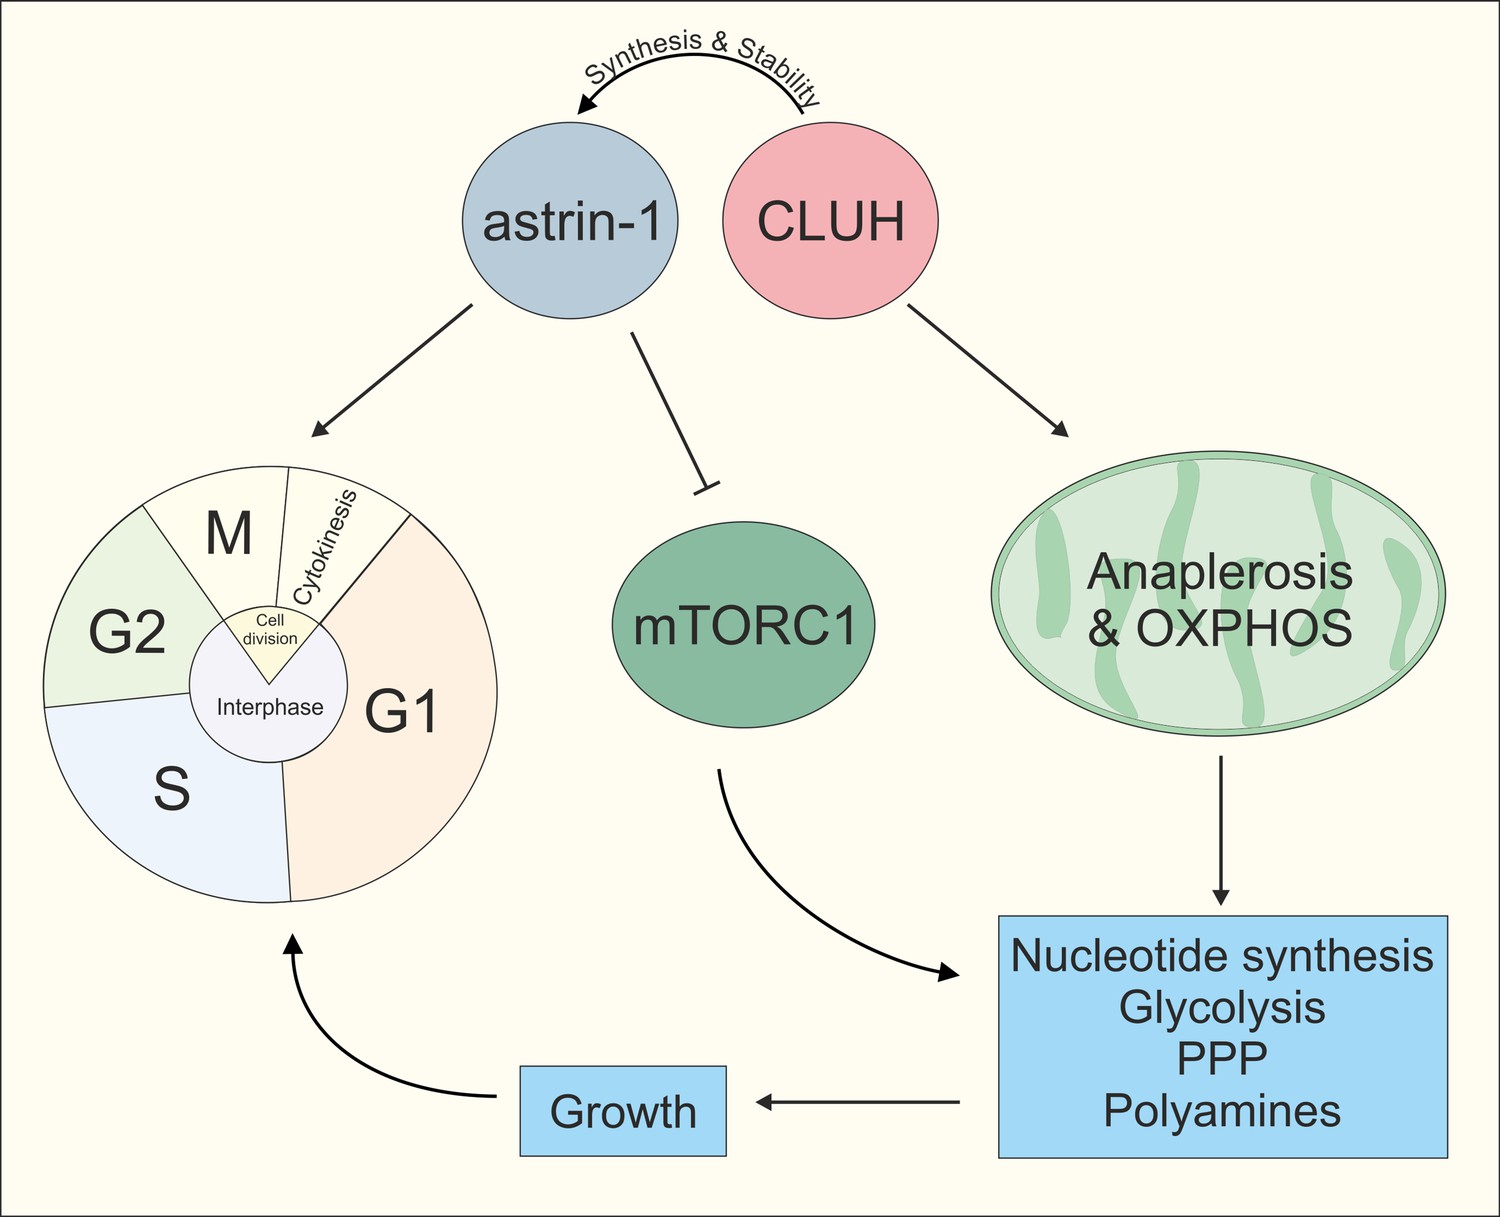
Model of CLUH/astrin-1 complex function in proliferating cells.
CLUH and astrin-1 form a complex to couple the control of mitochondrial metabolism and cell cycle progression. On the one hand, CLUH is required for astrin synthesis and for protein stability. Additionally, CLUH promotes mitochondrial anaplerotic reactions and OXPHOS function by ensuring CLUH target expression. This provides energy and building blocks to increase anabolic pathways like nucleotide synthesis, glycolysis, pentose phosphate pathway, and polyamine synthesis required for growth in G1 and allowing cell cycle progression at the G1/S boundary. Astrin-1, on the other hand, regulates CLUH localization, controls metaphase to anaphase progression in M phase and inhibits mTORC1.
Author response image 1

Confocal immunofluorescence pictures of HeLa cells overexpressing for 24 h FLAG-tagged astrin-1 and astrin-2, astrin-1 or astrin-2 alone stained for FLAG (red) and CLUH (green).
DAPI was used to stain nuclei (blue). Small boxes in corners show a 4x magnified area of boxed regions. Scale bar, 8 µm.
Author response image 2
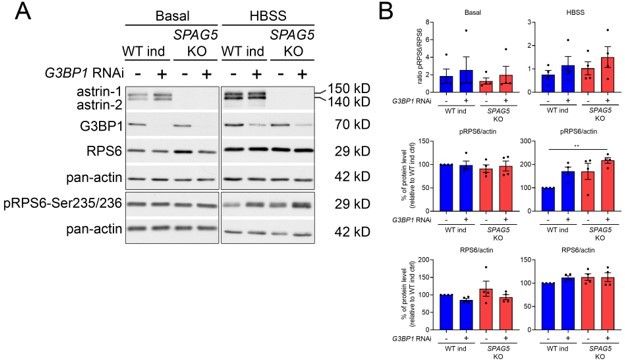
(A) Western blot for the indicated antibodies in WT and SPAG5 KO cells downregulated with control of G3BP1 siRNA in basal and HBSS conditions.
(B) Quantification of four biological replicates. One-way ANOVA with post-hoc Tukey’s test. P< 0.01 **.
Tables
Appendix 1—key resources table
| Reagent type (species) or resource | Designation | Source or reference | Identifiers | Additional information |
|---|---|---|---|---|
| Gene (Homo sapiens) | CLUH | NCBI | NM_001366661.1 | |
| Gene (Homo sapiens) | SPAG5 | NCBI | NM_006461.3 | |
| Gene (Homo sapiens) | KNSTRN | NCBI | NM_033286.4 | |
| Cell line (Homo sapiens) | CLUH KO HeLa cells | Wakim et al., 2017 | Exon 4 has been deleted with CRISPR-Cas9 technique | |
| Cell line (Homo sapiens) | Doxycyline inducible WT HeLa cells | McKinley and Cheeseman, 2017 | Cas9 expression is induced by doxycycline treatment; constitutive sgRNA expression | |
| Cell line (Homo sapiens) | Inducible SPAG5 KO HeLa cells | McKinley and Cheeseman, 2017; Kern et al., 2017 | Cas9 expression is induced by doxycycline treatment; constitutive sgRNA expression targeting SPAG5 | |
| Cell line (Homo sapiens) | Inducible KNSTRN KO HeLa cells | McKinley and Cheeseman, 2017; Kern et al., 2017 | Cas9 expression is induced by doxycycline treatment; constitutive sgRNA expression targeting KNSTRN | |
| Cell line (Homo sapiens) | HEK293T cells expressing FLAG-kinastrin | This paper | Doxycyline inducible | |
| Cell line (Homo sapiens) | SPAG5 KO HeLa cells | This paper | Stable KO cells; derived by monoclonal selection of inducible SPAG5 KO HeLa cells | |
| Cell line (Homo sapiens) | KNSTRN KO HeLa cells | This paper | Stable KO cells; derived by monoclonal selection of inducible KNSTRN KO HeLa cells | |
| Cell line (Mus musculus) | Cluh KO MEFs | Gao et al., 2014 | Exon 10 has been deleted with Cre/LoxP system | |
| Recombinant DNA reagent | p3xFLAG-CMV-14 (plasmid) | Sigma-Aldrich | Backbone of all SPAG5 constructs; used as empty vector control | |
| Transfected construct (human) | ATG1-SPAG5 | This paper | Allows the expression of a FLAG-tagged human SPAG5 from ATG1 | |
| Transfected construct (human) | Δ151-SPAG5 | This paper | Allows the expression of a FLAG-tagged human SPAG5 lacking the first 151 amino acids | |
| Transfected construct (human) | 5UTR-SPAG5 | This paper | Allows the expression of a FLAG-tagged human SPAG5 including its 5′ UTR; used to overexpress astrin-1 and 2 together | |
| Transfected construct (human) | uATGGGG-SPAG5 | This paper | Allows the expression of a FLAG-tagged human SPAG5 including its 5′ UTR with uATG mutated to GGG | |
| Transfected construct (human) | ATG1GGG-SPAG5 | This paper | Allows the expression of a FLAG-tagged human SPAG5 including its 5′ UTR with ATG1 mutated to GGG; used to overexpress only astrin-2 | |
| Transfected construct (human) | ATG3GGG-SPAG5 | This paper | Allows the expression of a FLAG-tagged human SPAG5 including its 5′ UTR with ATG3 mutated to GGG | |
| Transfected construct (human) | ATG4GGG-SPAG5 | This paper | Allows the expression of a FLAG-tagged human SPAG5 including its 5′ UTR with ATG4 mutated to GGG | |
| Transfected construct (human) | ATG5GGG-SPAG5 | This paper | Allows the expression of a FLAG-tagged human SPAG5 including its 5′ UTR with ATG5 mutated to GGG | |
| Transfected construct (human) | ATG6GGG-SPAG5 | This paper | Allows the expression of a FLAG-tagged human SPAG5 including its 5′ UTR with ATG6 mutated to GGG | |
| Transfected construct (human) | ATG3 + 5GGG-SPAG5 | This paper | Allows the expression of a FLAG-tagged human SPAG5 including its 5′ UTR with ATG3 and 5 mutated to GGG | |
| Transfected construct (human) | ATG3 + 4 + 5GGG-SPAG5 | This paper | Allows the expression of a FLAG-tagged human SPAG5 including its 5′ UTR with ATG3, 4, and 5 mutated to GGG; used to overexpress only astrin-1 | |
| Transfected construct (human) | ATG3 + 4 + 5 + 6GGG-SPAG5 | This paper | Allows the expression of a FLAG-tagged human SPAG5 including its 5′ UTR with ATG3, 4, 5, and 6 mutated to GGG | |
| Transfected construct (human) | ctrl siRNA | Invitrogen | #12935115 | Transfected construct (human) |
| Transfected construct (human) | siRNA targeting CLUH | Invitrogen | CLUHHSS118510 | Transfected construct (human) |
| Transfected construct (human) | siRNA targeting CLUH | Invitrogen | CLUHHSS118511 | Transfected construct (human) |
| Transfected construct (human) | siRNA targeting CLUH | Invitrogen | CLUHHSS177299 | Transfected construct (human) |
| Antibody | Anti-CLUH (rabbit polyclonal) | Novus Biologicals | #NB100-93305 | WB (1:1000) IP (0.5 µg /300–500 µg protein) |
| Antibody | Anti-CLUH (rabbit polyclonal) | Novus Biologicals | #NB100-93306 | IF(1:1000), WB (1:1000) IP (0.5 µg /300–500 µg protein) |
| Antibody | Anti-RPS6 (rabbit polyclonal) | Novus Biologicals | #NB100-1595 | WB (1:1000) |
| Antibody | Anti-RPL7 (rabbit polyclonal) | Novus Biologicals | #NB100-2269 | WB (1:1000) |
| Antibody | Anti-astrin (rabbit polyclonal) | ProteinTech | #14726-1-AP | WB (1:1000) IP (0.5 µg /300–500 µg protein) |
| Antibody | Anti-FLAG (rabbit polyclonal) | Sigma-Aldrich | #F7425 | IF (1:1000), WB (1:1000) IP (0.5 µg /300–500 µg protein) |
| Antibody | Anti-FLAG (mouse monoclonal) | Sigma-Aldrich | #F3165 | IF (1:1000), WB (1:1000) |
| Antibody | Pan-actin (mouse monoclonal) | EMD Millipore | #MAB1501 | WB (1:2000) |
| Antibody | Anti-GAPDH (mouse monoclonal) | EMD Millipore | #MAB374 | WB (1:2000) |
| Antibody | Anti-CLUH (rabbit polyclonal) | Aviva | #ARP70642_P050 | WB (1:1000) |
| Antibody | Anti-kinastrin (rabbit polyclonal) | Abcam | #ab122769 | WB (1:1000) |
| Antibody | pH3-Ser10 (rabbit polyclonal) | Abcam | #ab5176 | WB (1:1000) |
| Antibody | Anti-SDHA (mouse monoclonal) | Molecular probes | #459,200 | WB (1:1000) |
| Antibody | Anti-NDUFA9 (mouse monoclonal) | Molecular probes | #459,100 | WB (1:1000) |
| Antibody | Anti-UQCRC1 (mouse monoclonal) | Molecular probes | #459,140 | WB (1:1000) |
| Antibody | pRB1-Ser807/811 (rabbit polyclonal) | Cell Signaling | #9308 | WB (1:1000) |
| Antibody | pCDK1-Tyr15 (rabbit monoclonal) | Cell Signaling | #4539 | WB (1:1000) |
| Antibody | Anti-cyclin D3 (mouse monoclonal) | Cell Signaling | #2936 | WB (1:1000) |
| Antibody | pRPS6-Ser235/236 (rabbit polyclonal) | Cell Signaling | #2211 | WB (1:1000) |
| Antibody | Anti-CDK1 (mouse monoclonal) | Santa Cruz Biotechnologies | #sc-54 | WB (1:1000) |
| Antibody | Anti-kinastrin (rabbit polyclonal) | Sigma-Aldrich | #SAB1103031 | WB (1:1000) IP (0.5 µg /300–500 µg protein) |
| AntibodyA | Anti-astrin (rabbit polyclonal) | Novus Biologicals | #NB100-74638 | IP (0.5 µg /300–500 µg protein) |
| Antibody | Anti-AFG3L1 (rabbit polyclonal) | Koppen et al., 2007 | N/A | IP (0.5 µg /300–500 µg protein) |
| Antibody | Anti-TOMM20 (mouse monoclonal) | Santa Cruz Biotechnologies | #sc-17764 | IF (1:1000) |
| Antibody | Anti-PCM1 (mouse monoclonal) | Santa Cruz Biotechnologies | #sc-398365 | IF (1:200) |
| Antibody | Anti-CEP43 (mouse monoclonal) | Sigma-Aldrich | #WH0011116M1 | IF (1:500) |
| Antibody | Anti-rabbit Alexa594 (donkey polyclonal) | Invitrogen | #A21207 | IF (1:1000) |
| Antibody | Anti-mouse Alexa488 (goat polyclonal) | Invitrogen | #A11029 | IF (1:1000) |
| Antibody | Anti-mouse Alexa594 (goat polyclonal) | Invitrogen | #A11005 | IF (1:1000) |
| Antibody | Anti-rabbit Alexa488 (goat polyclonal) | Invitrogen | #A11034 | IF (1:1000) |
| Sequence-based reagent | SPAG5 forward | This paper | PCR primers | 5′-CATCTCACAGTGGGATAACTAATAAAC-3′ |
| Sequence-based reagent | SPAG5 reverse | This paper | PCR primers | 5′-CAGGGATAGGTGAAGCAAGGATA-3′ |
| Sequence-based reagent | GAPDH forward | This paper | PCR primers | 5′-AATCCCATCACCATCTTCCA-3′ |
| Sequence-based reagent | GAPDH reverse | This paper | PCR primers | 5'-TGGACTCCACGACGTACTCA-3' |
| Sequence-based reagent | RPL13 forward | This paper | PCR primers | 5′-CGGACCGTGCGAGGTAT-3′ |
| Sequence-based reagent | RPL13 reverse | This paper | PCR primers | 5′-CACCATCCGCTTTTTCTTGTC-3′ |
| Sequence-based reagent | MT-TL1 forward | Rooney et al., 2015 | PCR primers | 5′-CACCCAAGAACAGGGTTTGT-3′ |
| Sequence-based reagent | MT-TL1 reverse | Rooney et al., 2015 | PCR primers | 5′-TGGCCATGGGTATGTTGTTA-3′ |
| Sequence-based reagent | B2M forward | Rooney et al., 2015 | PCR primers | 5′-TGCTGTCTCCATGTTTGATGTATCT-3′ |
| Sequence-based reagent | B2M reverse | Rooney et al., 2015 | PCR primers | 5′-TCTCTGCTCCCCACCTCTAAGT-3′ |
| Commercial assay or kit | Click-it Nascent RNA Capture Kit | Invitrogen | C10365 | |
| Commercial assay or kit | SuperScript VILO cDNA synthesis kit | Invitrogen | 11754250 | Used in combination with Click-it Nascent RNA Capture Kit |
| Commercial assay or kit | SuperScript First-Strand Synthesis System | Invitrogen | 11904018 | |
| Chemical compound, drug | Doxycycline | Sigma-Aldrich | #D5207 | Final conc.: 1 µg/ml |
| Chemical compound, drug | L-Arginine-HCl | Silantes | #201604102 | Final conc.: 28 µg/ml |
| Chemical compound, drug | L-Lysine-HCl | Silantes | #211604102 | Final conc.: 73 µg/ml |
| Chemical compound, drug | Cycloheximide | Sigma-Aldrich | #C4859 | Final conc.: 100 µg/ml |
| Chemical compound, drug | MG132 | Sigma-Aldrich | #M8699 | Final conc.: 20 µM |
| Chemical compound, drug | Thymidine | Sigma-Aldrich | #T1895 | Final conc.: 2 mM |
| Chemical compound, drug | Nocodazole | Sigma-Aldrich | #M1404 | Final conc.: 100 ng/µl |
| Chemical compound, drug | Benzonase HC nuclease | Sigma-Aldrich | #71206 | Final amount per samples: 25 U |
| Chemical compound, drug | Propidium iodide | Sigma-Aldrich | #P4864 | Final conc.: 50 µg/ml |
Additional files
-
Supplementary file 1
Interactors of endogenous human CLUH in HeLa cells after SILAC labeling.
- https://cdn.elifesciences.org/articles/74552/elife-74552-supp1-v2.xlsx
-
Supplementary file 2
Interactors of endogenous human CLUH in G2-enriched HeLa cells.
- https://cdn.elifesciences.org/articles/74552/elife-74552-supp2-v2.xlsx
-
Supplementary file 3
Proteomics data of SPAG5 and KNSTRN ind-KO HeLa cells.
- https://cdn.elifesciences.org/articles/74552/elife-74552-supp3-v2.xlsx
-
Supplementary file 4
IC-TQ_Transitions compound list.
- https://cdn.elifesciences.org/articles/74552/elife-74552-supp4-v2.xlsx
-
Transparent reporting form
- https://cdn.elifesciences.org/articles/74552/elife-74552-transrepform1-v2.pdf
Download links
A two-part list of links to download the article, or parts of the article, in various formats.
Downloads (link to download the article as PDF)
Open citations (links to open the citations from this article in various online reference manager services)
Cite this article (links to download the citations from this article in formats compatible with various reference manager tools)
CLUH controls astrin-1 expression to couple mitochondrial metabolism to cell cycle progression
eLife 11:e74552.
https://doi.org/10.7554/eLife.74552


