Fibroblast-derived Hgf controls recruitment and expansion of muscle during morphogenesis of the mammalian diaphragm
- Department of Human Genetics, University of Utah, United States
- Ambys Medicines, United States
Figures
Figure 1 with 3 supplements
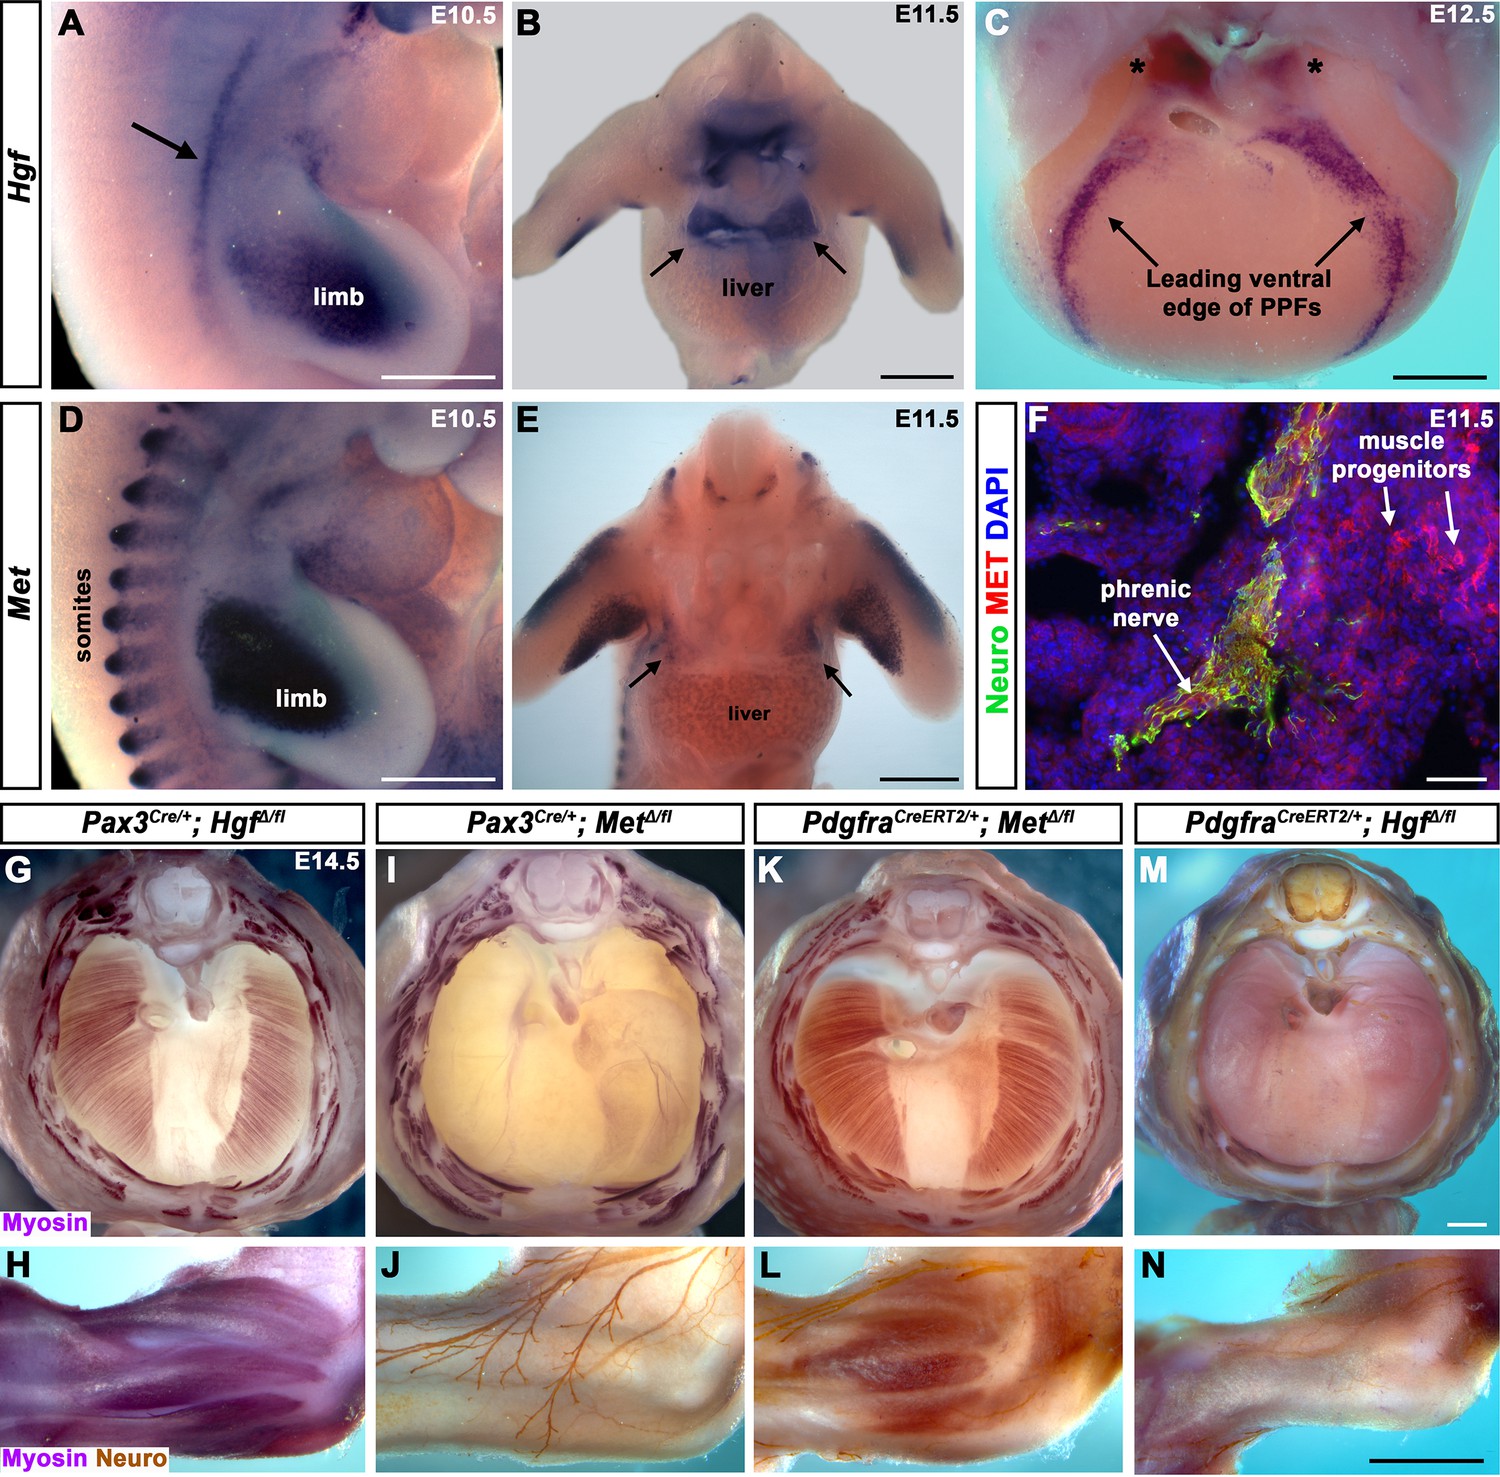
Fibroblast-derived Hgf and somite-derived Met are required for muscularization of the diaphragm and limb.
(A) Lateral view at embryonic day (E) 10.5 of Hgf expression in lateral mesoderm adjacent to somites (arrow) and limb. (B) Cranial view of Hgf expression in E11.5 developing diaphragm (arrows) and limbs. (C) Cranial view of Hgf expression in E12.5 diaphragm at the leading edges of the pleuroperitoneal folds (PPFs) as they spread ventrally (arrows) and dorsally (asterisks). (D) Lateral view of E10.5 Met expression in muscle progenitors of limb and somites. (E) Cranial view of Met expression in E11.5 developing diaphragm (arrows) and limbs. (A–E) Expression via in situ hybridization. (F) MET and neurofilament immunofluorescence in transverse section through the phrenic nerve at E11.5. (G, I, K, M) E14.5 diaphragms stained for Myosin. (H, J, L, N) E14.5 forelimbs stained for Myosin and neurofilament. Deletion of Met in the Pax3 lineage (I, J; n = 3/3) or Hgf in Pdgfra lineage (tamoxifen at E8.5) (M, N; n = 3/3) leads to muscleless diaphragms and muscleless or partially muscularized limbs. Conversely, deletion of Hgf in Pax3 lineage (G, H; n = 3/3) or Met in Pdgfra lineage (tamoxifen at E9.5) (K, L; n = 3/3) results in normal diaphragm and limb muscle. Scale bars: (A–E) 500 μm; (F) 50 μm; (G, I, K, M) 500 μm; (H, J, L, N) 500 μm.
-
Figure 1—source data 1
Limb and diaphragm phenotypes at embryonic day (E) 14.5 following deletion of Hgf and Met in Pax3 and Pdgfra lineages.
- https://cdn.elifesciences.org/articles/74592/elife-74592-fig1-data1-v1.xlsx
Figure 1—figure supplement 1
Hgf and Met expression in the embryonic diaphragm and MET+ muscle progenitors are absent in MetΔ/Δ mutant.
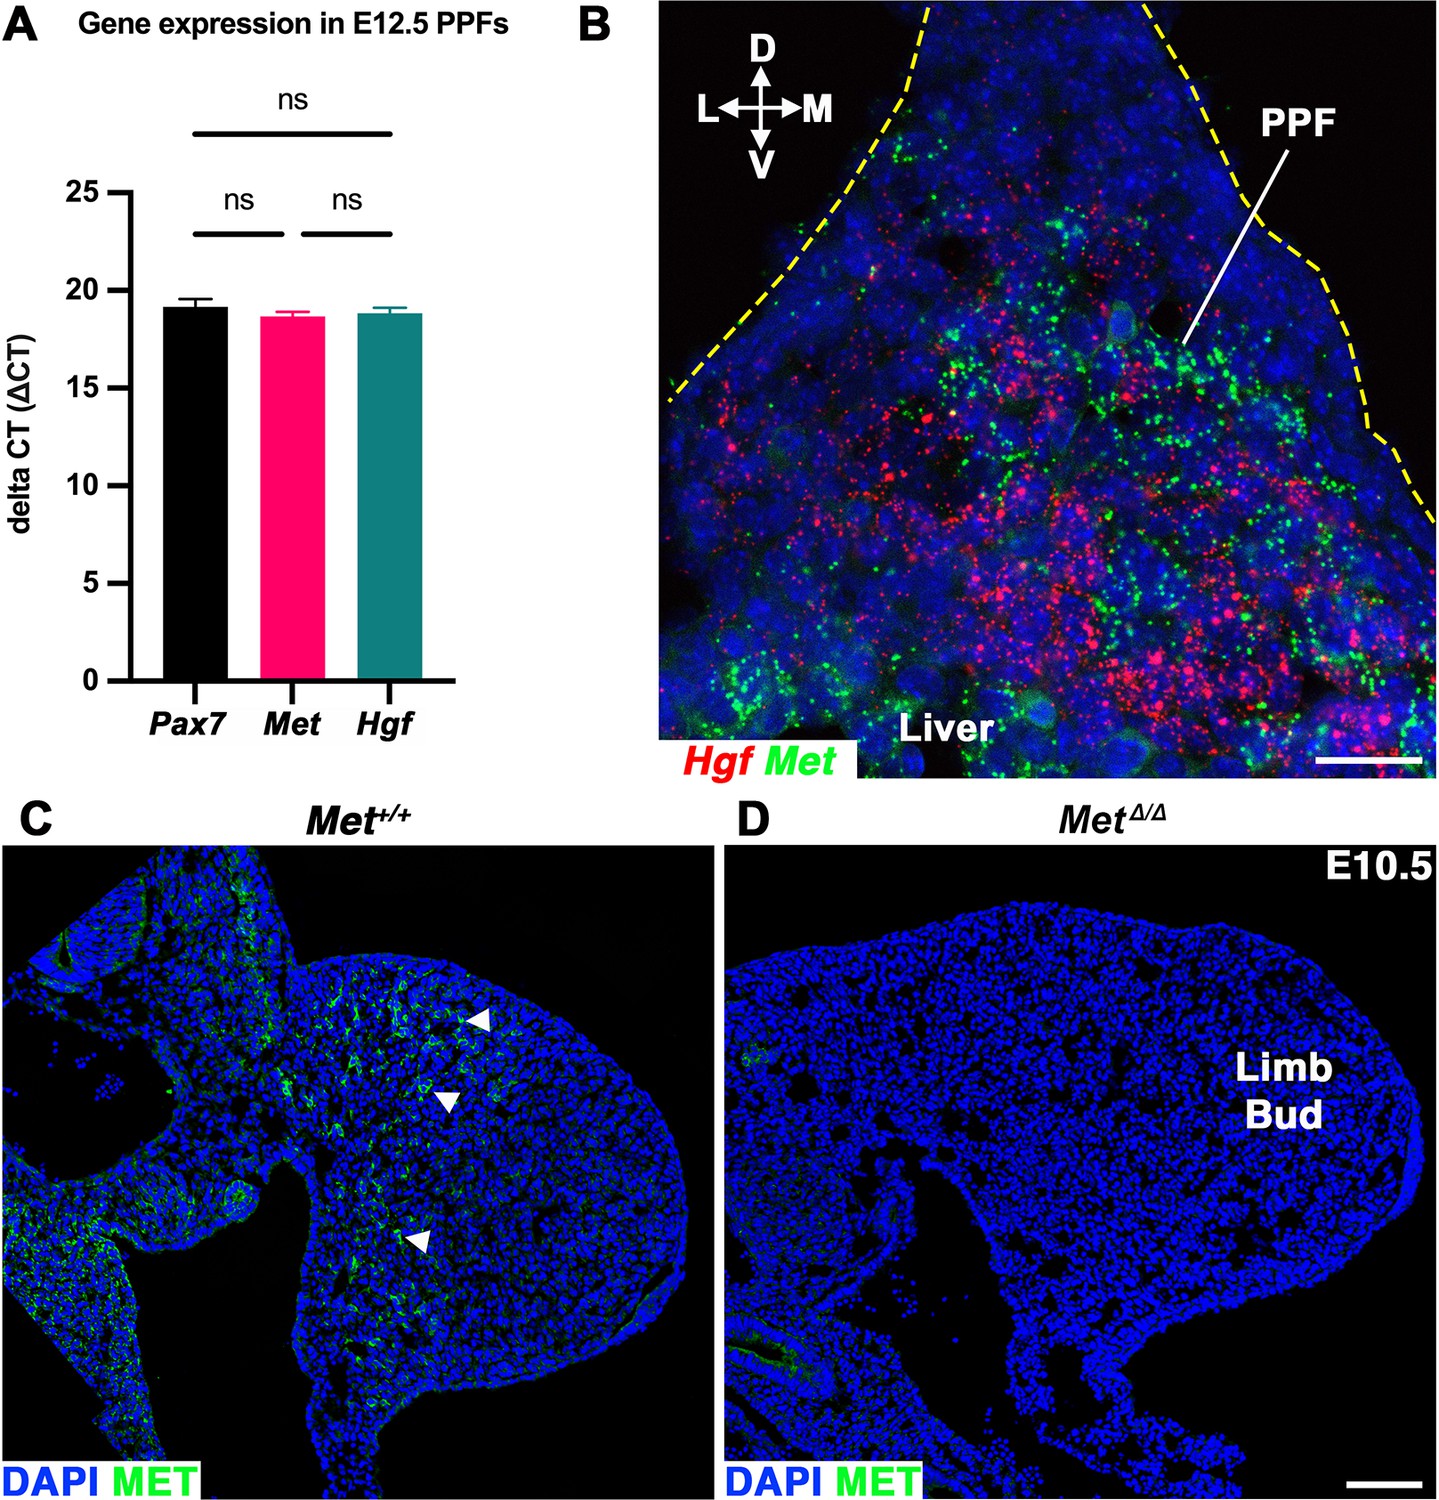
(A) Gene expression assayed by qPCR on pleuroperitoneal folds (PPFs) isolated from embryonic day (E) 12.5 WT+/+ embryos. Delta cycle threshold values (ΔCT), 18S RNA CT subtracted from CT of gene of interest, of Pax7, Met, and HGF are comparable at this stage (n = 3, no significant differences, as tested by one-way ANOVA; error bars represent standard error of the mean). (B) RNAScope of HGF and Met expression in E11.5 PPF. (C) MET immunofluorescence in cross section of the limb bud in E10.5 Met+/+ embryo (arrowheads). MET expression is absent in (D) MetΔ/Δ mutant. D, dorsal; L, lateral; M, medial; V, ventral. Scale bars: (B) 25 μm; (C, D) 100 μm.
-
Figure 1—figure supplement 1—source data 1
qPCR for Pax7, Met, and Hgf from embryonic day (E) 12.5 pleuroperitoneal folds (PPFs).
- https://cdn.elifesciences.org/articles/74592/elife-74592-fig1-figsupp1-data1-v1.xlsx
Figure 1—figure supplement 2
Pdgfra is expressed within the developing diaphragm and PdgfraCreERT2 allele targets the pleuroperitoneal folds (PPFs).
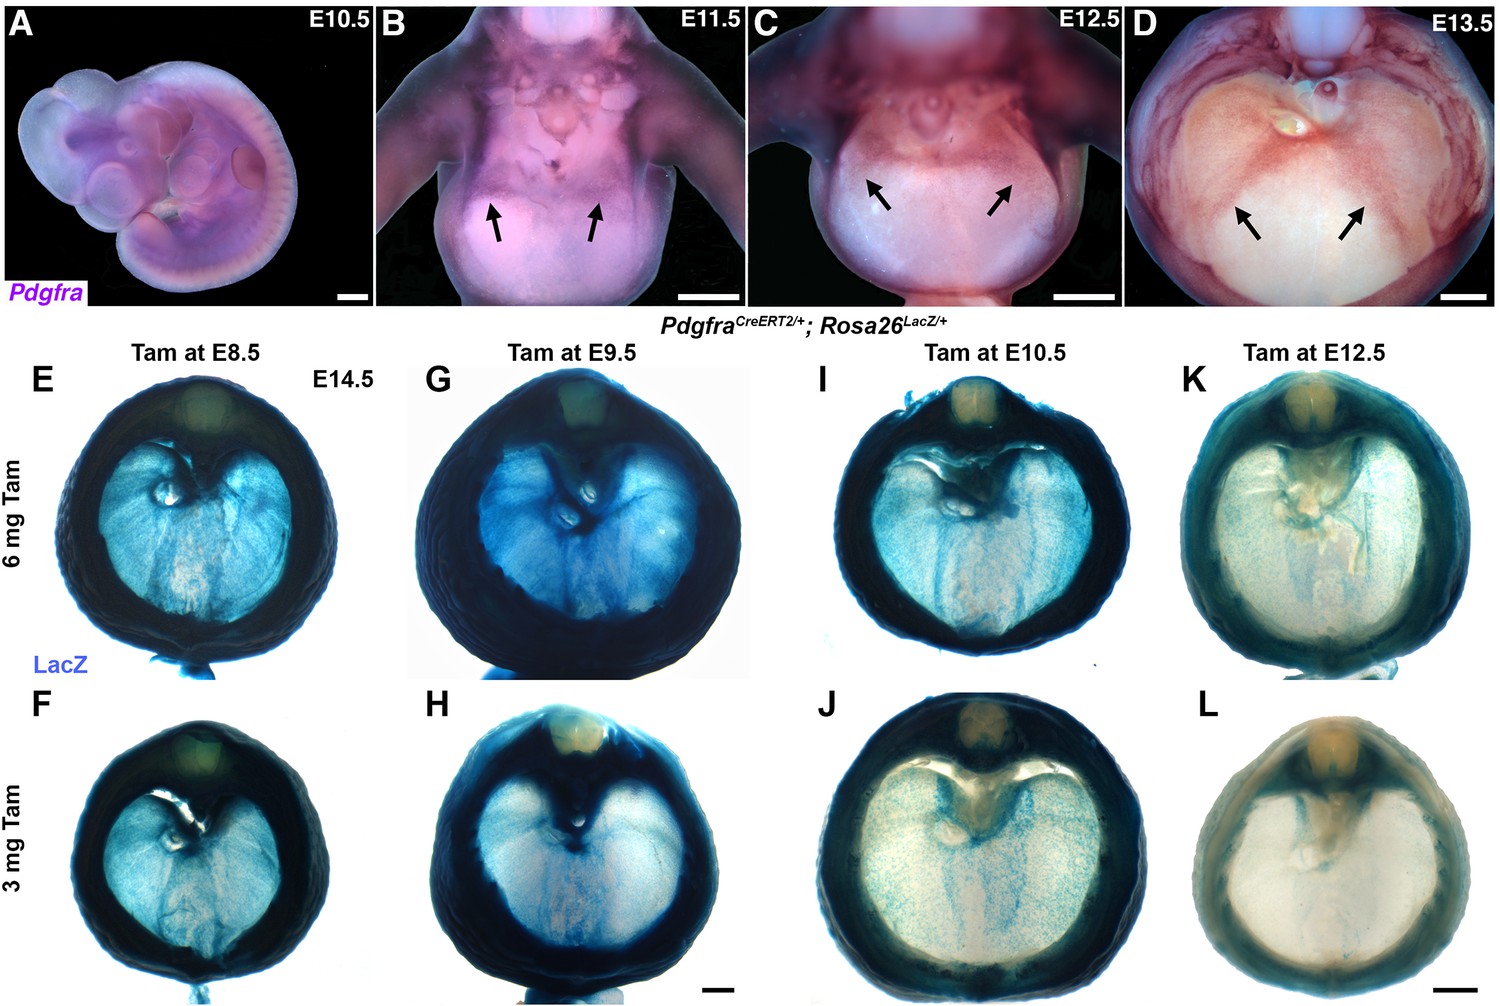
(A–D) mRNA in situ hybridization for Pdgfra at embryonic day (E) 10.5 in lateral view (A); E11.5 (B), E12.5 (C), and E13.5 (D) are in cranial view with dorsal to the top, dissected to diaphragm with the heart and lungs removed. Arrows indicate the leading edges of the PPFs. PdgfraCreERT2/+ labels PPF fibroblasts, including muscle connective tissue and central tendon, but not muscle. As expected, fibroblasts throughout the body wall are also labeled. Approximately E14.5 PdgfraCreERT2/+; Rosa26LacZ/+ embryos stained for LacZ, given different doses of tamoxifen at either E8.5 (E, F), E9.5 (G–, H), E10.5 (I, J), or E12.5 (K, L). Fibroblast labeling is stronger at higher doses of tamoxifen (6 mg) and fibroblasts are less strongly labeled with tamoxifen at E12.5. Scale bars: (A–D) 500 μm; (E, F, I, L) 500 μm; (G, H) 500 μm.
Figure 1—figure supplement 3
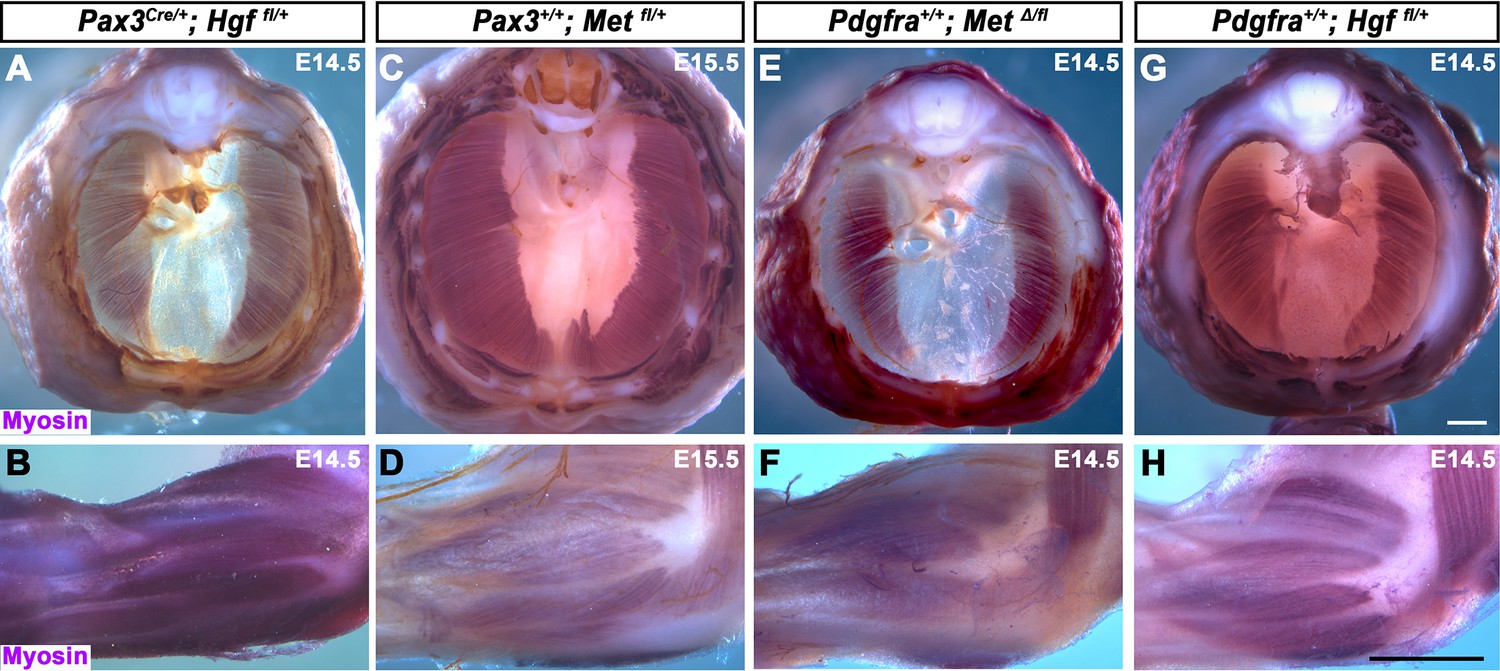
Control genotypes for embryos in Figure 1I–N.
Embryos are between embryonic day (E) 14.5 and E15.5. Top row: diaphragms stained for Myosin. Bottom row: forelimbs stained for Myosin and neurofilament. Muscle is formed in limb and diaphragm in all control genotypes. Scale bars: (A, C, E, G): 500 μm; (B, D, F, H) 500 μm.
Figure 2

Reduced and mispatterned acromiodeltoid and spinodeltoid accompanies loss of diaphragm muscle following deletion of Hgf in the Pdgfra lineage.
(A–D) Diaphragm and limb musculature in control PdgfraCreERT2/+; Hgf fl/+ given 3 mg tamoxifen at embryonic day (E) 9.5. (E–H, I–L, M–P) Diaphragm and limb muscle in three mutant PdgfraCreERT2/+; HgfΔ/fl embryos given 3 mg tamoxifen at E9.5. In the mildest phenotype, loss of ventral diaphragm muscle (asterisk, E), but normal limb and shoulder muscles (F–H; n = 3/10). In the moderate phenotype, shoulder muscles were affected by the diaphragm (n = 4/10). Absence of diaphragm muscle (I) accompanied by reduced spinodeltoid and mispatterned acromiodeltoid (J–L). Similarly, loss of diaphragm muscle, except in ventral-most region (red dotted line, remaining purple is AP stain trapped in connective tissue layer, M) and normal limb muscle except spinodeltoid reduced and acromiodeltoid absent (asterisk, N–P). (Q–T) In PdgfraCreERT2/+; HgfΔ/fl embryo given 6 mg tamoxifen at E9.5 near complete loss of both diaphragm and limb muscle (n = 1/2). Embryos harvested between E16.5 and E18.5. All samples stained with Myosin antibody. ad, acromiodeltoid; sd, spinodeltoid; tbla, triceps brachii lateral; tblo, triceps brachii long. Scale bars: (A, E, I, M) 1 mm; (B, F, J, N, Q, R) 500 μm; (C, D, G, H, K, L, O, P, S, T) 500 μm.
-
Figure 2—source data 1
Limb and diaphragm phenotypes at embryonic days (E) 16.5–E18.5 following deletion of Hgf in Pdgfra lineage.
- https://cdn.elifesciences.org/articles/74592/elife-74592-fig2-data1-v1.xlsx
Figure 3 with 2 supplements
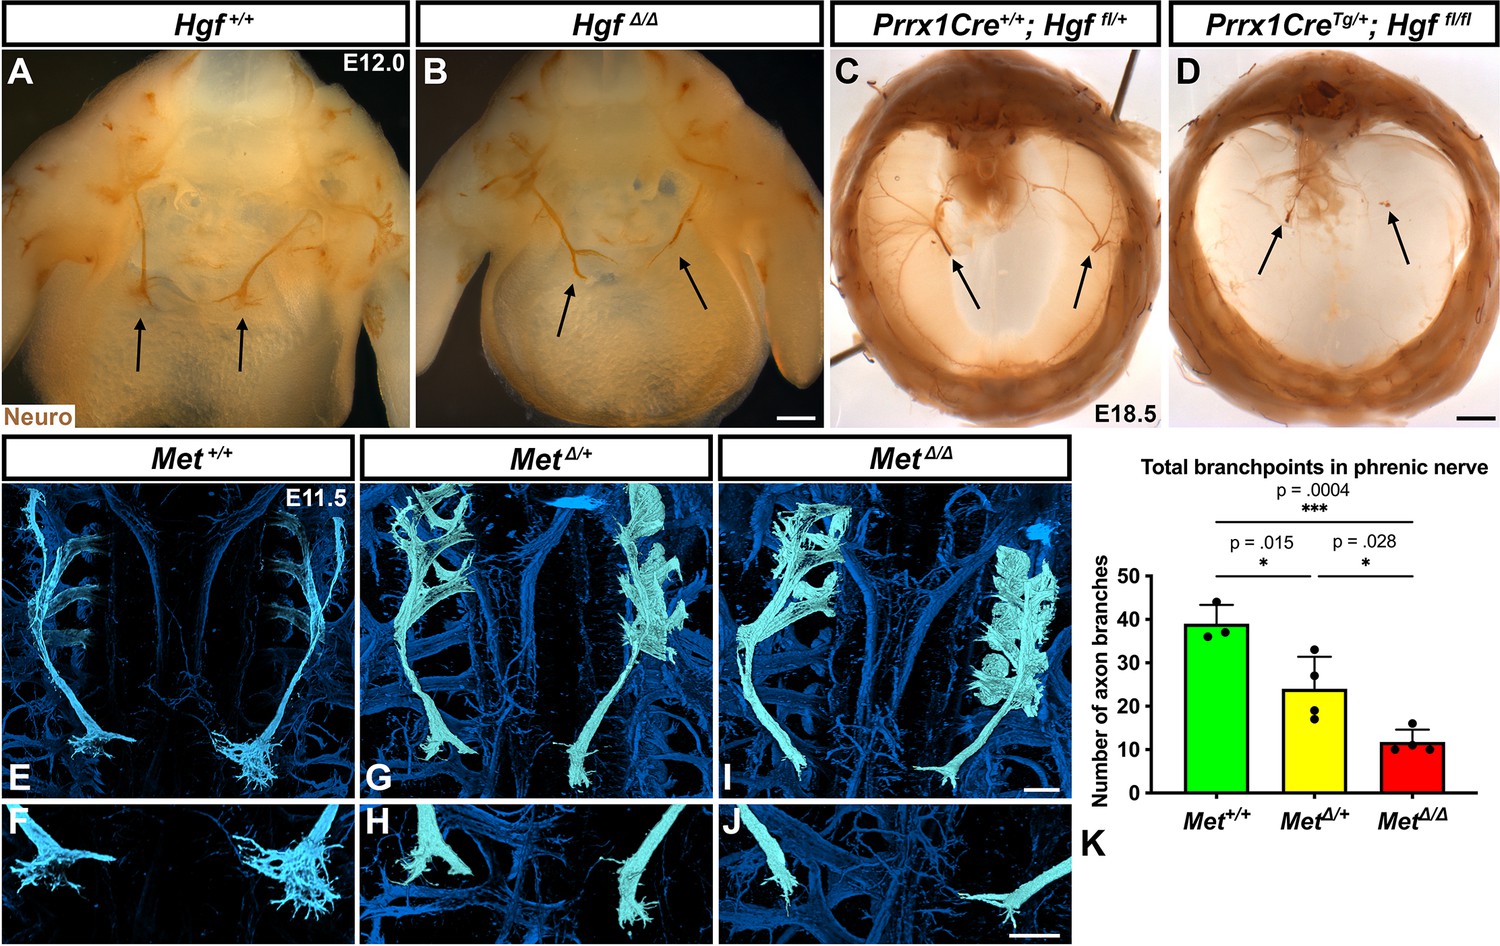
Loss of Hgf and Met leads to defasciculation defects in the phrenic nerve.
Whole-mount neurofilament staining of the phrenic nerve in control (A, C, E, F) or Hgf (B, D) or Met mutants (G–J). Cranial view of dissected diaphragm region viewed with light microscopy (A–D) showing loss of phrenic nerve branches in HgfΔ/Δ (n = 3) diaphragm (arrows, A, B) and Prrx1CreTg/+; Hgf fl/fl diaphragm (arrows, C, D). Dorsal whole-mount view via confocal microscopy shows reduced phrenic nerve defasciculation in MetΔ/+ and MetΔ/Δ diaphragms (E–J). Phrenic nerve and C3-5 spinal nerves pseudocolored in light blue. (K) Quantification of phrenic nerve branchpoints at embryonic day (E) 11.5 in Met+/+ (n = 3), MetΔ/+ (n = 4), and MetΔ/Δ (n = 4) embryos. Significance tested with one-way ANOVA; error bars represent standard error of the mean (SEM). Scale bars: (A, B) 250 μm; (C, D) 1 mm; (E, G, I) 100 μm; (F, H, J) 100 μm.
-
Figure 3—source data 1
Diaphragm and phrenic nerve phenotypes following deletion of Hgf or Met.
- https://cdn.elifesciences.org/articles/74592/elife-74592-fig3-data1-v1.xlsx
Figure 3—figure supplement 1
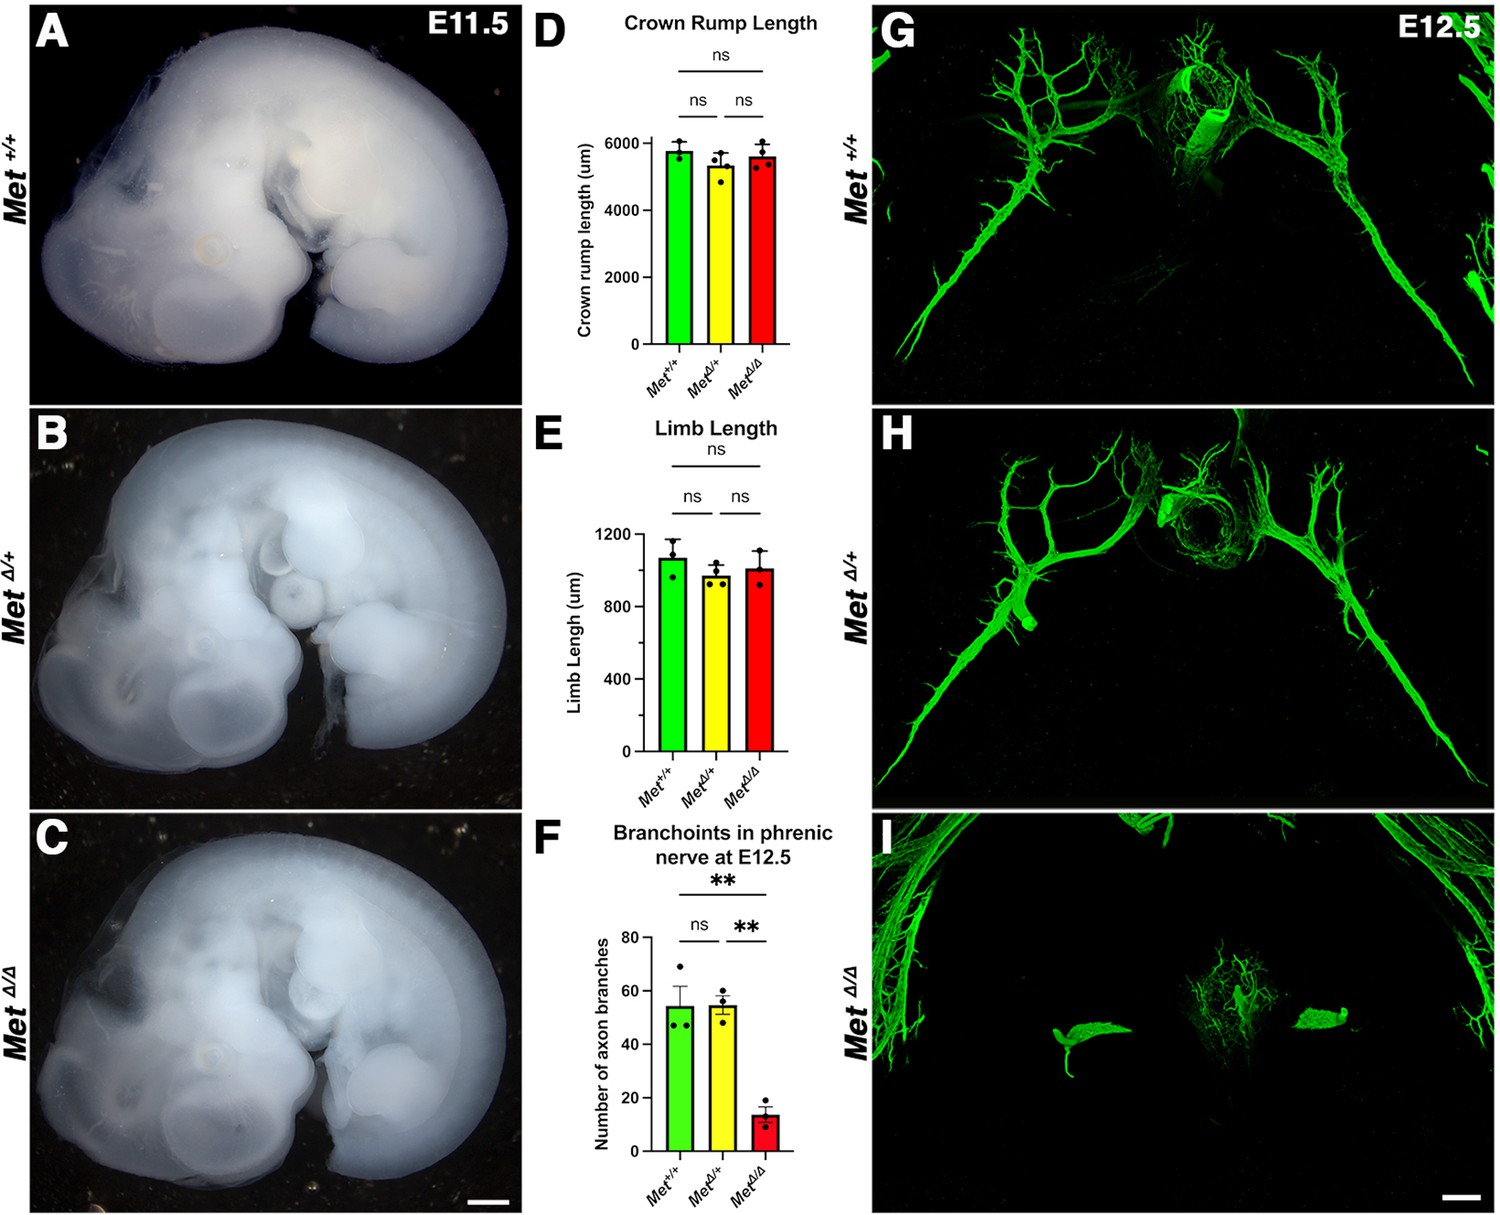
At embryonic day (E) 11.5, limb length and crown-rump length were not significantly different between Met+/+, Met∆/+, and Met∆/∆ embryos; branchpoints in Met∆/+ embryos are equivalent to Met+/+ at E12.5.
(A–C) Lateral view of unstained embryos (from the same cohort measured in Figure 3E–J). (D) Quantification of crown rump length. (E) Quantification of Limb length. (F) Quantification of branchpoints in sternocostal and dorsocostal phrenic nerve at E12.5. Significance tested with one-way ANOVA; error bars represent standard error of the mean (SEM). **p<0.01. (G–I) Cranial view of phrenic nerve stained with neurofilament at E12.5 in Met+/+, Met∆/+, and Met∆/∆. Embryos (n = 3). Scale bars: (A–C) 500 μm; (G, I) 100 μm.
-
Figure 3—figure supplement 1—source data 1
qPCR for Pax7, Met, and Hgf from embryonic day (E) 12.5 pleuroperitoneal folds (PPFs).
- https://cdn.elifesciences.org/articles/74592/elife-74592-fig3-figsupp1-data1-v1.xlsx
Figure 3—figure supplement 2
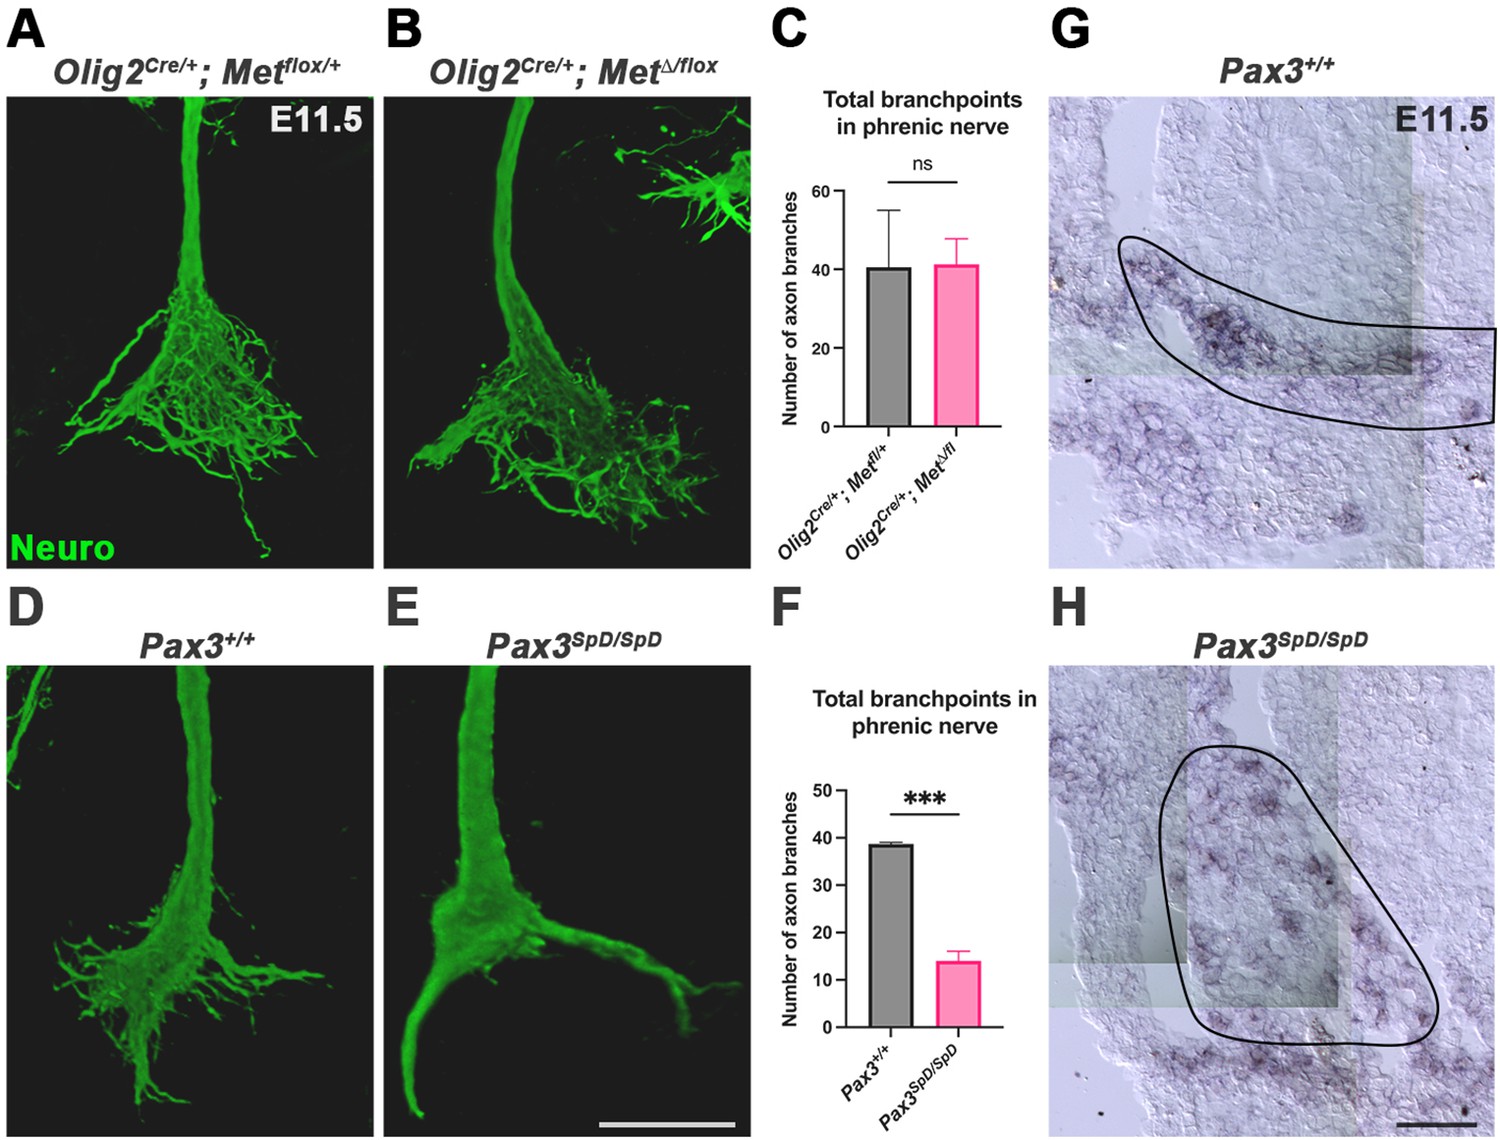
Loss of Met in Olig2 lineage does not lead to defects in phrenic nerve branching and Hgf is not sufficient to rescue defasciculation defects in the absence of diaphragm muscle.
(A, B) Lateral view of the right phrenic nerve at embryonic day (E) 11.5 stained for neurofilament and imaged in whole mount by confocal microscopy. (C) Number of branches in phrenic nerve at E11.5 was not significantly different in Olig2Cre/+; Met∆/flox embryos (n = 4) compared to controls. (D, E) Anterior view of the right phrenic nerve at E11.5 stained for neurofilament and imaged in whole mount of Pax3SpD/SpD mutants compared to littermate controls. (F) Number of branches in phrenic nerve at E11.5 was significantly lower in Pax3SpD/SpD embryos (n = 3) compared to controls. Significance tested with unpaired t test; error bars represent standard error of the mean (SEM). ***p<0.001. (G, H) Hgf in situ hybridization on transverse section of E11.5 embryos. Hgf is expressed in Pax3+/+ (G) and muscleless Pax3SpD/SpD (H) pleuroperitoneal fold (PPF) (outline). Scale bars: (A, B, D, E) 100 μm; (G, H) 50 μm.
-
Figure 3—figure supplement 2—source data 1
Number of axon branchpoints after deletion of Met in Olig2 lineage and in Pax3SpD/SpD mutants.
- https://cdn.elifesciences.org/articles/74592/elife-74592-fig3-figsupp2-data1-v1.xlsx
Figure 4 with 1 supplement
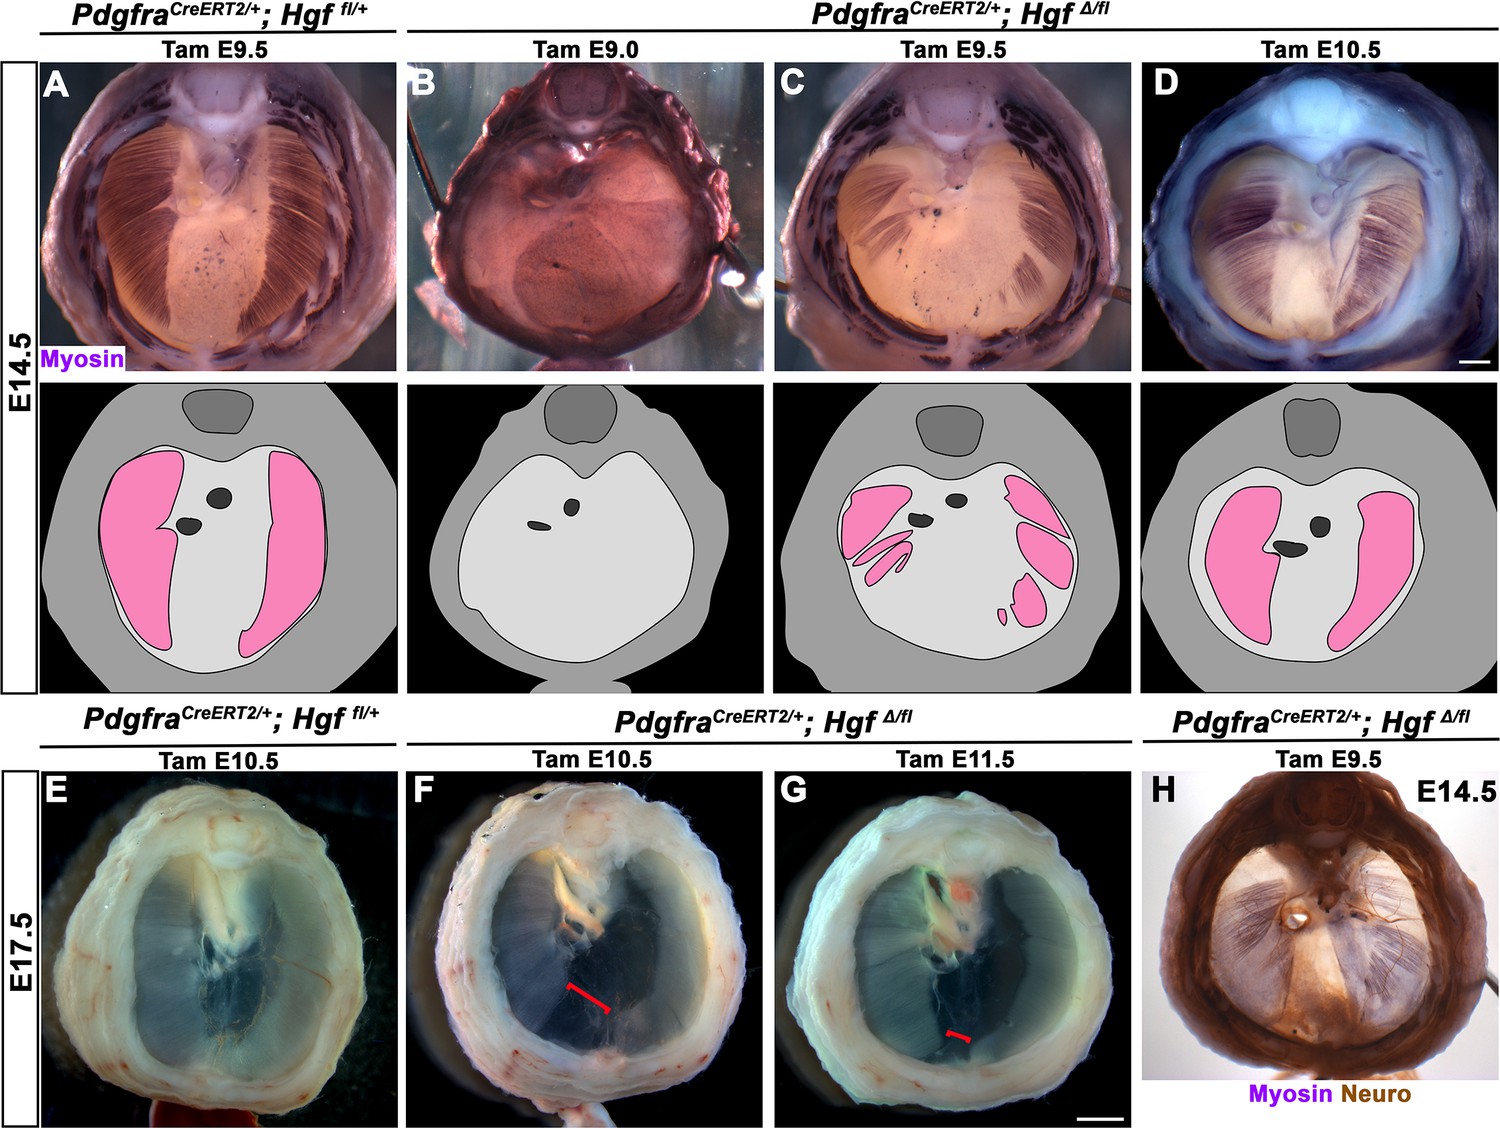
Loss of diaphragm muscle following timed deletion of Hgf in the pleuroperitoneal fold (PPF) fibroblast lineage.
(A–D) Upper panels: cranial view of embryonic day (E) 14.5 diaphragms stained for Myosin. Middle row panels: illustrations of muscle distribution. (A) Control PdgfraCreERT2/+; Hgf fl/+ diaphragm muscle forms two lateral wings that have not yet converged ventrally. (B) Muscleless diaphragm in PdgfraCreERT2/+; HgfΔ/flox when tamoxifen is administered at E9.0 (n = 3/3). (C) Large muscleless regions in ventral and dorsal diaphragm following tamoxifen administration at E9.5 (n = 6/6). (D) PdgfraCreERT2/+; HgfΔ/flox muscle reaches normal ventral extent when tamoxifen is administered at E10.5 (n = 11/13). (E–G) Unstained E17.5 diaphragms in cranial view. (E) Control diaphragm muscle has closed ventrally. (F) Large ventral muscleless region following HGF deletion at E10.5 (red bracket, n = 3/3). (G) Smaller ventral muscleless region following tamoxifen at E11.5 (red bracket, n = 4/4). (H) Cranial view of E14.5 PdgfraCreERT2/+; HgfΔ/flox mutant with tamoxifen administered at E9.5. Diaphragm stained for Myosin and neurofilament, indicating phrenic nerve tracks with regions of muscle (n = 3/3). Scale bars: (A–D, H) 500 μm; (E–G) 1 mm.
-
Figure 4—source data 1
Timed deletion of Hgf in the pleuroperitoneal fold (PPF) fibroblast lineage.
- https://cdn.elifesciences.org/articles/74592/elife-74592-fig4-data1-v1.xlsx
Figure 4—figure supplement 1
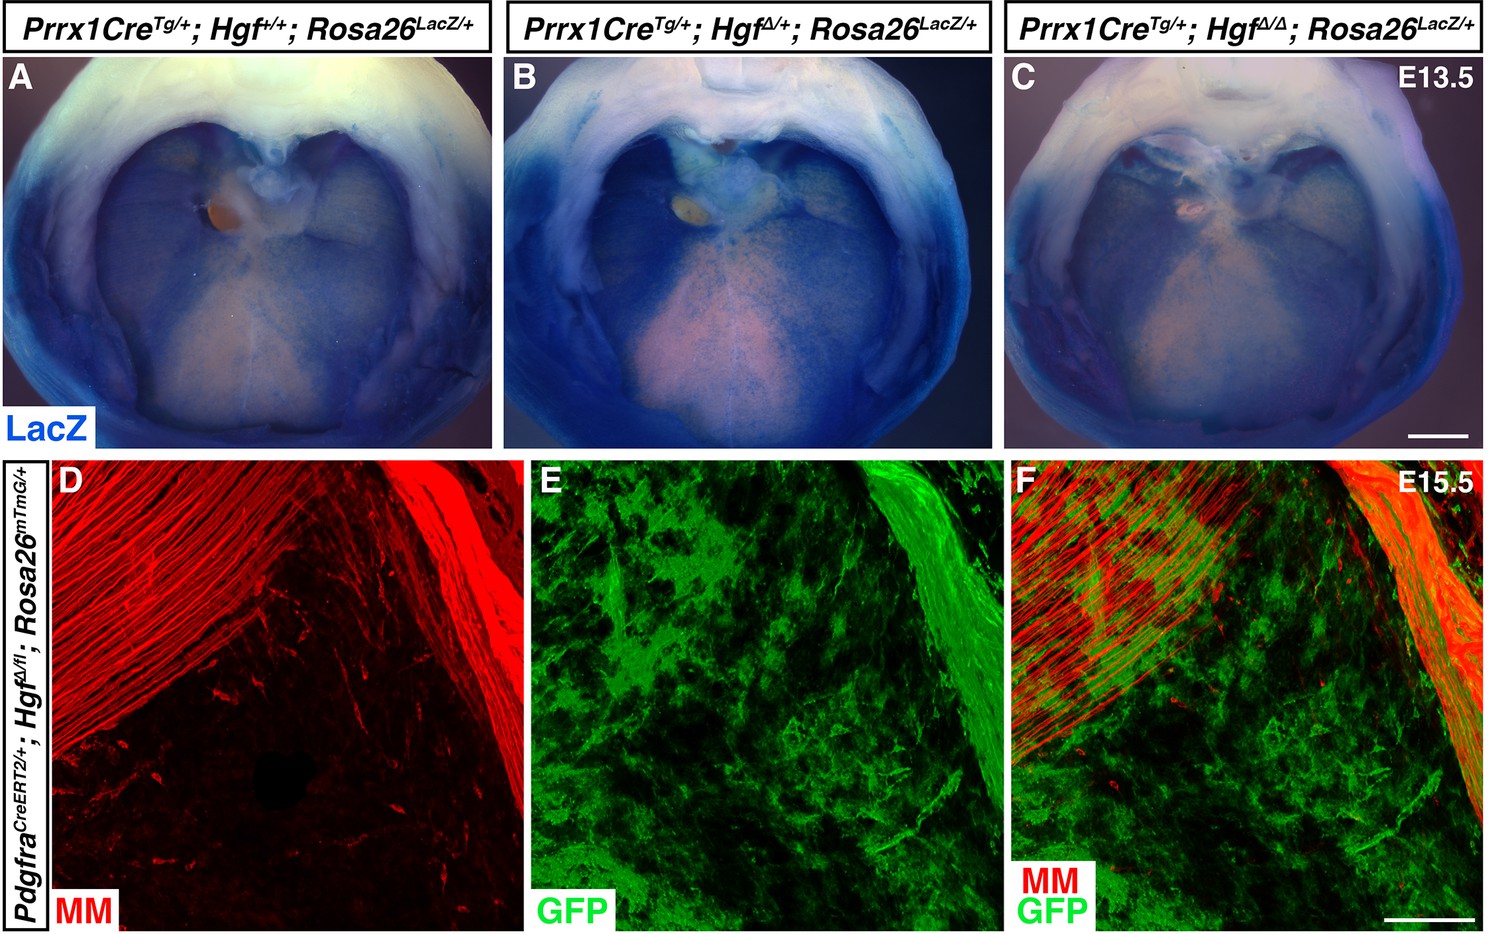
Pleuroperitoneal folds (PPFs) spread normally and PPF fibroblasts are present in muscleless regions following deletion of Hgf.
(A–C) Cranial view of embryonic day (E) 13.5 Prrx1CreTg/+; Rosa26LacZ/+ diaphragms stained for LacZ. (A) By E13.5, PPFs have spread throughout the dorsal and all but the ventral-most region of the diaphragm. (B, C) PPF spread is unaffected in E13.5 embryos heterozygous or null for Hgf (n = 3). (D–F) Cranial view of E15.5 PdgfraCreERT2/+; Hgf∆/fl; Rosa26mTmG/+ diaphragm stained for GFP, Myosin, Pax7, and MyoD (MM, muscle markers). GFP+ fibroblasts are present in muscleless region (n = 4). Scale bars: (A–C) 500 μm; (D–F) 100 μm.
-
Figure 4—figure supplement 1—source data 1
Sample information for spreading of pleuroperitoneal folds (PPFs) after deletion of Hgf.
- https://cdn.elifesciences.org/articles/74592/elife-74592-fig4-figsupp1-data1-v1.xlsx
Figure 5 with 1 supplement
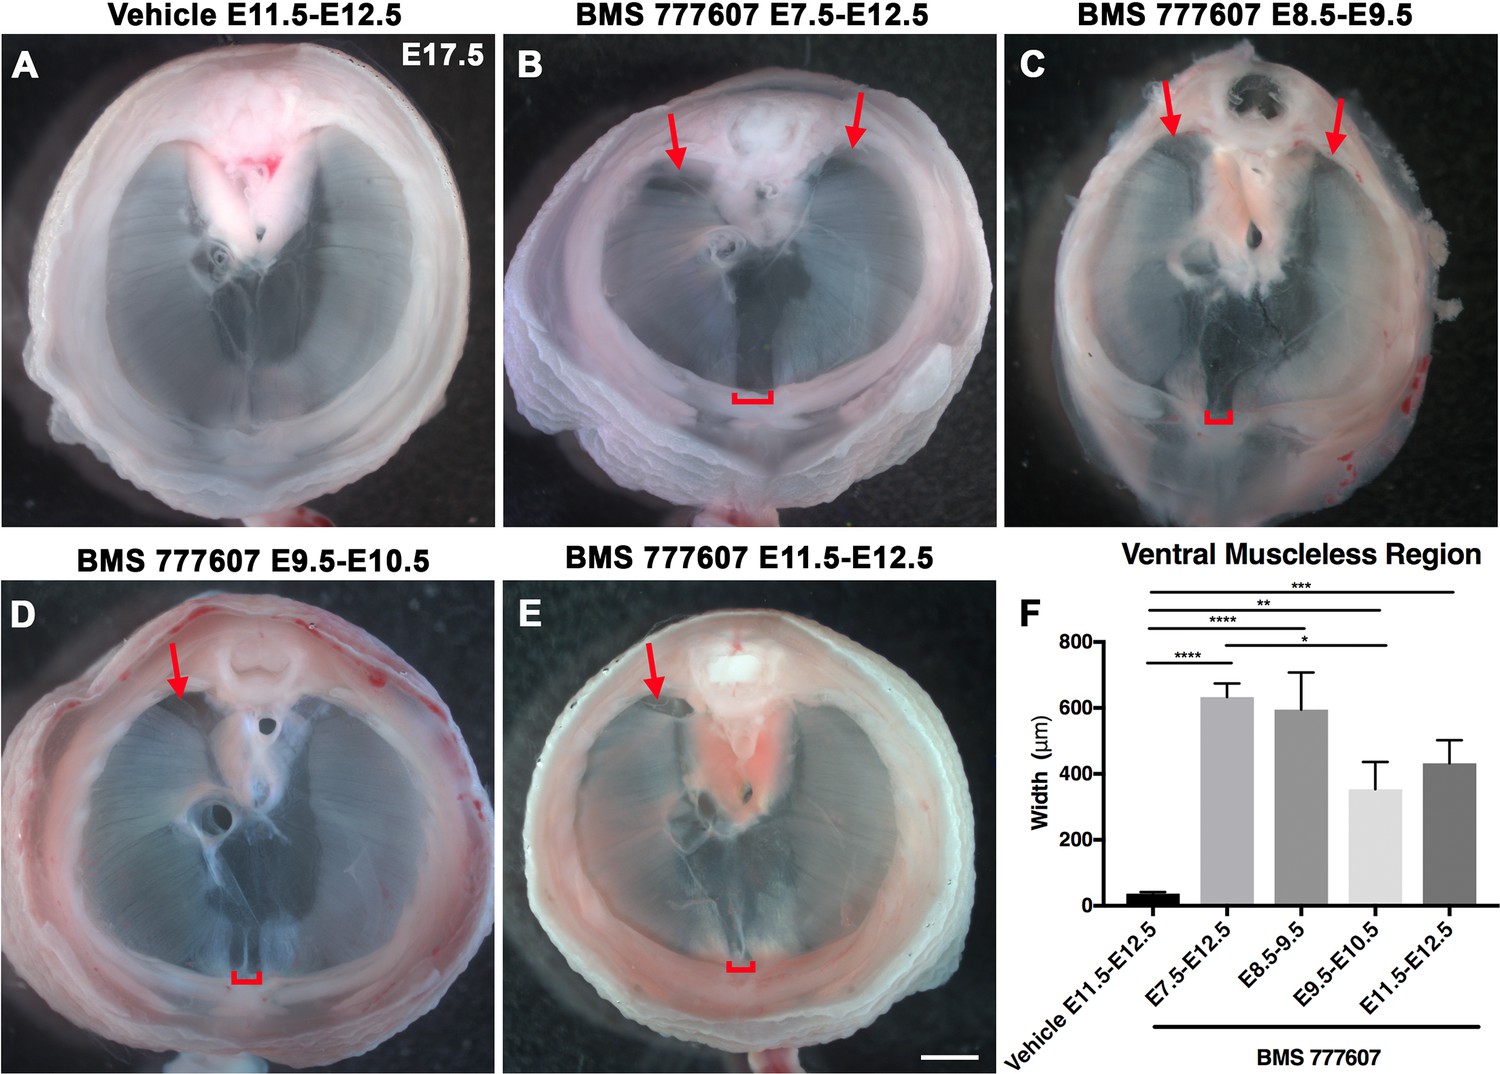
Reduction of Met signaling through inhibitor BMS777607 results in muscleless dorsal and ventral regions of the diaphragm.
(A-E) Unstained E17.5 diaphragms in cranial view. (A) The left and right portions of the costal diaphragm meet in the ventral midline by embryonic day (E) 17.5 in vehicle-treated controls (n = 12/12). (B–E) Dorsal left, dorsal right (arrows), and ventral midline regions (brackets) are muscleless when treated with BMS777607 daily between E7.5 and E12.5 (B: n = 7; C: n = 6; D: n = 8; E: n = 9). (F) Width of ventral midline muscleless region is significantly larger than vehicle-treated controls when BMS777607 is administered at either early (E7.5–E8.5) or at later stages of diaphragm development (E11.5–E12.5). Significance tested with one-way ANOVA. *p<0.05, **p<0.01, ***p<0.001, ****p<0.0001. Error bars represent standard error of the mean (SEM). Scale bars (A–E) 1 mm.
-
Figure 5—source data 1
Measurements of ventral muscle gap after timed treatments with BMS777607.
- https://cdn.elifesciences.org/articles/74592/elife-74592-fig5-data1-v1.xlsx
Figure 5—figure supplement 1
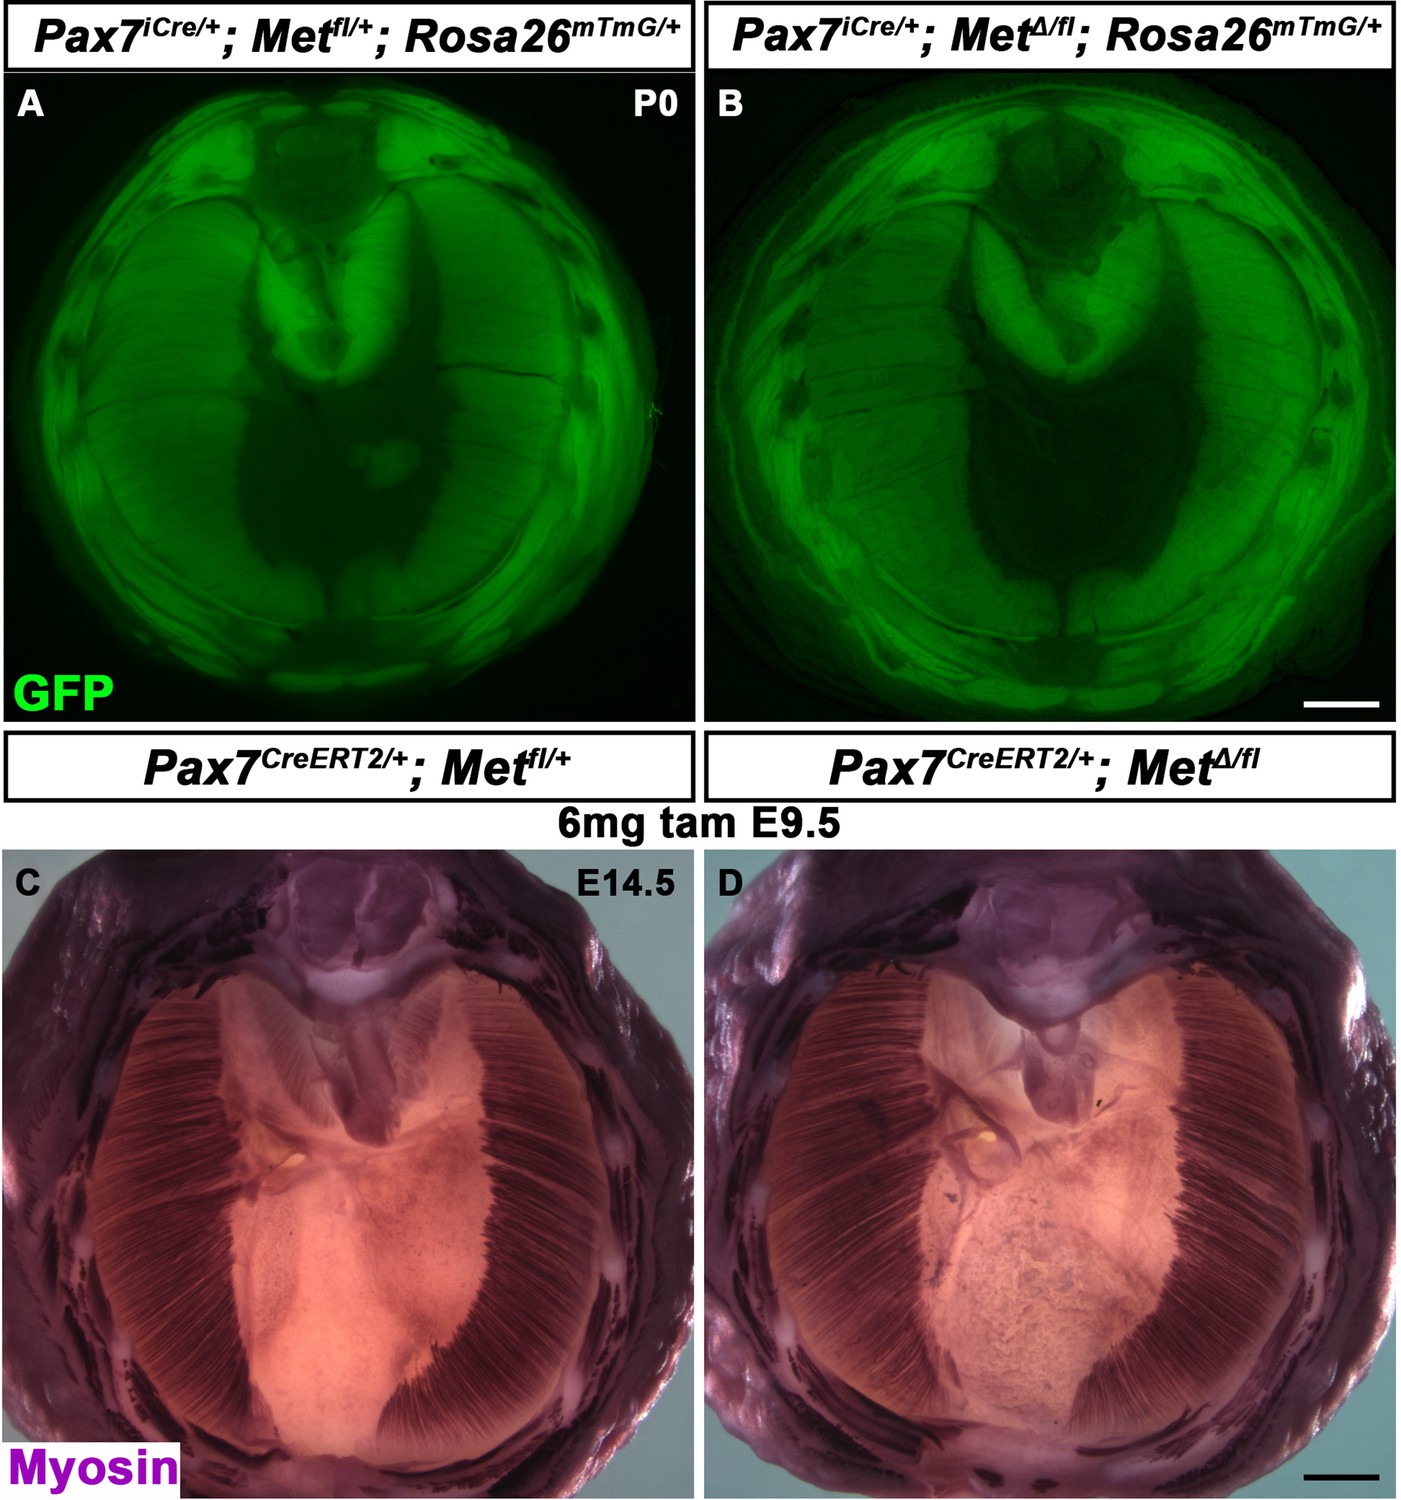
Normal muscularization of the diaphragm following deletion of Met in the Pax7 lineage.
(A, B) Normal muscle, viewed via GFP, in P0 Pax7iCre/+; MetΔ/fl; Rosa26mTmG/+ and control diaphragms (n = 4). (C–, D) Normal muscle, stained with Myosin at embryonic day (E) 14.5 in Pax7CreERT2/+; MetΔ/fl and control diaphragms given 6 mg of tamoxifen at E9.5 (n = 3). Scale bars: (A, B) 1 mm; (C, D) 500 μm.
-
Figure 5—figure supplement 1—source data 1
Sample information for Met deletion in Pax7 lineage.
- https://cdn.elifesciences.org/articles/74592/elife-74592-fig5-figsupp1-data1-v1.xlsx
Figure 6 with 2 supplements
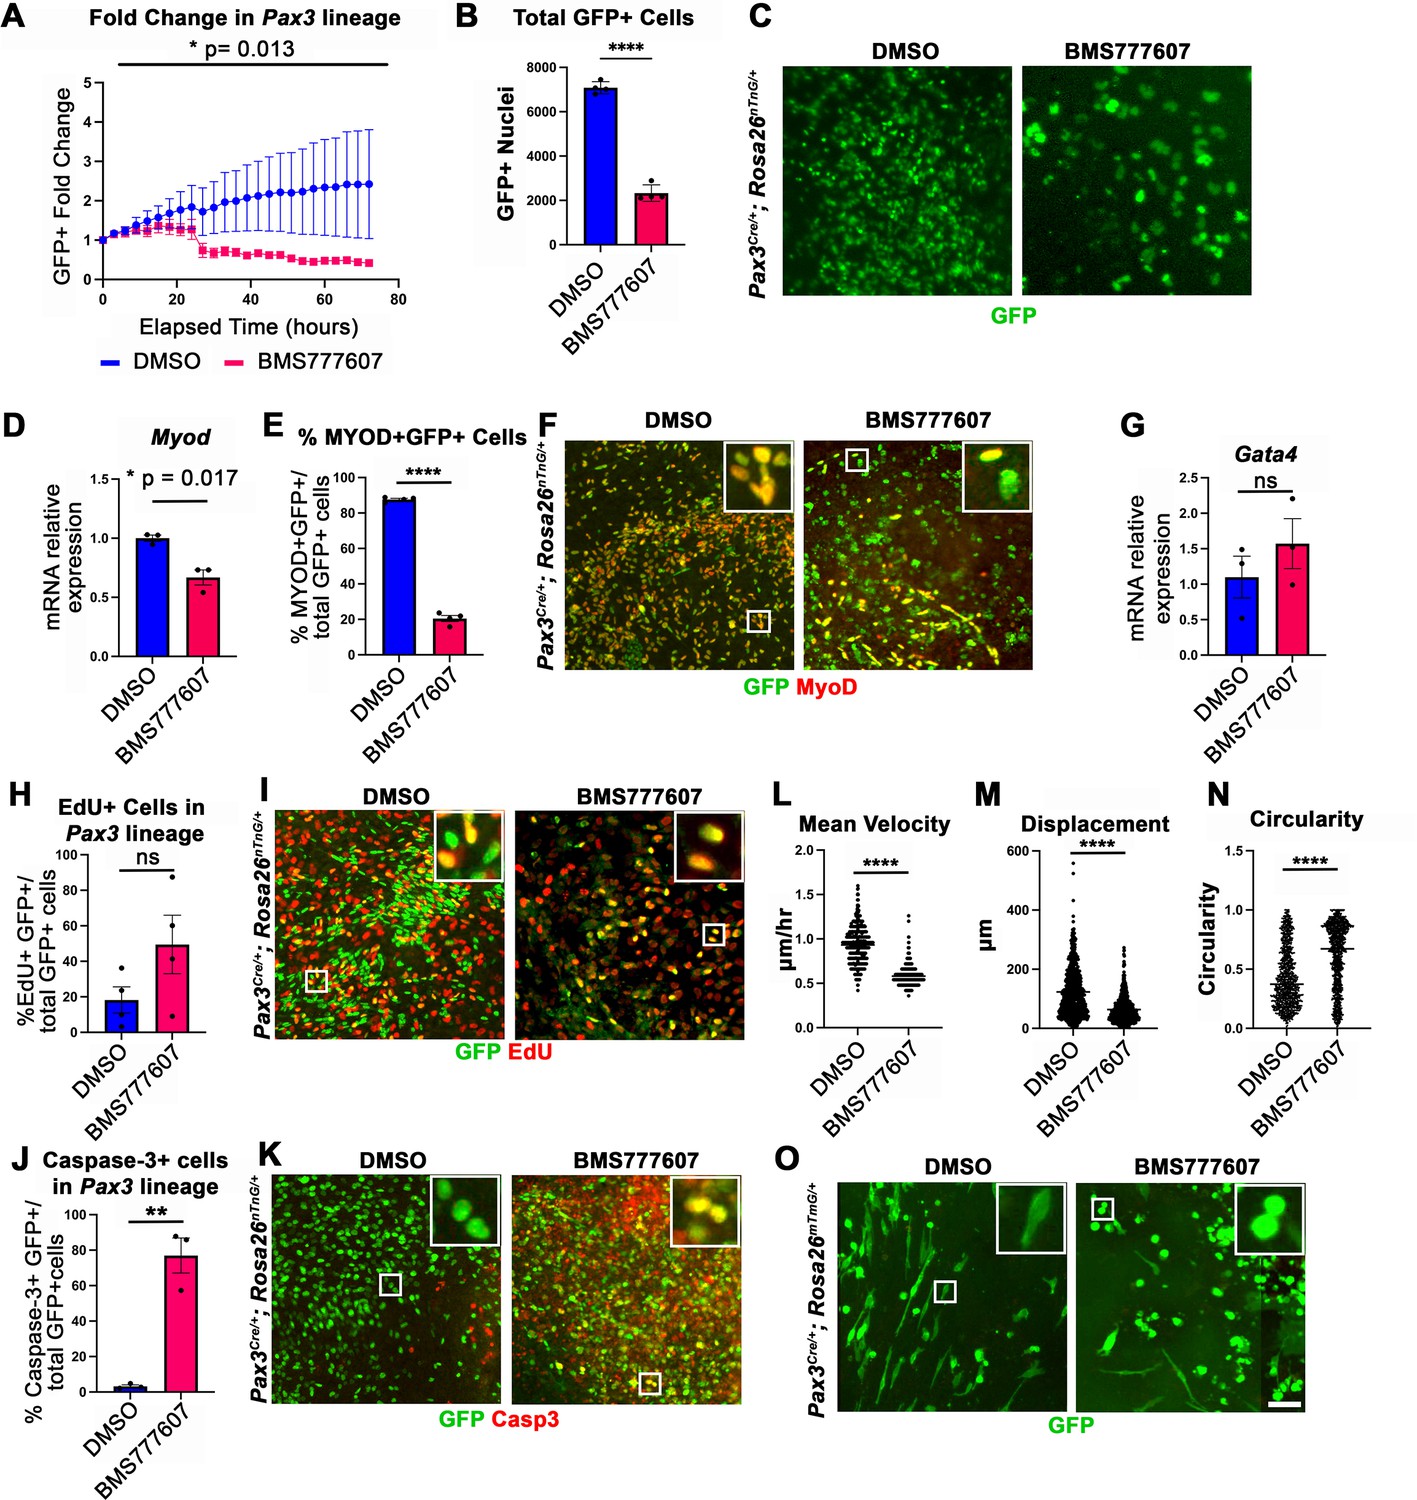
In vitro survival and motility of myogenic cells is impaired by pharmacological inhibition of Met signaling.
(A–O) Embryonic day (E) 12.5 pleuroperitoneal folds (PPFs) isolated from Pax3Cre/+; Rosa26nTnG/+ (A–M) or Pax3Cre/+; Rosa26mTmG/+ (N, O) embryos cultured with DMSO vehicle control or BMS777607 and imaged on the ImageXpress Pico. (A–C) The average ratio of GFP+ fold change (cell number at time T/cell number at time 0) ± SEM is plotted (A). The fold change (A) and total final count (B) of GFP+ cells are reduced following treatment with BMS777607 after 72 hr in culture (n = 4 biological replicates). Representative GFP images shown in (C) at 72 hr in culture. (D–F) MyoD expression (via qPCR, n = 3, D) and percentage of MyoD+ GFP+ cells (n = 4) (E) is significantly lower after 48 hr in culture with MET signaling inhibition. Representative images of GFP and MyoD expression (F). (G) Expression of PPF fibroblast marker Gata4 is not significantly affected by BMS777607 treatment (via qPCR, n = 3). (H, I) EdU labeling of GFP+ cells is not significantly changed by BMS777607 treatment (n = 4). (J, K) Cleaved Caspase-3 expression was significantly increased with BMS777607 treatment (n = 3). (L, M) Mean velocity and total displacement of peripheral GFP+ nuclei were decreased with BMS777607 treatment. GFP+ nuclei were imaged every 8 min over 14 hr to track cell motility (>500 nuclei measured from n = 3). (N, O) BMS777607-treated GFP+ cells were significantly more circular (>1000 cells measured from n = 3). Representative images (O). *p<0.05, **p<0.01, ****p<0.0001. Statistical changes in cell number over time (A) were determined using repeated-measures ANOVA on the log2 transformed fold change over time. Statistical changes determined with unpaired t test in (B, D, E, G, H, L, M, N, J). Error bars represent standard error of the mean (SEM). Scale bars: (C, F, I, K, O) 100 μm.
-
Figure 6—source data 1
In vitro effects on diaphragm muscle after pharmacological inhibition of MET signaling.
- https://cdn.elifesciences.org/articles/74592/elife-74592-fig6-data1-v1.xlsx
Figure 6—figure supplement 1
BMS777607-mediated downregulation of phospho-Met and relevant pathways to cell survival in embryonic day (E) 12.5 diaphragms.
(A) Injured skeletal muscle satellite cells in the tibialis anterior (3 days post injury) were genetically labeled by Pax7CreERT2; Rosa26Pham/+, treated with BMS777607 or vehicle control, stained for PE conjugated phospho-Met, and analyzed via FACS. Median PE levels of GFP+ cells were downregulated from 1425–793 log-scale fluorescence intensity following a 4 hr BMS777607 treatment. (B–D) E12.5 pleuroperitoneal folds (PPFs) isolated from Pax3Cre/+; Rosa26nTnG/+ embryos cultured with DMSO vehicle control or BMS777607 and RNA isolated for qPCR (n = 3). Expression of Fas cell surface death receptor (B) and autophagy marker Map1lc3a (D) is significantly upregulated by BMS777607 treatment, while Trp53, which encodes tumor protein p53, is unchanged (C). Significance tested with unpaired t test; error bars represent standard error of the mean (SEM). **p<0.01, ***p<0.001.
-
Figure 6—figure supplement 1—source data 1
qPCR data for Fas, Map1lc3a, and Trp53.
- https://cdn.elifesciences.org/articles/74592/elife-74592-fig6-figsupp1-data1-v1.xlsx
Figure 6—figure supplement 2
Initial muscle lineage and final nuclear density following vehicle and BMS777607 treatment.
(A–D) Embryonic day (E) 12.5 pleuroperitoneal folds (PPFs) isolated from Pax3Cre/+; Rosa26nTnG/+, and treated with DMSO (left column) or BMS777607 (right column). (A, B) GFP fluorescence at t = 0 hr of imaging. (C, D) Hoechst stain of fixed E12.5 PPFs after t = 72 hr of imaging. Scale bars: (A–D) 500 μm.
Figure 7
Inhibition of Met signaling in vivo alters cell proliferation, apoptosis, phrenic nerve morphology, and reduces muscle progenitors at the leading edge of the diaphragm.
(A–N) WT embryos were treated with BMS777607 or vehicle control daily between embryonic day (E) 7.5 and E11.5, harvested at E12.5, stained for Pax7/MyoD/Myosin (MM) and neurofilament, and imaged in whole-mount cranial view on the confocal. Treatment with BMS777607 leads to fewer mononuclear myogenic cells on the dorsal and ventral leading edges of the diaphragm (arrows; A, D, H, K), reduced total EdU-positive nuclei (n = 3 vehicle treated; n = 4 BMS777607 treated; B, E, G), increased cleaved-caspase-3 positive cells (n = 3; I, L, N), and aberrant phrenic nerve branching (F, M), where the right phrenic nerve wraps around vena cava (asterisk in F, M). Schematic of region imaged (black box) in (G). (O–V) Pax3Cre/+; Rosa26mTmG/+ embryos were treated with BMS777607 or vehicle at E11.5 and E12.5, harvested at E15.5 and stained for GFP and MM. Tomato is unlabeled. (O–T) Cranial view of leading ventral edges of the diaphragm at E15.5, with mononuclear muscle progenitors in region that will fill with muscle by E16.5. (U) Fewer mononuclear Pax7/MyoD/Myosin+ cells populate the leading edge following treatment with BMS777607 (n = 3). (V) Quantification of mononuclear GFP+ cells in vehicle or BMS777607-treated embryos. Significance analyzd with unpaired t test; error bars represent standard error of the mean (SEM). *p<0.05 **p<0.01.Schematic of region imaged (black box) in (V). Scale bars: (A–F, H–M) 100 μm; (O–T) 50 μm.
-
Figure 7—source data 1
In vivo reduction diaphragm muscle at the leading ventral edge after pharmacological inhibition of MET signaling.
- https://cdn.elifesciences.org/articles/74592/elife-74592-fig7-data1-v1.xlsx
Figure 8
Model of HGF-MET signaling in skeletal muscle and phrenic nerve in the diaphragm.
(A) Our data support a model where pleuroperitoneal fold (PPF) fibroblast-derived HGF directly regulates recruitment, survival, and expansion of MET+ muscle progenitors (in red) and indirectly, via muscle, regulates phrenic nerve (in yellow) branching and outgrowth. (B) Met null mutations or Met deletion in muscle progenitors (prior to embryonic day [E] 9.0) lead to muscleless limbs and diaphragm and reduced defasciculation of the phrenic nerve. Pharmacological inhibition of MET between E7.5 and E11.5 or later time points (i.e., E11.5–12.5) results in reduced muscle progenitors (via increased apoptosis and reduced motility) at the diaphragm’s leading edges at E12.5 and muscleless regions in the dorsal and ventral diaphragm at E17.5. (C) Early deletion of fibroblast-derived HGF (tamoxifen at E9.5) at E14.5 results in large muscleless regions, including dorsal and ventral muscle regions, while later mutations (tamoxifen at E11.5) lead to ventral muscleless regions. CM, crural muscle; CT, central tendon; So, somite.
Author response image 1
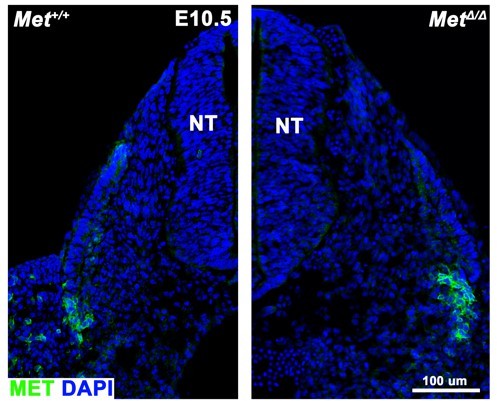
The extracellular region of MET protein (using AF527 R&D antibody) is still detected in MetD/D mutants.
Transverse cross section of E10.5 embryos with dorsal to the top; lateral is on the left side in left panel; lateral is on the right side in right panel. NT, neural tube.
Videos
Video 1
Inhibition of Met signaling in vivo reduces muscle progenitors at the leading edges of the diaphragm.
Embryos were treated with BMS777607 or vehicle control daily between embryonic day (E) 7.5 and E11.5, harvested at E12.5, stained for Pax7, MyoD, Myosin (muscle markers in red), and neurofilament (blue) and imaged in whole-mount cranial view on the confocal. Fewer mononuclear myogenic cells are present on the dorsal and ventral leading edges of the diaphragm at E12.5 and the phrenic nerve displays abnormal branching after treatment with BMS777607.
Tables
Key resources table
| Reagent type (species) or resource | Designation | Source or reference | Identifiers | Additional information |
|---|---|---|---|---|
| Genetic reagent (Mus musculus) | PdgfraCreERT2 | Chung et al., 2018 | RRID:IMSR_JAX:032770 | Dr. Brigid Hogan (Duke University Medical School) |
| Genetic reagent (M. musculus) | Prrx1CreTg | Logan et al., 2002 | RRID:IMSR_JAX:005584 | Dr. Clifford Tabin (Harvard Medical School) |
| Genetic reagent (M. musculus) | Pax3Cre | Engleka et al., 2005 | RRID:IMSR_JAX:005549 | Dr. Kurt Engleka (University of Pennsylvania) |
| Genetic reagent (M. musculus) | Pax7iCre | Keller et al., 2004 | RRID:IMSR_JAX:010530 | Dr. Mario Capecchi (University of Utah) |
| Genetic reagent (M. musculus) | Pax7CreER | Murphy et al., 2011 | RRID:IMSR_JAX:017763 | Dr. Gabrielle Kardon (University of Utah) |
| Genetic reagent (M. musculus) | Olig2Cre | Zawadzka et al., 2010 | RRID:IMSR_JAX:025567 | Dr. William Richardson (University College London) |
| Genetic reagent (M. musculus) | Hprt-cre | Tang et al., 2002 | RRID:IMSR_JAX:004302 | Dr. Jeffrey Mann (Monash University) |
| Genetic reagent (M. musculus) | Rosa26LacZ | Soriano, 1999 | RRID:IMSR_JAX:003309 | Dr. Philippe Soriano (Mount Sinai School of Medicine) |
| Genetic reagent (M. musculus) | Rosa26nTnG | Prigge et al., 2013 | RRID:IMSR_JAX:023537 | Dr. Edward Schmidt (Montana State University) |
| Genetic reagent (M. musculus) | Rosa26mTmG | Muzumdar et al., 2007 | RRID:IMSR_JAX:007576 | Dr. Liqun Luo (Stanford University) |
| Genetic reagent (M. musculus) | Rosa26Pham/+ | Pham et al., 2012 | RRID:IMSR_JAX:018385 | Dr. David Chan (California Institute of Technology) |
| Genetic reagent (M. musculus) | Hgffl | Phaneuf et al., 2004 | MGI:3574633 | Dr. James Wilson (University of Pennsylvania) |
| Genetic reagent (M. musculus) | Metfl | Huh et al., 2004 | RRID:IMSR_JAX:016974 | Dr. Snorri Thorgeirsson (National Institutes of Health) |
| Genetic reagent (M. musculus) | HgfΔ/+ | This paper | Generated by HGFfl crossed to Hprt-cre | |
| Genetic reagent (M. musculus) | MetΔ/+ | This paper | Generated by Metfl crossed to Hprt-cre | |
| Antibody | Anti-PAX7 (mouse monoclonal) | DSHB | Cat# PAX7 | Working concentration: 2.4 µg/ml |
| Antibody | Anti-MYOD (mouse monoclonal) | Thermo Fisher | Cat# MA5-12902 | Working concentration: 4 µg/ml |
| Antibody | Anti-MYOSIN (skeletal, fast) MY-32 (mouse monoclonal) | Sigma | Cat# M4276 | Working concentration: 10 µg/ml |
| Antibody | Anti-GFP (chick polyclonal) | Aves Labs | Cat# 2837 | Working concentration: 20 µg/ml |
| Antibody | Anti-cleaved CASPASE-3, Asp175 (rabbit polyclonal) | Cell Signaling | Cat# 9661 | Working concentration: 20 µg/ml |
| Antibody | Anti-NEUROFILAMENT-L (rabbit monoclonal) | Cell Signaling | Cat# 2837 | Working concentration: 0.48 µg/ml |
| Antibody | Anti-HGFR/c-MET (goat polyclonal) | R&D Systems | Cat# AF527 | Working concentration: 10 µg/ml |
| Antibody | Anti-PHOSPHO-MET, PE Conjugate (rabbit monoclonal) | Cell Signaling | Cat# 12468 | Working concentration: 0.5 µg/ml |
| Other | TaqMan Gata4 | Thermo Fisher | Mm00484689_m1 | Oligonucleo-tides for qPCR; cDNA product size (bp): 84 |
| Other | TaqMan Myod1 | Thermo Fisher | Mm00440387_m1 | Oligonucleo-tides for qPCR; cDNA product size (bp): 86 |
| Other | TaqMan Met | Thermo Fisher | Mm01156972_m1 | Oligonucleo-tides for qPCR; cDNA product size (bp): 74 |
| Other | TaqMan Hgf | Thermo Fisher | Mm01135193_m1 | Oligonucleo-tides for qPCR; cDNA product size (bp): 68 |
| Other | TaqMan Pax7 | Thermo Fisher | Mm01354484_m1 | Oligonucleo-tides for qPCR; cDNA product size (bp): 68 |
| Other | TaqMan 18S rRNA | Thermo Fisher | 4333760T | Oligonucleo-tides for qPCR; cDNA product size (bp): 187 |
| Other | TaqMan Fas | Thermo Fisher | Mm01204974_m1 | Oligonucleo-tides for qPCR; cDNA product size (bp): 76 |
| Other | TaqMan Trp53 | Thermo Fisher | Mm01731287_m1 | Oligonucleo-tides for qPCR; cDNA product size (bp): 133 |
| Other | TaqMan Map1lc3a | Thermo Fisher | Mm00458724_m1 | Oligonucleo-tides for qPCR; cDNA product size (bp): 63 |
| Chemical compound, drug | BMS777607 | Selleckchem | Cat# S1561 | In vivo: 0.05 mg/g of body weight In vitro: 10 μM |
Additional files
Download links
A two-part list of links to download the article, or parts of the article, in various formats.
Downloads (link to download the article as PDF)
Open citations (links to open the citations from this article in various online reference manager services)
Cite this article (links to download the citations from this article in formats compatible with various reference manager tools)
Fibroblast-derived Hgf controls recruitment and expansion of muscle during morphogenesis of the mammalian diaphragm
eLife 11:e74592.
https://doi.org/10.7554/eLife.74592


