Banp regulates DNA damage response and chromosome segregation during the cell cycle in zebrafish retina
- Developmental Neurobiology Unit, Okinawa Institute of Science and Technology Graduate University, Japan
Figures
Figure 1 with 6 supplements
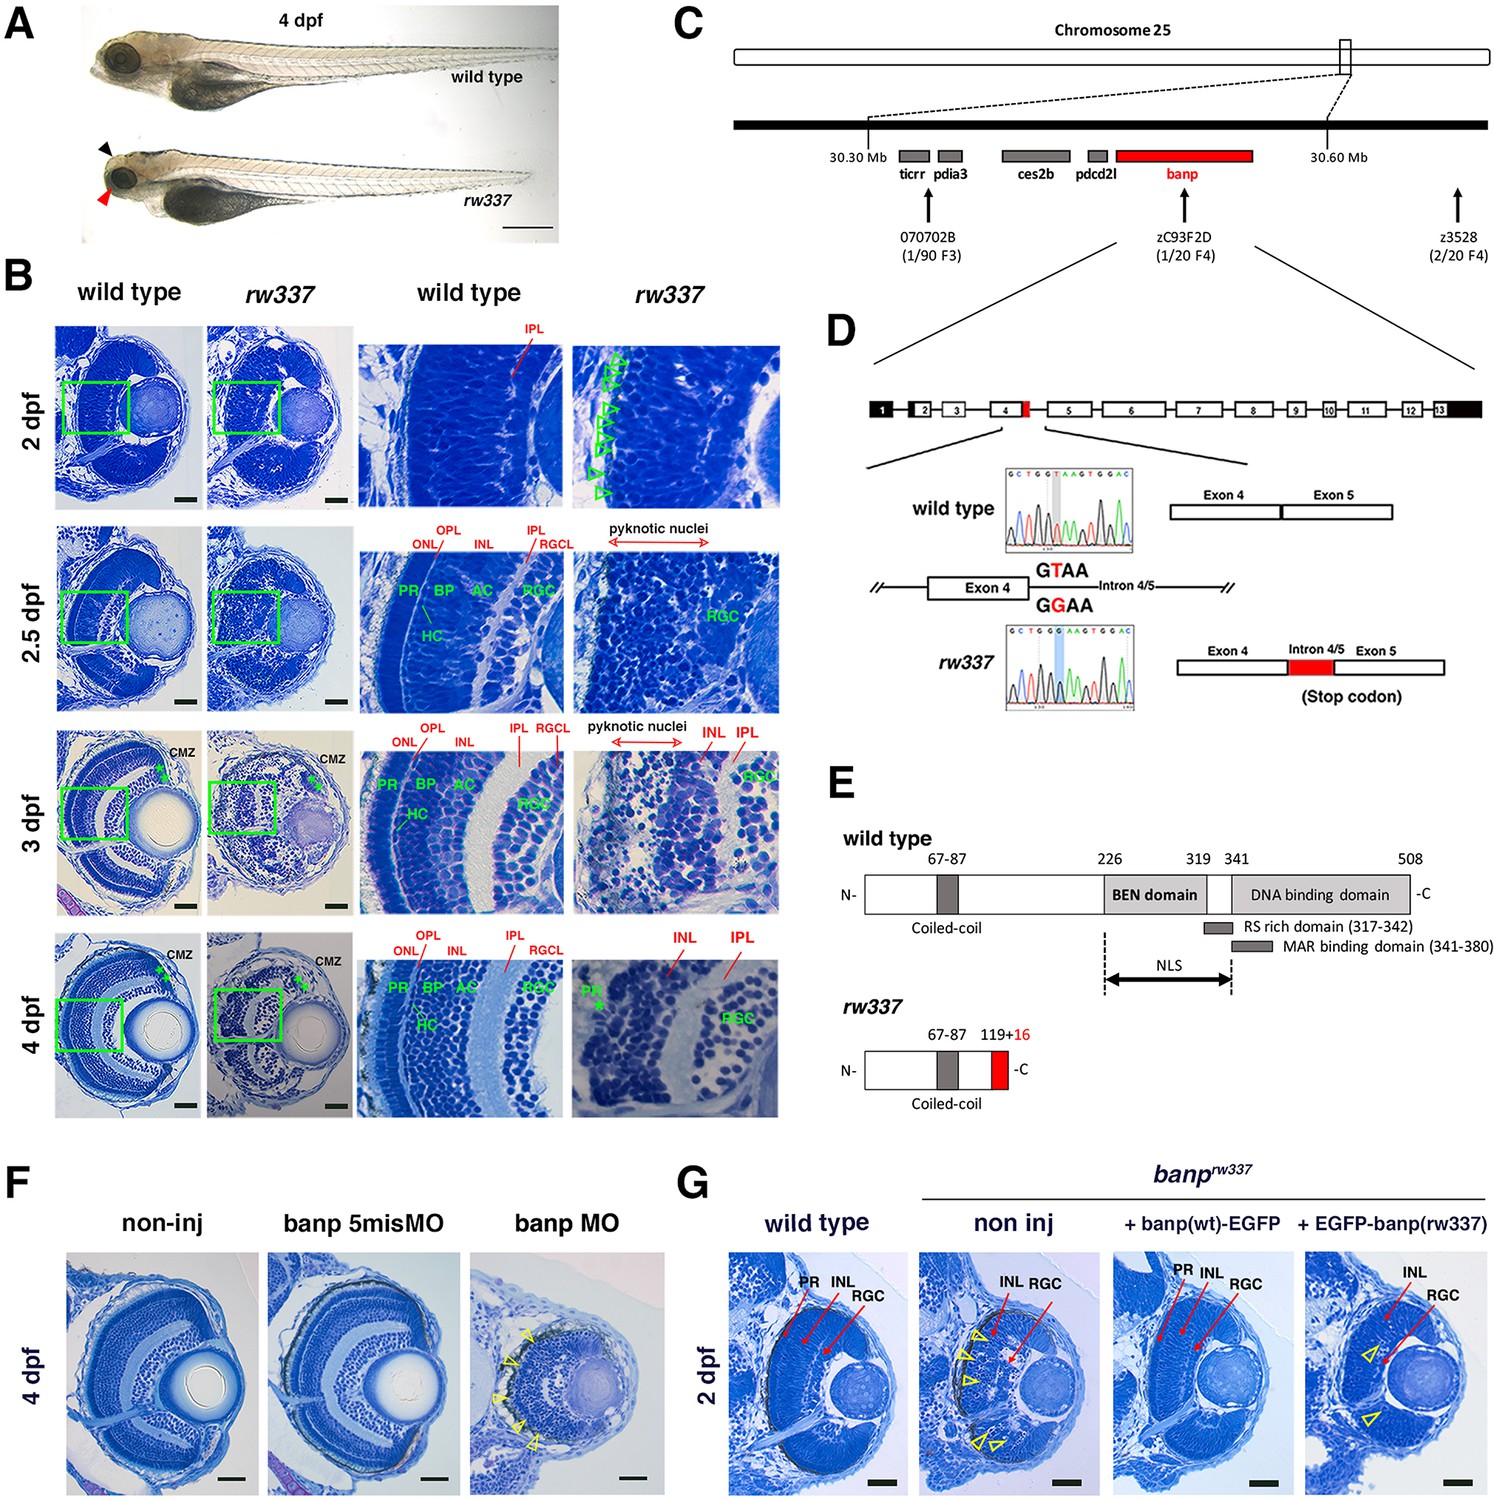
Zebrafish banprw337 mutants show mitotic cell accumulation and cell death in the developing retina.
(A) Morphology of wild-type and rw337 mutant embryos at 4 dpf. rw337 mutant embryos have smaller eyes compared to wild type at 4 dpf (red arrow). The black arrow shows the cloudy tectum in rw337 mutant embryos, representing cell death. Scale bars: 100 μm. (B) Plastic sections of wild-type and rw337 mutant retinas during development. Higher magnification images of green squares in the left columns are shown in the right columns. Retinal neuroepithelium is normal in rw337 mutants until 2 dpf. However, many round cells reminiscent of mitotic cells are accumulated in the apical region of rw337 mutant retinas at 2 dpf (open green arrowheads), suggesting mitotic defects in retinal progenitor cells. In wild-type retinas, three nuclear layers (RGCL, INL, and ONL) and two plexiform layers (IPL and OPL) are formed at 2.5 dpf. INL consists of amacrine cells (ACs), bipolar cells (BPs), and horizontal cells (HCs). ONL consists of two types of photoreceptors (PRs), rods and cones. However, only RGCs appear near the lens and the outer region was occupied by pyknotic nuclei, indicating dead cells in rw337 mutants. At 3 dpf, INL is formed, but the outer region is still occupied by pyknotic nuclei in rw337 mutants. At 4 dpf, pyknotic nuclei are reduced in rw337 mutants; however, ONL and OPL are absent despite the small number of photoreceptor-like columnar cells in putative INL (PR, asterisks). At 3 and 4 dpf, the CMZ is maintained in rw337 mutants (green double asterisks). (C) The rw337 mutation is mapped in the genomic region flanked by two polymorphic markers, 070702B and zC93F2D, on chromosome 25. This genomic region contains four genes, including banp. (D) banp cDNA consists of 13 exons. In rw337 mutants, T at the donor splice site of the intron between exons 4 and 5 (intron4/5) is converted to G, leading to the insertion of 52 nucleotides (red region) from intron 4/5. A new stop codon appears within this insertion. (E) Wild-type Banp protein has a coiled-coil domain, a BEN domain and a DNA-binding domain. An NLS domain, an RS-rich domain, and MAR-binding domain are shown. A truncated protein missing BEN and DNA-binding domains is predicted in rw337 mutants. (F) Retinal sections of wild-type, wild-type embryos injected with banp-5misMO, and banp MO. banp morphant retinas have similar phenotypes to banprw337 mutants, with increased cell death and loss of the ONL. Yellow open arrowheads show pyknotic nuclei. (G) Retinal sections of wild-type retinas, banprw337 mutant retinas, and banprw337 mutant retinas overexpressing Banp(wt)-EGFP and EGFP-Banp(rw337). Overexpression of Banp(wt)-EGFP inhibits cell death and recovers retinal lamination in banprw337 mutants, whereas overexpression of EGFP-Banp(rw337) does not inhibit retinal defects in banprw337 mutants. Yellow open arrowheads indicate pyknotic cells in banprw337 mutant retinas and banprw337 mutant retinas overexpressing EGFP-Banp(rw337). Scale bars: 20 μm for (B, F, G).RGC, retinal ganglion cell; AC, amacrine cell, BP, bipolar cell; HC, horizontal cell; PR, photoreceptor; OPL, outer plexiform layer; IPL, inner plexiform layer; ONL, outer nuclear layer; INL, inner nuclear layer; RGCL, retinal ganglion cell layer; CMZ, ciliary marginal zone.
Figure 1—figure supplement 1

Retinal cell differentiation in banprw337 mutants at 4 dpf.
(A, B) ath5:EGFP expression in wild-type (A) and rw337 mutant (B) retinas at 4 dpf. ath5:EGFP is strongly expressed in RGCs and weakly expressed in amacrine cells and photoreceptor precursors. In rw337 mutants, ath5:EGFP expression in RGCs, amacrine cells and photoreceptor precursors is detected. (C, D) Wild-type (C) and rw337 mutant (D) retinas labeled with anti-Pax6 antibody at 4 dpf. Pax6 is strongly expressed in amacrine cells and weakly expressed in RGCs. In rw337 mutants, amacrine cells seem to be decreased in number. (E, F) Wild-type (E) and rw337 mutant (F) retinas labeled with anti-Prox1 antibody at 4 dpf. Prox1 is expressed in bipolar cells and horizontal cells. In rw337 mutants, both bipolar-like round nuclei and horizontal-like flat nuclei are observed, but horizontal-like cells are very few. (G, H) Wild-type (G) and rw337 mutant (H) retinas labeled with zpr1 antibody at 4 dpf. zpr1 antibody labels double-cone-type photoreceptors in zebrafish. In rw337 mutants, only a small cluster of zpr1-positive cells is observed in the ventro-nasal retina, suggesting that a majority of photoreceptors fail to differentiate in rw337 mutants. (I, J) Wild-type (I) and rw337 mutant (J) retinas labeled with anti-GS antibody at 4 dpf. Anti-GS antibody labels Müller cells. In rw337 mutants, Müller cells are decreased in number. (K, L) Wild-type (K) and rw337 mutant (L) retinas labeled with anti-PCNA antibody at 4 dpf. Anti-PCNA antibody labels retinal progenitor cells in the CMZ at 4 dpf. In rw337 mutants, retinal progenitor cells are maintained in the CMZ. (M, N) Phalloidin labeling of wild-type (M) and rw337 mutant (N) retinas. Phalloidin visualizes retinal synaptic layers, the IPL and OPL. In rw337 mutants, the IPL is detected, but not fully formed on the ventral side. Furthermore, there is no OPL, which is consistent with the lack of photoreceptors in rw337 mutants. Scale bars: 20 μm. RGC, retinal ganglion cell, AC, amacrine cell; BP, bipolar cell; HC, horizontal cell; PR, photoreceptor; MG, Müller cell; RPC, retinal progenitor cell; OPL, outer plexiform layer; IPL, inner plexiform layer.
Figure 1—figure supplement 2
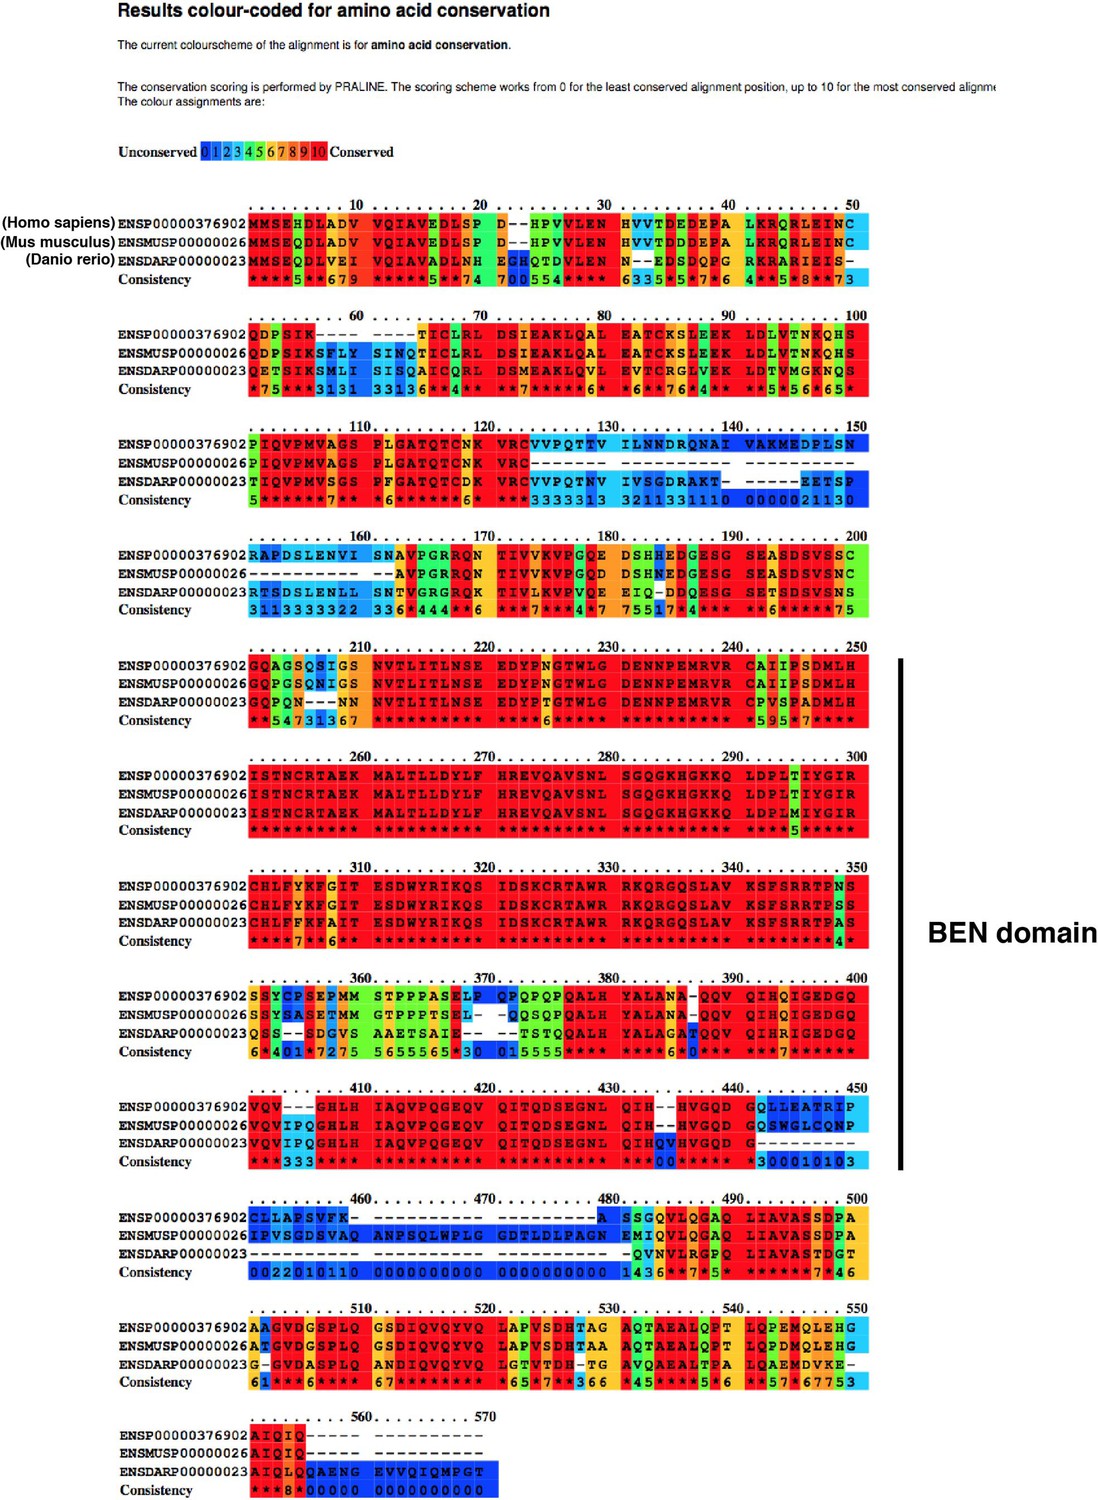
Amino acid conservation of Banp protein in zebrafish, mice and humans.
Alignment of Banp protein of humans (upper, ENSP00000376902, BANP), mice (middle, ENSMUSP00000026, SMAR1), and zebrafish (bottom, ENSDARP00000023, Banp) using a multiple sequence alignment program, PRALINE (Simossis and Heringa, 2005). Amino acid conservation is indicated by scoring and color coding from the least conserved (0, blue) to the most conserved (10, red). The BEN domain is indicated.
Figure 1—figure supplement 3
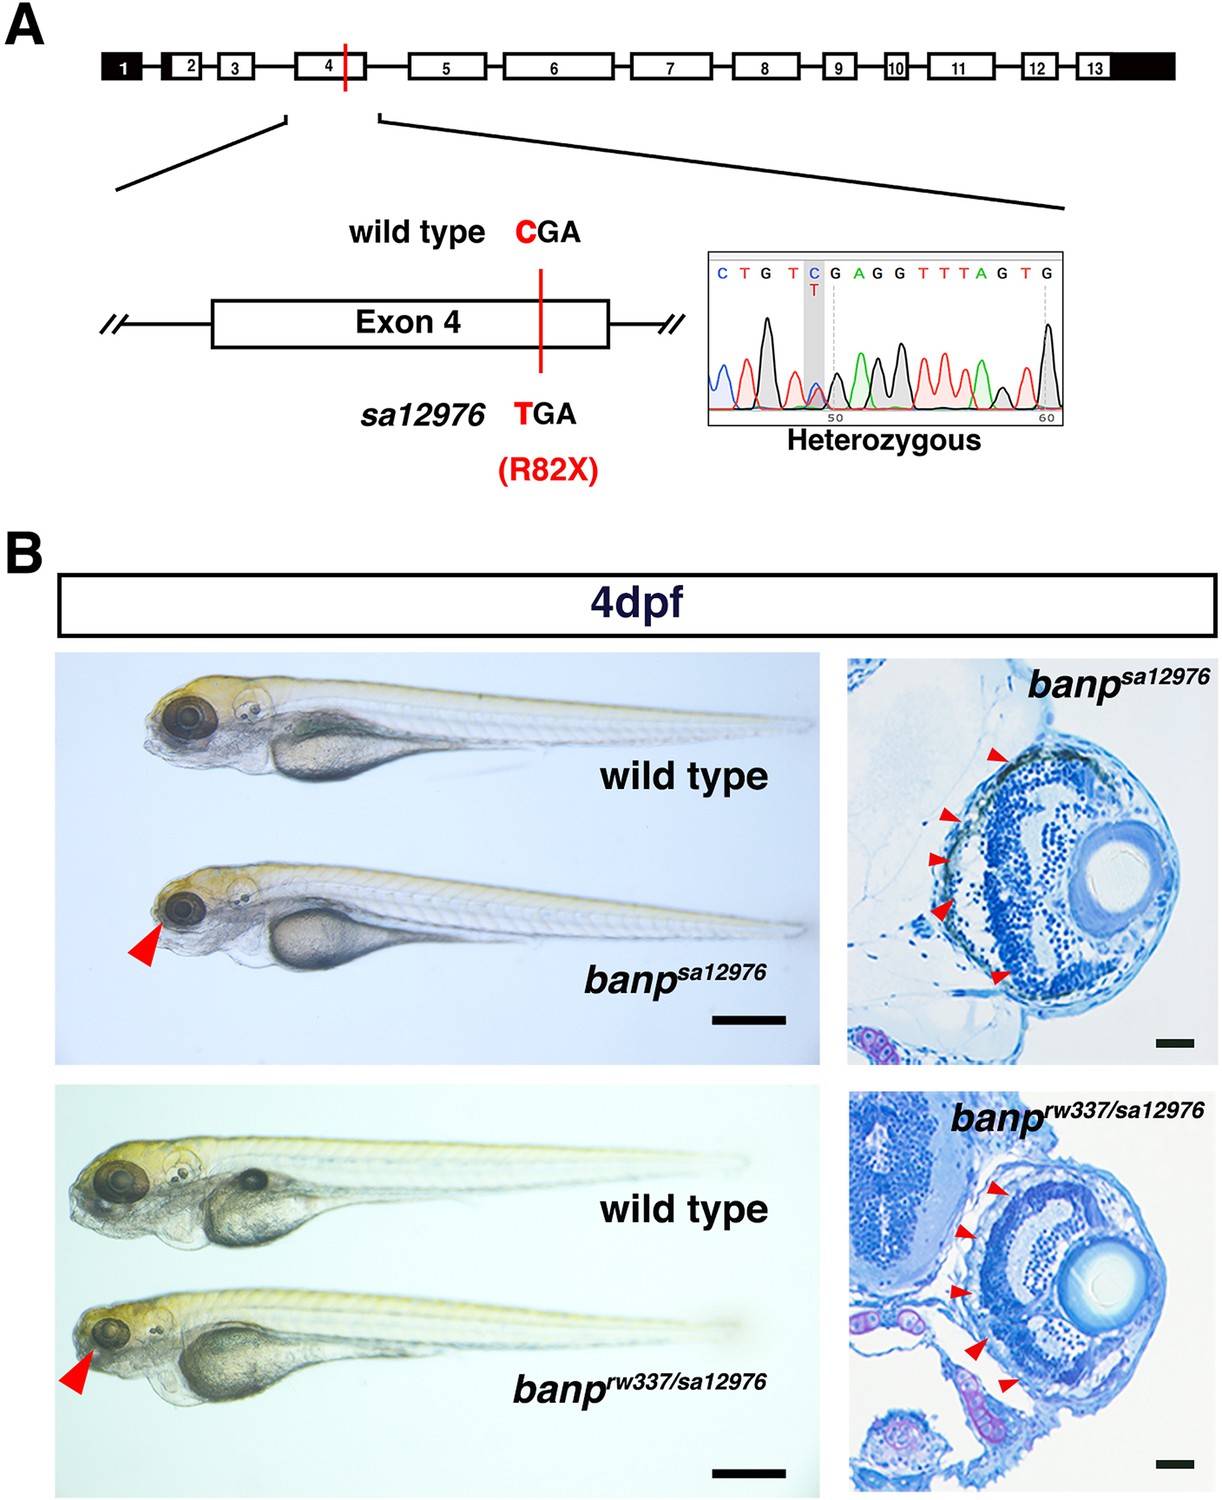
banpsa12976 homozygous mutants phenocopy rw337 mutants.
(A) Another banp mutant allele, sa12976, carries a nonsense mutation in exon 4. (B) Comparison of phenotypes between banp mutant alleles. sa12976 homozygous banp mutant alleles and trans-heterozygous rw337/sa12976 mutants show similar phenotypes to rw337: small eyes (left, red arrowheads) and retinal phenotypes: apoptosis and no ONL (right, red arrowheads). Scale bars: 100 μm (left panel). Scale bars: 20 μm (right panel).
Figure 1—figure supplement 4
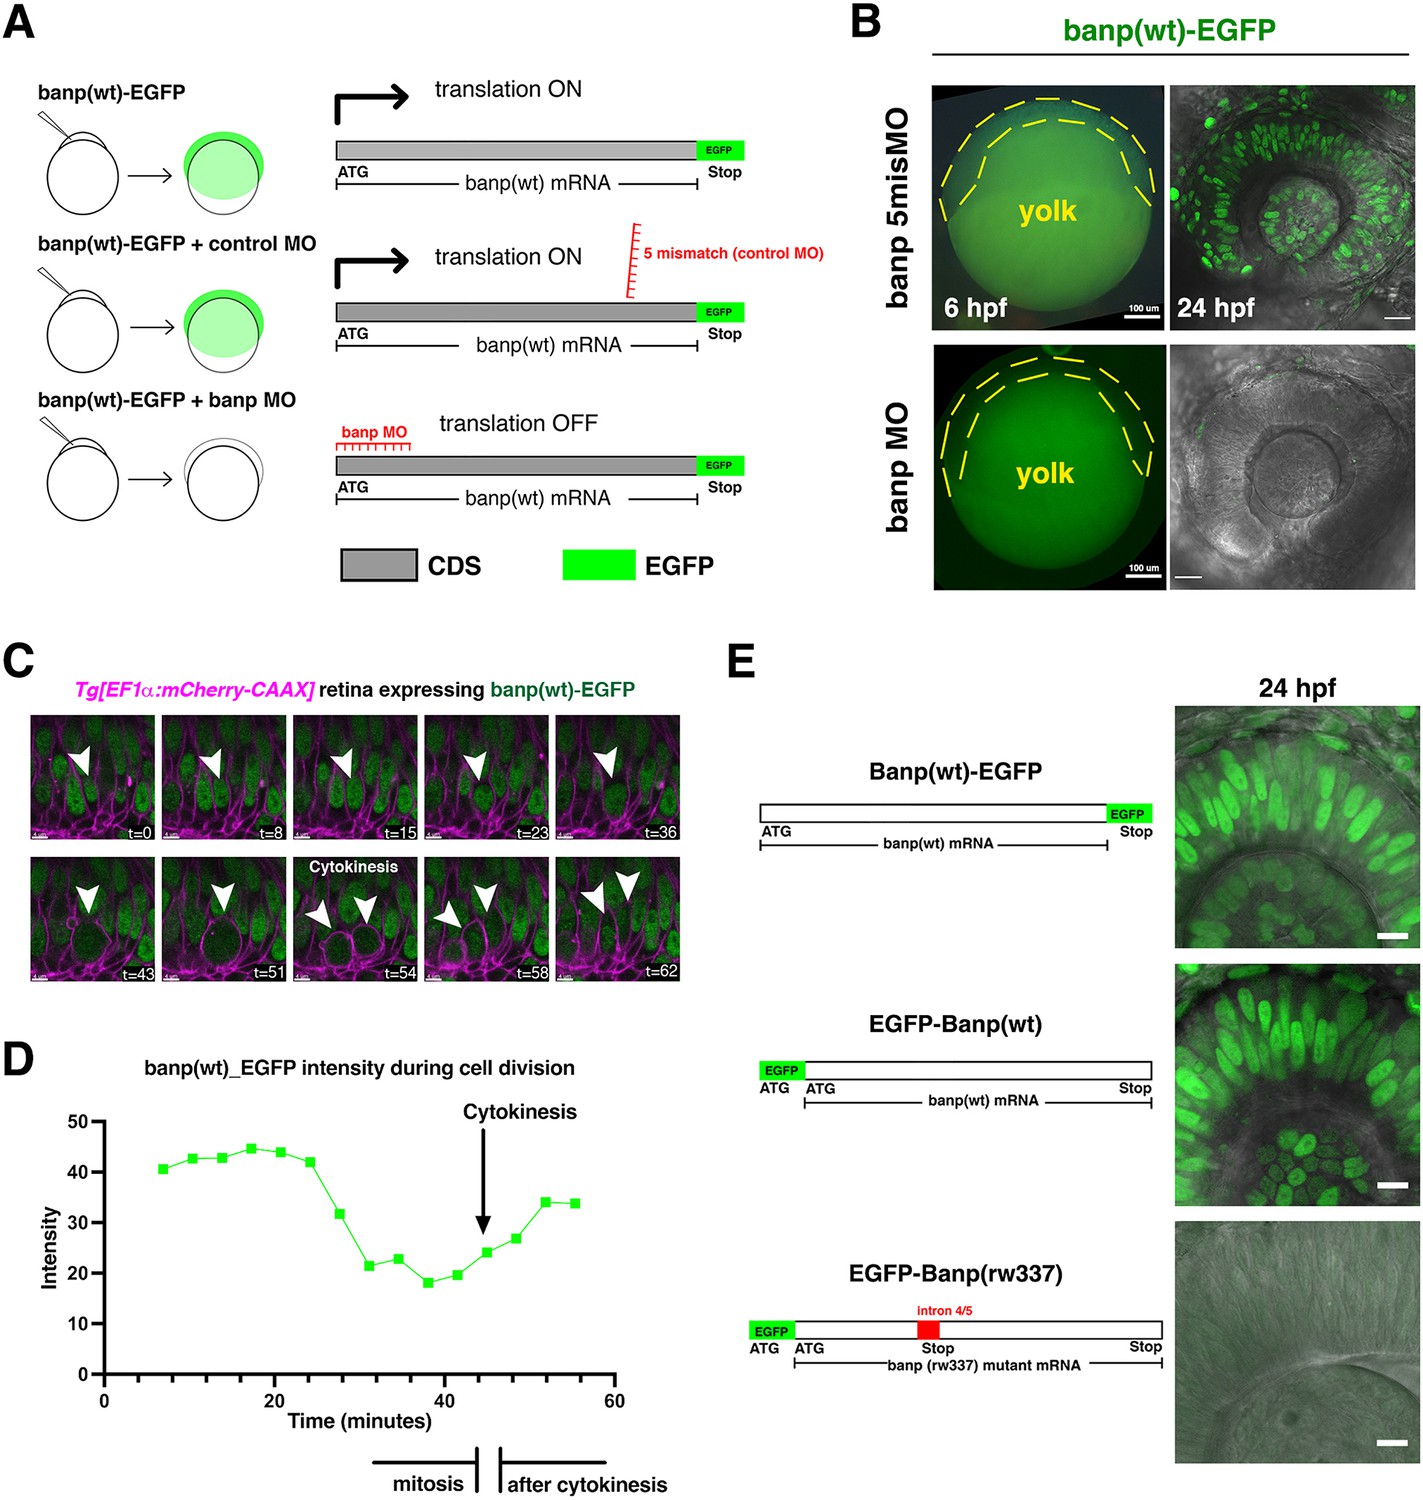
Confirmation of specificity of banp MO and nuclear localization of zebrafish Banp protein.
(A) Experimental design to confirm the specificity of banp MO and banp 5misMO (control MO). Co-injection of MO and RNA encoding Banp(wt)-EGFP to one-cell-stage eggs enables us to examine EGFP expression in gastrula-stage embryos at 6 hpf. (B) banp MO effectively inhibits translation of Banp(wt)-EGFP protein in zebrafish embryos at 6 hpf and the retina at 24 hpf. On the other hand, banp 5misMO did not inhibit translation of Banp(wt)-EGFP protein, suggesting that banp MO specifically inhibits Banp protein translation. The yellow dotted line indicates blastoderm cells covering yolk, in which GFP fluorescence was detected only in 5 mismatch morphant embryos. Scale bars: 20 μm. (C) Time-lapse confocal scanning of mitosis of Tg[EF1α:mCherry-CAAX] transgenic wild-type retinal cells expressing Banp(wt)-EGFP. EGFP fluorescence is indicated in green, whereas mCherry-CAAX fluorescence labels plasma membranes and is indicated in magenta. White arrowheads indicate time-lapse changes in a retinal progenitor cell undergoing mitosis. Banp(wt)-EGFP is localized in the nucleus in interphase, whereas it spreads throughout the whole cell during mitosis. Scale bars: 4 μm. (D) Histogram of intensity of Banp(wt)-EGFP during cell division shown in (C). Signals decline from mitosis to cytokinesis. (E) Expression of Banp(wt)-EGFF, EGFP-Banp(wt) and EGFP-Banp(rw337) in zebrafish retina at 24 hpf. Both N-terminal and C-terminal EGFP-tagged wild-type Banp show nuclear localization, indicating that nuclear localization is conserved in zebrafish Banp. However, EGFP-Banp(rw337) is unstable and not maintained, suggesting that EGFP-Banp(rw337) is degraded, probably by the nonsense mutation decay mechanism. Scale bar: 10 μm.
-
Figure 1—figure supplement 4—source data 1
Data for Figure 1—figure supplement 4D.
- https://cdn.elifesciences.org/articles/74611/elife-74611-fig1-figsupp4-data1-v1.xlsx
Figure 1—figure supplement 5
Overexpression of Banp(wt)-EGFP reduces cell death in banprw337 mutants.
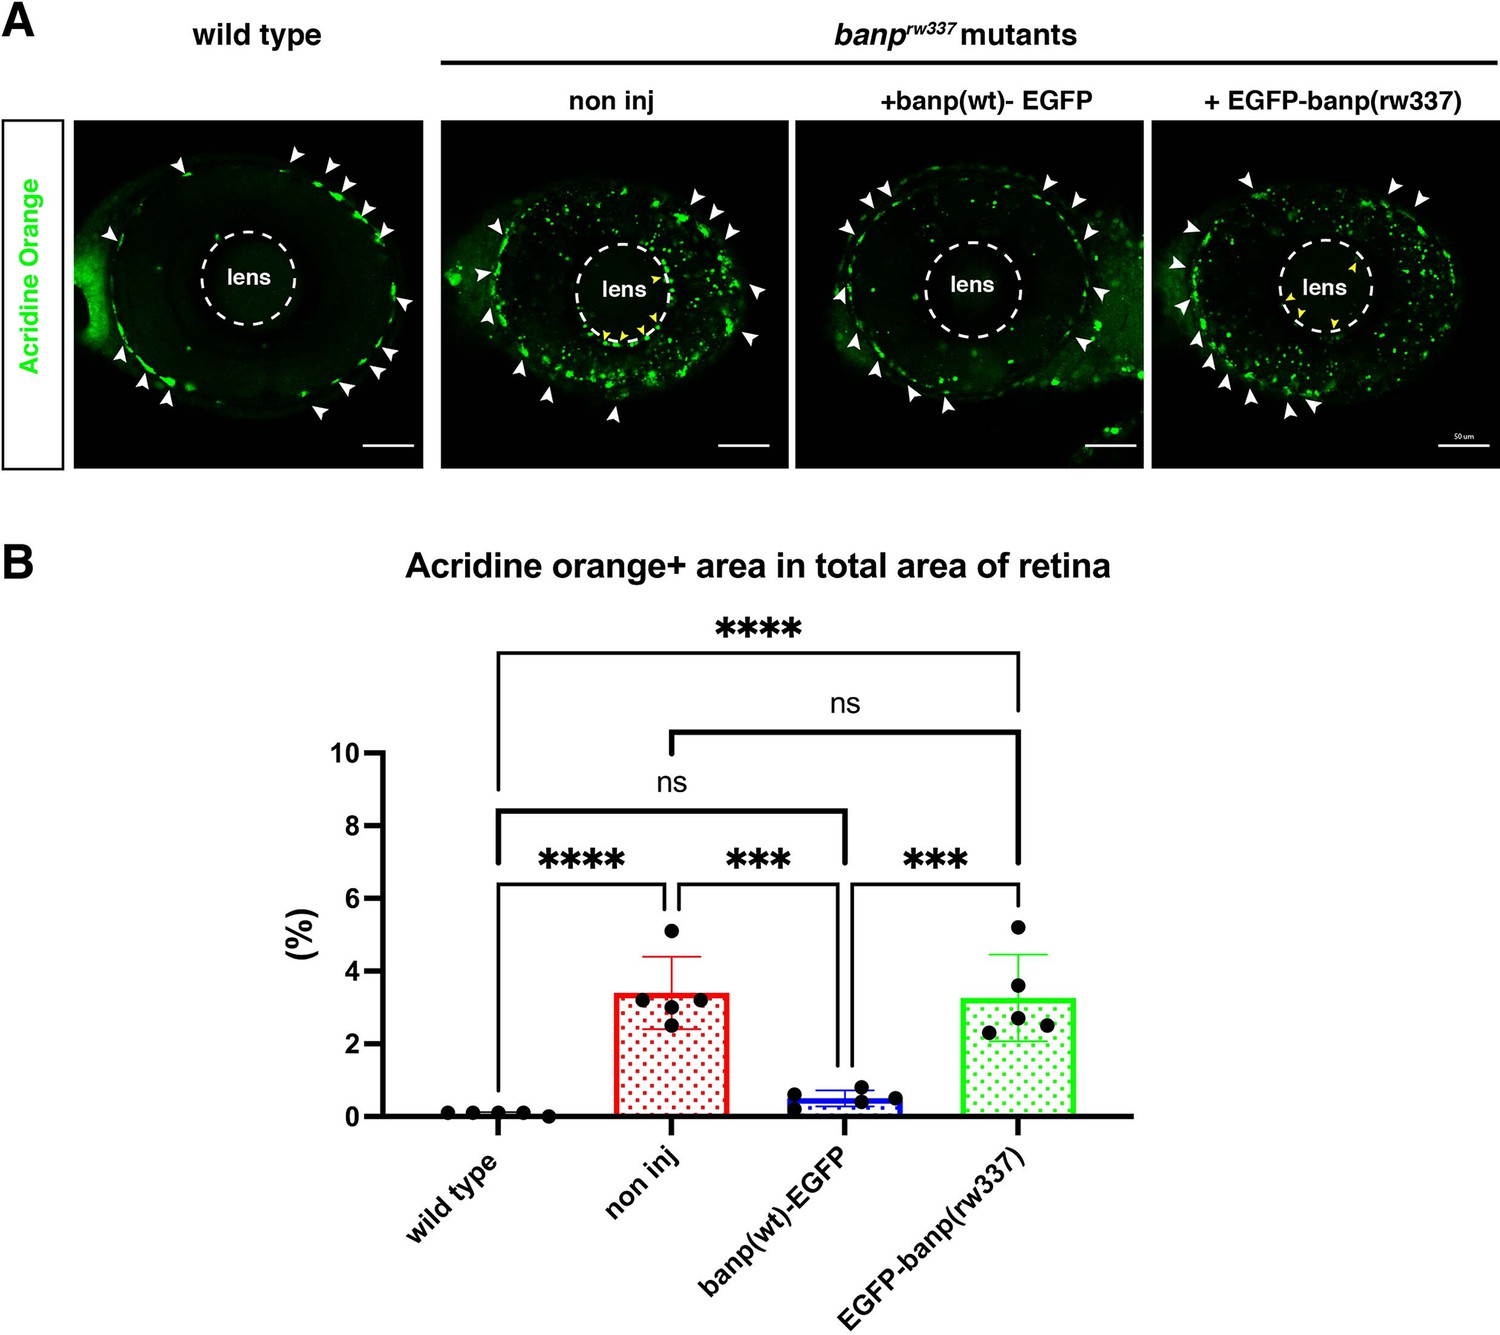
(A) AO-stained retinal sections of 53 hpf wild-type retinas, banprw337 mutant retinas, and banprw337 mutant retinas overexpressing Banp(wt)-EGFP and EGFP-Banp(rw337). White arrows indicate noise signals derived from auto-fluorescence of iridophores. Yellow arrows indicate potential iridophore-derived noise signals near the lens. Iridophore noise signals were excluded when measuring the area of AO+ dead cells. (B) Histogram of the percentage of AO+ area per total retina area. There is no significant difference in the percentage of AO+ area between banp rw337 mutant retinas injected without and with EGFP-Banp(rw337), suggesting no rescue of apoptosis by EGFP-Banp(rw337) injection. On the other hand, the percentage of AO+ area is markedly reduced in banp rw337 mutant retinas injected with Banp(wt)-EGFP compared with non-injected control banp rw337 mutant retinas, suggesting significant rescue of apoptosis by Banp(wt)-EGFP. Tukey’s multiple comparisons test [n=5, p***<0.001, p****<0.0001, or ns (not significant)]. Scale bars: 50 μm.
-
Figure 1—figure supplement 5—source data 1
Data for Figure 1—figure supplement 5B.
- https://cdn.elifesciences.org/articles/74611/elife-74611-fig1-figsupp5-data1-v1.xlsx
Figure 1—figure supplement 6
Spatio-temporal pattern of zebrafish banp mRNA expression.
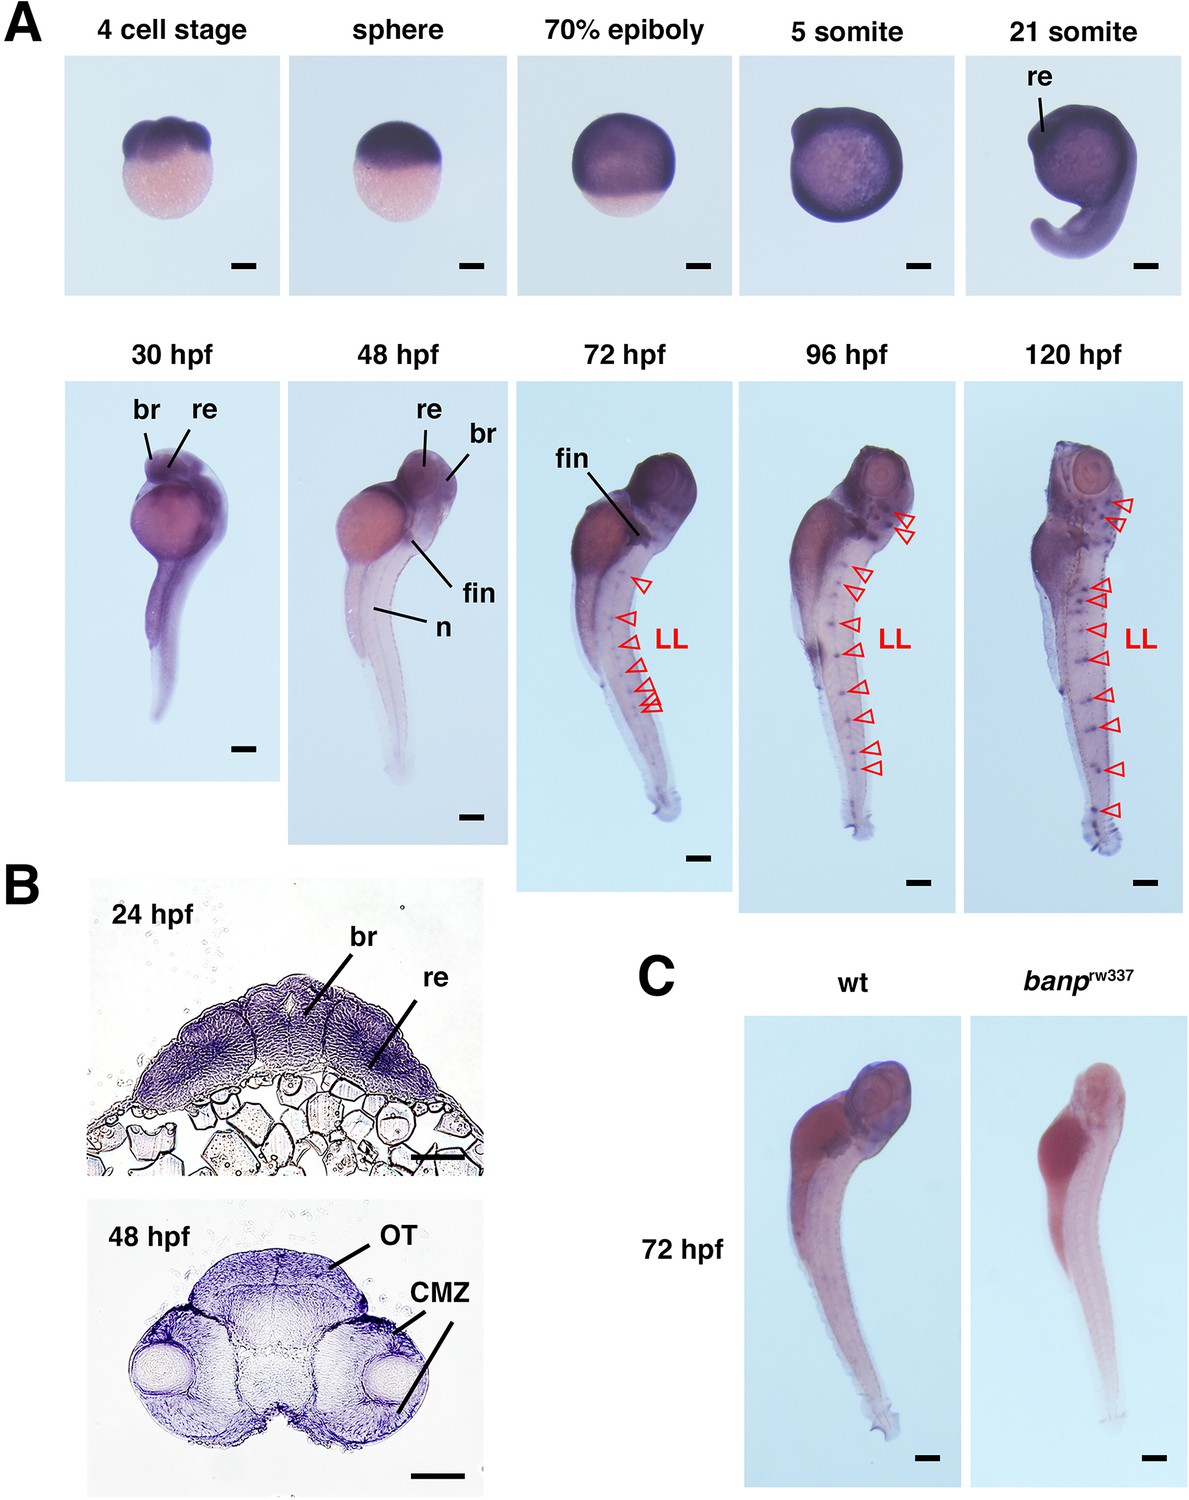
(A) Whole-mount in situ hybridization of zebrafish banp mRNA probe. banp mRNA is expressed at the four-cell stage, suggesting maternal expression. banp mRNA is ubiquitously expressed during development from the sphere stage until the 21-somite stage. mRNA expression is restricted in the brain, including the retina at 30 hpf. At 48 hpf, mRNA is prominently expressed in the brain, fins, and notochord. At 72 hpf and later, mRNA expression appears in neuromasts of the lateral lines (red open arrowheads). br, brain; re, retina; LL, neuromasts of the lateral line; n, notochord. Scale bars: 200 μm. (B) Frontal sections of zebrafish head labeled with banp RNA probe at 24 hpf and 48 hpf. banp mRNA is expressed in the entire neural retina at 24 hpf and in the CMZ at 48 hpf, suggesting expression of banp mRNA in retinal progenitor cells. OT, optic tectum; CMZ, ciliary marginal zone. Scale bars: 50 μm. (C) Whole-mount in situ hybridization of banp mRNA expression in wild-type and banprw337 mutant embryos at 72 hpf. banp mRNA expression is absent in banprw337 mutants, suggesting decay of mRNA. Scale bars: 200 μm.
Figure 2 with 1 supplement
banp mutant retinas show mitotic cell accumulation and apoptosis.
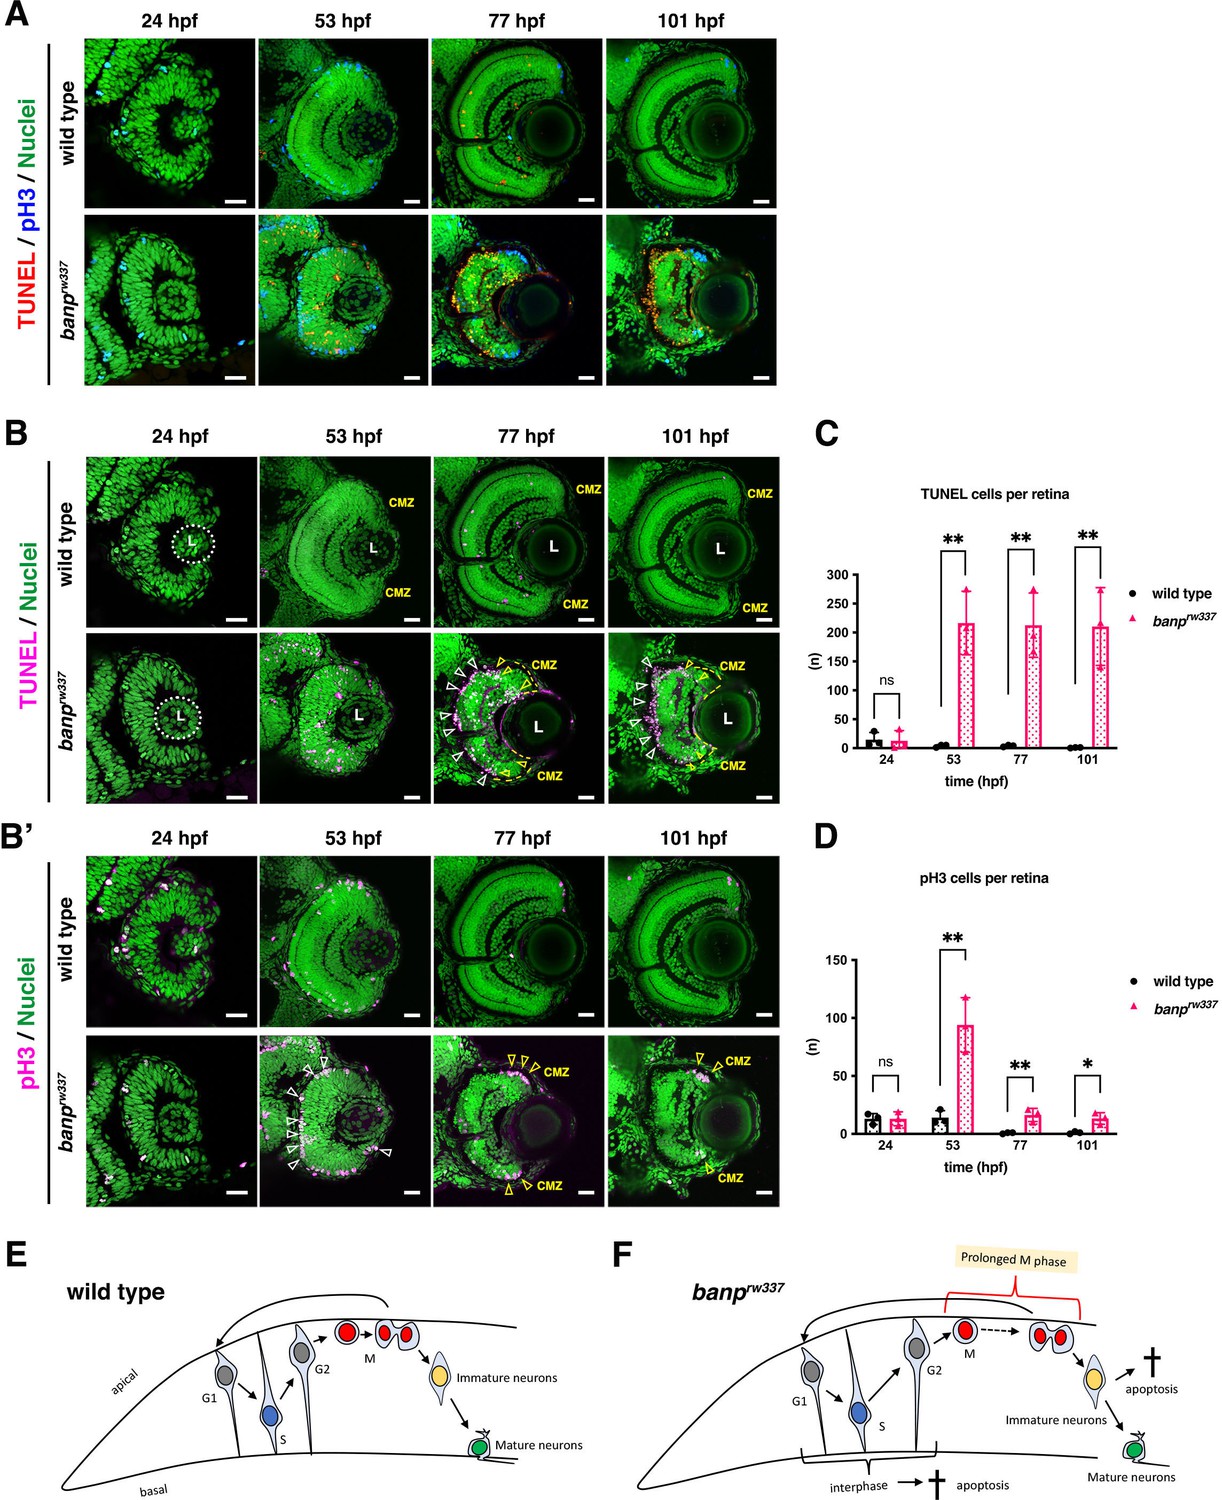
(A) Double labeling of wild-type (upper) and banprw337 mutant (lower) retinas with TUNEL (red) and anti-pH3 antibody (blue). Nucleus was counterstained with Sytoxgreen (green). (B) Only TUNEL and nuclear fluorescent channel of images shown in (A). TUNEL and nuclear staining are indicated in magenta and green, respectively. In banprw337 mutants, apoptotic cells start to be observed in neural retinas at 53 hpf, and increase in the apical region of retinas (white arrowheads) and at the interface between the CMZ and the central retina (yellow open arrowheads) at 77 and 101 hpf. (B’) Only pH3 and nuclear fluorescent channel of images shown in (A). pH3 signals and nuclear staining are indicated in magenta and green, respectively. Mitotic cells are accumulated at the apical surface of banprw337 mutant retinas at 53 hpf (white open arrowheads) and restricted in the apical region of the CMZ (yellow open arrow) at 77 and 101 hpf. (C) The number of TUNEL-positive cells per retina. Apoptosis is significantly increased in banprw337 mutants after 53 hpf. Unpaired t-test, two-tailed, Mean ± SD. [n=3, p**<0.01] (D) The number of pH3-positive cells per retina. The number of mitotic cells is significantly increased in banprw337 mutants at 53 hpf. The number is decreased, but still significantly higher in banprw337 mutants than in wild-type siblings after 77 hpf. Unpaired t-test, two-tailed, Mean ± SD. [n=3, p**<0.01] (E) Schematic diagram of wild-type retinas. Retinal progenitor cells undergo cell-cycle progression in which the nuclei move along the apico-basal axis depending on cell-cycle phase (the most basal location in S phase and the most apical location in M phase), called interkinetic nuclear migration. Mitosis occurs in the apical surface of the neural retina. Daughter cells reenter the cell cycle as retinal progenitor cells or start to differentiate into postmitotic neurons, which migrate into the basal region and become mature neurons. (F) Schematic diagram of banprw337 mutant retinas. A fraction of interphase progenitor cells (G1, S, or G2 phase cells) undergo apoptosis after 48 hpf. Mitotic cells are accumulated at the apical surface, which may be caused by prolonged mitotic duration. A fraction of immature differentiating neurons also undergo apoptosis. Thus, banprw337 mutant retinal cells show multiple defects in cell-cycle progression of retinal progenitor cells and retinal neurogenesis. Scale bars: 20 μm for (A, B, B’).
-
Figure 2—source data 1
Data for Figure 2CD.
- https://cdn.elifesciences.org/articles/74611/elife-74611-fig2-data1-v1.xlsx
Figure 2—figure supplement 1
Apoptosis is induced in retinal progenitor cells and newly differentiating neurons in banprw337 mutants.
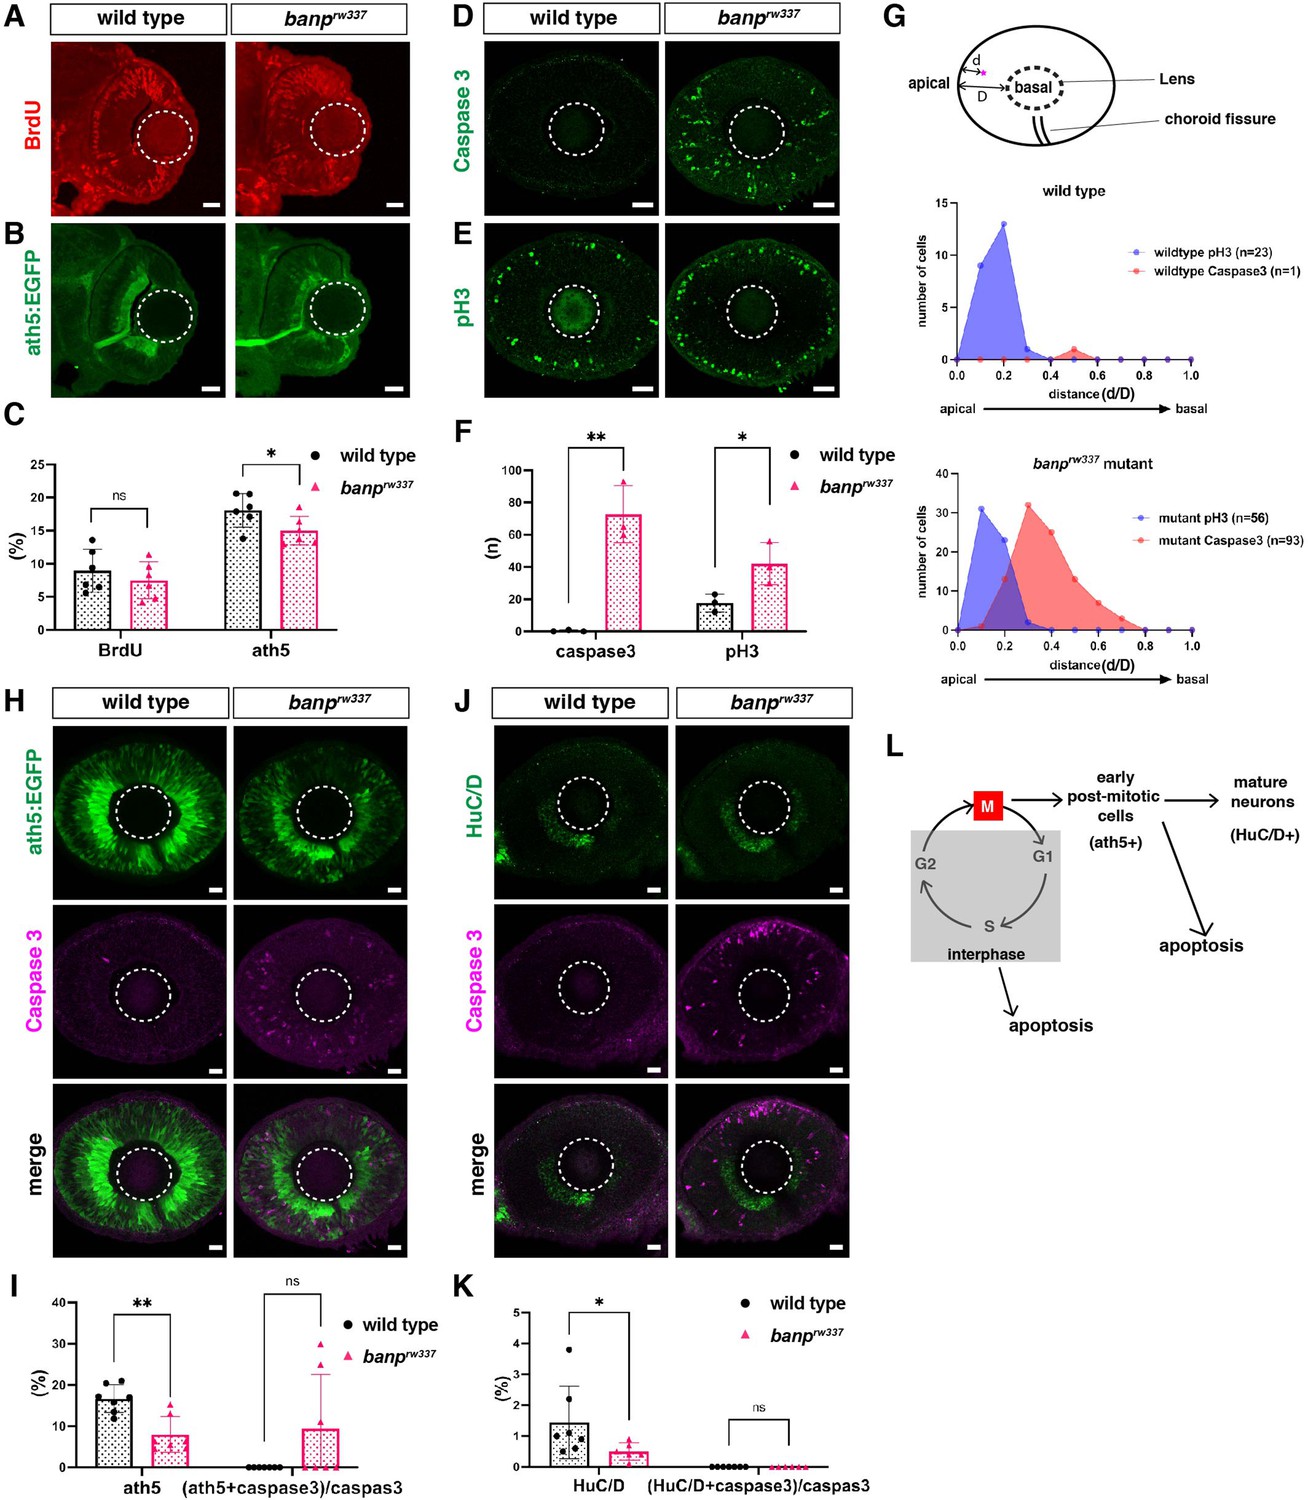
(A) BrdU labeling of wild-type and banprw337 mutant retinas at 48 hpf. (B) ath5:EGFP expression of wild-type and banprw337 mutant retinas at 48 hpf. (C) Percentage of BrdU-positive area or ath5:EGFP-positive area relative to the total retinal area. There is no significant difference in BrdU-positive area between wild-type and banprw337 mutant retinas. The fraction of ath5:EGFP-positive area is slightly, but significantly reduced in banprw337 mutants compared with wild-type siblings. Unpaired t test (two tailed), Mean ± SD. [n=6, p*<0.05, ns (not significant)]. (D) Labeling of wild-type and banprw337 mutant retinas with anti-activated caspase 3 antibody at 48 hpf. (E) Labeling of wild-type and banprw337 mutant retinas with anti-pH3 antibody at 48 hpf. (F) The number of caspase 3-positive or pH3-positive cells per section of retina. The number of caspase 3-positive cells and pH3-positive cells is significantly higher in banprw337 mutants than in wild-type siblings. Unpaired t-test (two tailed), Mean ± SD. [n=3, p*<0.05, p**<0.01]. (G) The relative position of caspase 3-positive cells or pH3-positive cells along the apico-basal axis of the neural retina: Positional value from 0 to 1 corresponds to the range from apical to basal position, respectively. In wild-type retinas (upper panel), pH3-positive cells are located in the apical region of the neural retina (peak of positional value is 0.2), whereas only one caspase 3-positive cell is located in the intermediate position of the neural retina (peak of positional value is 0.4). On the other hand, in banprw337 mutant retina, pH3-positive cells are located in the apical region of the neural retina (peak of positional value is 0.1), whereas caspase3-positive cells are increased in number and most of them are located in the intermediate zone (peak of positional value is 0.3). Although pH3- and caspase3-positive positional ranges are slightly overlapped in banprw337 mutant retinas, these data suggest that apoptosis occurs in S phase of retinal progenitor cells or newly differentiating neurons migrating toward the basal region in banprw337 mutants. (H) Double labeling of wild-type and banprw337 mutant retinas with ath5:EGFP transgene and anti-caspase 3 antibody. (I) Percentage of ath5:EGFP-positive area relative to the total retinal area (left) and percentage of ath5:EGFP- and caspase 3-double positive cells relative to the total number of caspase 3-positive cells (right). Mann Whitney test, Mean ± SD. [n=7, p**<0.01]. (J) Double labeling of wild-type and banprw337 mutant retinas with anti-HuC/D antibody and anti-caspase 3 antibody. (K) Percentage of HuC/D-positive area relative to the total retinal area (left) and percentage of HuC/D- and caspase 3-double positive cells relative to the total number of caspase 3-positive cells (right). Mann Whitney test, Mean ± SD. [n=7 for wild-type, n=6 for banprw337 mutants, p*<0.05]. (L) A possible model showing how apoptosis is induced during retinal progenitor cell proliferation and retinal neurogenesis in banprw337 mutants. Apoptosis is likely induced in interphase of retinal progenitor cells or in newly differentiating retinal neurons. Scale bar: 20 μm for (A, B, D, E, H, J).
-
Figure 2—figure supplement 1—source data 1
- https://cdn.elifesciences.org/articles/74611/elife-74611-fig2-figsupp1-data1-v1.xlsx
Figure 3
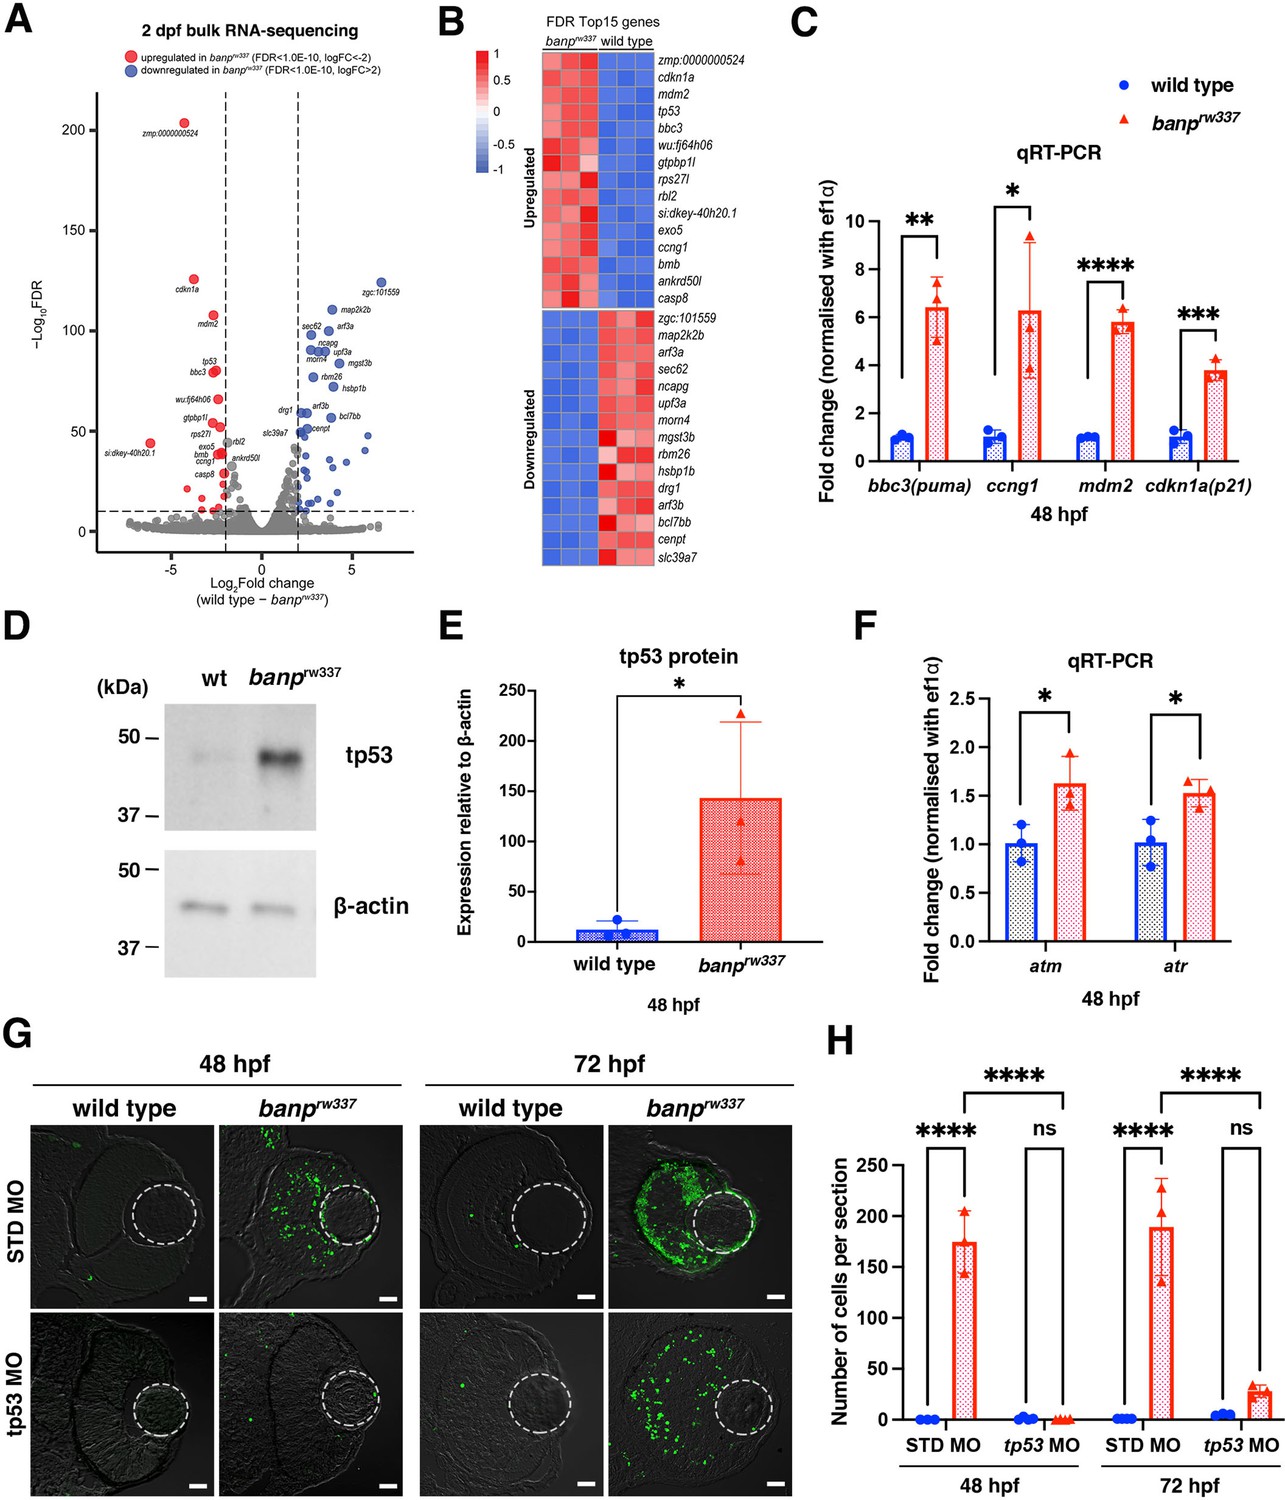
tp53-mediated DNA damage response is activated in the absence of Banp.
(A) A volcano plot indicating gene differential expression of 48 hpf wild-type versus banprw337 mutant embryos. Red dots show genes that were upregulated ≥2 fold in mutants, while blue dots represent genes downregulated ≥2 fold. (B) Heat map of the top 15 differentially expressed genes. (C) Relative mRNA expression levels for bbc3, ccng1, mdm2, cdkn1a in wild type and banprw337 mutants. Quantitative RT-PCR confirmed the up-regulation of p53 pathway genes in banprw337 mutants at 48 hpf. Unpaired t-test (two-tailed), Mean ± SD. [n=3, p*<0.05, p**<0.01, p***<0.001, p****<0.0001]. (D) Western blotting of wild-type and banprw337 mutants with anti-tp53 antibody. Full-length tp53 protein is stabilized in banprw337 mutants, compared to wild type. β-actin protein is an endogenous control and used for normalization of tp53 protein level. (E) Quantification of tp53 protein level relative to a control protein, β-actin, in wild-type and banprw337 mutants. The tp53 protein level is significantly higher in banprw337 mutants than in wild type at 48 hpf. Unpaired t-test (two-tailed), Mean ± SD. [n=3, p*<0.05]. (F) Relative mRNA expression levels for atm and atr in wild type and banprw337 mutants. Both mRNAs are significantly up-regulated in banprw337 mutants at 48 hpf. Unpaired t-test (two-tailed) [n=3, p*<0.05]. (G) TUNEL of wild-type and banprw337 mutant retinas injected with STD MO and tp53 MO at 48 hpf and 72 hpf. Scale bars: 20 μm. (H) Histogram of the number of TUNEL-positive cells per retinal section in wild-type and banprw337 mutant retinas injected with STD MO and tp53 MO at 48 hpf and 72 hpf. Two-way ANOVA, Tukey’s multiple comparisons test, Mean ± SD. [n=3 for STD-MO at 48 hpf and tp53-MO at 72 hpf; n=4 for tp53-MO at 48 hpf and STD-MO at 72 hpf, p****<0.0001].
-
Figure 3—source data 1
Data for Figure 3CEFH.
- https://cdn.elifesciences.org/articles/74611/elife-74611-fig3-data1-v1.xlsx
-
Figure 3—source data 2
Data for Figure 3D.
- https://cdn.elifesciences.org/articles/74611/elife-74611-fig3-data2-v1.zip
Figure 4 with 1 supplement

Banp is required for integrity of DNA replication and DNA damage repair.
(A) Quantitative RT-PCR-based validation of FL tp53 and ∆113tp53 mRNA expression at 48 hpf. ∆113tp53 mRNA expression is markedly higher in banprw337 mutants than in wild-type siblings, whereas FL tp53 mRNA is not significantly different between mutants and wild-type siblings. Unpaired t-test (two-tailed), Mean ± SD. [n=3, p**<0.01, ns (not significant)]. (B) ATAC-seq- and RNA-seq-based validation of chromatin accessibility (upper panel) and transcription level (bottom panel) of the genomic region covering both tp53 and ∆113tp53 transcription units. Data of wild-type and banprw337 mutants are indicated in blue and red, respectively. Light blue indicates overlapping level. The red openbox in ATAC-seq shows open chromatin in banprw337 mutants in intron 4, signifying differential transcription of ∆113tp53 using an internal promoter. (C) TUNEL (top), anti-pH3 antibody labeling (middle), and anti-γ-H2AX antibody labeling (bottom) of wild-type and banprw337 mutant retinas injected with STD MO, tp53 MO, and ∆113tp53 MO. TUNEL data of 48 hpf wild-type sibling and banprw337 mutant retinas injected with STD MO and tp53 MO are shared with those shown in Figure 3G. tp53 MO-mediated knockdown completely rescues apoptosis in banprw337 mutant retinas at 48 hpf. However, ∆113tp53 MO-mediated knockdown mildly inhibits apoptosis in banprw337 mutant retinas. Neither tp53 MO nor ∆113tp53 MO effectively rescued mitotic cell accumulation and accumulation of γ-H2AX-positive cells (white arrowheads) in banprw337 mutant retinas. Scale bars: 20 μm. (D–F) Histogram of the number of TUNEL-positive cells (D), pH3-positive cells (E), and γ-H2AX-positive cells (F) per retinal section in wild-type and banprw337 mutants injected with STD-MO, tp53 MO, and ∆113tp53 MO. TUNEL data of 48 hpf wild-type sibling and banprw337 mutant retinas injected with STD MO and tp53 MO are shared with those shown in Figure 3H. Two-way ANOVA with Tukey’s multiple comparisons test, Mean ± SD. [n=in graph, p*<0.05, p**<0.01, p***<0.001, p****<0.0001, ns (not significant)]. (G) Possible role of Banp in tp53-mediated DNA damage response pathway. DNA replication stress activates ATR, which subsequently promotes DNA replication fork recovery. Failure of stalled fork recovery causes DSBs, which activate ATM-dependent DNA damage repair. ATR and ATM inhibit Mdm2-mediated tp53 degradation. Stabilized tp53 initially promotes transcription of the ∆113tp53 isoform, which activates cell-cycle arrest genes and promotes DNA damage repair. Chronic activation of tp53 promotes transcription of apoptotic genes to induce apoptosis. Banp may normally suppress DNA replication stress by promoting DNA replication fork recovery or DNA damage repair. Banp may suppress genotoxic stress-mediated activation of DNA replication stress and DSB formation.
-
Figure 4—source data 1
Data for Figure 4ADEF.
- https://cdn.elifesciences.org/articles/74611/elife-74611-fig4-data1-v1.xlsx
Figure 4—figure supplement 1
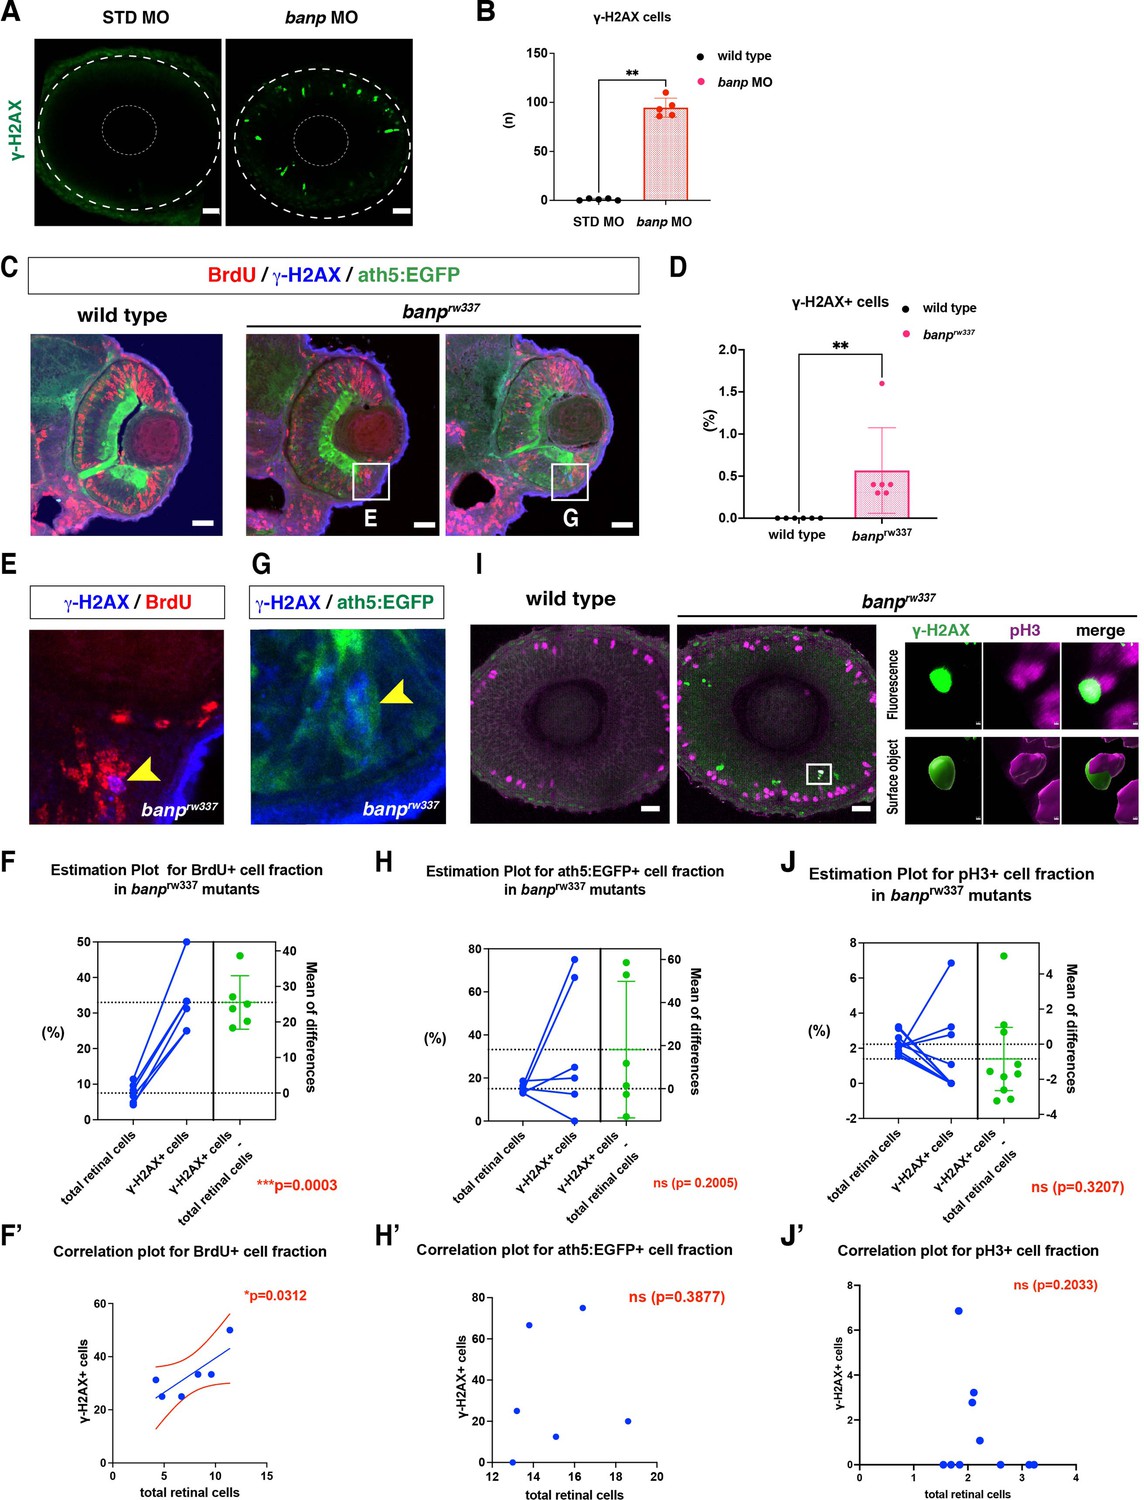
DNA damage is induced in retinal progenitor cells in banp knockdown.
(A) Labeling of 48 hpf wild-type retinas injected with STD MO and banp MO with anti-γ-H2AX antibody. γ-H2AX-positive cells are increased in banp morphant retinas. Scale bars: 20 μm. (B) The number of γ-H2AX-positive cells in 48 hpf wild-type retinas injected with STD MO and banp MO. The number of γ-H2AX-positive cells is significantly higher in banp morphant retinas than in wild-type retinas injected with STD MO. Mann Whitney test, Mean ± SD. [n=5, p**<0.01]. (C) Labeling of 48 hpf wild-type and banprw337 mutant retinas with anti-BrdU antibody (red), anti-γ-H2AX antibody (blue), and ath5:EGFP transgene (green). Two independent banprw337 mutant retinas are shown. Scale bars: 20 μm. (D) The fraction of γ-H2AX-positive cells in the total retinal area in wild-type and banprw337 mutants. Mann Whitney test, Mean ± SD. [n=6, p <**0.01]. (E) Double labeling of retinal CMZ in banprw337 mutants with anti-BrdU antibody (red), anti-γ-H2AX antibody (blue). Higher magnification images of square in banprw337 mutant retinas shown in (C). (F) The fraction of BrdU-positive cells in total retinal cells and γ-H2AX-positive cells in banprw337 mutants. Mean of the difference between total retinal cells and γ-H2AX-positive cells is shown on the right side. The fraction is significantly higher in γ-H2AX-positive cells than in total retinal cells. Paired t-test. [n=6, p <***0.001]. Correlation plot (F’) indicates significantly effective pairing [p< *0.05]. (G) Double labeling of retinal CMZ in banprw337 mutants with the ath5:EGFP transgene (green), anti-γ-H2AX antibody (blue). Higher magnification images of square in banprw337 mutant retinas shown in (C). (H) The fraction of ath5:EGFP-positive cells in total retinal cells and γ-H2AX-positive cells in banprw337 mutants. Mean of the difference between total retinal cells and γ-H2AX-positive cells is shown on the right side. There is no significant difference between total retinal cells and γ-H2AX-positive cells. Paired t-test. [n=6, ns]. Correlation plot (H’) indicates no significant pairing. [ns]. (I) Labeling of 48 hpf wild-type and banprw337 mutant retinas with anti-pH3 antibody (magenta), anti-γ-H2AX antibody (green). Top and bottom right-side panels of banprw337 mutant retinas indicate original fluorescent images and their Imaris surface-rendered images, respectively. Scale bars: 20 μm. (J) The fraction of pH3-positive cells in total retinal cells and γ-H2AX-positive cells in banprw337 mutants. Mean of the difference between total retinal cells and γ-H2AX-positive cells is shown on the right side. There is no significant difference between total retinal cells and γ-H2AX-positive cells. Paired t-test [n=10, ns]. Correlation plot (J’) indicates no significant pairing. [ns].
-
Figure 4—figure supplement 1—source data 1
- https://cdn.elifesciences.org/articles/74611/elife-74611-fig4-figsupp1-data1-v1.xlsx
Figure 5 with 3 supplements

Banp promotes transcription of chromosome segregation regulators, cenpt and ncapg.
(A) Quantitative RT-PCR of ncapg expression at 48 hpf. ncapg mRNA expression is down-regulated in banprw337 mutants and banp morphants. Unpaired t-test (two-tailed), Mean ± SD. [n=3, p**<0.01]. (B) ATAC-seq and RNA-seq analysis of ncapg mRNA transcription. In banprw337 mutants, chromatin access is reduced at the TSS of ncapg (ATAC-seq) and transcript expression is markedly decreased (RNA seq). (C) Quantitative RT-PCR of cenpt expression at 48 hpf. cenpt mRNA expression is down-regulated in banprw337 mutants and banp morphants. Unpaired t-test (two-tailed), Mean ± SD. [n=3, p**<0.01]. (D) ATAC-seq and RNA-seq analysis of cenpt mRNA transcription. In banprw337 mutants, chromatin access is reduced at the TSS of cenpt (ATAC-seq) and transcript expression is markedly decreased (RNA seq). (E) Time-lapse images of mitosis of retinal progenitor cells injected with banp 5misMO (upper) and banp MO (lower) at 2 dpf using Tg [h2afv: GFP; EF1α: mCherry-zGem] transgenic zebrafish. In retinas injected with banp 5misMO, mitosis proceeds sequentially from prophase (t=5–10 min), metaphase (t=16 min), anaphase (t=21 min), and telophase (t=24 min). On the other hand, in banp morphant retinas, the duration of mitosis from prophase to telophase was 67 min, significantly longer than that of the control MO (24 min). Furthermore, a prophase-like chromosome arrangement appeared abnormally (t=59) after several metaphase-like alignments (t=36 and 46), followed by anaphase (t=64) and telophase. Scale bar: 5 μm. (F) Violin plot of the duration of mitosis from prophase to telophase in retinas injected with banp 5misMO and banp MO. Mitosis in banp morphants is significantly longer than that of banp 5misMO injected embryos. Mann Whitney test, Mean ± SD. [n=3, p****<0.0001] (G) Confocal images of metaphase cells in zebrafish retinas at 48 hpf. The mitotic spindle is labeled with anti-α-tubulin antibody, whereas metaphase chromosomes are labeled with anti-pH3 antibody. The mitotic spindle is correctly attached to metaphase chromosomes in wild-type retinal cells (left panel). On the other hand, mitotic cells in banprw337 mutants exhibit inefficient mitotic spindle attachment and poorly orientated metaphase chromosomes (right panels). Dotted circles indicate the outline of metaphase cells. Scale bar: 2 μm. (H) Percentage of cells with normal and abnormal spindle attachment in wild-type and banprw337 mutant embryos. Two-way ANOVA with Šídák’s multiple comparisons test, Mean ± SD. [n=3, p****<0.0001].
-
Figure 5—source data 1
Data for Figure 5ACFH.
- https://cdn.elifesciences.org/articles/74611/elife-74611-fig5-data1-v1.xlsx
Figure 5—figure supplement 1
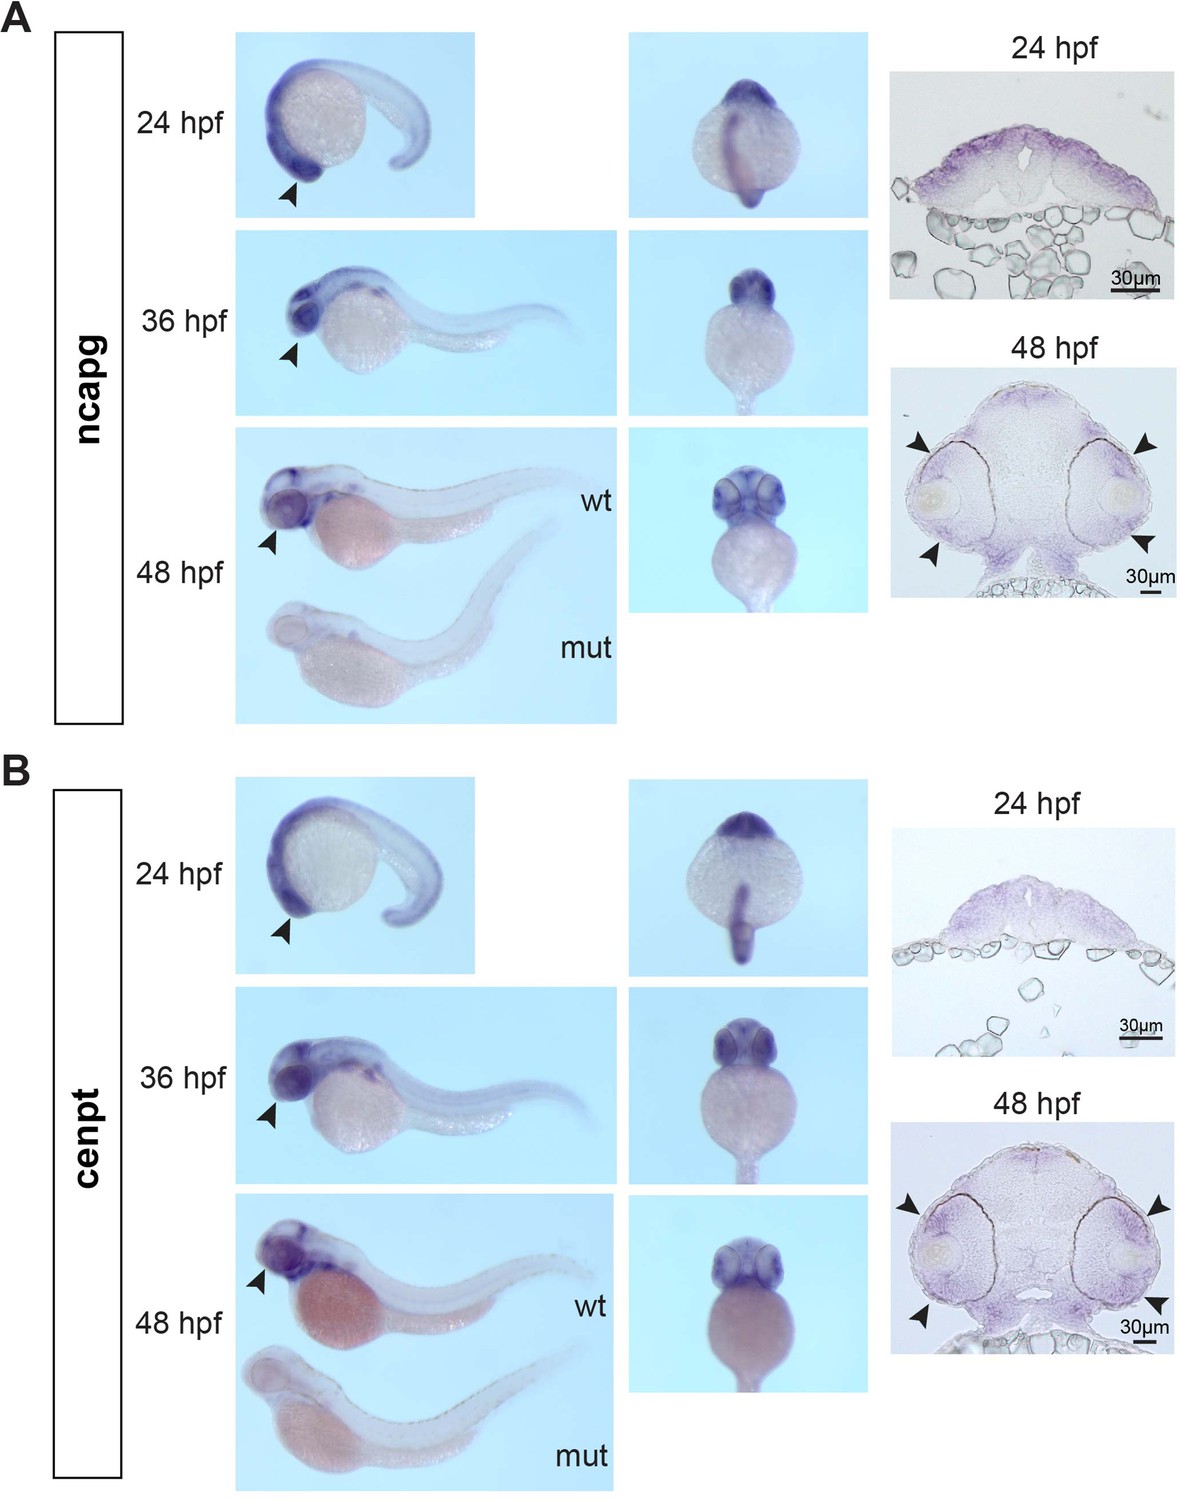
Spatio-temporal pattern of zebrafish cenpt and ncapg mRNA expression.
(A) Whole-mount in situ hybridization of zebrafish ncapg mRNA. Lateral view (left panels), ventral view (middle panels) and retinal cross-sections (right panels). Black arrowheads in left panel represent expression in the retina. Black arrowheads in right panel represent expression in retinal progenitor cells. Whole-mount image at 48 hpf shows that ncapg mRNA expression is markedly reduced in banp mutant embryo. (B) Whole-mount in situ hybridization of zebrafish cenpt mRNA. Lateral view (left panels) ventral view (middle panels) and retinal cross sections (right panels). Black arrowheads in left panel represent expression in retina. Black arrowheads in right panel represent expression in retinal progenitor cells. Whole-mount image at 48 hpf shows that cenpt mRNA expression is markedly reduced in banp mutant embryo.
Figure 5—video 1
Time-lapse movie of mitosis of wild-type retinal progenitor cells.
Tg [h2afv: GFP; EF1α: mCherry-zGem] transgenic embryos were injected with banp 5misMO and mitosis of retinal progenitor cells was scanned with confocal LSM. Mitosis proceeds sequentially from prophase (t=5–10 min), metaphase (t=16 min), anaphase (t=21 min), and telophase (t=24 min). Green indicates GFP fluorescence, representing chromatin. On the other hand, magenta indicates fluorescence from mCherry, representing S/G2/M phase cells.
Figure 5—video 2
Time-lapse movie of mitosis of banp morphant retinal progenitor cells.
Tg [h2afv: GFP; EF1α: mCherry-zGem] transgenic embryos were injected with banp MO and mitosis of retinal progenitor cells was scanned with confocal LSM. Mitosis did not procced smoothly, and it took longer from chromosome condensation in prophase (t=15 min) to chromosome alignment at the division plane in anaphase (t=46 min). Aligned chromosomes were often dispersed during chromosome segregation by mitotic spindle (t=46–64 min). Green indicates fluorescence from GFP, representing chromatin. On the other hand, magenta indicates fluorescence from mCherry, representing S/G2/M phase cells.
Figure 6 with 2 supplements
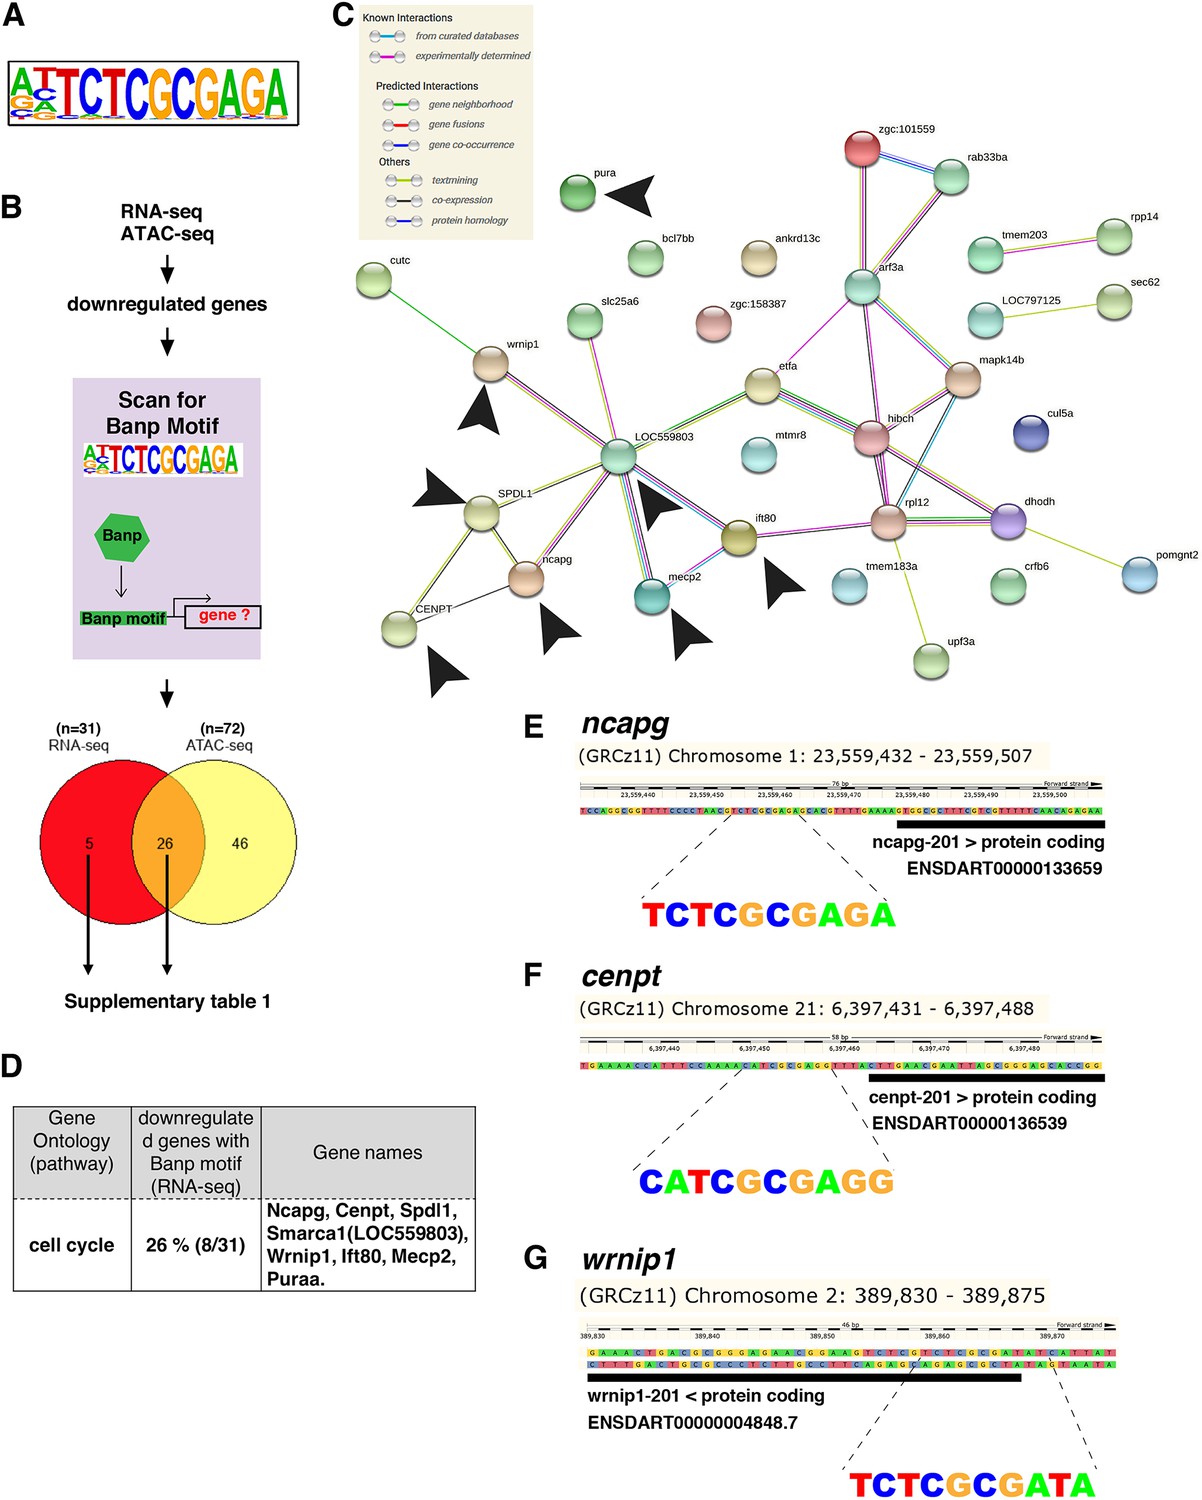
Banp promotes expression of genes containing Banp motifs.
(A) The motif enriched in genomic regions in which chromatin accessibility is reduced in banprw337 mutants. This sequence shows a high similarity to the Banp motif. (B) A schematic diagram representing the flow of RNA-sequencing combined with ATAC-sequencing to find candidates for zebrafish Banp direct-target genes. HOMER was used to scan for Banp motifs in downregulated candidate genes, from RNA- and ATAC-sequencing in banprw337 mutants. RNA sequencing yielded 31 candidates, whereas ATAC-sequencing yielded 72, with 26 target genes consistent in both. These 26 candidate genes are the most likely to be target genes of Banp. (C) STRING interactome analysis showing the interaction of Banp motif-containing genes downregulated in RNA-sequencing. Black arrowheads specify genes related to cell-cycle regulation. (D) Banp target candidate genes related to cell-cycle regulation. Gene ontology (GO) analysis was applied to 31 Banp motif-containing genes downregulated in RNA-sequencing. Twenty-six percent of these genes are engaged in the cell-cycle regulation. Others participate in a variety of non-categorized pathways. (E) Banp motif upstream to the 5’-UTR of ncapg. The black box represents the 5’-UTR. (F) Banp motif upstream to the 5’-UTR of cenpt. The black box represents the 5’-UTR. (G) Banp motif upstream to the 5’-UTR of wrnip1. The black box represents the 5’-UTR.
Figure 6—figure supplement 1
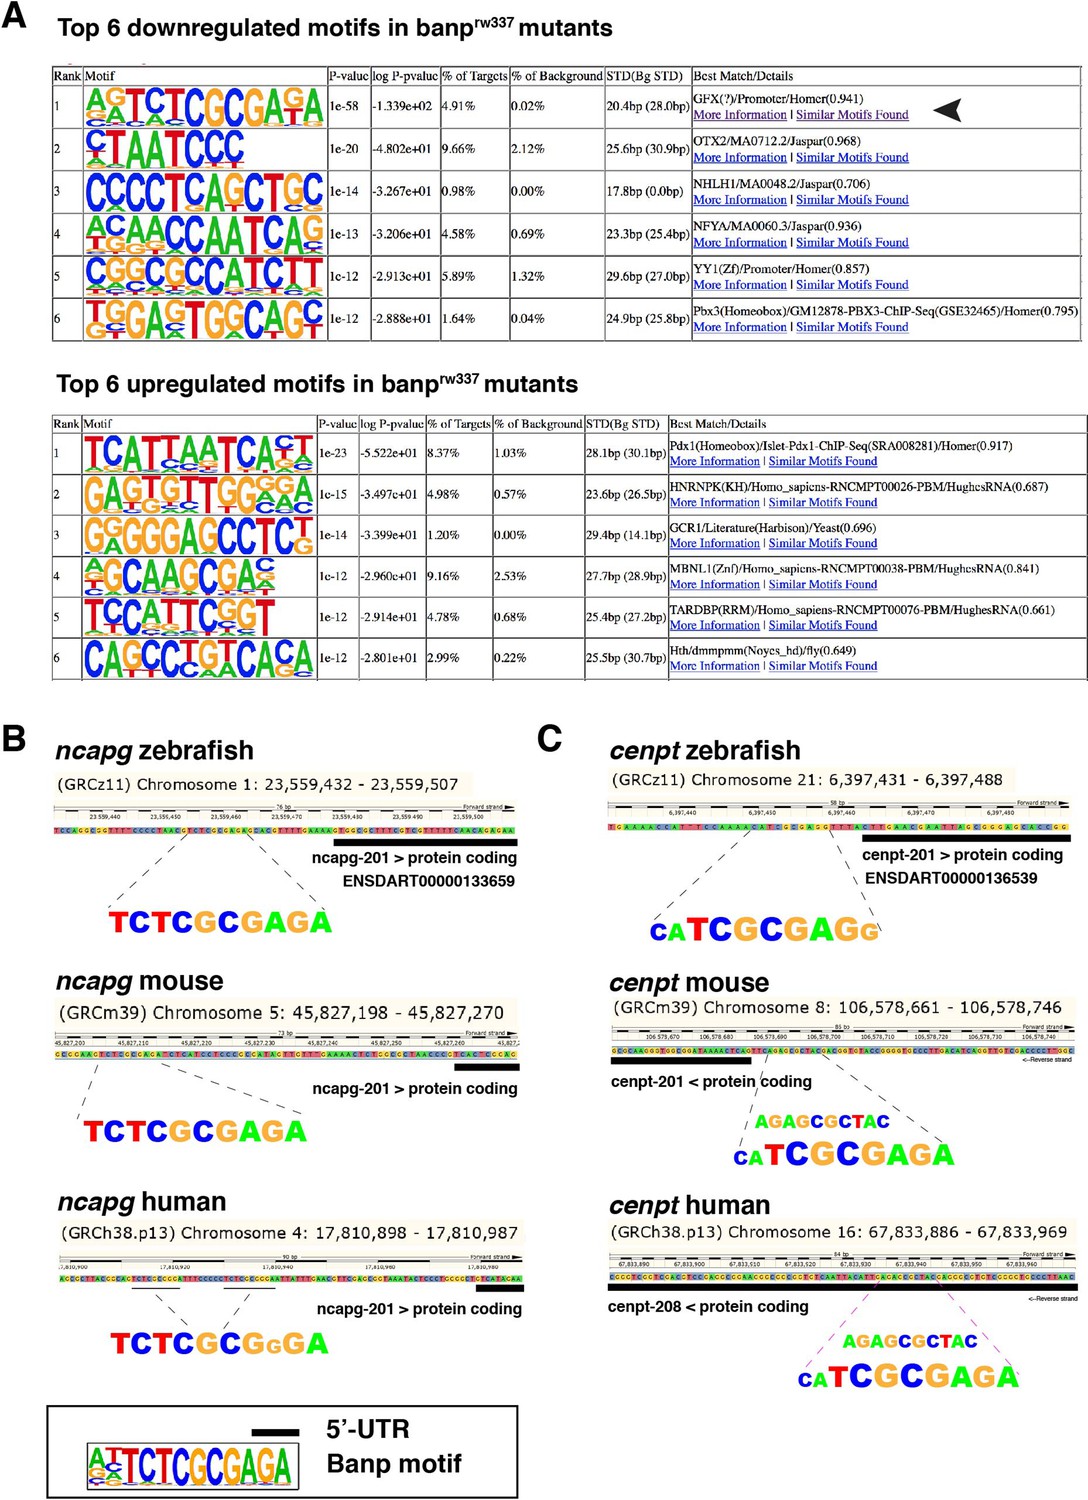
Motifs enriched in closed and open chromatin areas in banprw337 mutants.
(A) Top6 motifs enriched in genomic regions of decreased (downregulated) and increased (upregulated) accessibility in banprw337 mutants. We found that the Banp motif (TCTCGCGAGA) is the most enriched sequence in regions with reduced chromatin accessibility in banprw337 mutants (large arrowhead). (B, C) A putative Banp motif with a conserved CGCG element upstream of the 5' UTR of ncapg (B) and cenpt (C) in zebrafish, mice and humans.
Figure 6—figure supplement 2
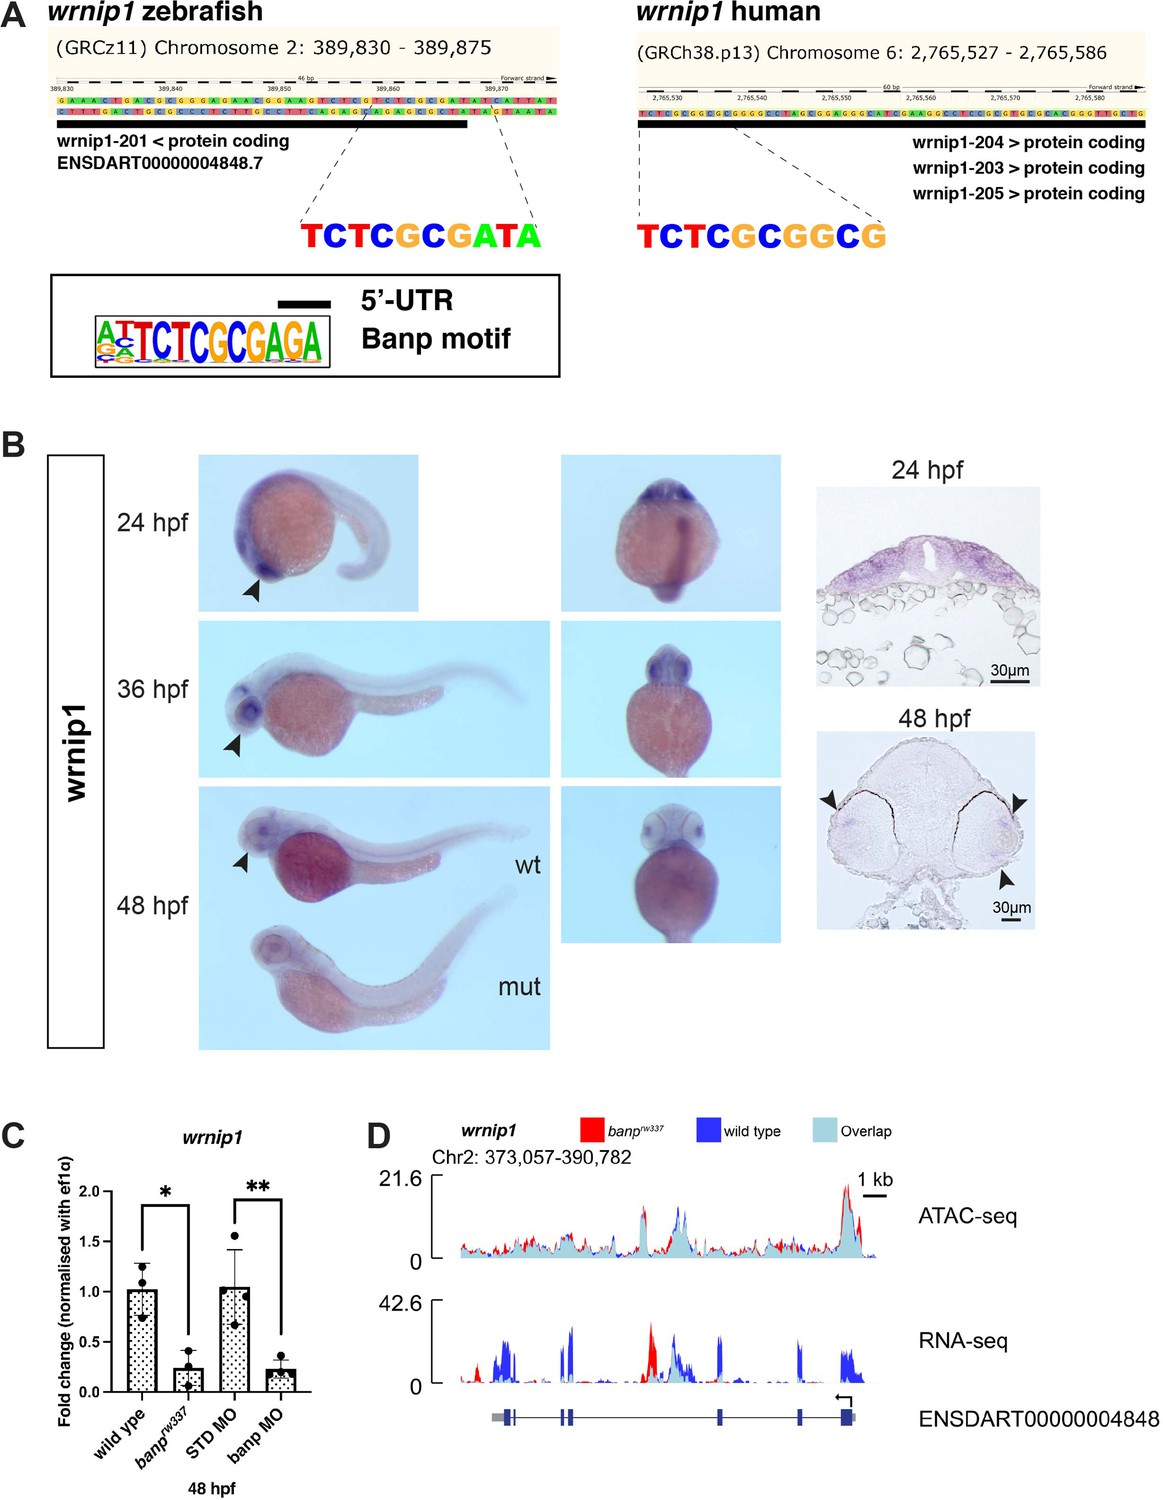
Banp promotes transcription of a DNA replication regulator wrnip1.
(A) A putative Banp motif with a conserved CGCG element upstream of the 5’ UTR of wrnip1 gene in zebrafish and human. (B) Whole-mount in situ hybridization of zebrafish wrnip1 mRNA. Lateral view (left panels) ventral view (middle panels) and retinal cross-sections (right panels). Black arrowheads in left panel represent expression in retina. Black arrowheads in right panel represent expression in retinal progenitor cells. Whole-mount image at 48 hpf shows that wrnip1 mRNA expression is markedly reduced in banp mutant embryo. (C) Quantitative RT-PCR of wrnip1 mRNA expression at 48 hpf. wrnip1 mRNA expression is down-regulated in both banprw337 mutants and banp morphants. Unpaired t-test (two-tailed) [n=on graph, p*<0.05, p**<0.01]. (D) ATAC-seq and RNA-seq analysis of wrnip1 mRNA transcription. In banprw337 mutants, mRNA expression is markedly decreased, whereas chromatin accessibility is not different between wild-type and banprw337 mutants.
-
Figure 6—figure supplement 2—source data 1
Data for Figure 6—figure supplement 2C.
- https://cdn.elifesciences.org/articles/74611/elife-74611-fig6-figsupp2-data1-v1.xlsx
Figure 7
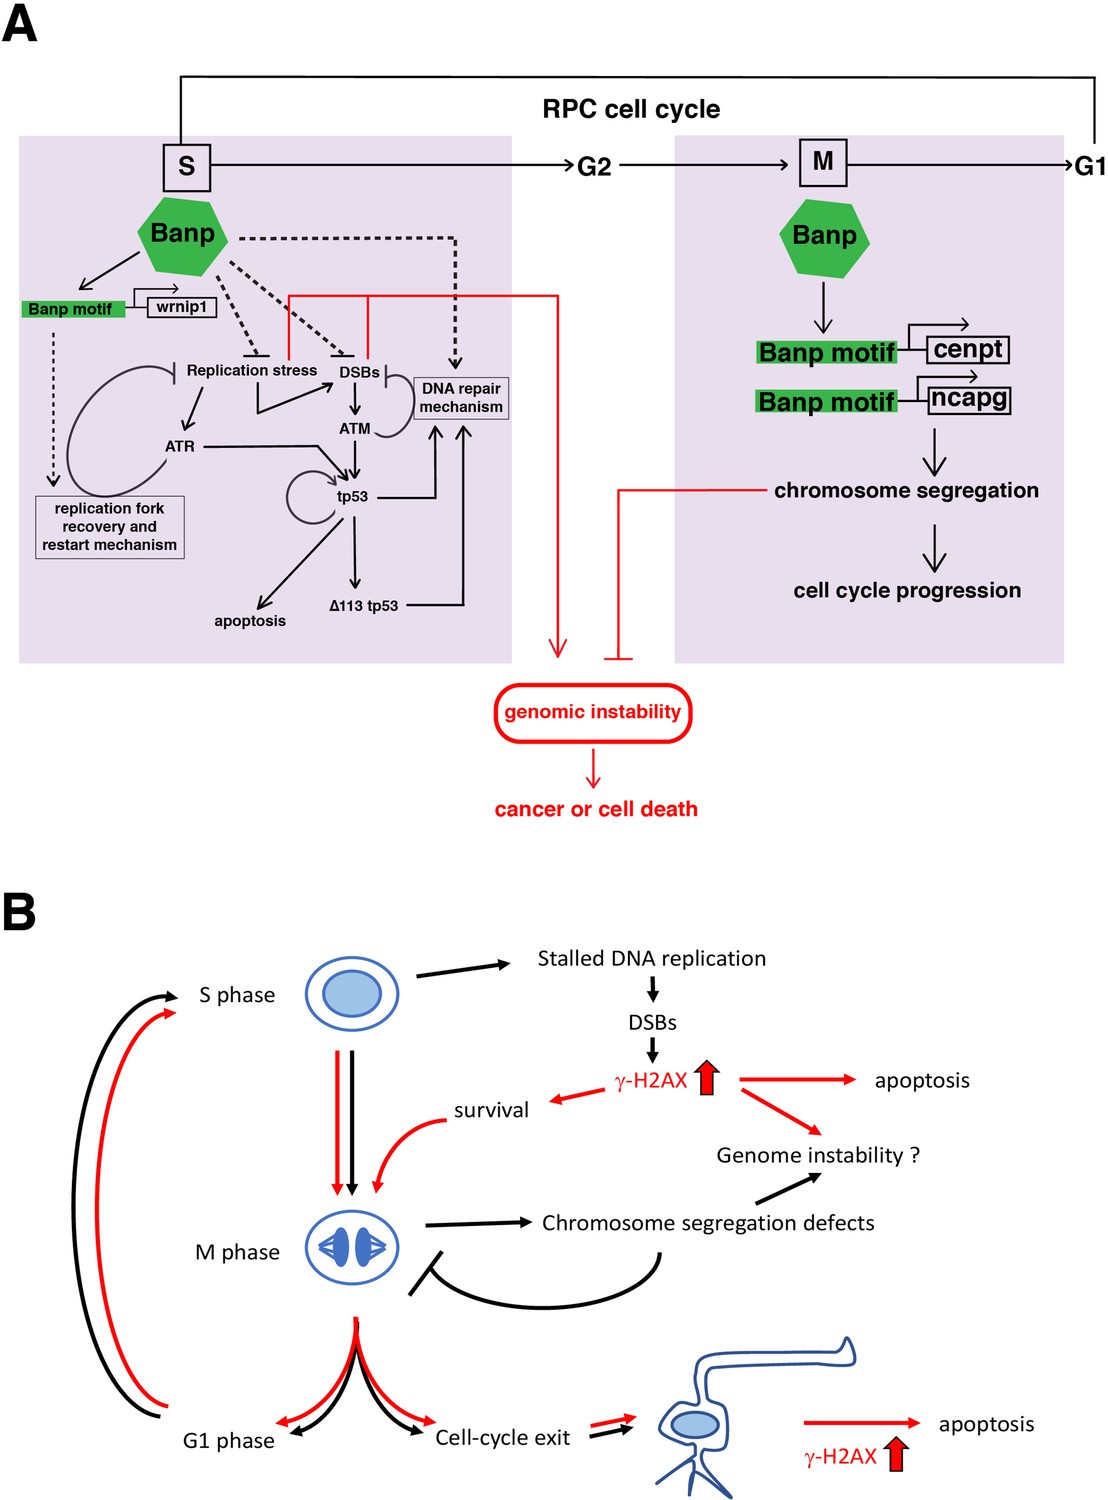
A possible model of Banp functions in stalled fork recovery, DNA damage repair, and chromosome segregation during mitosis.
(A) Our study reveals two major roles of Banp in cell-cycle regulation of retinal progenitor cells. In general, DNA replication stress, DSBs, and chromosome segregation defects induce genomic instability, which causes cancer or cell death. In S phase, Banp may suppress DNA replication stress by promoting transcription of the wrnip1, which protects stalled replication forks and promotes replication restart after replication stress. Failure of recovery from DNA replication stress induces DSBs, which activate ATM/Chk2/tp53-mediated DNA damage response. Banp may promote DNA damage repair in concert with tp53. ATR also activates tp53 through activation of Chk1 or crosstalk with ATM. Banp may suppress genotoxic stress-mediated DNA replication stress and DSBs. In M phase, Banp is required for chromosome segregation by promoting transcription of two mitotic regulators, cenpt and ncapg. Since a Banp motif is found near TSSs of the cenpt, ncapg and wrnip1 genes, it is likely that these genes are direct targets of Banp. Dotted arrows indicate proposed regulatory pathway, which will be necessary to investigate in the future. (B) banprw337 mutant phenotypes along the cell-cycle progression and neurogenesis. In banp mutants, stalled DNA replication and subsequent DSBs are accumulated, leading to increase in γ-H2AX+ cells. These DNA damaged cells undergo apoptosis. In M phase, mitosis is markedly prolonged due to chromosome segregation defects; however, almost all mitoses are eventually completed, so it is less likely that M phase defects directly link to apoptosis. It is possible that a fraction of γ-H2AX+ cells survive and enter M phase, so DNA damage is inherited by daughter cells, which reenter the cell-cycle or differentiate into postmitotic neurons. Neuron with a high level of γ-H2AX+ signals may undergo apoptosis. Thus, S phase defects and M phase defects influence each other through cell-cycle progression in banp mutants. Red lines indicate path of γ-H2AX+ cells.
Tables
Appendix 1—key resources table
| Reagent type (species) or resource | Designation | Source or reference | Identifiers | Additional information |
|---|---|---|---|---|
| strain, strain background (Danio rerio) | Okinawa wild type | PMID:28196805 | NA | |
| strain, strain background (Danio rerio) | RIKEN wild type | PMID:12702661 | ZFIN: ZDB-GENO-070802–4 | https://shigen.nig.ac.jp/zebra/ |
| genetic reagent (Danio rerio) | banprw337 | This paper | NA | NA |
| genetic reagent (Danio rerio) | banpsa12976 | ZIRC | ZFIN: ZDB-ALT-130411–2647 | NA |
| genetic reagent (Danio rerio) | Tg[EF1α:mCherry-zGem]oki011 | PMID:25260917 | ZFIN: ZDB-ALT-150128–2 | NA |
| genetic reagent (Danio rerio) | Tg[EF1α:mCherry-CAAX]oki049 | PMID:28196805 | ZFIN: ZDB-TGCONSTRCT-181026–1 | NA |
| genetic reagent (Danio rerio) | Tg[h2afv:GFP]kca6/kca66 | PMID:11819118 | ZFIN: ZDB-ALT-020918–4, ZDB-ALT-020717–2 | NA |
| genetic reagent (Danio) | Tg[ath5:EGFP]rw021 | PMID:15728672 | ZFIN: ZDB-ALT-050627–2 | NA |
| antibody | anti-Phospho Histone H3 (Ser10) (Mouse monoclonal) | Cell signaling technology | 6G3, 9,706 | (1:500) IHC |
| antibody | pH3 (Rabbit polyclonal) | Sigma-Aldrich (Merk) | 06–570 | (1:500) IHC |
| antibody | anti-Caspase3 (Rabbit monoclonal) | BD Pharmingen | Clone C92-605 | IHC (1:200) |
| antibody | anti-Pax6 (Rabbit polyclonal) | Covance | PRB-278P | IHC (1:500) |
| antibody | zpr1 (Mouse monoclonal) | ZIRC, Eugene, Oregon | ZFIN: ZDB-ATB-081002–43 | IHC (1:100) |
| antibody | anti-glutamine synthetase (Mouse monoclonal) | Millipore | MAB302, clone GS-6 | IHC (1:100) |
| antibody | anti-PCNA (Mouse monoclonal) | Sigma-Aldrich | Clone PC10,P8825 | IHC (1:200) |
| antibody | anti-Prox1 (Rabbit polyclonal) | Gene Tex | GTX128354 | IHC (1:500) |
| antibody | anti-α-tubulin (Mouse monoclonal) | Sigma-Aldrich | T5168, clone B512 | IHC (1:1000) |
| antibody | anti-γ-H2AX (Rabbit polyclonal) | Gene Tex | GTX127342 | IHC (1:500) |
| antibody | anti-BrdU (Rat monoclonal) | abcam | Ab6326 | IHC (1:200) |
| antibody | anti-HuC/D (Mouse monoclonal) | Thermo Fisher | A-21271 | IHC (1:200) |
| antibody | anti-β-actin (Mouse monoclonal) | Sigma-Aldrich | A5441 | WB (1:5000) |
| antibody | anti-tp53 (Rabbit polyclonal) | Gene Tex | GTX128135 | WB (1:1000) |
| antibody | anti-Mouse IgG, HRP-Linked Whole Ab (Sheep polyclonal) | Cyvita | NA931 | WB (1:5000) |
| antibody | anti-Rabbit IgG, HRP-Linked Whole Ab (Donkey polyclonal) | Cyvita | NA934 | WB (1:5000) |
| recombinant DNA reagent | pBluescript II SK(+) (plasmid) | Stratagene/Agilent Technologies | NA | in vitro transcription (In situ hybridization probe synthesis) |
| recombinant DNA reagent | pCS2 (plasmid) | PMID:7926732 | NA | in vitro transcription (Capped mRNA synthesis) |
| sequence-based reagent | Primes for polymorphic marker 70,702B | This paper | PCR primers | forward: 5’-ACTTCTTATCAGGGCTGTGC-3’ reverse: 5’-TCAGTCAAGAGCAGTGAGAG-3’ |
| sequence-based reagent | Primes for polymorphic marker zC93F2D | This paper | PCR primers | forward: 5’-TGGGATCTCTTTAAGTGAGTGAG-3’ reverse: 5’-TCCAACTATGTGGGTCAAACC-3’ |
| sequence-based reagent | banp MO | This paper | Morpholino antisense oligos | 5’-CCACTAAATCTTGCTCTGACATCAT-3’ |
| sequence-based reagent | banp 5misMO | This paper | Morpholino antisense oligos | 5’-CCtCaAAATgTTcCTCTcACATCAT-3’ |
| sequence-based reagent | tp53 MO | PMID:12477391 | Morpholino antisense oligos | 5’-GCGCCATTGCTTTGCAAGAATTG-3’ |
| sequence-based reagent | ∆113 tp53 MO | PMID:19204115 | Morpholino antisense oligos | 5’-GCAAGTTTTTGCCAGCTGACAGAAG-3’ |
| sequence-based reagent | STD MO | PMID:30322969 | Morpholino antisense oligos | 5’-CCTCTTACCTCAGTTACAATTTATA-3’ |
| sequence-based reagent | ccng1 | This paper | Primers for qRT-PCR | Forward primer: 5’-ccctggagattgaggatcag-3’ Reverse primer: 5’cacacaaaccaggtctccaa-3’ |
| sequence-based reagent | mdm2 | PMID:24147052 | Primers for qRT-PCR | Forward primer: 5’-caggaggaggagaagcagtg-3’ Reverse primer: 5’-agggaaaagctgtccgactt-3’ |
| sequence-based reagent | p21(cdkn1a) | PMID:26908596 | Primers for qRT-PCR | Forward primer: 5’-aagcgcaaacagaccaacat-3’ Reverse primer: 5’-tcagctactggccggattt-3’ |
| sequence-based reagent | FL tp53 | PMID:27539857 | Primers for qRT-PCR | Forward primer: 5’-tggagaggaggtcggcaaaatcaa-3’ Reverse primer: 5’-gactgcgggaacctgagcctaaat-3’ |
| sequence-based reagent | ∆113 tp53 | PMID:27539857 | Primers for qRT-PCR | Forward primer: 5’-atatcctggcgaacatttggaggg-3’ Reverse primer: 5’-cctcctggtcttgtaatgtcac-3’ |
| sequence-based reagent | Puma (bbc3) | This paper | Primers for qRT-PCR | Forward primer: 5’-ctgaggaggaccccacact-3’ Reverse primer: 5’-tctccagttctgccagtgc-3’ |
| sequence-based reagent | cenpt | This paper | Primers for qRT-PCR | Forward primer: 5’-tcatgaggagattgtggaagatg-3’ Reverse primer: 5’-ggtgagctctgcgagttatt-3’ |
| sequence-based reagent | ncapg | This paper | Primers for qRT-PCR | Forward primer: 5’-ctgatgtgagggagcctattt-3’ Reverse primer: 5’-gagtctgtttggcctccatta-3’ |
| sequence-based reagent | atm | This paper | Primers for qRT-PCR | Forward primer: 5’-cctcaaggctgtggagaact-3’ Reverse primer: 5’-aggggattttctttacaccactc-3’ |
| sequence-based reagent | atr | This paper | Primers for qRT-PCR | Forward primer: 5’-aggaacccaatctgccagt-3’ Reverse primer: 5’-gatgtccagtgccagctctc-3’ |
| sequence-based reagent | wrnip1 | This paper | Primers for qRT-PCR | Forward primer: 5’-gtgatgtgcgagaggtgataa –3’ Reverse primer: 5’-acgtgtcctgctgtgattt-3’ |
| sequence-based reagent | ef1α | PMID:19014500 | Primers for qRT-PCR | Forward primer: 5’-cttctcaggctgactgtgc-3’ Reverse primer: 5’-ccgctagcattaccctcc-3’ |
| sequence-based reagent | Genotyping primers for banpsa12976 | This paper | Primers for sequencing | Forward primer: 5’-TGTTGATATCCATCAGTCAG-3’ Reverse primer: 5’-GGTGTATAAATCACATGACC-3’ |
| sequence-based reagent | Genotyping primers for banprw337 | This paper | PCR Primers | forward: 5’-CGATGTTGATATCCATCAGTCAGGCGATC-3’; reverse primer: 5’-GGTGCTGGTGTATAAATCACATGACCTATGGTCCTCTT-3’. |
| sequence-based reagent | Subcloning of banp full length cDNA for in Situ hybridization RNA probe synthesis | This paper | PCR Primers | Forward: 5’- cgaattcatgatgtcagagcaagatttag –3’ Reverse: 5’- gctcgagtcaagtgcctggcatctggatc g-3’ |
| sequence-based reagent | Subcloning of cenpt cDNA fragment for in Situ hybridization RNA probe synthesis | This paper | PCR Primers | Forward: 5’-ctggctcaaagagtgggctga-3’ Reverse: 5’-agacgtcactggccaccttg-3’ |
| sequence-based reagent | Subcloning of ncapg cDNA fragment for in Situ hybridization RNA probe synthesis | This paper | PCR Primers | Forward: 5’-gtcaaggaacagcgtatagag-3’ Reverse: 5’-ggaaccatgatctccgattag-3’ |
| sequence-based reagent | Subcloning of wrnip1 cDNA fragment for in Situ hybridization RNA probe synthesis | This paper | PCR Primers | Forward: 5’-aactgatcggagaacaaactc-3’ Reverse: 5’-gcacactgggctagaataac-3’ |
| commercial assay or kit | DIG RNA Labelling Kit | Roche | 11175025910 | In situ hybridization |
| commercial assay or kit | mMESSAGE mMACHINE SP6 Transcription Kit | Invitrogen | AM1340 | Capped mRNA synthesis |
| commercial assay or kit | In Situ Cell Death Detection Kit, TMR red | Roche | 12156792910 | apoptosis |
| commercial assay or kit | ReverTra Ace︎ aPCR master mix with gDNA remover | Toyobo | FSQ-301 | cDNA synthesis |
| commercial assay or kit | Luna Universal qPCR Master Mix | NEB | M3003L | qRT-PCR |
| commercial assay or kit | Direct-zol RNA Miniprep Kit | ZYMO RESEARCH | R2050 | RNA-sequencing |
| commercial assay or kit | NEBNext Ultra II Directional RNA Library Prep Kit | NEB | E7760 | Illumina RNA-sequencing |
| chemical compound, drug | Acridine orange | WALDECK (CHROMA) | 1B-307 | Live cell death detection |
| software, algorithm | IMARIS | Bitplane | ver.9.1.2 | http://www.bitplane.com/imaris; RRID: SCR_007370 |
| software, algorithm | Image J | NIH | Version 2.1.0/1.53 c | Percentage area calculation |
| software, algorithm | ZEN 2012 | Zeiss | LSM710 (Version: 14.0.25.201) | Percentage area calculation |
| Software, algorithm | GraphPad Prism | GraphPad Software | Version 9.1.2 | https://www.graphpad.com/scientific-software/prism/ |
| other | SYTOX Green | Molecular Probes | S34862 | IHC (1:1000) |
| other | rhodamine-conjugated phalloidin | Molecular Probes | R415 | Filamentous actin (F-actin) stain IHC (1: 40) |
| other | Restore PLUS Western Blot Stripping Buffer | Thermo Scientific | 46,430 | Remove high-affinity antibodies from membranes (western blot) |
Additional files
-
Transparent reporting form
- https://cdn.elifesciences.org/articles/74611/elife-74611-transrepform1-v1.docx
-
Supplementary file 1
List of genes containing Banp motif.
- https://cdn.elifesciences.org/articles/74611/elife-74611-supp1-v1.xlsx
Download links
A two-part list of links to download the article, or parts of the article, in various formats.
Downloads (link to download the article as PDF)
Open citations (links to open the citations from this article in various online reference manager services)
Cite this article (links to download the citations from this article in formats compatible with various reference manager tools)
Banp regulates DNA damage response and chromosome segregation during the cell cycle in zebrafish retina
eLife 11:e74611.
https://doi.org/10.7554/eLife.74611


