Novel protein markers of androgen activity in humans: proteomic study of plasma from young chemically castrated men
- Molecular Reproductive Medicine, Department of Translational Medicine, Lund University, Sweden
- Section for Clinical Chemistry, Department of Translational Medicine, Lund University, Skåne University Hospital Malmö, Sweden
- Clinical Protein Science & Imaging, Biomedical Centre, Department of Biomedical Engineering, Lund University, Sweden
- Department of Experimental Design and Bioinformatics, Faculty of Agriculture and Biology, Warsaw University of Life Sciences SGGW, Poland
- Department of Molecular Biology, University of Texas Southwestern Medical Center, United States
- Molecular Genetic Reproductive Medicine, Department of Translational Medicine, Lund University, Sweden
- First Department of Surgery, Tokyo Medical University, Japan
Figures
Figure 1
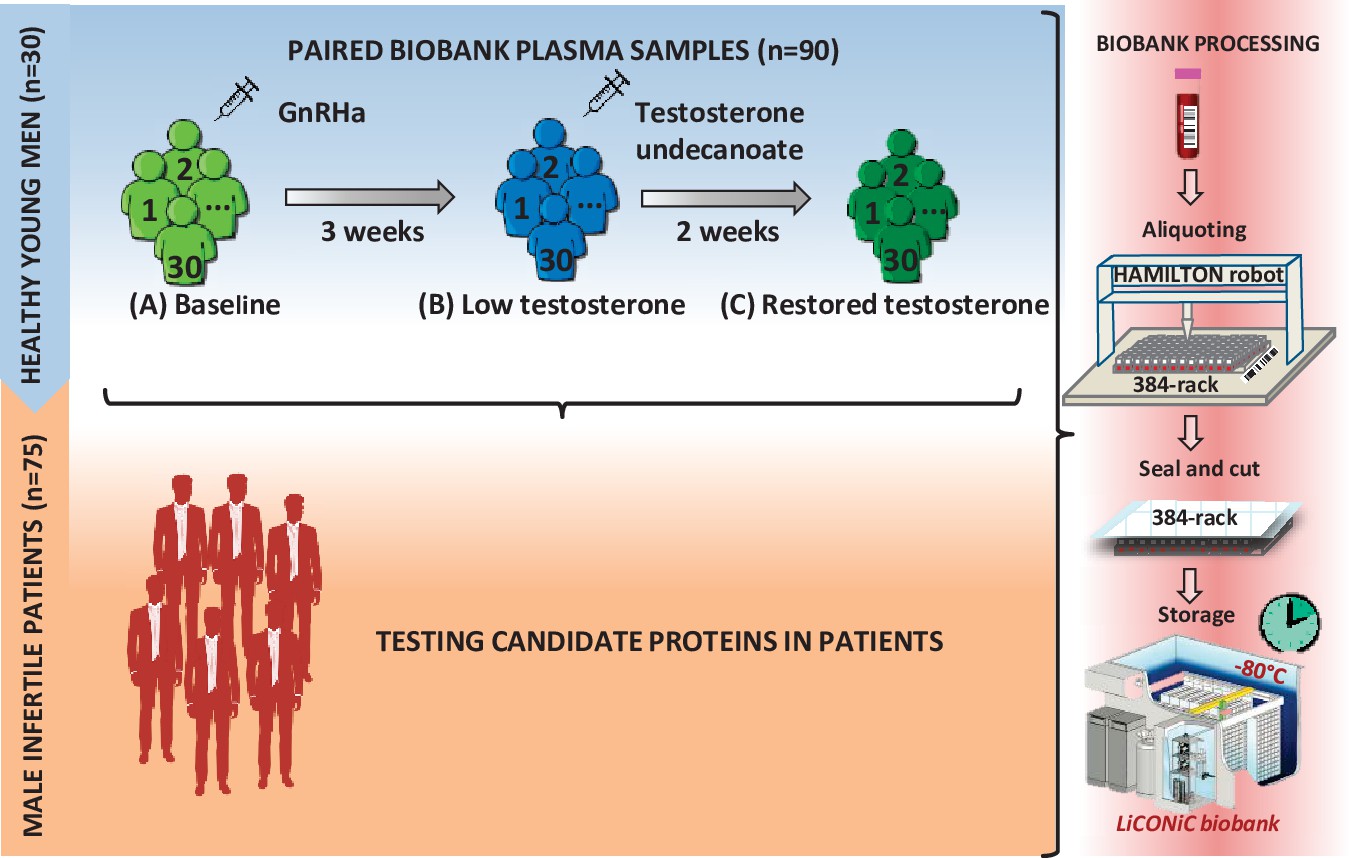
Study design.
First, a model of 30 young healthy males was evaluated by proteomics at three time points (A–C), where testosterone changes were induced: (A) baseline; (B) week 3; (C) week 5. Identified proteins proposed as candidate biomarkers were then evaluated in a cohort of infertile males. In both steps of the study, the quality of the blood samples was ensured by following an automated workflow for sample aliquoting and storage (−80°C).
Figure 2
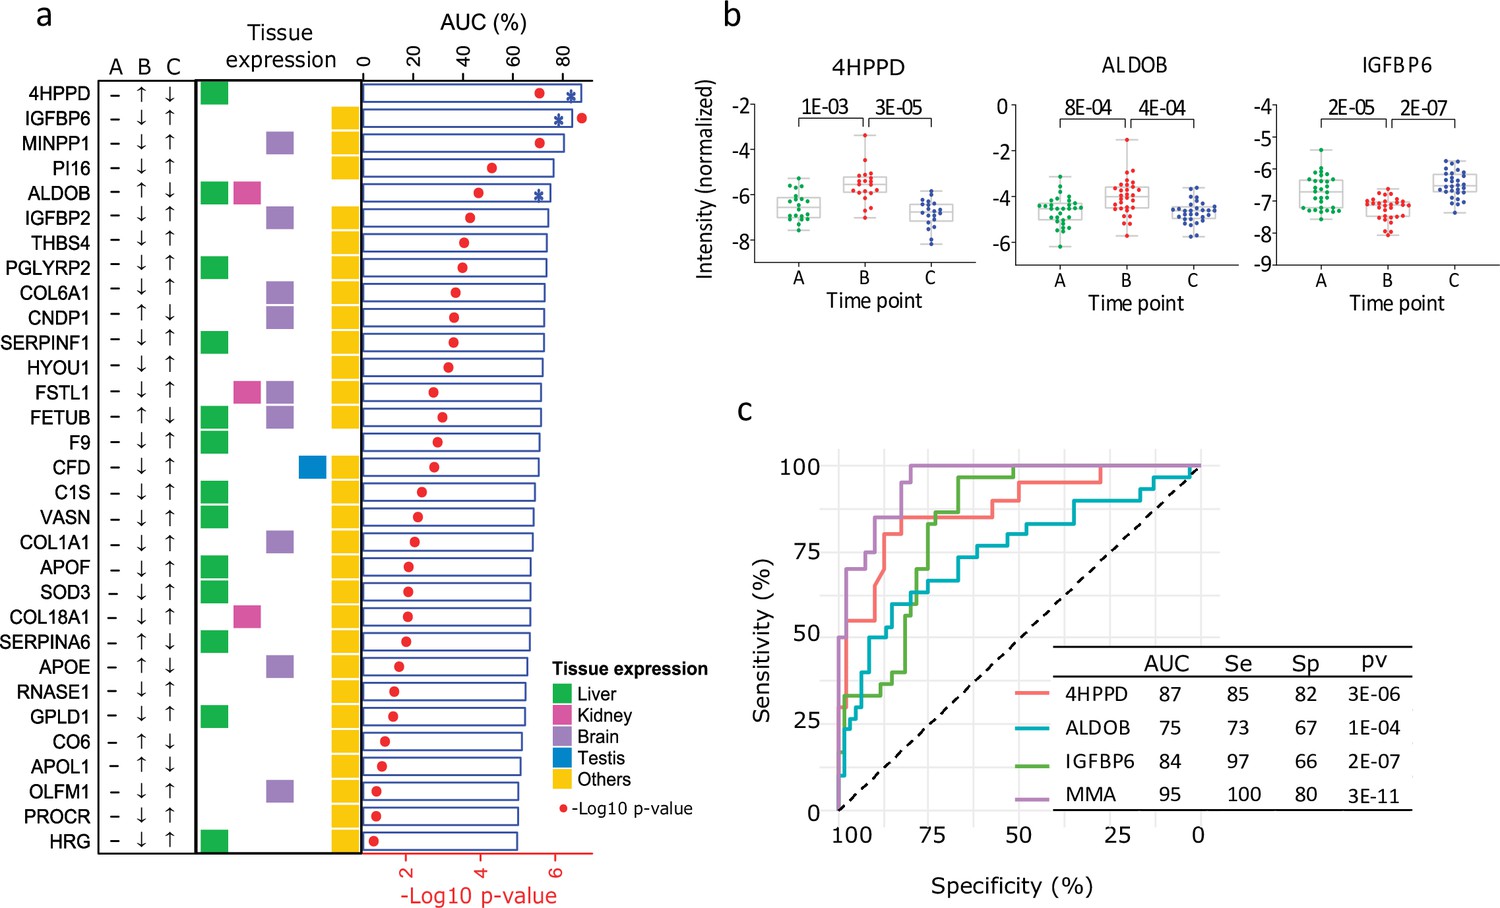
Proteins influenced by testosterone in the model of young healthy males.
(a) Top 25 significant proteins selected in the healthy human model (receiver operating characteristic [ROC] p < 0.01, Table S3). The arrows indicate the direction of change in protein expression in the different conditions. The tissue with highest expression of each protein is indicated in colors. Also, results from the ROC analysis are shown as bar chart (area under the curve, AUC) and heat-map (p values). (b) Boxplot (mean (min; max)) of the top three significant proteins proposed as biomarker candidates, able to discriminate between low and normal testosterone (in Table S4 available here). The adjusted p values are specified on top of the comparative horizontal lines. (c) ROC of the analytes proposed as biomarker candidates, including Multi Marker Algorithm (MMA).
Figure 3
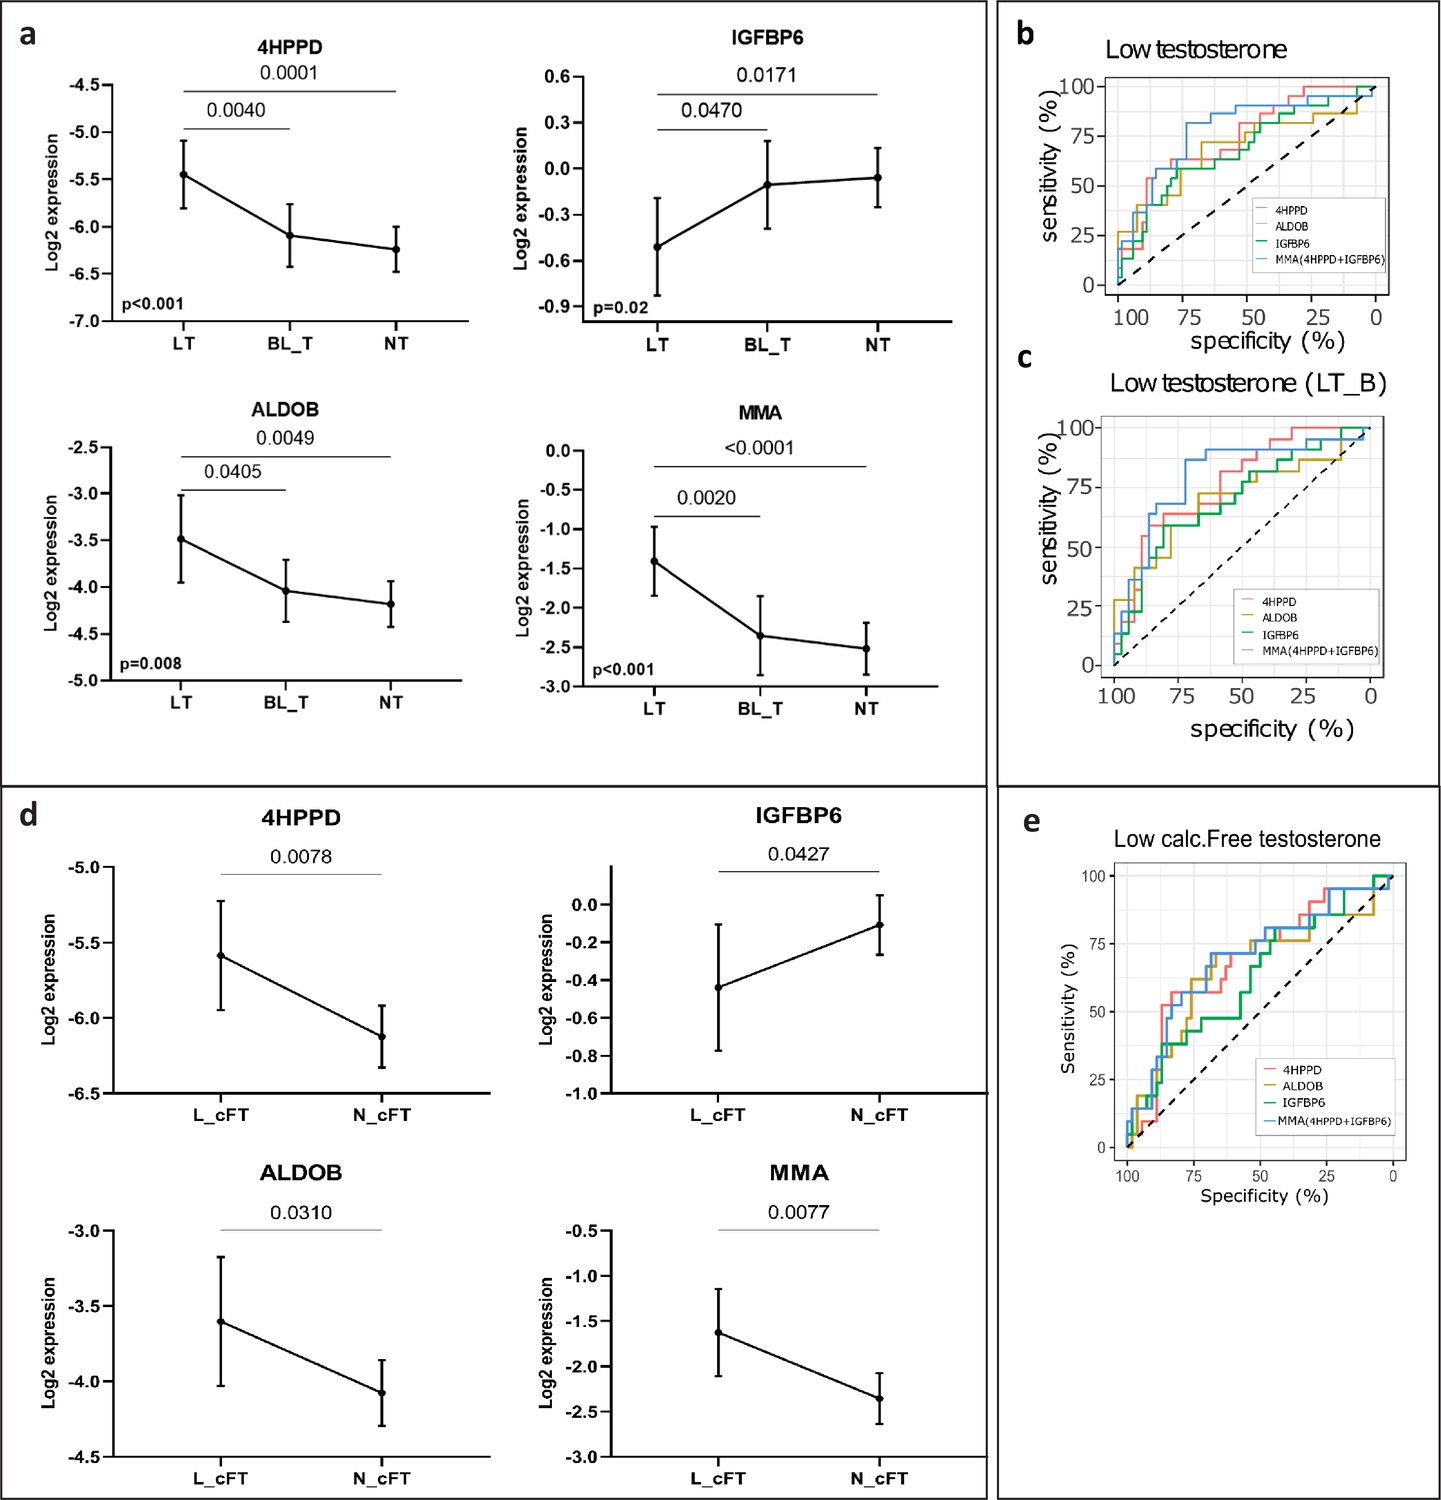
New markers to discern states of different testosterone levels in men investigated for infertility (n = 75).
(a) Patients grouped by three levels of total testosterone: low testosterone (LT) ≤8 nmol/l (n = 22), borderline testosterone (BL_T) between 8 and 12 nmol/l (n = 17) and normal testosterone (HT) >12 nmol/l (n = 36). Each group is represented by the mean and its 95% CI. Horizontal lines indicate significant differences between groups and the adjusted p values are specified on top of these lines (in Table S5 available here). (b) Receiver operating characteristic (ROC) analysis to discriminate patients with LT in the entire cohort and (c) in a cohort that excluded patients with borderline testosterone levels (LT_B). Multi Marker Algorithm (MMA) is based on is the combination of levels of the proteins 4-hydroxyphenylpyruvate dioxygenase (4HPPD) and insulin-like growth factor-binding protein 6 (IGFBP6). (d) As (a), but grouped according to the levels of calculated free testosterone (cFT): low (L_cFT) (n = 21) − < 220 pmol/l and normal (N_cFT) (n = 54) add symbol 220 pmol/l. (e) As (b) and (c) but for discrimination of L_cFT and N_cFT.
Figure 4
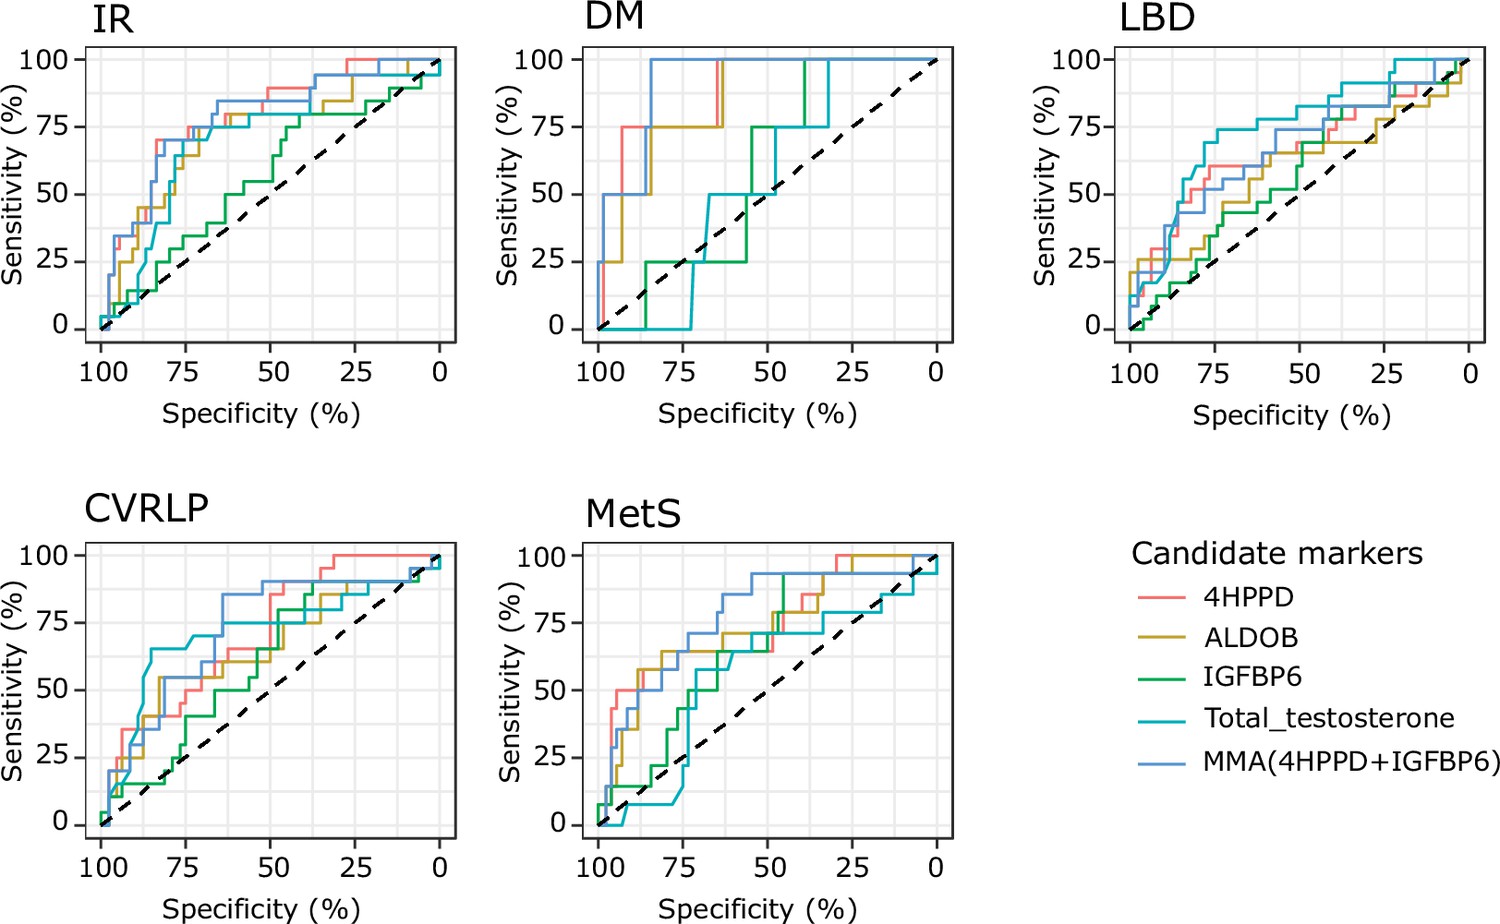
Results from receiver operating characteristic (ROC) analysis to determine whether the analytes discriminate between the presence of comorbidities or not.
Analytes included in the analysis are 4-hydroxyphenylpyruvate dioxygenase (4HPPD), insulin-like growth factor-binding protein 6 (IGFBP6), fructose-bisphosphate aldolase (ALDOB), and Multi Marker Algorithm (MMA; combination of 4HPPD and IGFBP6). Area under the curve (AUC), p values can be found in Table 2. IR: insulin resistance; DM: type 2 diabetes mellitus; LBD: low bone density; CVRLP: cardiovascular risk lipid profile; MetS: metabolic syndrome.
Figure 5
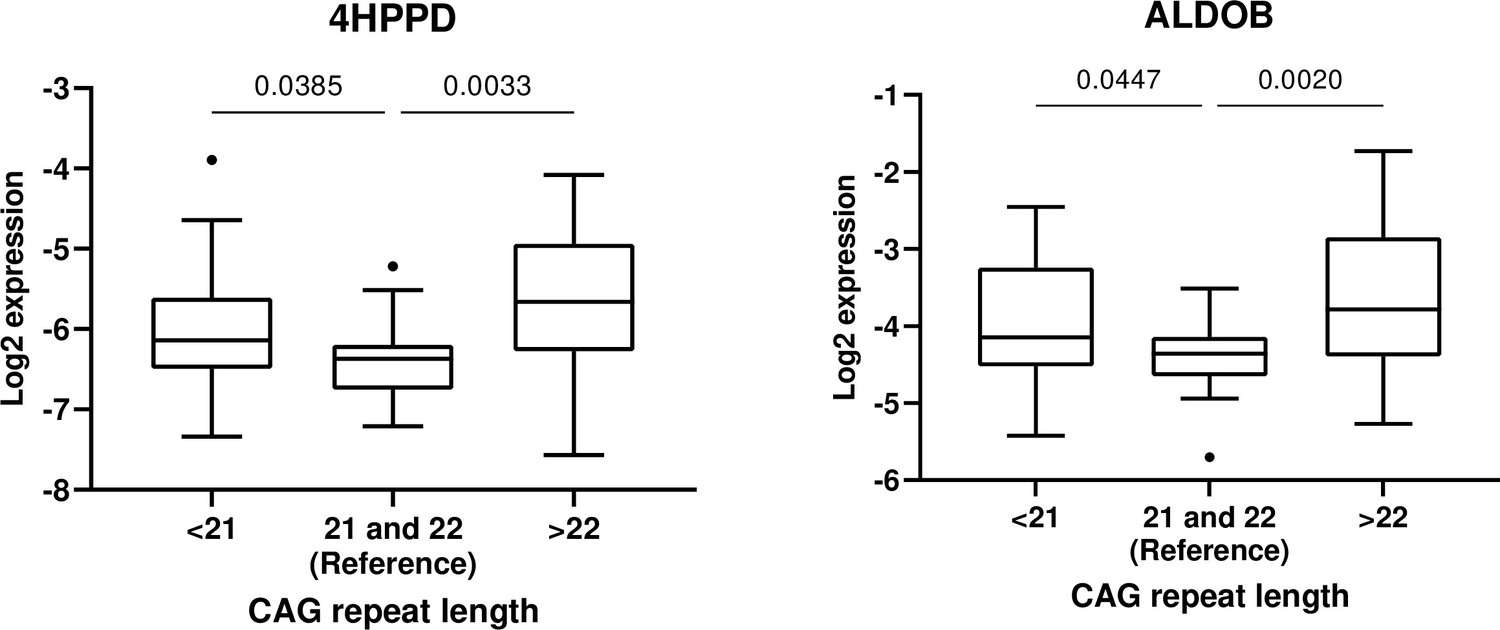
Association between androgen receptor CAG <21 (n = 26) and CAG <22 (n = 30) and 4-hydroxyphenylpyruvate dioxygenase (4HPPD) and fructose-bisphosphate aldolase (ALDOB), respectively, with CAG = 21 and 22 (n = 18) set as reference.
Tables
Table 1
Background characteristics of the infertile patients.
| a. Background characteristics of infertile patients. | ||
|---|---|---|
| Mean (SD) | N | |
| Age at inclusion (years) | 37.8 (5.5) | 75 |
| BMI | 27.2 (4.3) | 72 |
| Total testosterone (nmol/l) | 12.8 (6.8) | 75 |
| FSH (IU/l) | 15.8 (14.3) | 75 |
| LH (IU/l) | 7.5 (5.7) | 75 |
| SHBG (nmol/l) | 24.0 (4.5–84.5)* | 75 |
| Estradiol (pmol/L) | 96 (36–321)* | 75 |
| Calculated free testosterone (pmol/l) | 260 (50–1360)* | 75 |
| ApoB/ApoA1 | 0.7 (0.2) | 68 |
| HOMA-IR | 1.6 (0.4–13.9)* | 75 |
| DEXA score (lumbar z-score) | −0.5 (1.3) | 74 |
| CAG (repeated length) | 22 (14–31)* | 74 |
| b. Characteristics of the cohort of infertile patients | ||
| n (%) | ||
| Smoker | 9 (12.0) | |
| Current diseases | 36 (48.0) | |
| Insulin medication | 1 (1.3) | |
| Current ART | 8 (10.7) | |
| CVRLP | 20 (27.0) | |
| Insulin resistance | 20 (27.0) | |
| Diabetes mellitus 2 | 4 (5.3) | |
| Metabolic syndrome (MetS) | 14 (20.9) | |
| Low bone density | 23 (30.6) | |
-
*
Characteristics values are expressed as mean (SD), except for those that did not follow a normal distribution (non-Gaussian) and which are shown as median (min–max).
Table 2
Comparison of receiver operating characteristic (ROC)–areas under the curve for testosterone and the candidate biomarkers in relation to the prediction of hypogonadism and its sequelae in patients.
| Analyte | Low T | Low T* | Low cFT | IR | DM | LBD | CVRLP | MetS | ||||||||
|---|---|---|---|---|---|---|---|---|---|---|---|---|---|---|---|---|
| (T ≤ 8 nmol/l) | (T ≤ 8 nmol/l) | (cFT <220 pmol/l) | (HOMA-IR >2.5) | - | (z-score <−1) | (ApoB/ApoA1 ≥0.9) | ||||||||||
| AUC (Sp,Se) | p | AUC (Sp,Se) | p | AUC (Sp,Se) | p | AUC (Sp,Se) | p | AUC (Sp,Se) | p | AUC (Sp,Se) | p | AUC (Sp,Se) | p | AUC (Sp,Se) | p | |
| 4HPPD | 0.75(85,59) | 8.38E−04 | 0.77(86,59) | 2.66E−04 | 0.69(83,57) | 5.14E−03 | 0.79(84,70) | 1.20E−04 | 0.89(93,75) | 9.00E−03 | 0.64(76,61) | 2.24E−02 | 0.74(46,90) | 5.79E−03 | 0.74(95,50) | 5.31E−03 |
| ALDOB | 0.69(68,73) | 8.25E−03 | 0.70(67,73) | 5.39E−03 | 0.66(67,71) | 1.56E−02 | 0.73(71,75) | 2.85E−03 | 0.85(63,100) | 1.80E−02 | 0.57(98,27) | 1.93E−01 | 0.71(83,55) | 4.64E−02 | 0.74(82,64) | 6.02E−03 |
| IGFBP6 | 0.69(77,59) | 1.05E−02 | 0.70(81,59) | 4.89E−03 | 0.63(44,81) | 7.24E−02 | 0.57(42,80) | 3.50E−01 | 0.59(39,100) | 5.40E−01 | 0.63(43,78) | 2.75E−01 | 0.59(48,80) | 1.87E−01 | 0.65(45,93) | 8.45E−02 |
| Testosterone | - | - | - | - | - | - | 0.71(76,70) | 4.96E−03 | 0.55(32,100) | 7.24E−01 | 0.75(74,74) | 5.12E−04 | 0.66(65,85) | 6.55E−03 | 0.56(72,57) | 5.08E−01 |
| MMA | 0.79(74,82) | 9.23E−05 | 0.80(72,86) | 3.86E−05 | 0.70(69,71) | 3.90E−03 | 0.79(82,70) | 1.46E−04 | 0.92(84,100) | 5.00E−03 | 0.78(82,65) | 1.40E−02 | 0.75(73,75) | 3.65E−03 | 0.78(63,86) | 1.57E−03 |
-
Significant p values are highlighted in bold and underlined. *Excluding patients with testosterone values from the borderline low testosterone (8 < BL_T ≤ 12).
-
cFT: calculated free testosterone; IR: insulin resistance; DM: diabetes mellitus type 2; LBD: low bone density; CVRLP: cardiovascular risk lipid profile ;MetS: metabolic syndrome; AUC:area under the curve; Spe: specificity in %; Se: sensitivity in %.
Table 3
Ratio between mean concentrations of 4-hydroxyphenylpyruvate dioxygenase (4HPPD) and fructose-bisphosphate aldolase (ALDOB) in men with CAG repeat length <21 or > 22 as compared to the reference group.
| Proteins | Overall p value | <21 vs reference | >22 vs reference | ||
|---|---|---|---|---|---|
| Ratio (95% CI) | p value* | Ratio (95% CI) | p value* | ||
| 4HPPD | 0.012 | 1.34 (1.02–1.76) | 0.032 | 1.62 (1.23–2.13) | 0.001 |
| ALDOB | 0.008 | 1.35 (1.03–1.78) | 0.029 | 1.72 (1.29–2.32) | <0.001 |
-
*
p value of the post hoc constrain between groups.
-
Ratio: ratio between mean concentration in <21 or >22 groups divided by the reference group (21 and 22).
Additional files
Download links
A two-part list of links to download the article, or parts of the article, in various formats.
Downloads (link to download the article as PDF)
Open citations (links to open the citations from this article in various online reference manager services)
Cite this article (links to download the citations from this article in formats compatible with various reference manager tools)
Novel protein markers of androgen activity in humans: proteomic study of plasma from young chemically castrated men
eLife 11:e74638.
https://doi.org/10.7554/eLife.74638


