The relative binding position of Nck and Grb2 adaptors impacts actin-based motility of Vaccinia virus
- Cellular Signalling and Cytoskeletal Function Laboratory, The Francis Crick Institute, United Kingdom
Figures
Figure 1 with 1 supplement
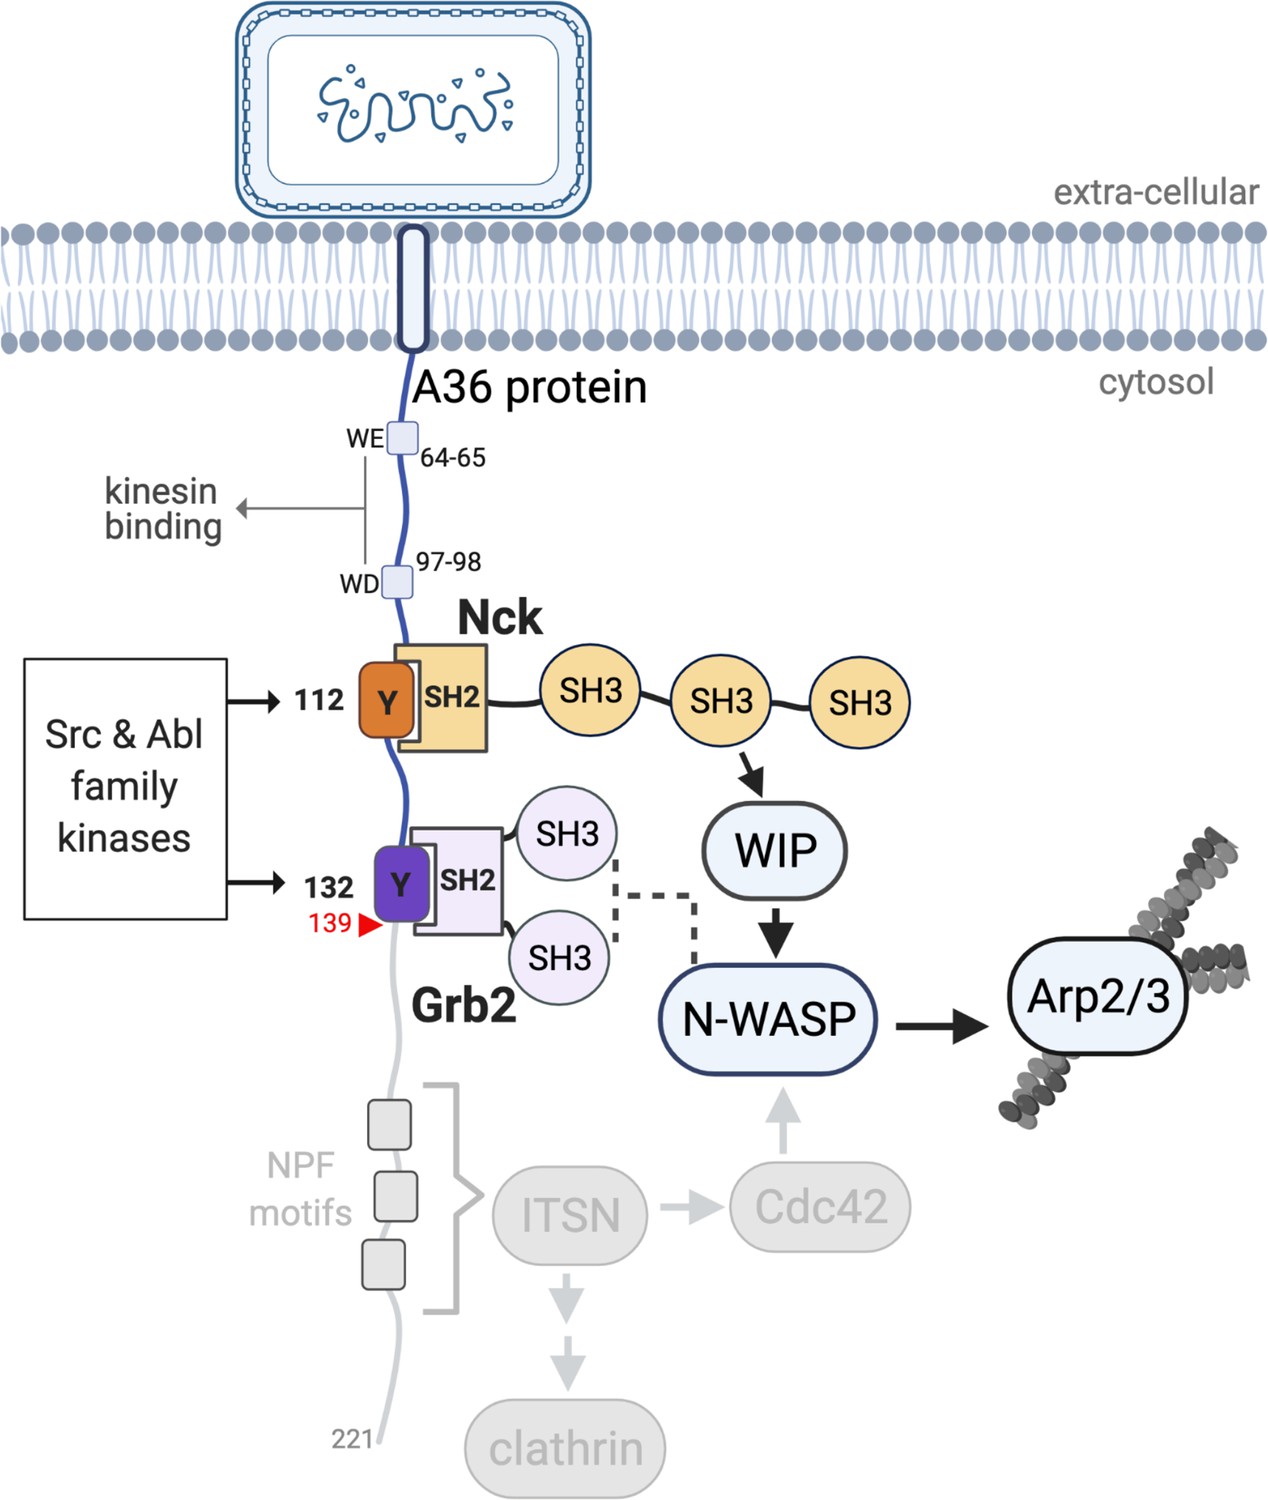
A36 interactions and the Vaccinia signalling network.
A schematic showing the Vaccinia virus protein A36 and its known interactors. Kinesin-1 that drives microtubule-based transport of virions to the plasma membrane binds the WD/WE motifs. Nck and Grb2 bind Y112 and Y132 respectively when they are phosphorylated by Src and Abl family kinases. Nck and Grb2 interact with WIP and N-WASP via their SH3 domains, which results in the activation of the Arp2/3 complex and stimulation of actin polymerisation. The region deleted in A36 after residue 139 (red triangle) to abolish the involvement of the RhoGEF intersectin and its binding partners clathrin and Cdc42 is shown in grey. For simplicity, the A36 molecule has been illustrated as extending into the cytosol perpendicular to the membrane, but its exact orientation is unknown.
Figure 1—figure supplement 1
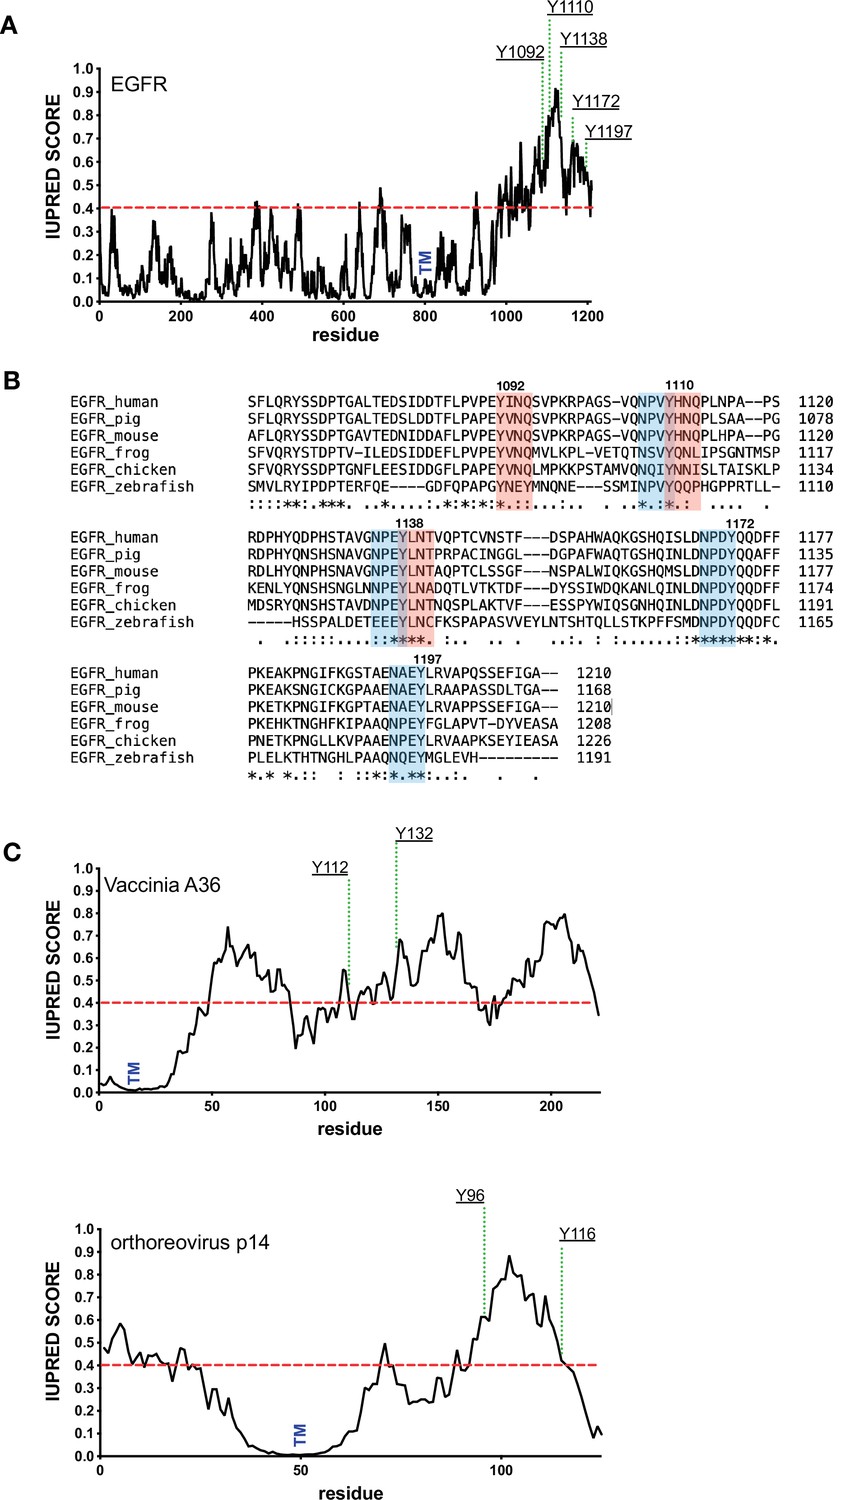
pTyr motifs are found in disordered regions.
(A) Shows a graph predicting the intrinsic disorder of human EGFR (https://iupred2a.elte.hu/). The positions of key phosphotyrosine residues and the transmembrane domain (TM) are indicated. (B) Clustal sequence alignment of the C-terminus of EGFR from the indicated species. Positions of the conserved Grb2 and Shc1 adaptor binding sites are shown in pink and blue, respectively. (C) Shows the predicted intrinsic disorder of Vaccinia A36 and Orthoreovirus p14 together with the positions of key phosphotyrosine residues involved in recruiting Nck and Grb2 and the transmembrane domain (TM).
Figure 2 with 2 supplements
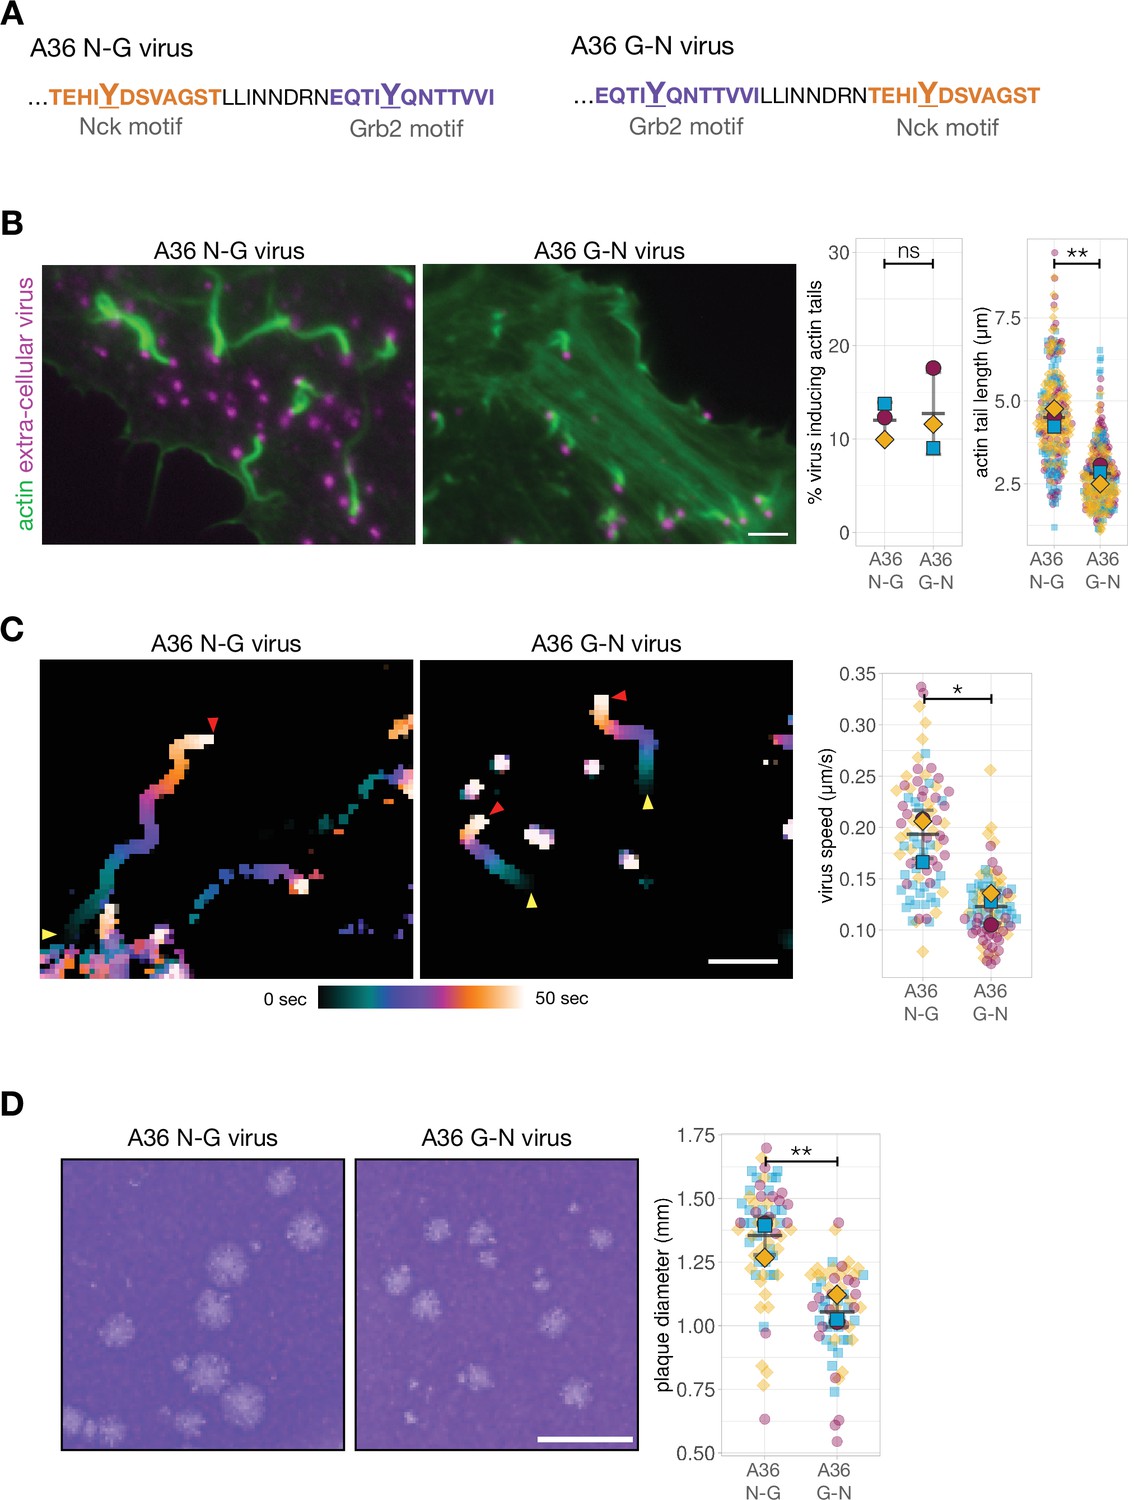
Phosphotyrosine motif position impacts actin-based motility and viral spread.
(A) C-terminal amino acid sequence of A36 in recombinant viruses showing the position of phosphotyrosine motifs in their wild-type (A36 N-G) and swapped (A36 G-N) configurations. (B) Representative immunofluorescence images of actin tails in HeLa cells infected with the indicated virus at 8 hr post-infection. Actin is stained with phalloidin, and extra-cellular virus particles attached to plasma membrane are labelled using an antibody against the viral protein B5. Scale bar = 3 μm. The graphs show quantification of number of extracellular virus particles inducing actin tails and their length. A total of 270 actin tails were measured in three independent experiments. (C) Temporal colour-coded representation of time-lapse movies tracking the motility of the indicated RFP-A3-labelled virus over 50 s at 8 hr post infection (Video 1). Images were recorded every second and the position of virus particles at frame 1 (yellow triangles) and frame 50 (red triangles) are indicated. Scale bar = 3 μm. The graph shows quantification of virus speed over 50 s. A total of 82 virus particles were tracked in three independent experiments. (D) Representative images and quantification of plaque diameter produced by the indicated virus in confluent BS-C-1 cells 72 hr post-infection. Sixty-four plaques were measured in three independent experiments. Scale bar = 3 mm. All error bars represent S.D and the distribution of the data from each experiment is shown using a ‘SuperPlot’. Welch’s t test was used to determine statistical significance; ns, p>0.05; * p≤0.05; ** p≤0.01.
-
Figure 2—source data 1
Datasheets for graphs and summary statistics.
- https://cdn.elifesciences.org/articles/74655/elife-74655-fig2-data1-v2.zip
Figure 2—figure supplement 1
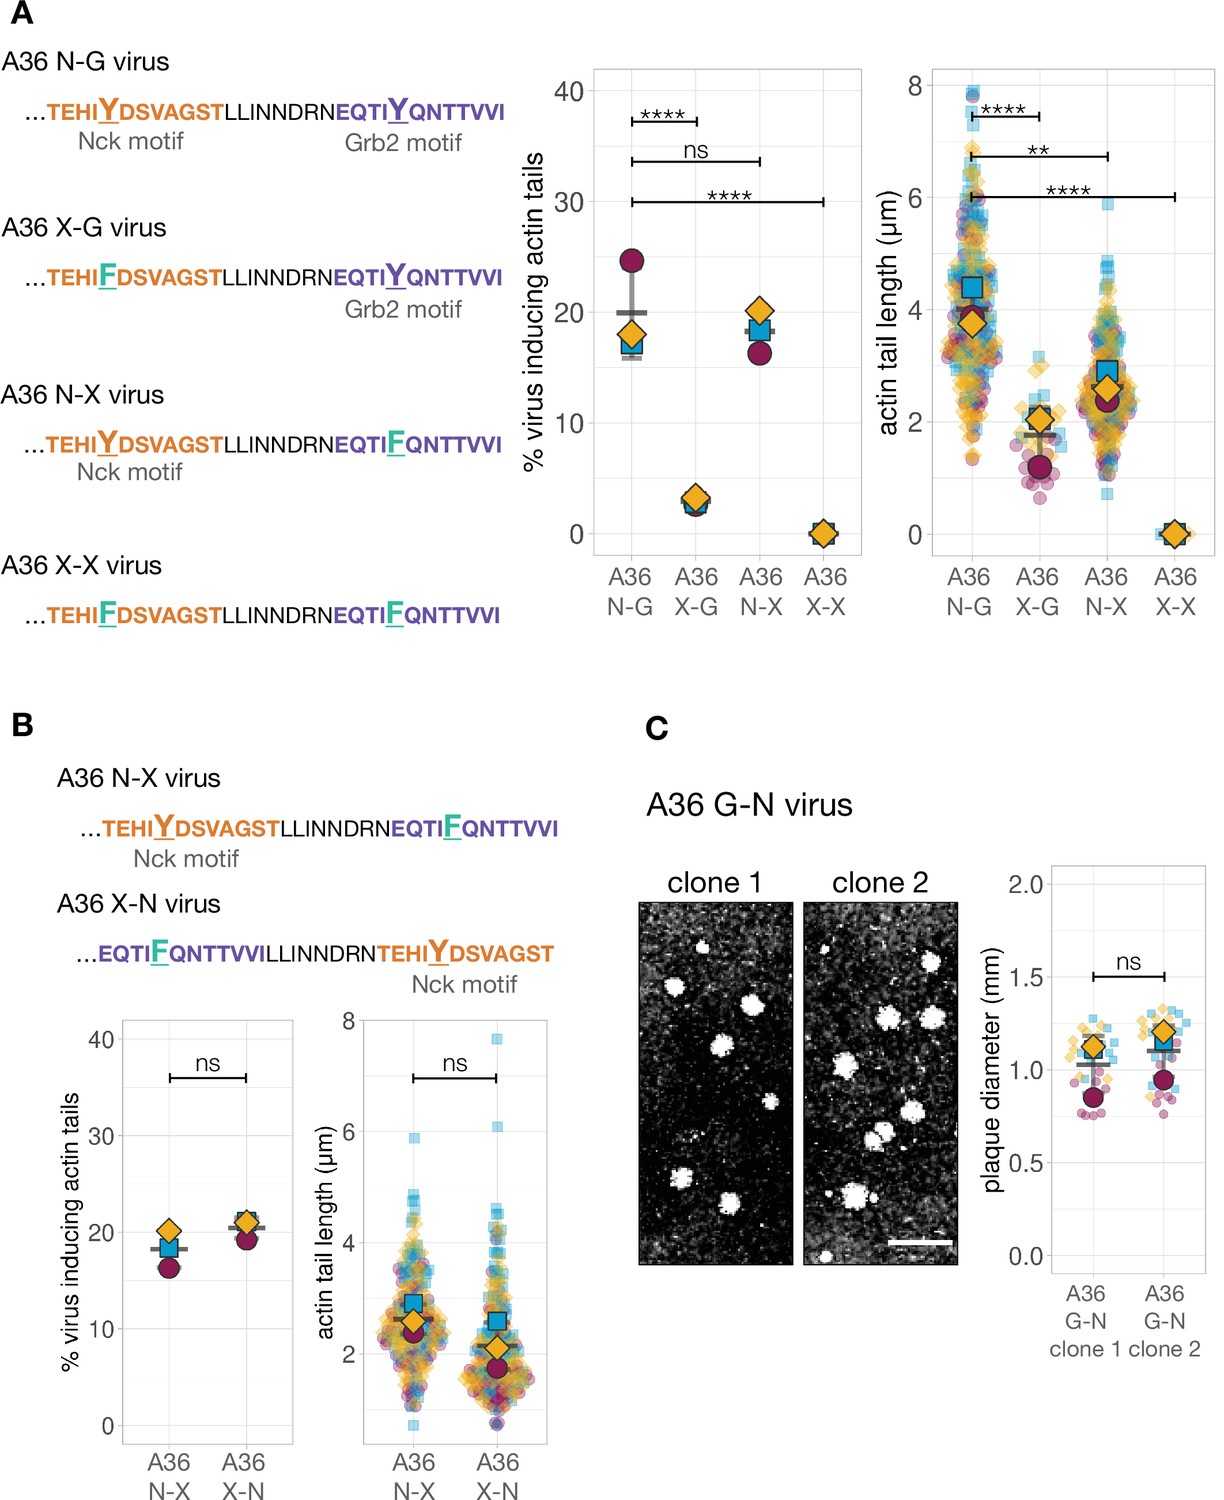
Quantification of the number of virus inducing actin tails along with their length and characterisation of A36 G-N recombinant viruses.
(A) Left - Amino acid sequences of the indicated truncated A36 recombinants where either one or both phosphotyrosine motifs (orange for Nck and purple for Grb2) are disrupted with a Tyr (Y) to Phe (F) point mutation. Right - Quantification of the number of extracellular virus inducing actin tails together with their length. (B) C-terminal amino acid sequences of truncated A36 recombinants with wild-type or swapped Nck binding sites but deficient in Grb2 recruitment (Phe substitution) together with quantification of the number of extracellular virus inducing actin tails together with their length. The same A36 N-X data is shown in (A) and (B). In both cases, 240 actin tails were measured in three independent experiments, except in the A36 X-G mutant where very few actin tails were made. All error bars represent S.D. and the distribution of the data from each experiment is shown using a ‘SuperPlot’. Dunnett’s multiple comparison’s test was used to determine statistical significance; ns, p>0.05; ** p≤0.01; **** p≤0.0001. (C) Representative images and quantification of plaque diameter produced by two independent isolates of the A36 G-N recombinant virus in confluent BS-C-1 cells 72 hr post-infection. Thirty plaques were measured in three independent experiments. Scale bar = 3 mm. Welch’s t test was used to determine statistical significance; ns, p>0.05.
-
Figure 2—figure supplement 1—source data 1
Datasheets for graphs and summary statistics.
- https://cdn.elifesciences.org/articles/74655/elife-74655-fig2-figsupp1-data1-v2.zip
Figure 2—figure supplement 2
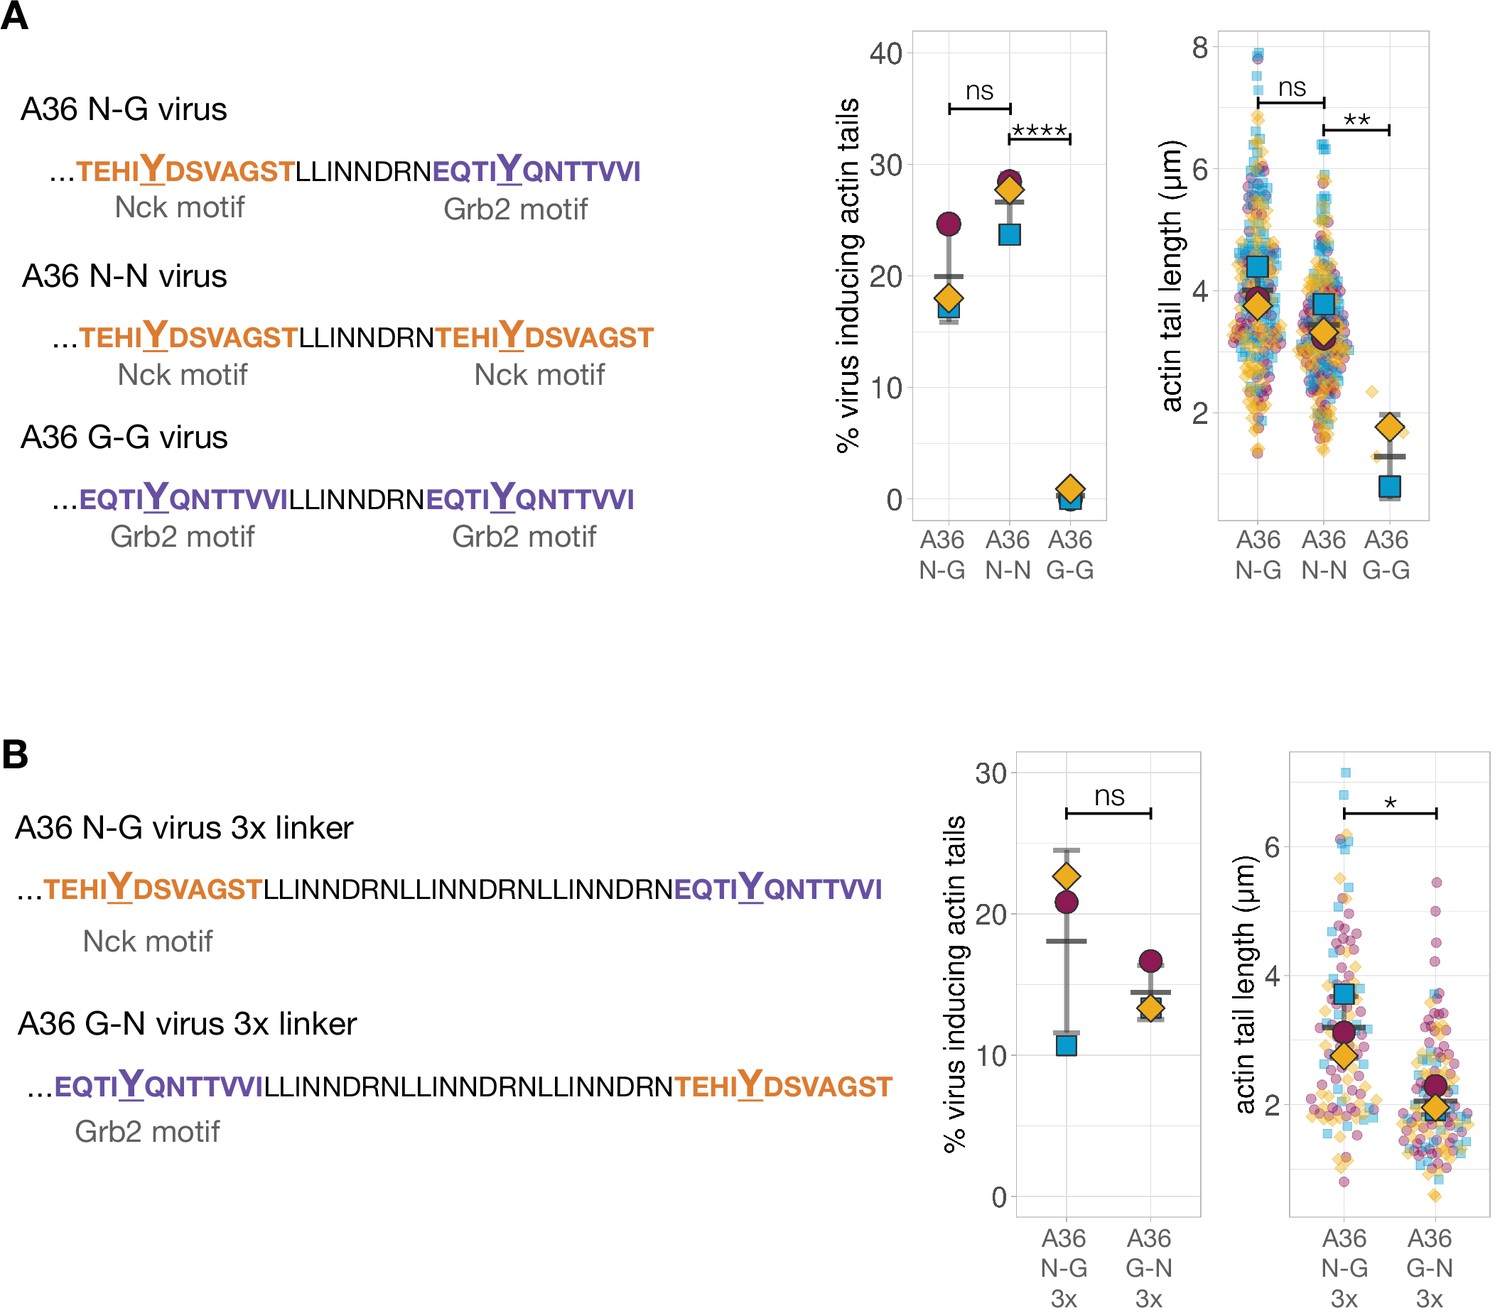
Quantification of the number of virus inducing actin tails along with their length.
(A) Left - C-terminal amino acid sequences of the indicated truncated A36 recombinants where the number of adaptor binding sites is modified (orange for Nck and purple for Grb2). Right - Quantification of the number of extracellular virus inducing actin tails together with their length. The same A36 N-G data is shown in Figure 2—figure supplement 1A. 240 actin tails were measured in three independent experiments, except in the A36 G-G mutant where very few actin tails were made. (B) Left - C-terminal amino acid sequences of A36 recombinants with increased linker length between Nck/Grb2 binding sites in native or swapped orientation. Right - Quantification of the number of virus particles inducing actin tails together with their length. 120 actin tails were measured in three independent experiments. All error bars represent S.D. and the distribution of the data from each experiment is shown using a ‘SuperPlot’. Dunnett’s multiple comparison’s test (panel A) or Welch’s t test (panel B) was used to determine statistical significance; ns, p>0.05; * p≤0.05; ** p≤0.01; **** p≤0.0001.
-
Figure 2—figure supplement 2—source data 1
Datasheets for graphs and summary statistics.
- https://cdn.elifesciences.org/articles/74655/elife-74655-fig2-figsupp2-data1-v2.zip
Figure 3 with 1 supplement
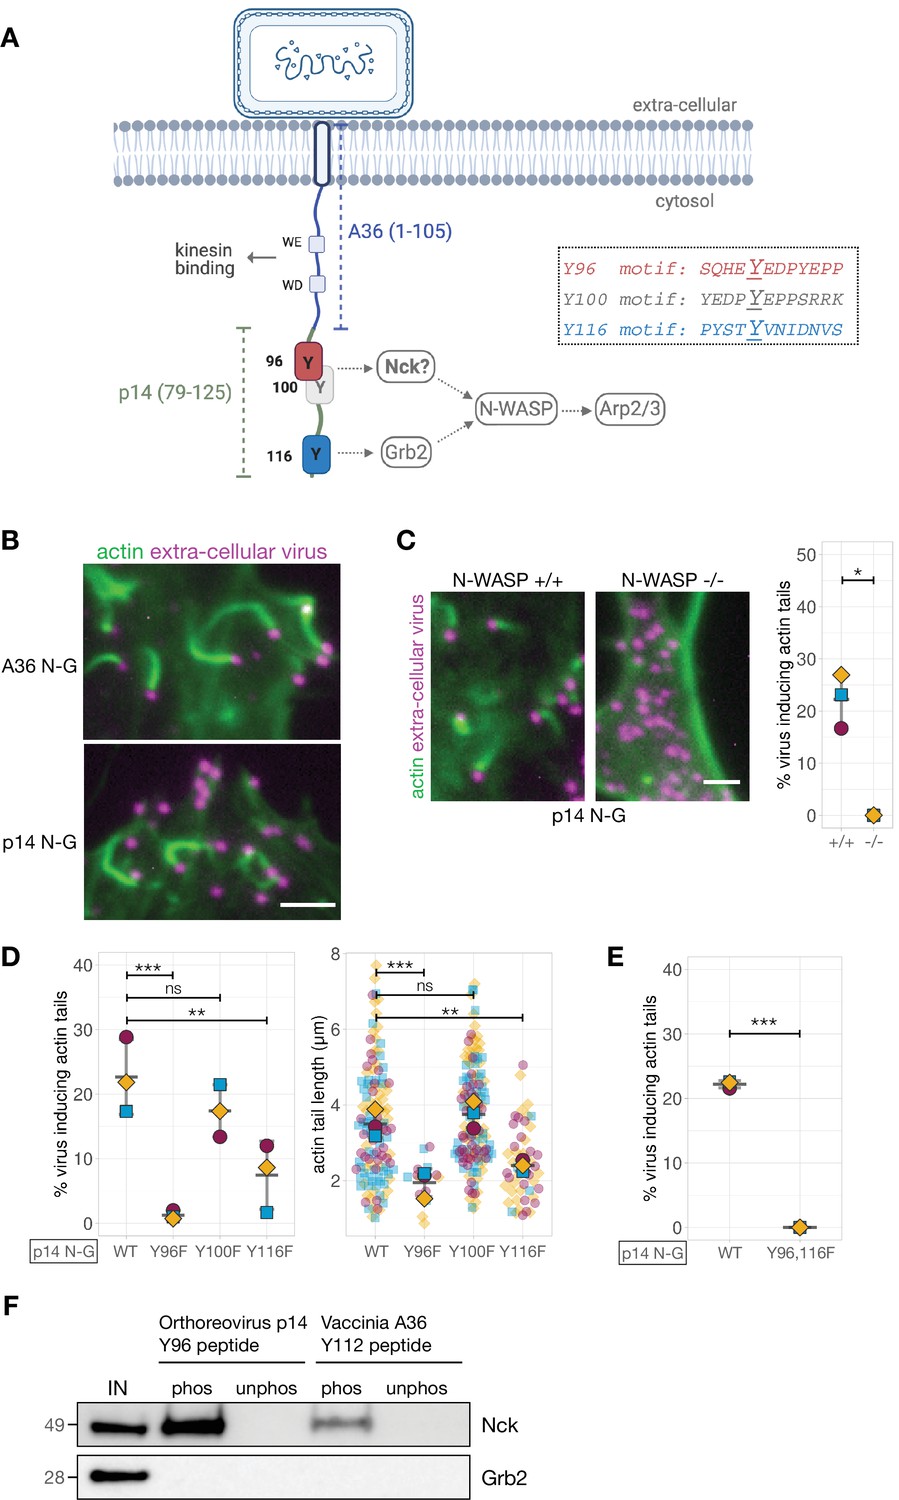
Generating and validating an A36-p14 hybrid that can polymerise actin.
(A) Schematic showing a hybrid construct (referred to as p14 N-G) comprising the first 105 residues of A36 and the C-terminal residues 79–125 of Orthoreovirus p14 protein. Positions of the predicted Nck-binding sites at Tyr96 and Tyr100, and the previously established Grb2-binding site at Tyr116 are shown together with their respective sequences. (B) Representative immunofluorescence images of actin tails in HeLa cells infected with Vaccinia virus lacking the A36 gene and transiently expressing the indicated constructs under the A36 promoter at 8 hr post-infection. Actin is stained with phalloidin, and extra-cellular virus particles attached to plasma membrane are labelled using an anti-B5 antibody. Scale bar = 3 μm. (C) Representative immunofluorescence images of N-WASP null or parental mouse embryonic fibroblast cells infected with Vaccinia virus lacking the A36 gene and transiently expressing the p14 N-G construct under the A36 promoter at 16 hr post-infection. Actin is stained with phalloidin, and extra-cellular virus particles are labelled using an anti-B5 antibody. Scale bar = 3 μm. The graph shows quantification of actin tail number per extracellular virus particle. Error bars represent S.D. from three independent experiments. Welch’s t test was used to determine statistical significance; * p≤0.05. (D) and (E) Quantification of the number of extracellular virus inducing actin tails together with their length in HeLa cells infected with Vaccinia virus lacking the A36 gene and transiently expressing p14 N-G constructs under the A36 promoter with indicated Tyr to Phe mutations, at 8 hr post-infection. 125 actin tails were measured in three independent experiments, except in mutants Y96F and Y116F where fewer actin tails were made. All error bars represent S.D and the distribution of the data from each experiment is shown using a ‘SuperPlot’. Dunnett’s multiple comparison’s test (for panel D) and Welch’s t test (for panel E) were used to determine statistical significance; ns, p>0.05; ** p≤0.01; *** p≤0.001. (F) Immunoblot analysis of peptide pulldowns showing that endogenous Nck from HeLa cell lysates binds to phosphopeptides corresponding to Tyr96 from the Orthoreovirus p14 and Tyr112 of the Vaccinia A36 but not to their unphosphorylated counterparts.
-
Figure 3—source data 1
Datasheets for graphs, summary statistics and raw immunoblots.
- https://cdn.elifesciences.org/articles/74655/elife-74655-fig3-data1-v2.zip
Figure 3—figure supplement 1
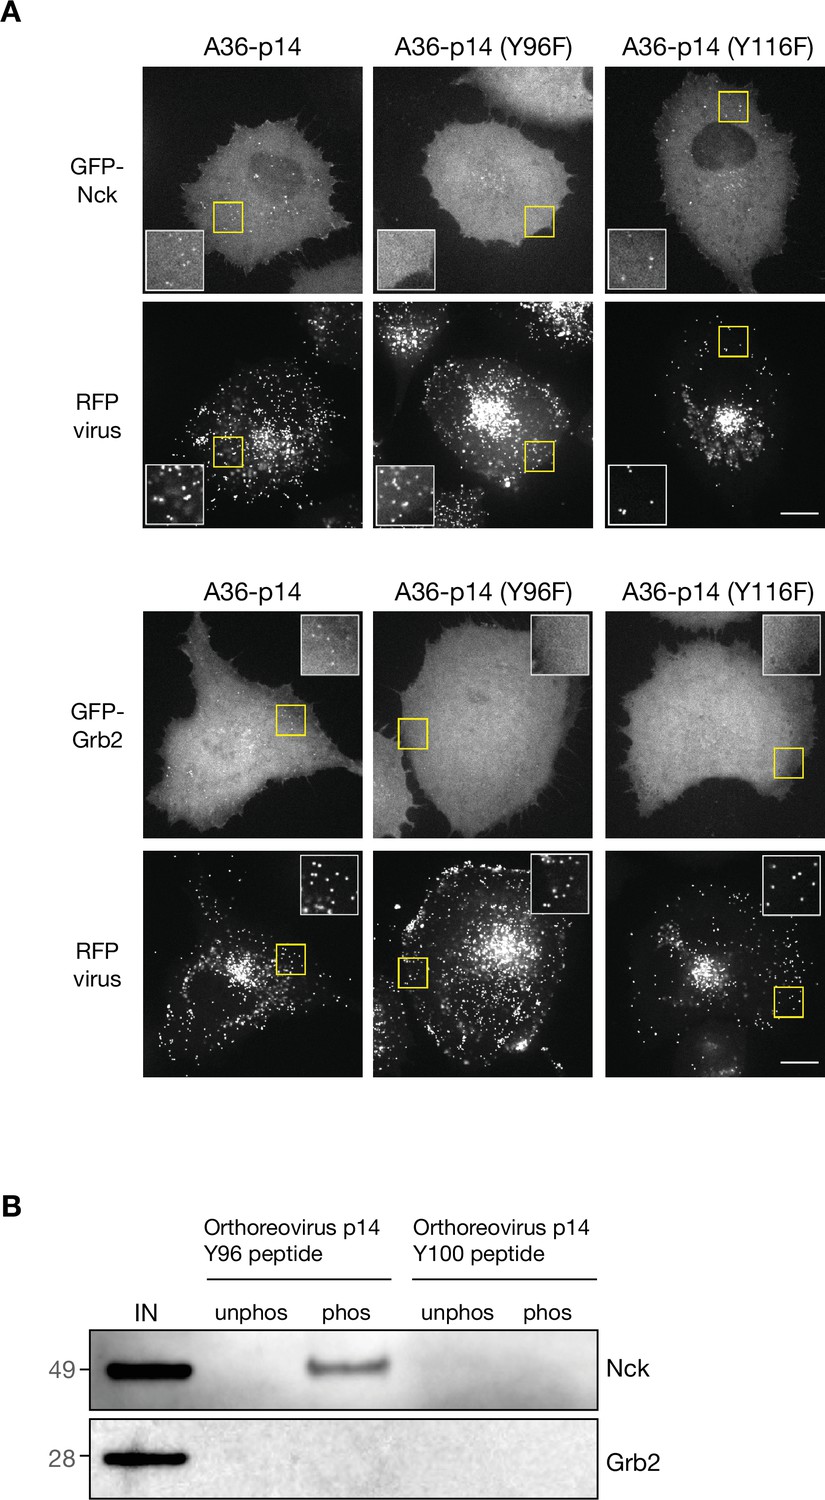
Generating and validating an A36-p14 hybrid that can polymerise actin.
(A) Representative images showing GFP-Nck or GFP-Grb2 and RFP-A3 intensity on virus particles in live HeLa cells infected with the indicated viruses recorded 8 hr post-infection. The insets show a ×2 magnification of the yellow boxed regions. Scale bar = 15 μm. (B) Immunoblot analysis of peptide pulldowns showing that endogenous Nck from HeLa cell lysates binds to the phosphopeptide corresponding to Tyr96 but not Tyr100 from Orthoreovirus p14.
-
Figure 3—figure supplement 1—source data 1
Raw immunoblots.
- https://cdn.elifesciences.org/articles/74655/elife-74655-fig3-figsupp1-data1-v2.zip
Figure 4 with 1 supplement

Phosphotyrosine motif position in a A36-p14 hybrid protein impacts actin polymerisation.
(A) Representative images showing the recruitment of Nck, WIP, Grb2, and N-WASP to actin tails in HeLa cells infected with a recombinant virus expressing the p14 N-G construct at the A36 locus at 8 hr post-infection. Endogenous Nck, N-WASP and WIP were detected with antibodies and actin is labelled with phalloidin. To ascertain Grb2 localisation, infected HeLa cells stably expressing GFP-Grb2 and transiently expressing LifeAct iRFP were imaged live. Scale bar = 2 μm. (B) C-terminal amino acid sequence of the A36 -p14 hybrid in recombinant viruses showing the positions of phosphotyrosine motifs in their wild-type (p14 N-G) and swapped (p14 G-N) configurations. (C) Representative immunofluorescence images of actin tails in HeLa cells infected with the indicated virus at 8 hr post-infection. Actin is stained with phalloidin, and extra-cellular virus particles are using an anti-B5 antibody. Scale bar = 3 μm. The graphs show quantification of number of extracellular virus particles inducing actin tails and their length. 336 actin tails were measured in four independent experiments. (D) Temporal colour-coded representation of time-lapse movies tracking the motility of the indicated RFP-A3-labelled virus over 50 s at 8 hr post infection (Video 2). Images were recorded every second and the position of virus particles at frame 1 (yellow triangles) and frame 50 (red triangles) are indicated. Scale bar = 3 μm. The graph shows quantification of virus speed over 50 s. Seventy-five virus particles were tracked in three independent experiments. (E) Representative images and quantification of plaque diameter produced by the indicated virus in confluent BS-C-1 cells 72 hr post-infection. Seventy-two plaques were measured in three independent experiments. Scale bar = 3 mm. All error bars represent S.D and the distribution of the data from each experiment is shown using a ‘SuperPlot’. Welch’s t test was used to determine statistical significance; ns, p>0.05; * p≤0.05; ** p≤0.01.
-
Figure 4—source data 1
Datasheets for graphs and summary statistics.
- https://cdn.elifesciences.org/articles/74655/elife-74655-fig4-data1-v2.zip
Figure 4—figure supplement 1
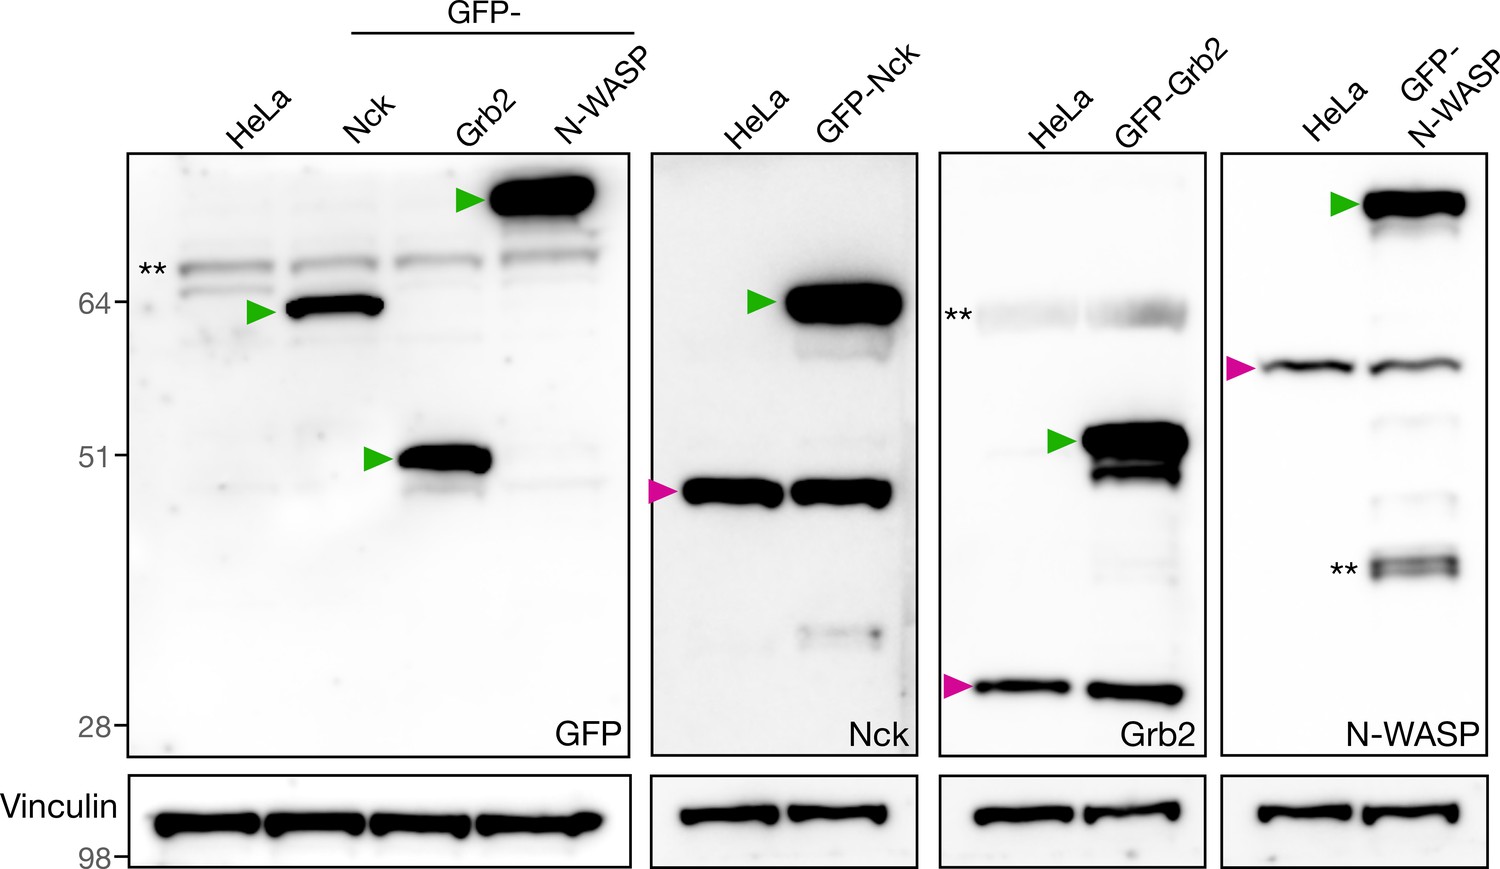
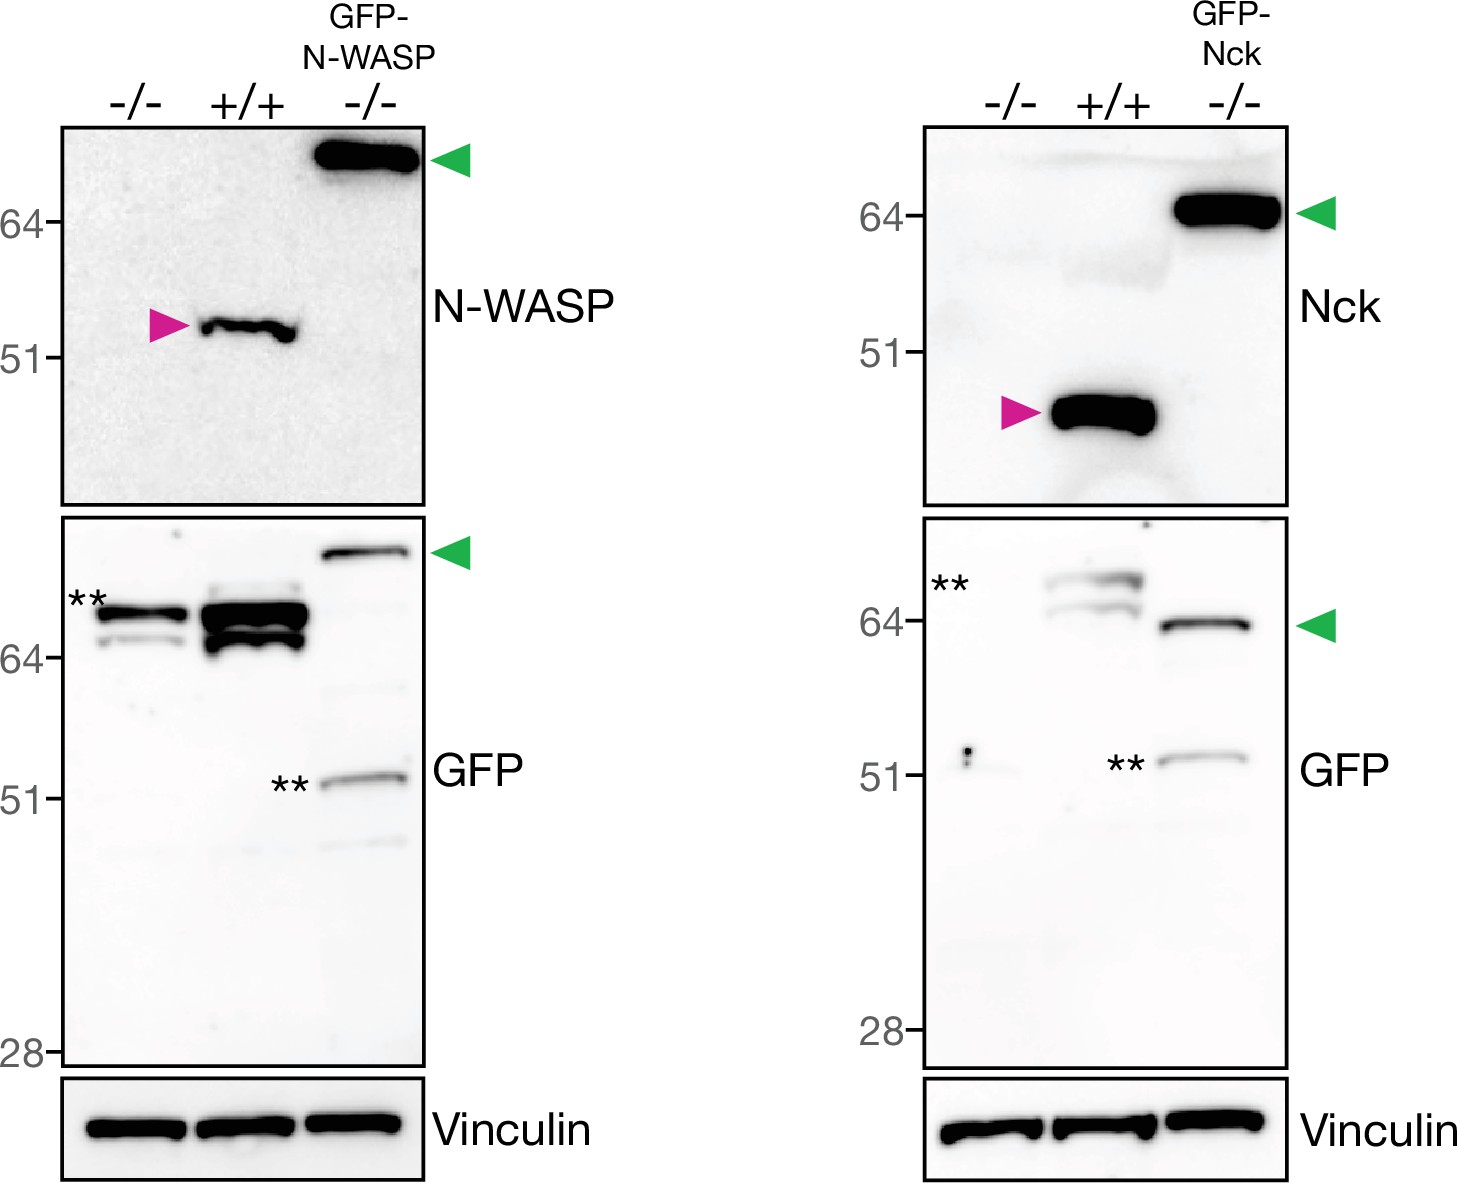
Validation of stable cell lines by immunoblot.
Immunoblot analyses of total cell lysates from HeLa cell lines stably expressing GFP-Nck, GFP-Grb2 or GFP-N-WASP with the indicated antibodies. The green and magenta triangles indicate the GFP-tagged and endogenous proteins respectively. ** denotes non-specific bands.
-
Figure 4—figure supplement 1—source data 1
Raw immunoblots.
- https://cdn.elifesciences.org/articles/74655/elife-74655-fig4-figsupp1-data1-v2.zip
Figure 5 with 2 supplements
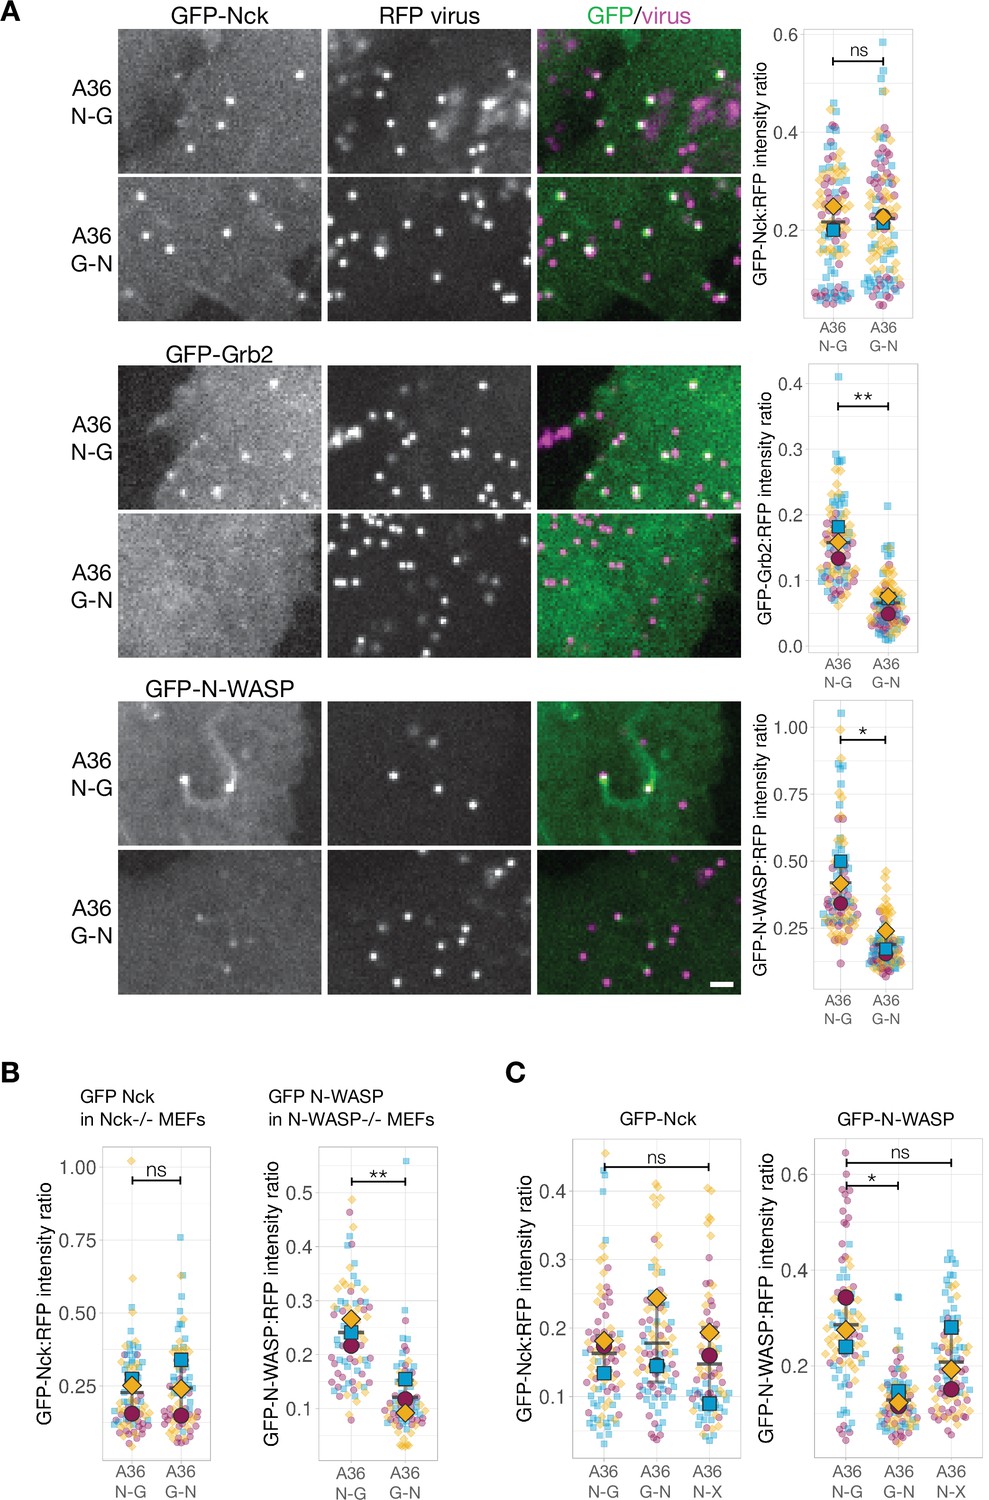
N-WASP recruitment is impaired when Grb2 binding is repositioned in A36.
(A) Representative images showing the indicated GFP-tagged protein recruitment to RFP-A3 labelled virus particles in live HeLa cells infected with the indicated viruses at 8 hr post-infection. Scale bar = 2 μm. The graphs show quantification of GFP:RFP-A3 fluorescence intensity ratio. Intensity of 90 virus particles was measured in three independent experiments. (B) Left - The graph shows quantification of GFP-Nck:RFP-A3 fluorescence intensity ratio on virus particles in live mouse embryonic fibroblasts (MEFs) lacking both Nck1 and Nck2 and stably expressing GFP-Nck1 at 16 hr post-infection. Intensity of 75 virus particles was measured in three independent experiments. Right - The graph shows quantification of GFP-N-WASP:RFP-A3 fluorescence intensity ratio on virus particles in live N-WASP-/- MEFs stably expressing GFP-N-WASP infected with the indicated viruses at 16 hr post-infection. Intensity of 75 virus particles was measured in three independent experiments. (C) The graphs show quantification of GFP:RFP-A3 fluorescence intensity ratio on virus particles in live HeLa cells stably expressing the indicated GFP-tagged protein infected with the A36 N-G, G-N, or N-X viruses at 8 hr post-infection. Intensity of 90 virus particles was measured in three independent experiments. All error bars represent S.D and the distribution of the data from each experiment is shown using a ‘SuperPlot’. Dunnett’s multiple comparison’s test (for panel C) or Welch’s t test (remaining panels) were used to determine statistical significance; ns, p>0.05; * p≤0.05; ** p≤0.01.
-
Figure 5—source data 1
Datasheets for graphs and summary statistics.
- https://cdn.elifesciences.org/articles/74655/elife-74655-fig5-data1-v2.zip
Figure 5—figure supplement 1

Fluorescence intensity measurements of Vaccinia recombinants.
(A) The graphs show quantification of RFP-A3 intensity on virus particles in different recombinants (left) and HeLa cell lines (right) measured in live cells at 8 hr post-infection. These datasets correspond to Figure 5A. Intensity of 90 virus particles was measured in three independent experiments. (B) Left - A schematic showing the A36 variant expressed in each recombinant virus. The Nck-binding motif is indicated in orange, the Grb2-binding motif in purple and TagGFP2 in green. Middle - Representative images of TagGFP2 and RFP-A3 labeled virus particles in live HeLa cells stably expressing LifeAct iRFP infected with the indicated viruses recorded 8 hr post-infection. All virus particles are marked with an RFP tag fused to a viral core protein A3. Scale bar = 2 μm. Right - The graph shows quantification TagGFP2:RFP fluorescence intensity ratios at the tip of actin tails. Intensity of 95 virus particles was measured in three independent experiments. (C) Representative images showing GFP-WIP recruitment to RFP-A3-labelled virus particles in live HeLa cells infected with the indicated viruses recorded 8 hr post-infection. Scale bar = 2 μm. The graph shows quantification of GFP-WIP:RFP-A3 fluorescence intensity ratio. Intensity of 90 virus particles was measured in three independent experiments. All error bars represent S.D and the distribution of the data from each experiment is shown using a ‘SuperPlot’. Dunnett’s multiple comparison’s test (for panel A right) or Welch’s t test (remaining panels) were used to determine statistical significance; ns, p>0.05; ** p≤0.01.
-
Figure 5—figure supplement 1—source data 1
Datasheets for graphs and summary statistics.
- https://cdn.elifesciences.org/articles/74655/elife-74655-fig5-figsupp1-data1-v2.zip
Figure 5—figure supplement 2
Verification of stable cell lines by immunoblot.
Immunoblot analyses of total cell lysates from N-WASP or Nck null MEFs with or without stable expression of their respective GFP-tagged version together with their parental wild-type cells. Immunoblot analyses was performed with the indicated antibodies. The green and magenta triangles indicate the GFP-tagged and endogenous proteins respectively. ** denotes non-specific bands.
-
Figure 5—figure supplement 2—source data 1
Raw immunoblots.
- https://cdn.elifesciences.org/articles/74655/elife-74655-fig5-figsupp2-data1-v2.zip
Figure 6 with 1 supplement
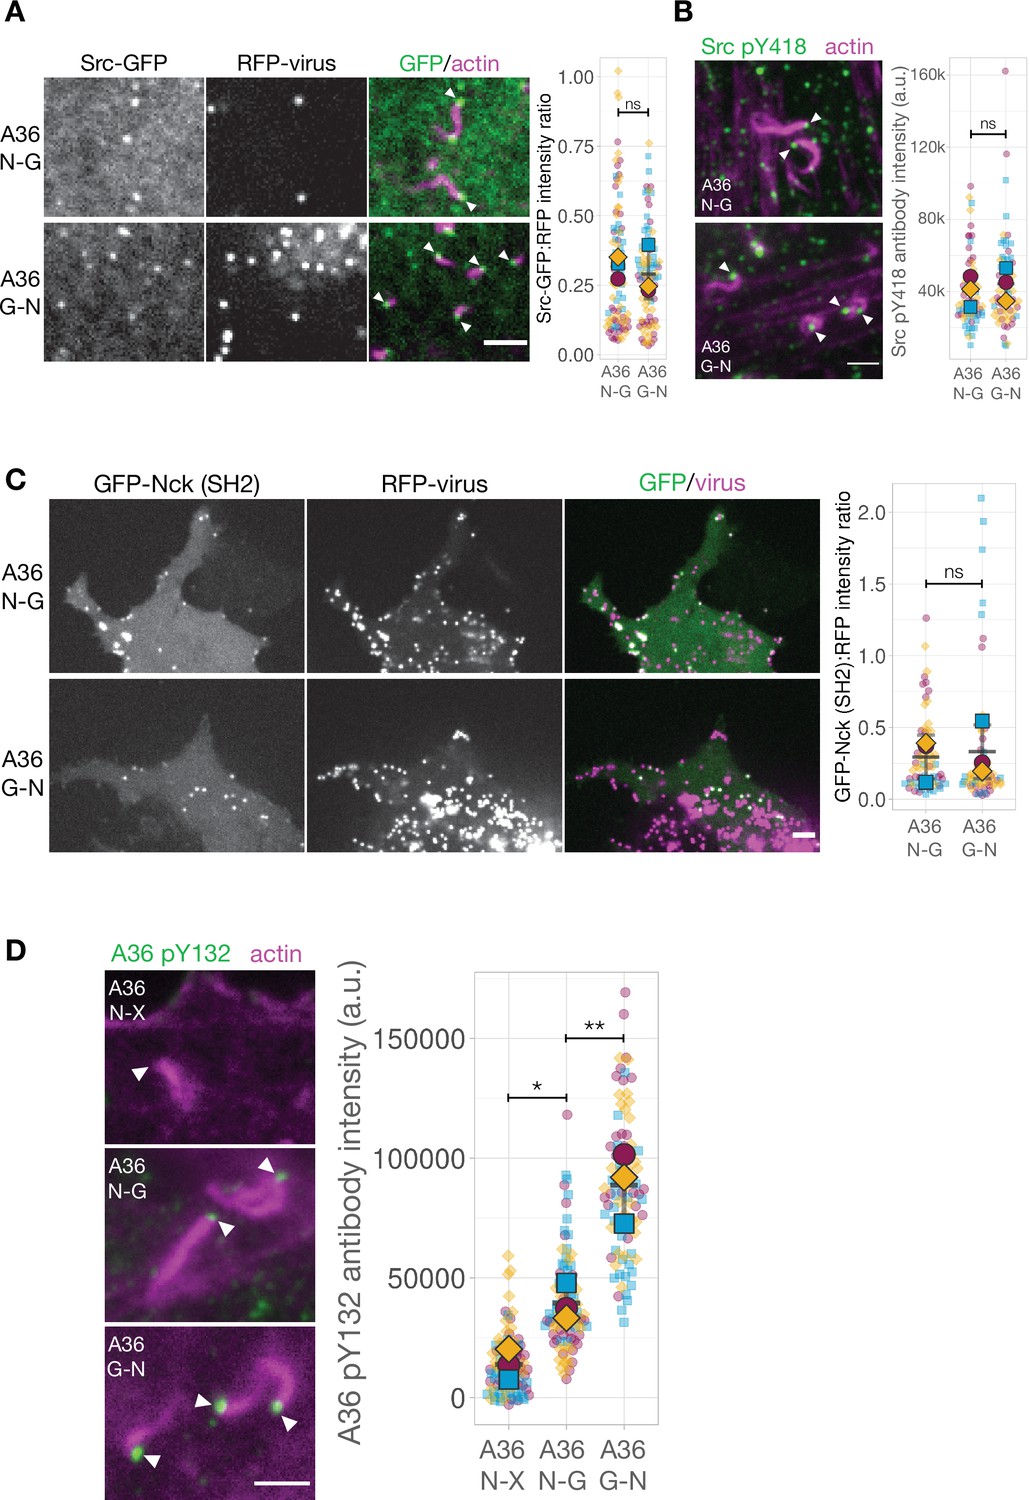
The Nck and Grb2-binding sites in A36 are phosphorylated when motif positions are changed.
(A) Representative images showing Src-GFP recruitment to RFP-A3 labelled virus particles in live HeLa cells infected with the indicated viruses at 8 hr post-infection. Scale bar = 4 μm. The graphs show quantification of GFP:RFP-A3 fluorescence intensity ratio. Intensity of 90 virus particles was measured in three independent experiments. (B) Representative immunofluorescence images of Src pY418 antibody labelling of indicated virus inducing actin tails in HeLa cells at 8 hr post-infection. Actin is stained with phalloidin. Scale bar = 2 μm. The graph shows quantification of background-subtracted antibody intensity at the tip of actin tails (k=1000 a.u.). Intensity of 75 virus particles was measured in three independent experiments.(C) Representative images showing GFP-Nck (SH2) recruitment to RFP-A3-labelled virus particles in live Nck-/- MEF cells infected with the indicated viruses at 16 hr post-infection. Scale bar = 2 μm. The graphs show quantification of GFP:RFP-A3 fluorescence intensity ratio. Intensity of 75 virus particles was measured in three independent experiments. (D) Representative immunofluorescence images of A36 pY132 antibody labelling of indicated virus inducing actin tails in HeLa cells at 8 hr post-infection. Actin is stained with phalloidin. A36 N-X is a virus where the A36 Grb2-binding site is disrupted with by Tyr to Phe point mutation. Scale bar = 2 μm. The graph shows quantification of background-subtracted antibody intensity at the tip of actin tails. Intensity of 90 virus particles was measured in three independent experiments. All error bars represent S.D. and the distribution of the data from each experiment is shown using a ‘SuperPlot’. Tukey’s multiple comparison’s test (for panel D) and Welch’s t test (remaining panels) were used to determine statistical significance; ns, p>0.05; * p≤0.05; ** p≤0.01. White arrowheads indicate virus position.
-
Figure 6—source data 1
Datasheets for graphs and summary statistics.
- https://cdn.elifesciences.org/articles/74655/elife-74655-fig6-data1-v2.zip
Figure 6—figure supplement 1
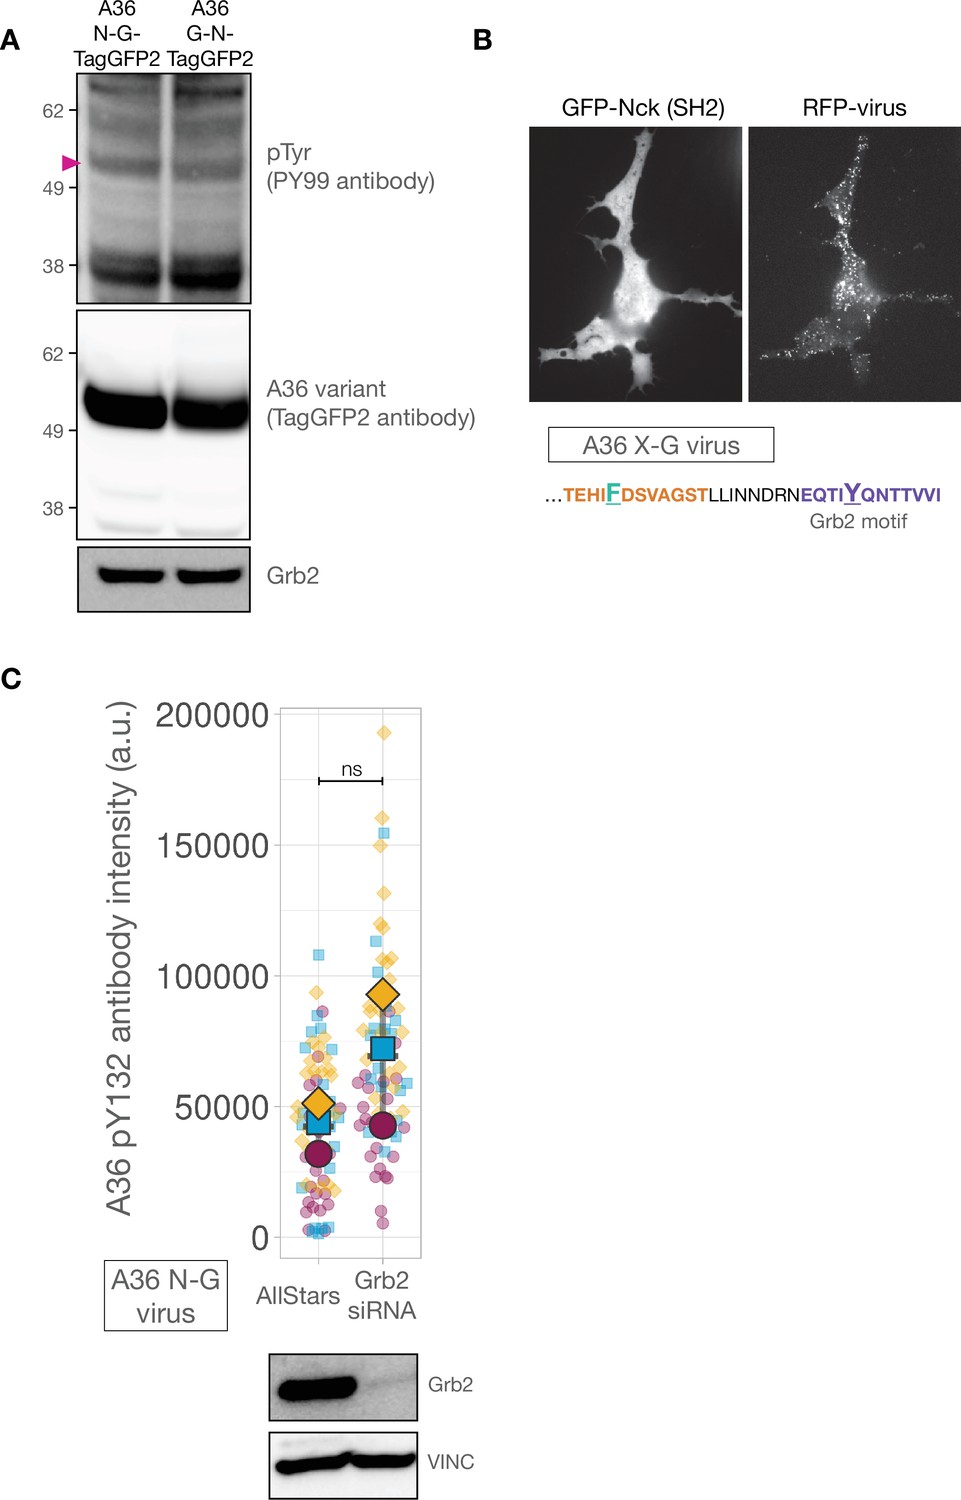
The Nck and Grb2-binding sites in A36 are phosphorylated when motif positions are changed.
(A) Immunoblot analyses of whole-cell lysates from HeLa cell lines infected with A36 N-G-TagGFP2 or A36 G-N-TagGFP2 viruses at 9 hr post-infection probed with the indicated antibodies. The magenta triangle indicates the band size of the expressed A36 variant. (B) Representative images showing transiently expressed GFP-Nck (SH2) and RFP-A3 on virus particles in live Nck-/- MEF cells infected with the A36 X-G virus recorded 16 hr post-infection. (C) Quantification of background-subtracted A36 pY132 antibody intensity in HeLa cells infected with the A36 N-G virus and treated with indicated siRNA. On the right a representative immunoblot from one of three experimental repeats is shown. Vinculin levels were used as a loading control. Intensity of 75 virus particles was measured in three independent experiments.
-
Figure 6—figure supplement 1—source data 1
Datasheets for graphs, summary statistics, and raw immunoblots.
- https://cdn.elifesciences.org/articles/74655/elife-74655-fig6-figsupp1-data1-v2.zip
Figure 7 with 2 supplements
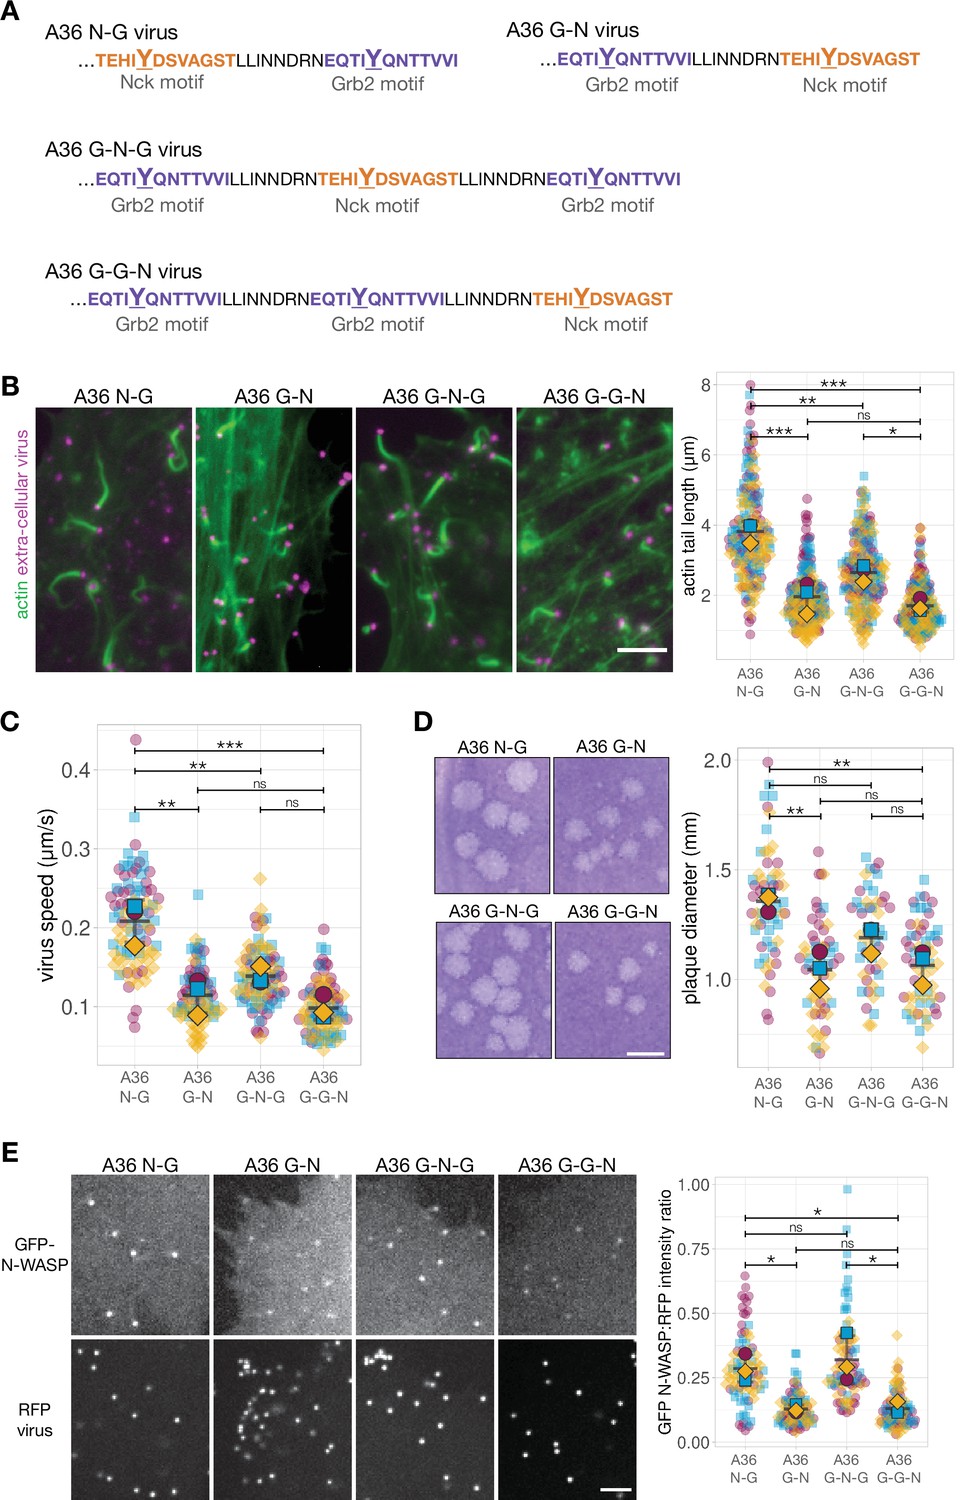
Signalling output can be improved by adding a new Grb2 binding site, but only in a position-dependent fashion.
(A) C-terminal amino acid sequence of A36 in recombinant viruses showing the position of phosphotyrosine motifs in wild-type (A36 N-G) and swapped (A36 G-N) configurations and with a new Grb2-binding site C-terminal (G–N–G) or N-terminal (G–G–N) to the swapped configuration. (B) Representative immunofluorescence images of actin tails in HeLa cells infected with the indicated virus at 8 hr post-infection. Actin is stained with phalloidin, and extra-cellular virus particles are labelled using an anti-B5 antibody. Scale bar = 5 μm. The graph shows quantification of actin tail length. 195 actin tails were measured in three independent experiments. (C) The graph shows quantification of virus speed from time-lapse movies tracking the motility of the indicated RFP-A3-labelled virus over 50 s at 8 hr post infection. Ninety virus particles were tracked in three independent experiments. (D) Representative images and quantification of plaque diameter produced by the indicated virus in confluent BS-C-1 cells 72 hr post-infection. Sixty plaques were measured in three independent experiments. Scale bar = 2 mm. (E) Representative images showing GFP-N-WASP and RFP-A3 intensity on virus particles in live HeLa cells infected with the indicated viruses recorded 8 hr post-infection. Scale bar = 4 μm. GFP N-WASP intensity data for A36 N-G and G-N viruses is the same as in Figure 5C. The graph shows quantification of GFP-N-WASP:RFP-A3 fluorescence intensity ratio. Intensity of 90 virus particles was measured in three independent experiments. All error bars represent S.D and the distribution of the data from each experiment is shown using a ‘SuperPlot’. Tukey’s multiple comparison test was used to determine statistical significance; ns, p>0.05; * p≤0.05; ** p≤0.01; *** p≤0.001.
-
Figure 7—source data 1
Datasheets for graphs and summary statistics.
- https://cdn.elifesciences.org/articles/74655/elife-74655-fig7-data1-v2.zip
Figure 7—figure supplement 1
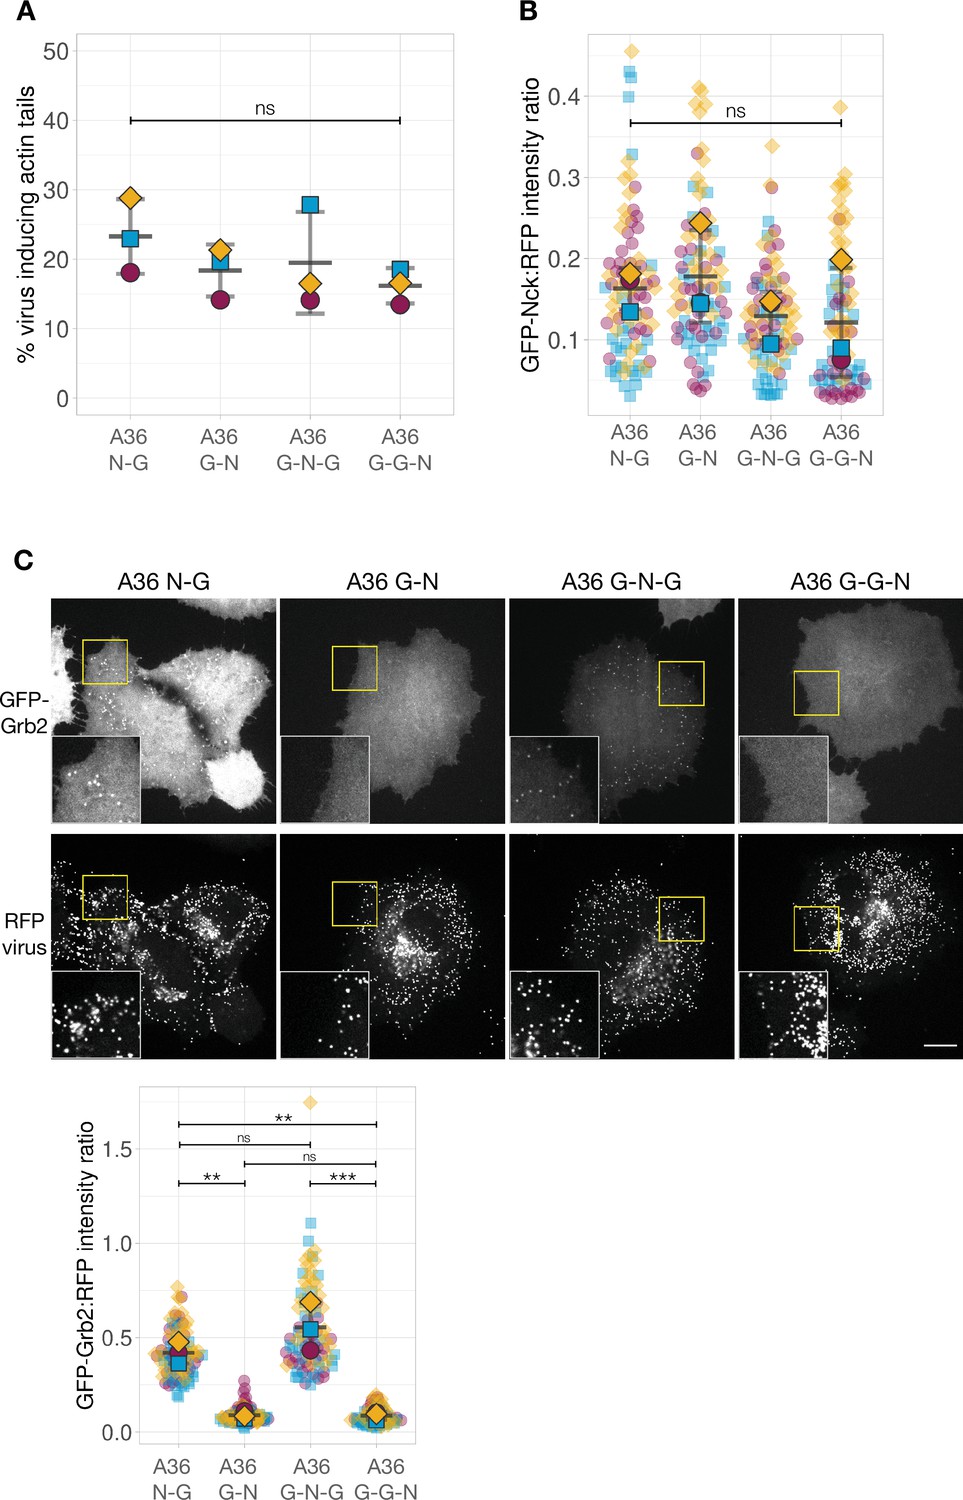
Quantification of the number of virus inducing actin tails and GFP-Nck recruitment in A36 variants with an extra Grb2-binding site.
(A) Quantification of number of extracellular virus particles inducing actin tails in the indicated viruses. (B) Quantification of the GFP-Nck:RFP-A3 fluorescence intensity ratio of virus particles in live HeLa cells infected with the indicated viruses at 8 hr post-infection. The data for A36 N-G and G-N viruses is the same as in Figure 5C. Intensity of 85 virus particles was measured in three independent experiments. (C) Representative images showing GFP-Grb2 and RFP-A3 intensity on virus particles in live HeLa cells infected with the indicated viruses recorded 8 hr post-infection. The insets show a ×2 magnification of the yellow boxed regions. Scale bar = 16 μm. The graph shows quantification of GFP-Grb2:RFP-A3 fluorescence intensity ratio. Intensity of 90 virus particles was measured in three independent experiments. All error bars represent S.D. and the distribution of the data from each experiment is shown using a ‘SuperPlot’. Tukey’s multiple comparison test was used to determine statistical significance; ns, p>0.05; ** p≤0.01; *** p≤0.001.
-
Figure 7—figure supplement 1—source data 1
Datasheets for graphs and summary statistics.
- https://cdn.elifesciences.org/articles/74655/elife-74655-fig7-figsupp1-data1-v2.zip
Figure 7—figure supplement 2
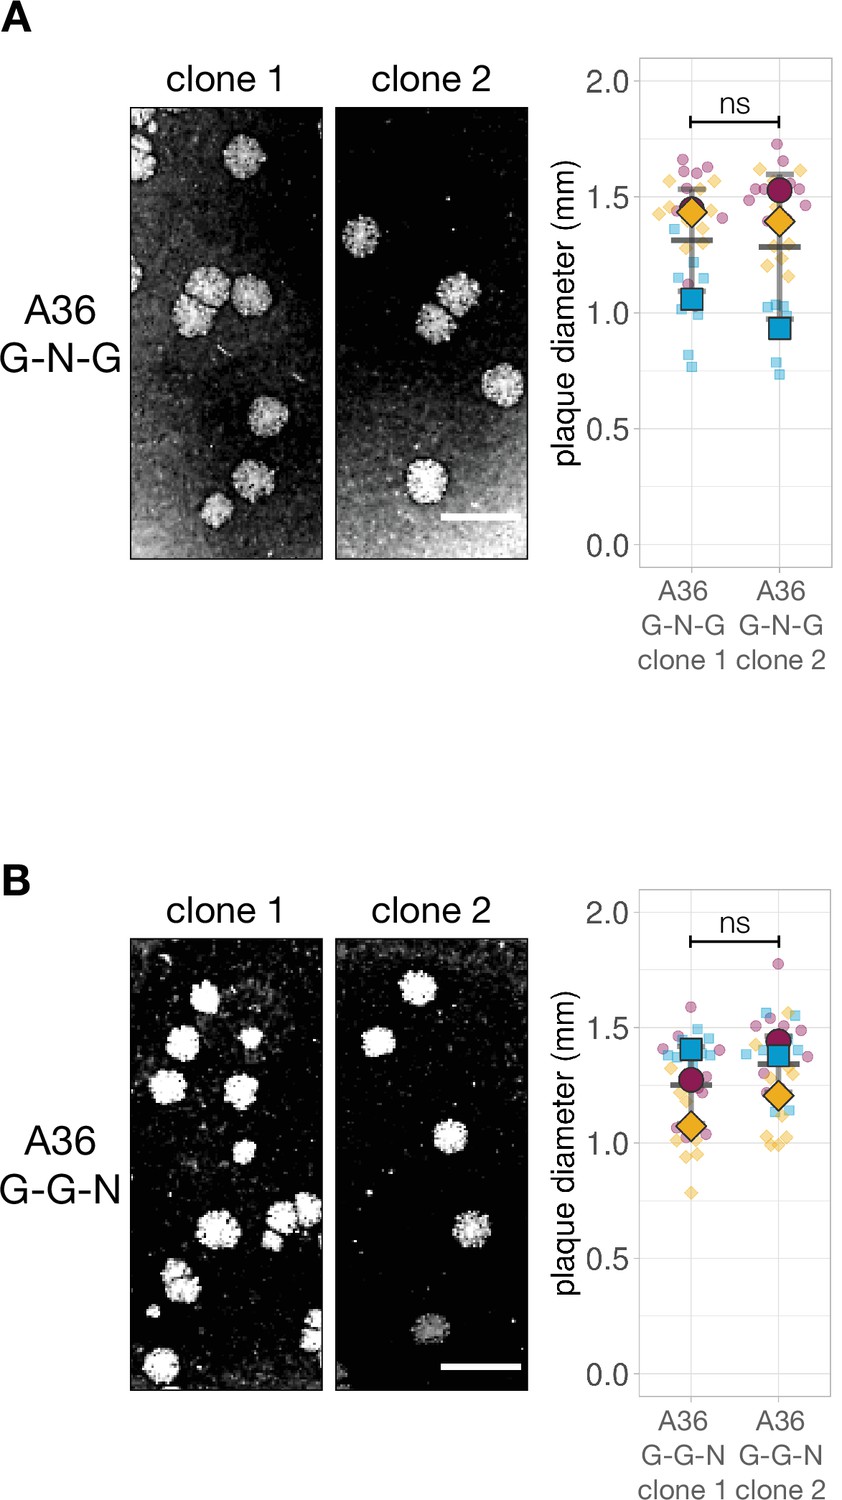
Characterisation of A36 G-N-G and A36 G-G-N recombinant viruses.
(A and B) Representative images and quantification of plaque diameter produced by two independent isolates of the indicated recombinant virus in confluent BS-C-1 cells 72 hr post-infection. Thirty plaques were measured in three independent experiments. Scale bar = 3 mm. Welch’s t test was used to determine statistical significance; ns, p>0.05.
-
Figure 7—figure supplement 2—source data 1
Datasheets for graphs and summary statistics.
- https://cdn.elifesciences.org/articles/74655/elife-74655-fig7-figsupp2-data1-v2.zip
Videos
Video 1
Phosphotyrosine motif position impacts actin-based motility of Vaccinia virus.
HeLa cells stably expressing LifeAct-iRFP670 (green) were infected with either the A36 N-G or A36 G-N virus labelled with RFP-A3 (magenta) for 8 hr. Images were taken every second. Video plays at 5 frames per second. The RFP-A3 signal was used to generate the temporal colour-coded representation in Figure 2C. The time in seconds is indicated, and the scale bar = 3 µm.
Video 2
Phosphotyrosine motif position impacts actin-based motility driven by p14 N-G virus.
HeLa cells stably expressing LifeAct-iRFP670 (green) were infected with either the p14 N-G or p14 G-N virus labelled with RFP-A3 (magenta) for 8 hr. Images were taken every second. Video plays at 5 frames per second. The RFP-A3 signal was used to generate the temporal colour-coded representation in Figure 4D. The time in seconds is indicated, and the scale bar = 3 µm.
Tables
Table 1
Primers.
| No. | Sequence | Construct(s) generated |
|---|---|---|
| AB004 | CCAGCAACACTATCGTAAATGTGTTCTGTATTACGATCATTATTTATTAGCAG | A36 N-N |
| AB007 | ACACATTTTCGATAGTGTTGCTGG | A36 X-G |
| AB008 | GCAACACTATCGAAAATGTGTTCTG | A36 X-G |
| AB009 | CAGACTATTTTTCAGAACACTACAGTAGTA | A36 N-X, A36 X-N, A36 X-X |
| AB010 | CTGTAGTGTTCTGAAAAATAGTCTGT | A36 N-X, A36 X-N, A36 X-X |
| AB105 | TCAGCCAGCACGAGTTCGAGGACCCCTACGAGCCCCCCAG | p14 N-G (Y96F) |
| AB106 | CTGGGGGGCTCGTAGGGGTCCTCGAACTCGTGCTGGCTGA | p14 N-G (Y96F) |
| AB107 | ACGAGTACGAGGACCCCTTCGAGCCCCCCAGCAGGAGGAA | p14 N-G (Y100F) |
| AB108 | TTCCTCCTGCTGGGGGGCTCGAAGGGGTCCTCGTACTCGT | p14 N-G (Y100F) |
| AB109 | CTACAGCACCTTCGTGAACATCGACAACGTGAGCGCCATC | p14 N-G (Y116F) and p14 N-G (Y96,116F) |
| AB110 | GCGCTCACGTTGTCGATGTTCACGAAGGTGCTGTAGGGG | p14 N-G (Y116F) and p14 N-G (Y96,116F) |
| AB040 | TACCGGACTCAGATCTCGAGATGAGCAAGGGCGAGGAGC | pLVX-GFP-Grb2 |
| AB057 | CGTCGACTGCAGAATTCTTACTAGACGTTCCGGTTCACGGGGG | pLVX-GFP-Grb2 |
| AB051 | CACCGCGGTGGCGGCCGCTCATCATAGCAT | A36 N-G, A36 G-N, A36 G-N-G, A36 G-G-N |
| AB052 | GGTCGACGGTATCGATAAGCTTTATCTATAGAGATAACAC | A36 N-G, A36 G-N, A36 G-N-G, A36 G-G-N, p14-N-G, p14 G-N, A36 G-G, A36 N-N |
| AB053 | TGATTAGTTTCCTTTTTATAAAATTGAAGTAATATTTAGT | A36 N-G, A36 G-N, A36 G-G |
| AB054 | ATAAAAAGGAAACTAATCACGTGCTTCCAGCAACACTAT | A36 G-N |
| AB055 | ATAAAAAGGAAACTAATCAAATTACTACTGTAGTGTTCTG | A36 N-G |
| AB087 | TATTTATCAGAACACTACAGTAGTAATTTGATTAGTTTCCTTTTTA | A36 G-N-G |
| AB088 | AGTGTTCTGATAAATAGTCTGTTCATTACGATCATTATTTATTAGCAGCGTGCTTCCAGCAACA | A36 G-N-G |
| AB089 | CTAATAAATAATGATCGTAATGAACAGACTATTTATCAGAAC | A36 G-G-N |
| AB090 | ATTACGATCATTATTTATTAGCAGAATTACTACTGTAGTGTTCTGATAAAT | A36 G-G-N |
| AB096 | AAACAATAAATATTGAACTAGTAGTACGTATATTGAGC | A36 N-G-TagGFP2, A36 G-N-TagGFP2, p14 N-G, p14 G-N, A36 N-N, A36 G-G |
| AB097 | TCCGGTGGCGACCGGTGGATCCGACCCCGACCCAATTACTACTGTAGTGTTCTGATAA | A36 N-G-TagGFP2 |
| AB098 | TCCGGTGGCGACCGGTGGATCCGACCCCGACCCCGTGCTTCCAGCAACACTATCGTAA | A36 G-N-TagGFP2 |
| AB099 | ACAGAACACATTTACGATAGTGTTGCTGGAAGCACGTGATTAGTTTCCTTTTTATAA | A36 N-N |
| AB104 | TATAAAAAGGAAACTAATCAAATTACTACTGTAGTGTTCTGATAAATAGTCTGTTCATTACGATC | A36 G-G |
| AB121 | AGGAACAGCTACAGGCTGAG | p14 N-G, p14 G-N |
| AB122 | CTCAGCCTGTAGCTGTTCCTCGCCATGACATTGGATT | p14 N-G, p14 G-N |
Additional files
Download links
A two-part list of links to download the article, or parts of the article, in various formats.
Downloads (link to download the article as PDF)
Open citations (links to open the citations from this article in various online reference manager services)
Cite this article (links to download the citations from this article in formats compatible with various reference manager tools)
The relative binding position of Nck and Grb2 adaptors impacts actin-based motility of Vaccinia virus
eLife 11:e74655.
https://doi.org/10.7554/eLife.74655


