High spatial resolution analysis using automated indentation mapping differentiates biomechanical properties of normal vs. degenerated articular cartilage in mice
- Biomedical Engineering Graduate Program, University of Calgary, Canada
- McCaig Institute for Bone and Joint Health, University of Calgary, Canada
- Human Performance Laboratory, Faculty of Kinesiology, University of Calgary, Canada
- Department of Surgery, Cumming School of Medicine, University of Calgary, Canada
- Department of Cell Biology and Anatomy, Cumming School of Medicine, University of Calgary, Canada
Figures
Figure 1 with 1 supplement
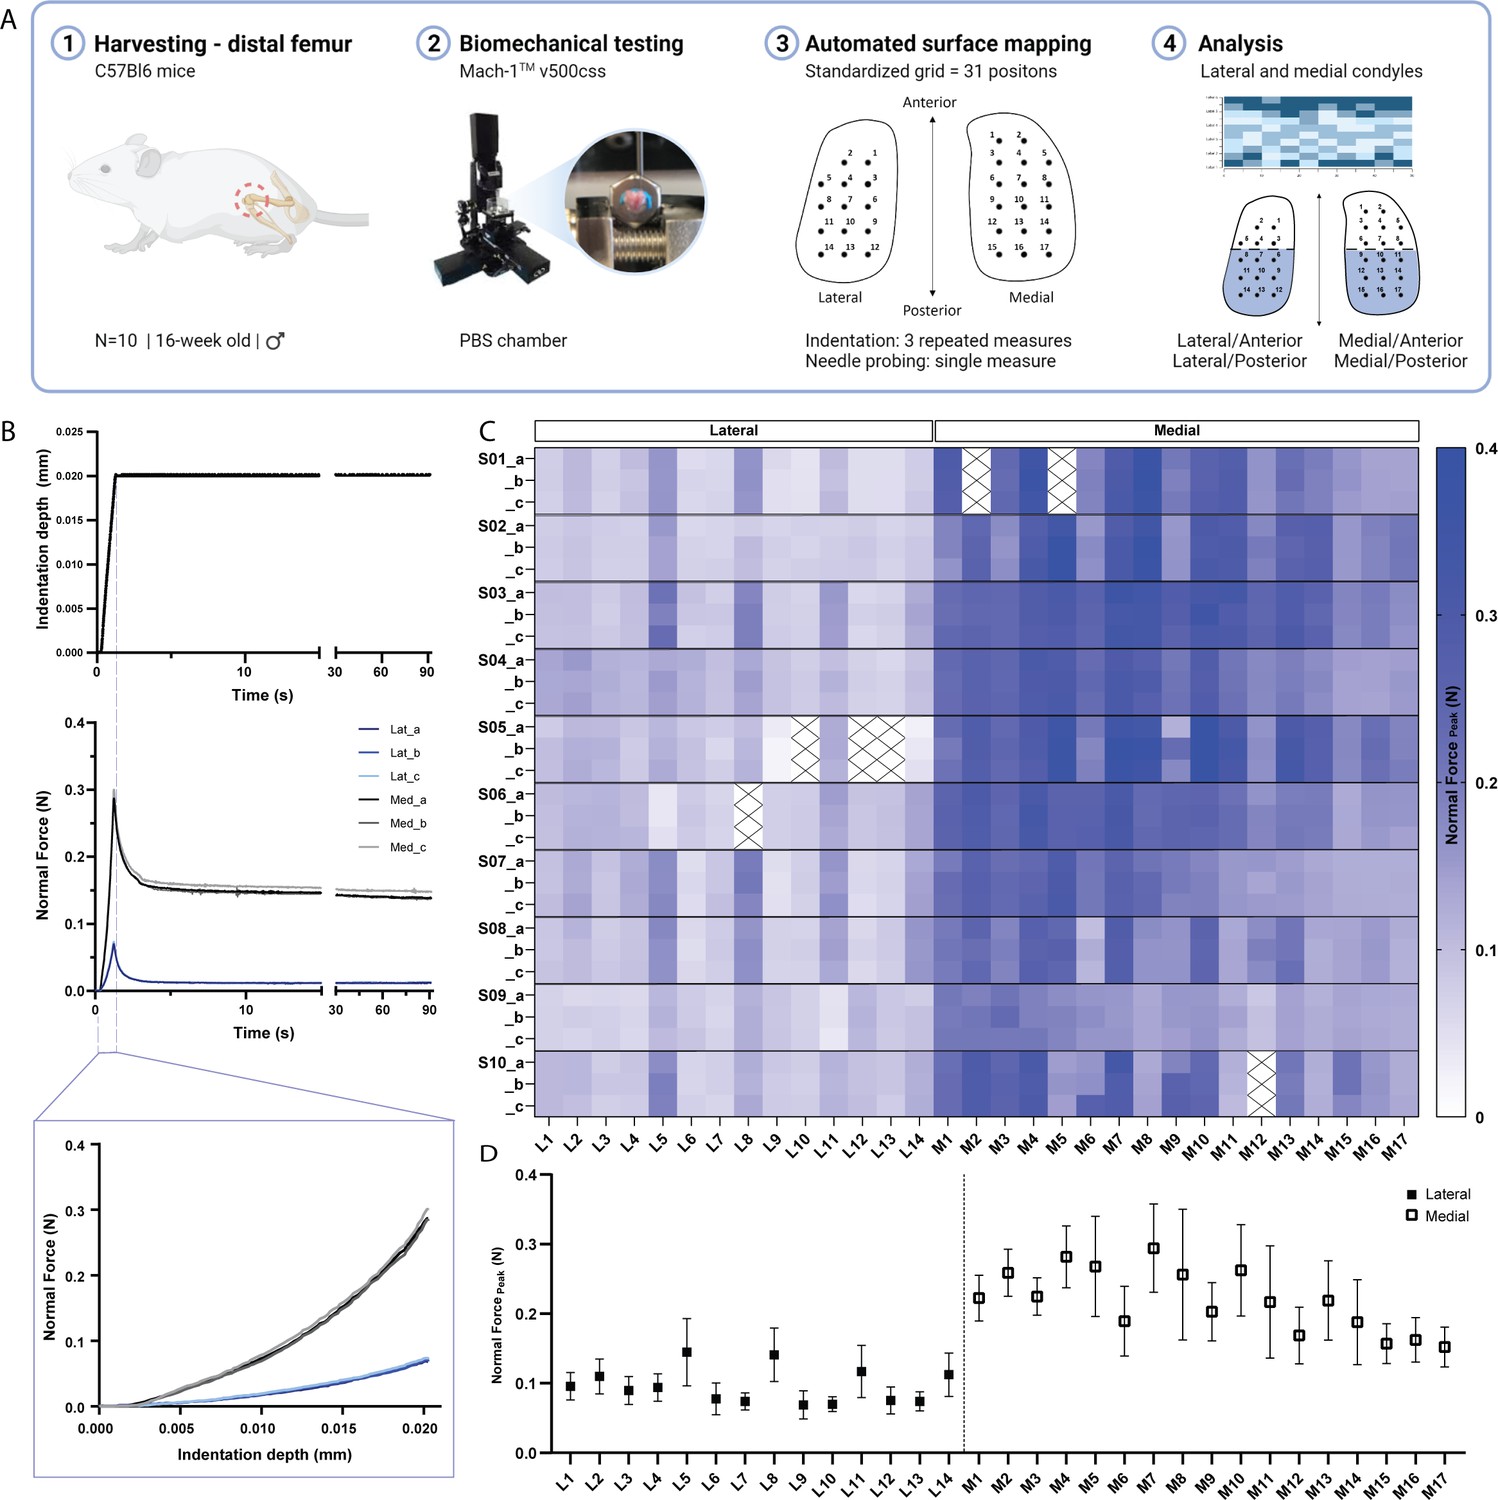
Indentation mapping of murine articular cartilage.
(A) Schematic overview of experimental design employed for biomechanical testing of murine articular cartilage using Mach-1 v500css mechanical tester. (B) Step displacement used for cartilage indentation (top), with typical force-relaxation response curves obtained for three repeated measures on representative lateral and medial condyle positions (middle) and corresponding force increase with indentation depth (bottom). (C) Normal peak force recorded for all three repeated measures (A-C), considering each of the 31 testing sites, L1-L14 at lateral condyle and M1-M17 at medial condyle, for each specimen (n=10), (S01–S10), demonstrates general agreement for intra-specimen measurements on both condyles. (D) Mean peak force values varied within and between condyle locations and higher within medial condyle testing sites. Data is presented as mean ± SD.
Figure 1—figure supplement 1
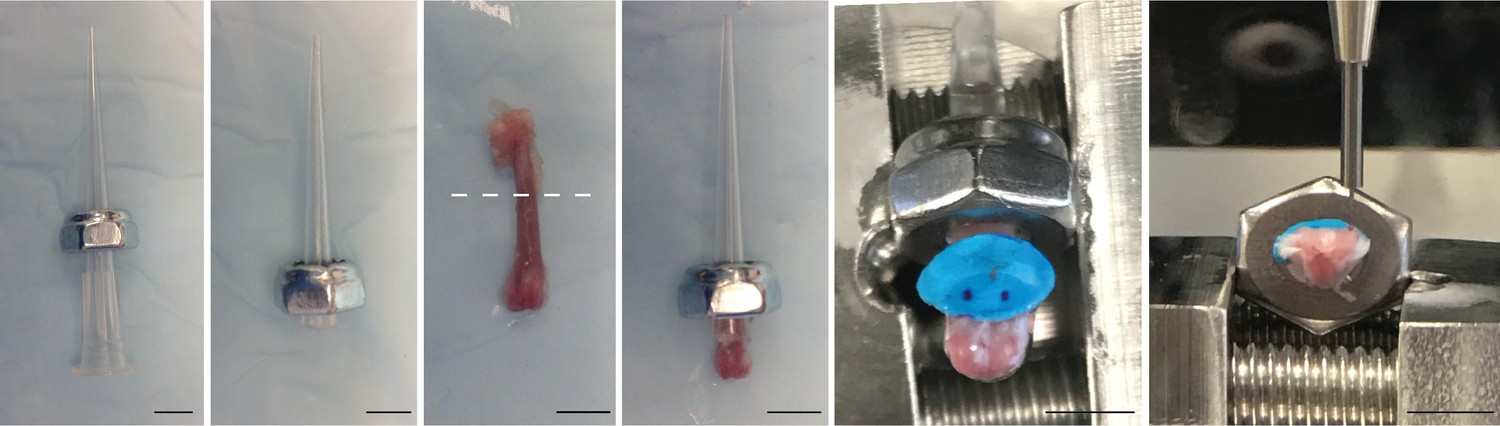
Specimen preparation and assemble to sample holder for automated indentation mapping using custom setup, allowing for repositioning of the sample and non-destructive retrieval for three-dimensional x-ray microscopy imaging (scale bars equal to 4 mm).
Figure 2 with 2 supplements
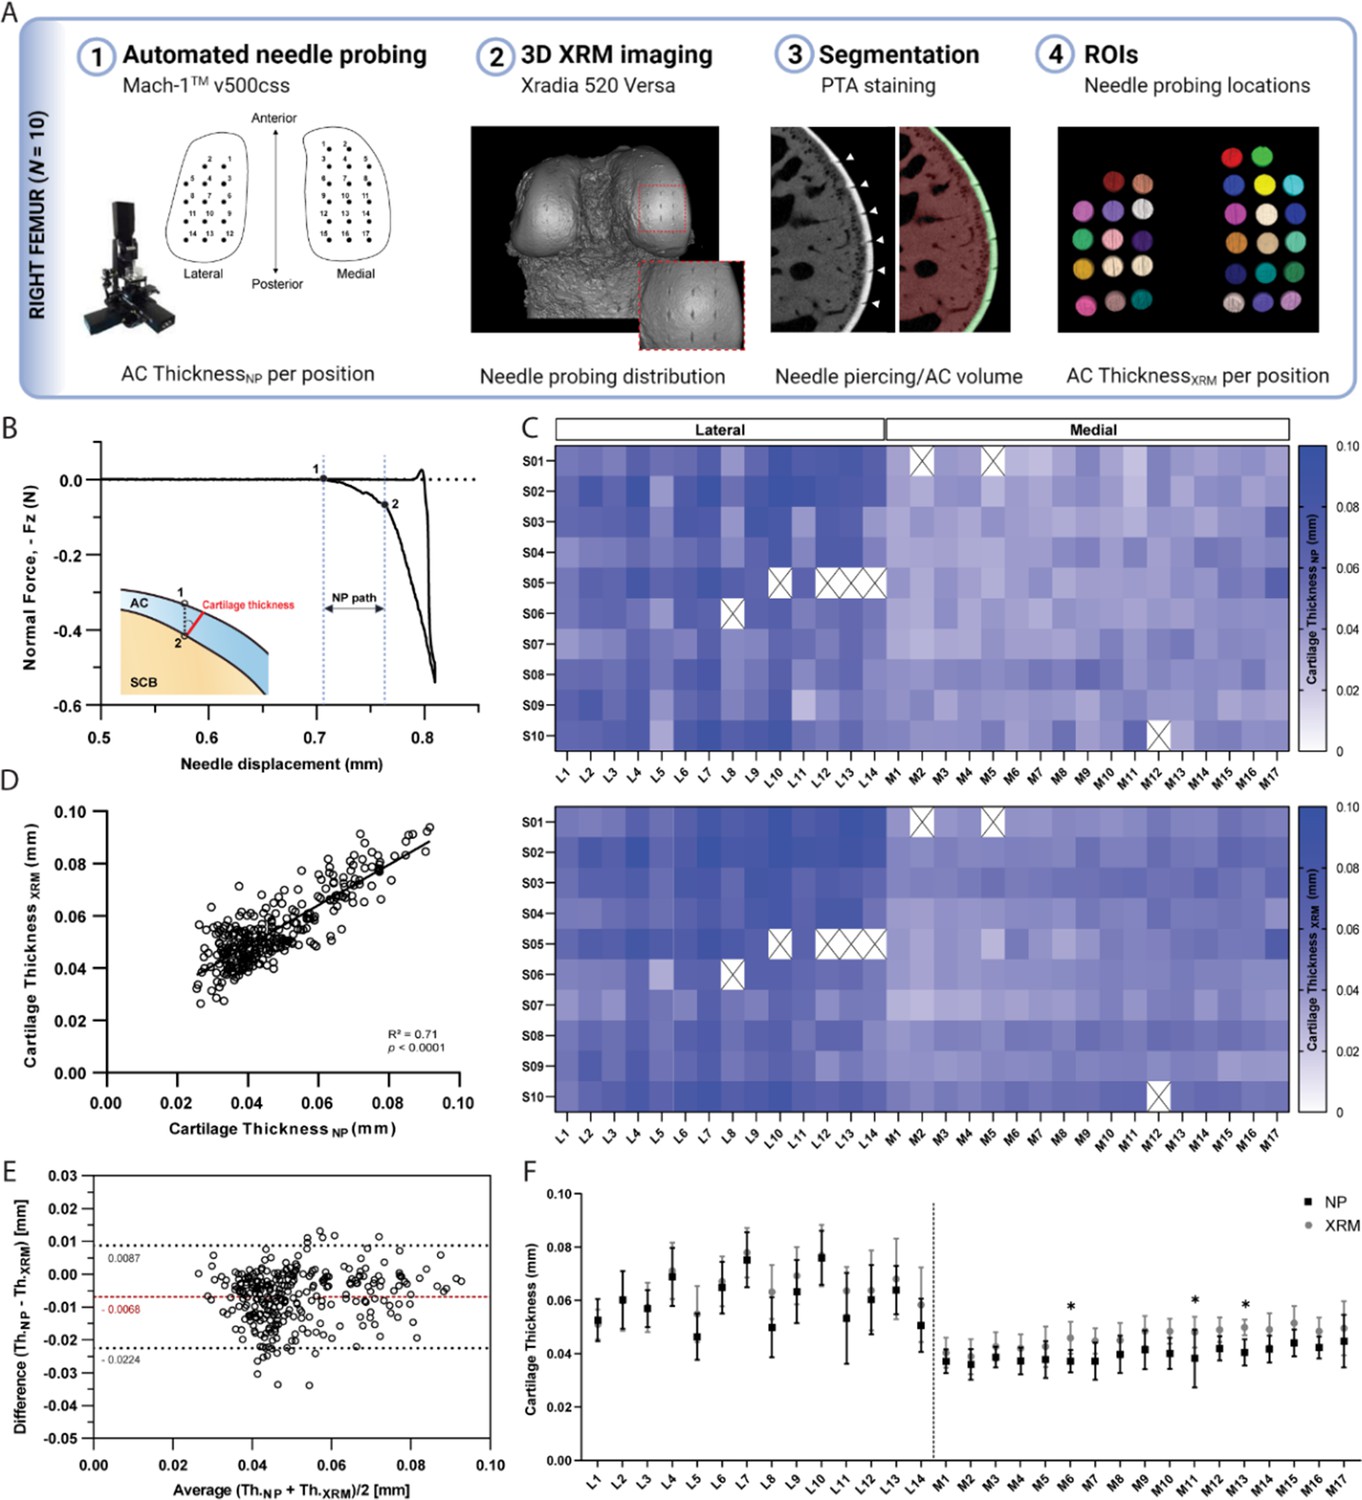
Thickness mapping of murine articular cartilage.
(A) Assessment of agreement between needle probing (NP) and x-ray microscopy (XRM) imaging cartilage thickness per position of measurement within right femoral condyles (n=10). (B) Representative normal force-displacement curve obtained during NP test depicting articular cartilage (AC) surface (1) and subchondral bone interface (2) positions and cartilage thickness calculated normal to the surface (red) using the surface angle orientation. (C) Mapping distributions of cartilage thickness values per position as measured by NP and XRM. (D) Correlation graph of cartilage thickness measured by NP vs. XRM, R=0.842, n=302, p<0.0001, and corresponding (E) Bland-Altman plot showing overall agreement between methods, with average difference of 6.8 µm in thickness. Dotted black lines show upper and lower 95% limit of agreement. (F) Pairwise assessment of mean cartilage thickness NP vs. XRM per position for the lateral and medial condyles (* p<0.05, ** p<0.01, two-way ANOVA). Symbols represent the means and error bars the standard deviation.
-
Figure 2—source data 1
- https://cdn.elifesciences.org/articles/74664/elife-74664-fig2-data1-v2.zip
Figure 2—figure supplement 1
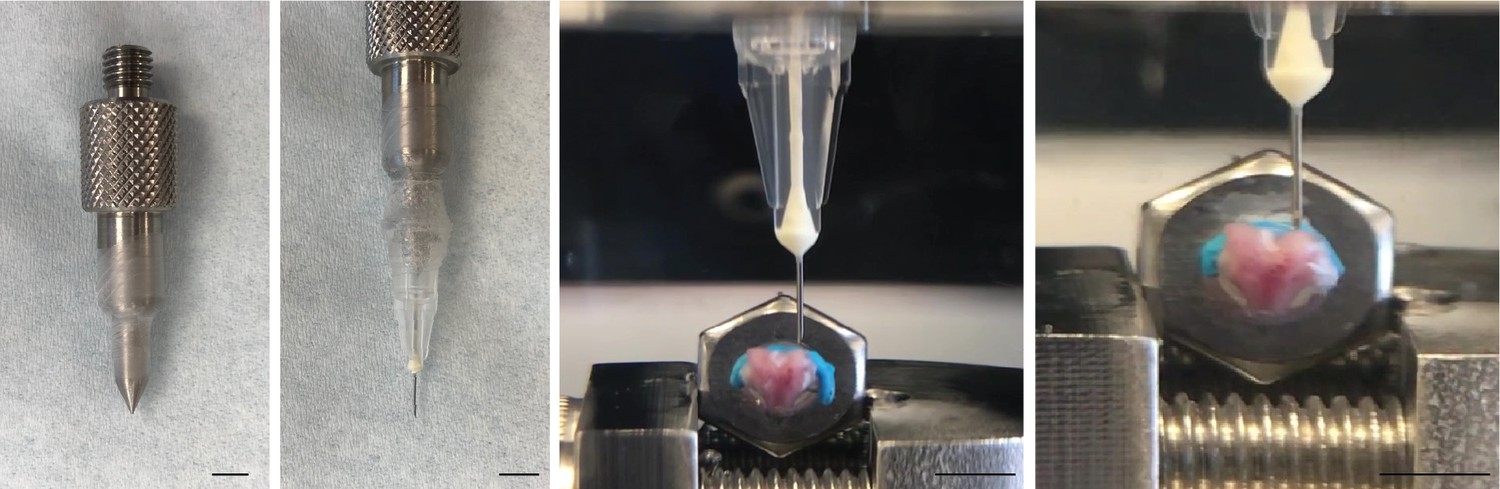
Setup for needle probing thickness measurement, using a 30G×1.4” hypodermic needle (TSK Laboratory, Japan) adapted to the 1-mm spherical indenter (Biomomentum Inc, Laval, QC)(scale bars equal to 4 mm).
Figure 2—figure supplement 2
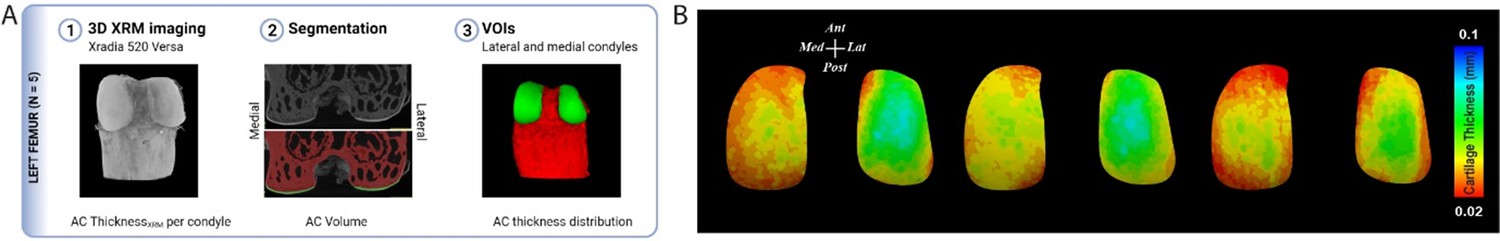
XRM imaging of femoral condyles.
(A) Three-dimensional phosphotungstic acid-x-ray microscopy (PTA-XRM) imaging and segmentation protocol of contralateral femoral condyles (n=5) that were not subjected to biomechanical testing. (B) Cartilage thickness distribution maps as measured by PTA-XRM imaging for three representative samples. AC: articular cartilage, VOIs: volumes of interest.
Figure 3
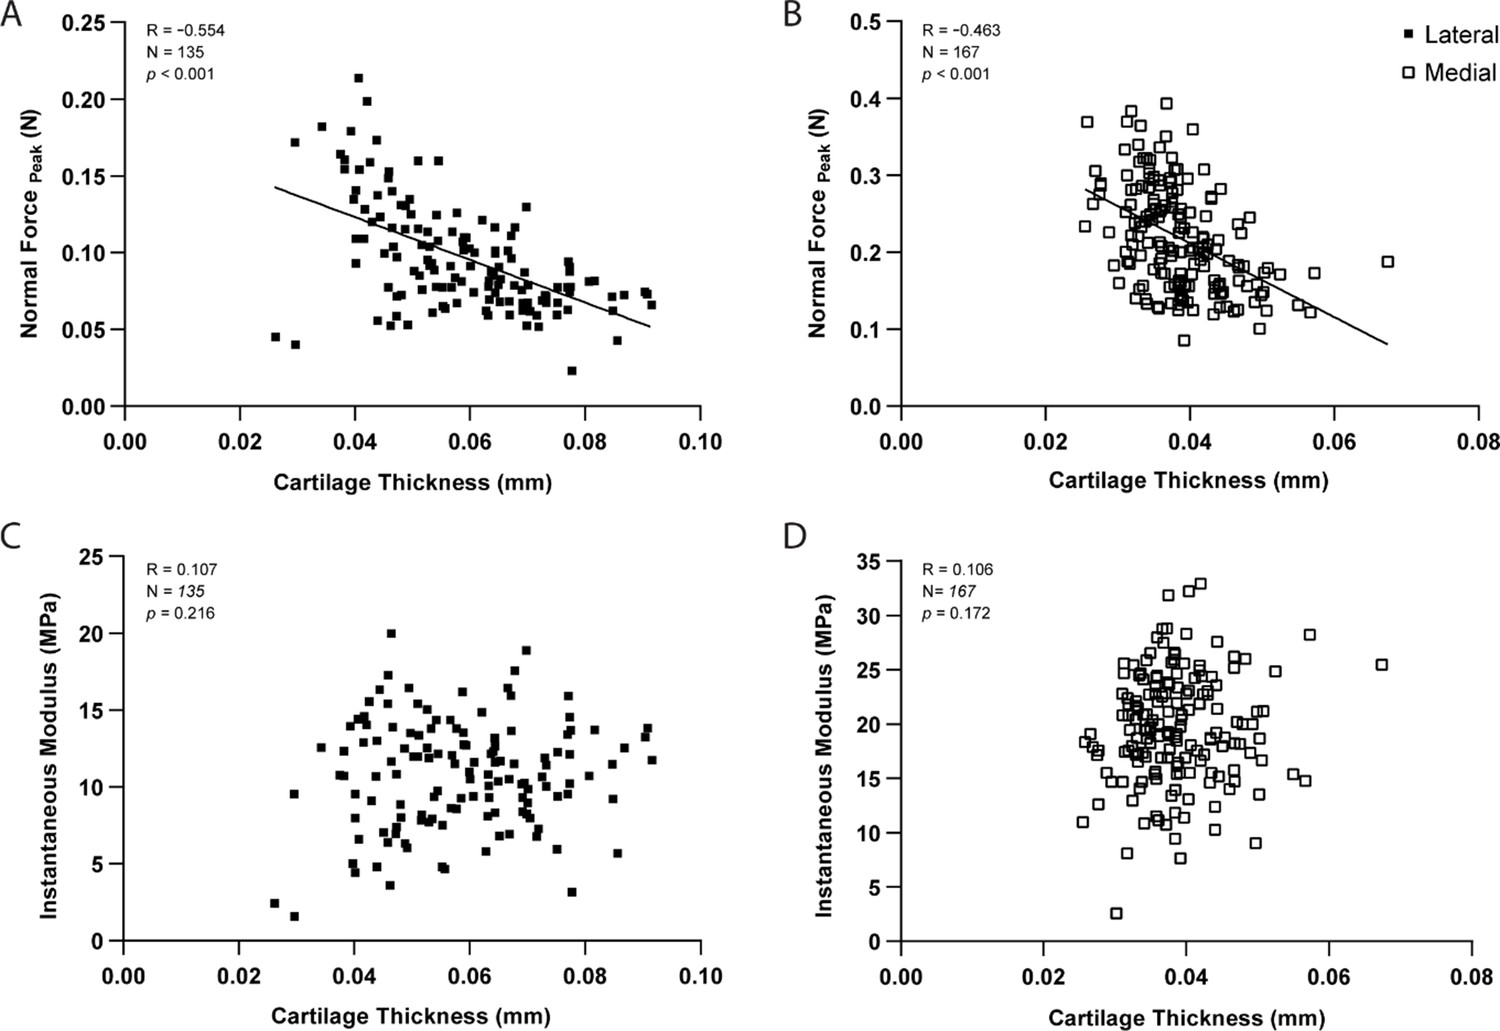
Correlation graphs per testing site for the lateral (n=135 positions) and medial (n=167) condyles, showing cartilage thickness (needle probing) is significantly correlated to peak indentation force at 20 μm (A–B), but not to instantaneous modulus values as determined by Hayes et al., 1972 elastic model at 20% strain.
Pearson Correlation performed and p-values reported.
Figure 4
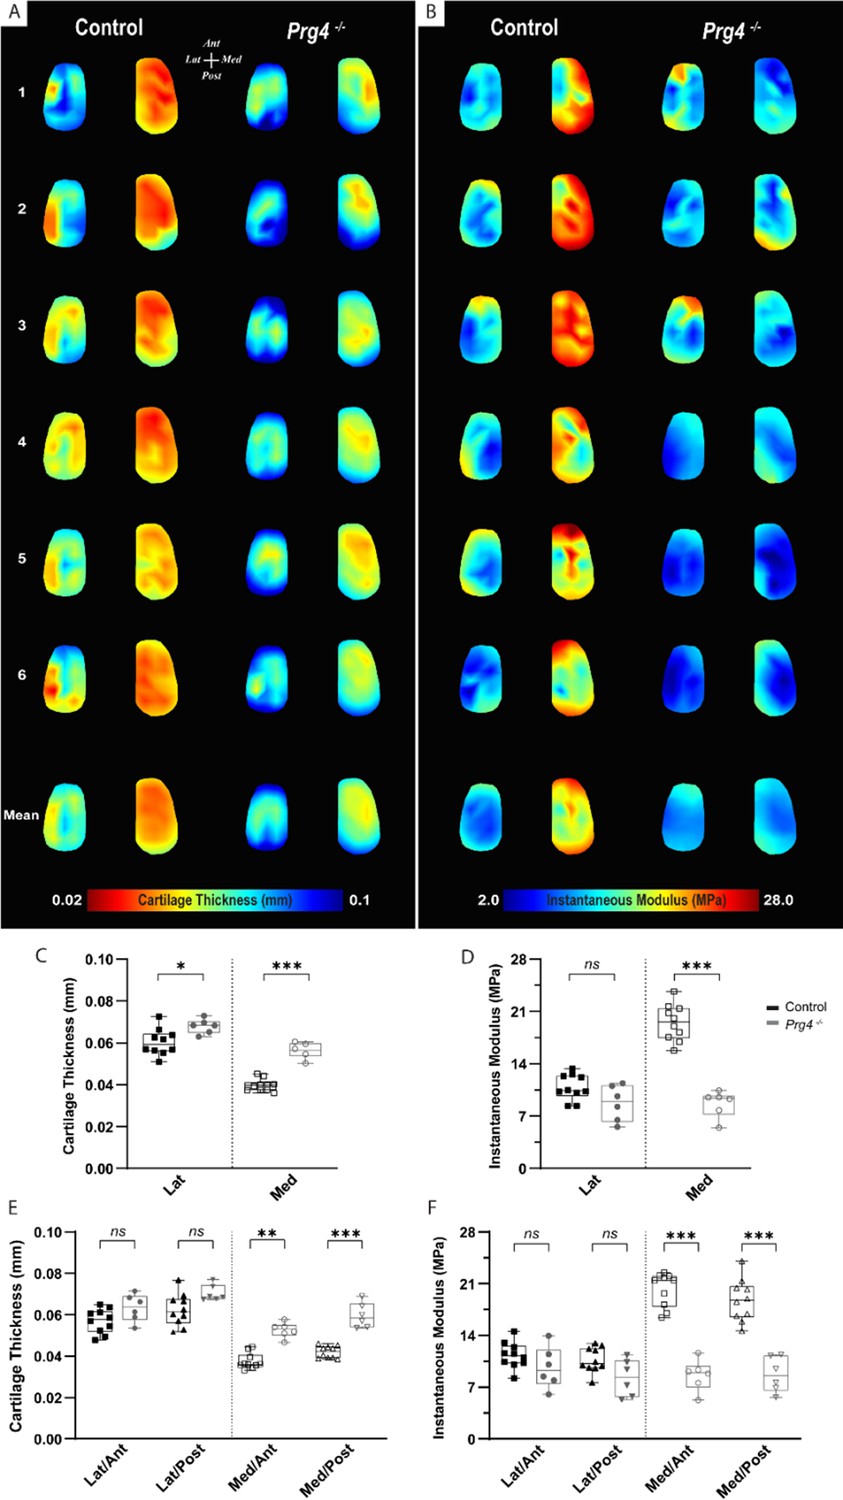
Altered biomechanical properties in degenerated murine articular cartilage.
(A–B) Heat maps and corresponding boxplots comparing (C–D) regions - lateral and medial - and their (E–F) sub-regions - Lat/Ant, Lat/Post, Med/Ant, Med/Post - highlight spatial differences in biomechanical parameters on femoral cartilage surface between controls (C57Bl/6, n=10) and PRG4 knockout mice (Prg4−/−, n=6). Maps shown for six representative samples per genotype, as well as the corresponding averaged map of all samples. Parameters illustrated are thickness measured by needle probing (A, C, E) and instantaneous modulus as determined by Hayes et al., 1972 elastic model (B, D, F). Pairwise comparison between genotypes for mean values on the lateral and medial condyles and anteroposterior sub-regions (Mann-Whitney U with Bonferroni-Dunn correction, *p<0.05, **p<0.01, ***p<0.001).
-
Figure 4—source data 1
Instantaneous modulus used to generate data in Figure 4.
- https://cdn.elifesciences.org/articles/74664/elife-74664-fig4-data1-v2.zip
Author response image 1
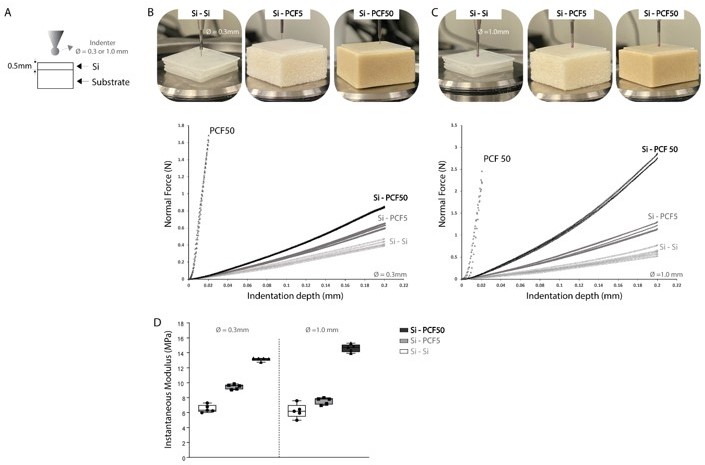
(A) Indentation protocol for substrate effect testing, at an indentation rate of 0.1mm/s, at a maximum 40% strain. Silicone samples of 0.5 mm thickness were attached to synthetic bone analogs of different moduli – PCF5 and PCF50 (Sawbone, Sweden) and indentation response across five adjacent sites was evaluated using the load-displacement curves for a (B) 0.3mm indenter and (C) 1.0mm indenter testing and (D) instantaneous elastic modulus as determined by Hayes et al. (1972) elastic model at 20% strain.
Author response image 2
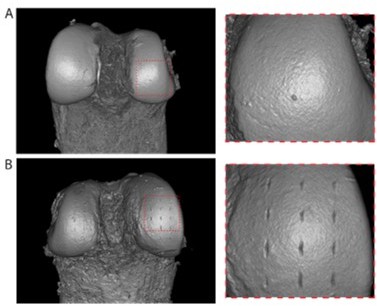
Representative 3D PTA-XRM volume renderings of distal femoral condyles subjected to indentation testing (A) and indentation followed by needle probing (B).
Tables
Table 1
Mean peak force (:N) and coefficient of variation (CV:%) from triplicate measurements for each of the 31 positions (L1-M17) of assessment over mice femoral condyles.
| S01 | S02 | S03 | S04 | S05 | S06 | S07 | S08 | S09 | S10 | |||||||||||
|---|---|---|---|---|---|---|---|---|---|---|---|---|---|---|---|---|---|---|---|---|
| CV | CV | CV | CV | CV | CV | CV | CV | CV | CV | |||||||||||
| L1 | 0.08 | 2.9 | 0.08 | 3.0 | 0.10 | 4.1 | 0.13 | 1.8 | 0.09 | 12.1 | 0.10 | 2.7 | 0.10 | 4.9 | 0.09 | 3.3 | 0.07 | 1.5 | 0.11 | 0.2 |
| L2 | 0.11 | 1.3 | 0.09 | 2.5 | 0.10 | 2.3 | 0.14 | 6.1 | 0.12 | 8.2 | 0.11 | 4.5 | 0.13 | 4.9 | 0.11 | 6.1 | 0.07 | 13.7 | 0.11 | 5.7 |
| L3 | 0.07 | 4.9 | 0.08 | 3.6 | 0.08 | 5.0 | 0.12 | 2.5 | 0.11 | 4.8 | 0.12 | 1.5 | 0.09 | 3.8 | 0.08 | 4.9 | 0.07 | 8.5 | 0.08 | 8.0 |
| L4 | 0.10 | 7.2 | 0.07 | 2.8 | 0.10 | 1.3 | 0.11 | 1.6 | 0.08 | 3.6 | 0.11 | 4.7 | 0.13 | 2.2 | 0.09 | 3.0 | 0.06 | 4.8 | 0.09 | 5.5 |
| L5 | 0.16 | 0.7 | 0.15 | 5.0 | 0.21 | 9.0 | 0.14 | 7.7 | 0.12 | 7.8 | 0.04 | 10.0 | 0.17 | 2.4 | 0.17 | 4.2 | 0.11 | 6.0 | 0.19 | 6.3 |
| L6 | 0.06 | 9.3 | 0.07 | 7.4 | 0.08 | 13.4 | 0.12 | 4.1 | 0.09 | 5.7 | 0.08 | 2.9 | 0.06 | 9.0 | 0.06 | 6.9 | 0.08 | 6.0 | 0.07 | 5.8 |
| L7 | 0.06 | 4.7 | 0.07 | 6.2 | 0.08 | 6.9 | 0.10 | 3.1 | 0.07 | 12.3 | 0.07 | 3.8 | 0.09 | 8.0 | 0.08 | 4.9 | 0.07 | 3.8 | 0.07 | 7.5 |
| L8 | 0.16 | 2.2 | 0.09 | 15.9 | 0.19 | 3.2 | 0.14 | 4.9 | 0.11 | 7.9 | - | - | 0.20 | 5.8 | 0.17 | 3.1 | 0.12 | 3.5 | 0.12 | 6.5 |
| L9 | 0.05 | 10.3 | 0.07 | 5.4 | 0.08 | 2.4 | 0.09 | 1.5 | 0.03 | 20.2 | 0.07 | 0.3 | 0.05 | 6.4 | 0.07 | 2.9 | 0.09 | 0.9 | 0.08 | 2.5 |
| L10 | 0.04 | 4.2 | 0.07 | 6.8 | 0.07 | 3.1 | 0.08 | 4.5 | - | - | 0.08 | 3.3 | 0.07 | 3.9 | 0.07 | 5.5 | 0.07 | 1.1 | 0.08 | 3.2 |
| L11 | 0.10 | 5.7 | 0.08 | 6.1 | 0.15 | 2.4 | 0.11 | 9.1 | 0.13 | 5.1 | 0.14 | 6.8 | 0.16 | 5.9 | 0.14 | 3.7 | 0.04 | 9.0 | 0.11 | 1.3 |
| L12 | 0.05 | 0.9 | 0.08 | 4.6 | 0.07 | 9.4 | 0.07 | 3.6 | - | - | 0.09 | 3.1 | 0.06 | 6.2 | 0.06 | 8.8 | 0.11 | 3.6 | 0.10 | 3.3 |
| L13 | 0.05 | 3.0 | 0.07 | 3.6 | 0.07 | 6.4 | 0.07 | 5.8 | - | - | 0.10 | 2.3 | 0.07 | 2.9 | 0.08 | 4.9 | 0.09 | 0.9 | 0.09 | 6.0 |
| L14 | 0.08 | 5.0 | 0.08 | 5.7 | 0.13 | 4.9 | 0.10 | 4.9 | 0.04 | 19.0 | 0.14 | 1.1 | 0.14 | 3.7 | 0.16 | 1.7 | 0.09 | 12.0 | 0.12 | 1.4 |
| M1 | 0.29 | 3.7 | 0.18 | 6.9 | 0.23 | 4.1 | 0.23 | 1.9 | 0.21 | 5.5 | 0.26 | 1.4 | 0.22 | 6.7 | 0.20 | 2.2 | 0.20 | 1.7 | 0.22 | 1.9 |
| M2 | - | - | 0.25 | 4.6 | 0.25 | 3.2 | 0.26 | 1.0 | 0.28 | 2.3 | 0.29 | 2.1 | 0.27 | 1.5 | 0.24 | 6.3 | 0.20 | 5.4 | 0.29 | 0.9 |
| M3 | 0.23 | 3.1 | 0.17 | 3.8 | 0.24 | 0.7 | 0.24 | 1.4 | 0.24 | 2.8 | 0.24 | 1.8 | 0.23 | 3.2 | 0.19 | 2.7 | 0.22 | 6.7 | 0.25 | 3.4 |
| M4 | 0.36 | 5.0 | 0.30 | 6.5 | 0.28 | 0.6 | 0.30 | 2.6 | 0.29 | 3.1 | 0.31 | 2.7 | 0.25 | 5.8 | 0.26 | 3.1 | 0.19 | 4.5 | 0.30 | 2.7 |
| M5 | - | - | 0.38 | 10.0 | 0.30 | 3.9 | 0.30 | 1.9 | 0.36 | 1.1 | 0.26 | 0.7 | 0.30 | 2.4 | 0.25 | 5.5 | 0.18 | 4.3 | 0.15 | 5.1 |
| M6 | 0.19 | 1.7 | 0.17 | 6.3 | 0.25 | 3.4 | 0.23 | 3.8 | 0.19 | 5.6 | 0.26 | 2.3 | 0.21 | 0.7 | 0.11 | 10.9 | 0.16 | 3.9 | 0.20 | 15.1 |
| M7 | 0.30 | 3.3 | 0.30 | 4.2 | 0.34 | 5.9 | 0.30 | 1.9 | 0.37 | 7.0 | 0.31 | 1.7 | 0.26 | 2.2 | 0.28 | 1.1 | 0.16 | 1.4 | 0.30 | 6.9 |
| M8 | 0.37 | 3.3 | 0.36 | 6.2 | 0.33 | 2.0 | 0.28 | 5.1 | 0.35 | 5.6 | 0.23 | 2.0 | 0.23 | 6.0 | 0.17 | 3.6 | 0.13 | 1.7 | 0.14 | 4.2 |
| M9 | 0.20 | 3.8 | 0.16 | 2.5 | 0.27 | 5.6 | 0.21 | 2.8 | 0.18 | 19.6 | 0.25 | 1.2 | 0.20 | 4.2 | 0.16 | 0.9 | 0.15 | 3.4 | 0.24 | 18.6 |
| M10 | 0.26 | 2.8 | 0.30 | 2.0 | 0.33 | 7.1 | 0.28 | 1.2 | 0.39 | 2.2 | 0.25 | 2.4 | 0.19 | 2.5 | 0.25 | 2.0 | 0.16 | 2.4 | 0.24 | 2.7 |
| M11 | 0.28 | 2.0 | 0.30 | 2.8 | 0.30 | 6.0 | 0.21 | 1.6 | 0.31 | 3.8 | 0.22 | 2.0 | 0.16 | 1.1 | 0.14 | 0.7 | 0.13 | 7.8 | 0.11 | 7.1 |
| M12 | 0.16 | 1.6 | 0.19 | 5.9 | 0.25 | 1.6 | 0.18 | 0.6 | 0.17 | 2.3 | 0.18 | 6.4 | 0.15 | 6.9 | 0.18 | 5.7 | 0.09 | 7.7 | - | - |
| M13 | 0.22 | 4.3 | 0.26 | 4.6 | 0.29 | 3.0 | 0.20 | 2.3 | 0.32 | 4.0 | 0.20 | 2.6 | 0.15 | 1.2 | 0.21 | 3.6 | 0.14 | 0.1 | 0.20 | 2.9 |
| M14 | 0.19 | 1.6 | 0.27 | 1.2 | 0.25 | 4.2 | 0.17 | 2.6 | 0.27 | 1.2 | 0.20 | 0.8 | 0.14 | 2.9 | 0.13 | 4.1 | 0.12 | 3.2 | 0.12 | 1.8 |
| M15 | 0.16 | 3.7 | 0.16 | 0.5 | 0.18 | 1.6 | 0.14 | 1.6 | 0.18 | 0.7 | 0.13 | 1.9 | 0.13 | 1.7 | 0.14 | 1.1 | 0.14 | 1.6 | 0.21 | 9.2 |
| M16 | 0.14 | 1.3 | 0.19 | 1.3 | 0.20 | 0.9 | 0.14 | 2.1 | 0.22 | 1.4 | 0.16 | 2.7 | 0.12 | 0.8 | 0.15 | 1.2 | 0.13 | 1.4 | 0.16 | 1.7 |
| M17 | 0.14 | 2.2 | 0.21 | 1.1 | 0.17 | 3.4 | 0.15 | 2.6 | 0.19 | 3.1 | 0.15 | 5.5 | 0.13 | 2.1 | 0.12 | 3.0 | 0.13 | 1.4 | 0.13 | 2.2 |
Table 2
Mean and standard deviation (SD) values for peak force (N) as determined by automated indentation test performed for n=10 distal femur samples of murine articular cartilage.
Mean values compared between condyles (Lateral/Medial; unpaired, Student’s t test, α=0.05) and within sub-regions of condyles (Lat/Ant, Lat/Post, Med/Ant, Med/Post; one-way ANOVA, p<0.05).
| Peak force [N] | ||||
|---|---|---|---|---|
| Condyle | Mean (SD) | Condyle | Mean (SD) | Lat - Med |
| Lateral | 0.096 (0.011) | Medial | 0.219 (0.037) | p<0.0001 |
| Lat/Ant | 0.107 (0.017) | Med/Ant | 0.250 (0.037) | p<0.0001 |
| Lat/Post | 0.090 (0.011) | Med/Post | 0.199 (0.037) | p<0.0001 |
| Ant - Post | ns | Ant - Post | p<0.01 | |
-
ns, no significant difference.
-
-, comparison not applicable.
Table 3
Mean and standard deviation (SD) values for cartilage thickness as determined by needle probing for distal femur samples of murine articular cartilage (n=10).
Mean values compared between condyles (Lateral/Medial; unpaired, Student’s t test) and within sub-regions of condyles (Lat/Ant, Lat/Post, Med/Ant, Med/Post; one-way ANOVA, α=0.05).
| Cartilage thickness [µm] | ||||||||
|---|---|---|---|---|---|---|---|---|
| Condyle | Mean (SD) | Condyle | Mean (SD) | Lat - Med | ||||
| Lateral | 60.3 (6.3) | Medial | 39.8 (2.9) | p<0.0001 | ||||
| Lat/Ant | 57.0 (5.9) | Med/Ant | 37.5 (3.8) | p<0.0001 | ||||
| Lat/Post | 62.3 (7.8) | Med/Post | 41.9 (3.0) | p<0.0001 | ||||
| Ant - Post | ns | Ant - Post | ns | |||||
-
ns, no significant difference.
-
-, comparison not applicable.
Table 4
Mean and standard deviation (SD) values for cartilage thickness as determined by x-ray microscopy imaging for distal femur samples of murine articular cartilage (n=10).
Mean values compared between condyles (Lateral/Medial; unpaired, Student’s t test) and within sub-regions of condyles (Lat/Ant, Lat/Post, Med/Ant, Med/Post; one-way ANOVA). p-value reported.
| Cartilage Thickness [N] | ||||
|---|---|---|---|---|
| Condyle | Mean (SD) | Condyle | Mean (SD) | Lat - Med |
| Lateral | 64.4 (8.4) | Medial | 46.5 (4.4) | p<0.0001 |
| Lat/Ant | 59.0 (8.2) | Med/Ant | 42.9 (5.1) | p<0.0001 |
| Lat/Post | 67.4 (9.7) | Med/Post | 49.5 (4.3) | p<0.0001 |
| Ant - Post | ns | Ant - Post | ns | - |
-
ns, no significant difference.
-
-, comparison not applicable.
Additional files
Download links
A two-part list of links to download the article, or parts of the article, in various formats.
Downloads (link to download the article as PDF)
Open citations (links to open the citations from this article in various online reference manager services)
Cite this article (links to download the citations from this article in formats compatible with various reference manager tools)
High spatial resolution analysis using automated indentation mapping differentiates biomechanical properties of normal vs. degenerated articular cartilage in mice
eLife 11:e74664.
https://doi.org/10.7554/eLife.74664


