Molecular pathology of the R117H cystic fibrosis mutation is explained by loss of a hydrogen bond
- Department of Biochemistry, Semmelweis University, Hungary
- HCEMM-SE Molecular Channelopathies Research Group, Hungary
- MTA-SE Ion Channel Research Group, Semmelweis University, Hungary
Figures
Figure 1 with 1 supplement
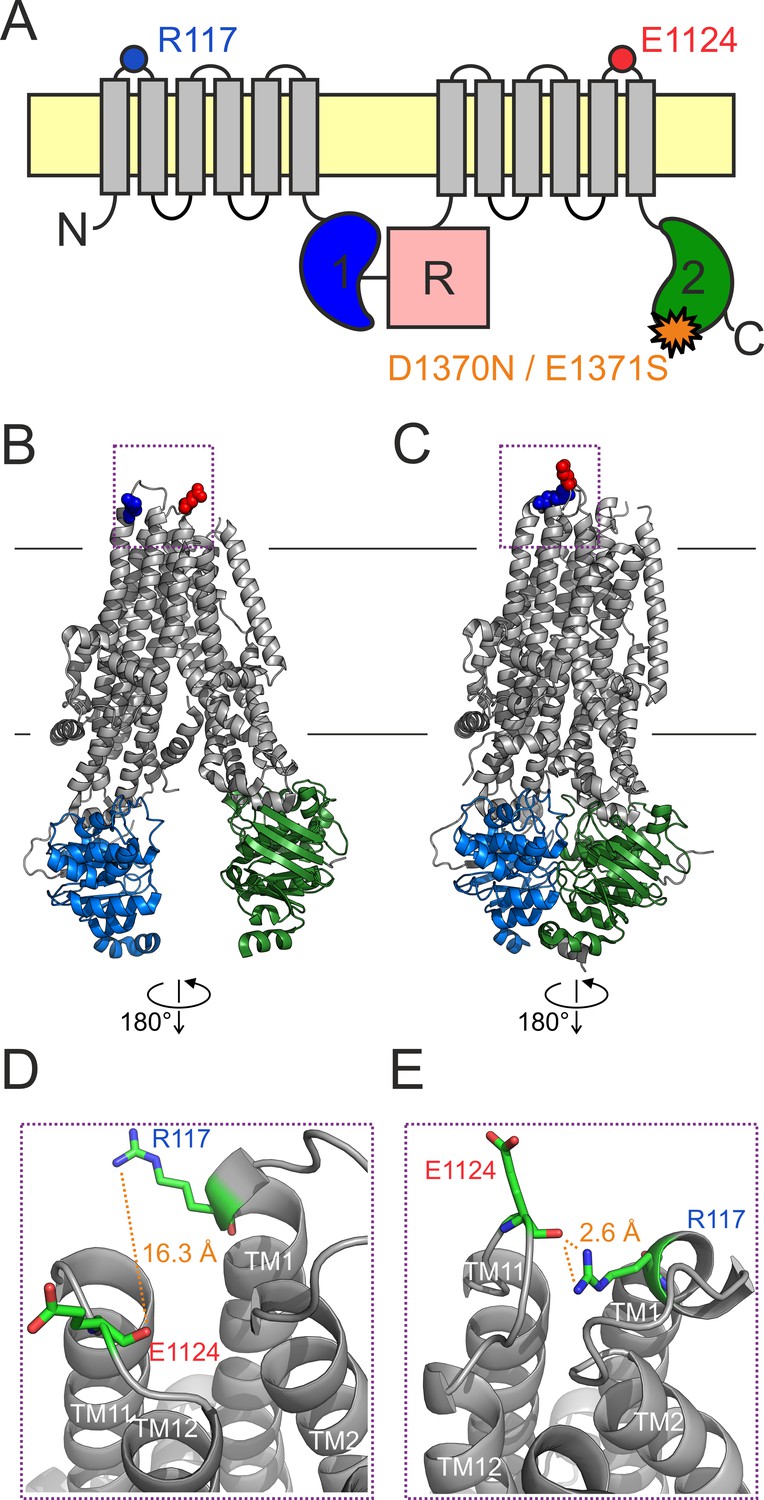
An H-bond between the R117 side chain and the E1124 backbone carbonyl group is apparent in the quasi-open CFTR structure.
(A) Cartoon topology of CFTR and location of target positions (blue and red dot). TMDs, gray; NBD1, blue; NBD2, green; R domain, magenta; membrane, yellow. Orange star denotes catalytic site mutation in the NBD2 Walker B motif. (B–C) Target residues R117 (blue) and E1124 (red) shown in space fill on the cryo-EM structures of (B) inward-facing dephospho-CFTR (pdbid: 5uak) and (C) outward-facing phosphorylated ATP-bound CFTR (pdbid: 6msm). Domain color coding as in A, the R domain is not depicted. (D–E) Close-up views of the extracellular region highlighted in B–C by dotted purple boxes. Target residues are shown as sticks, target distances are illustrated by orange dotted lines.
Figure 1—figure supplement 1
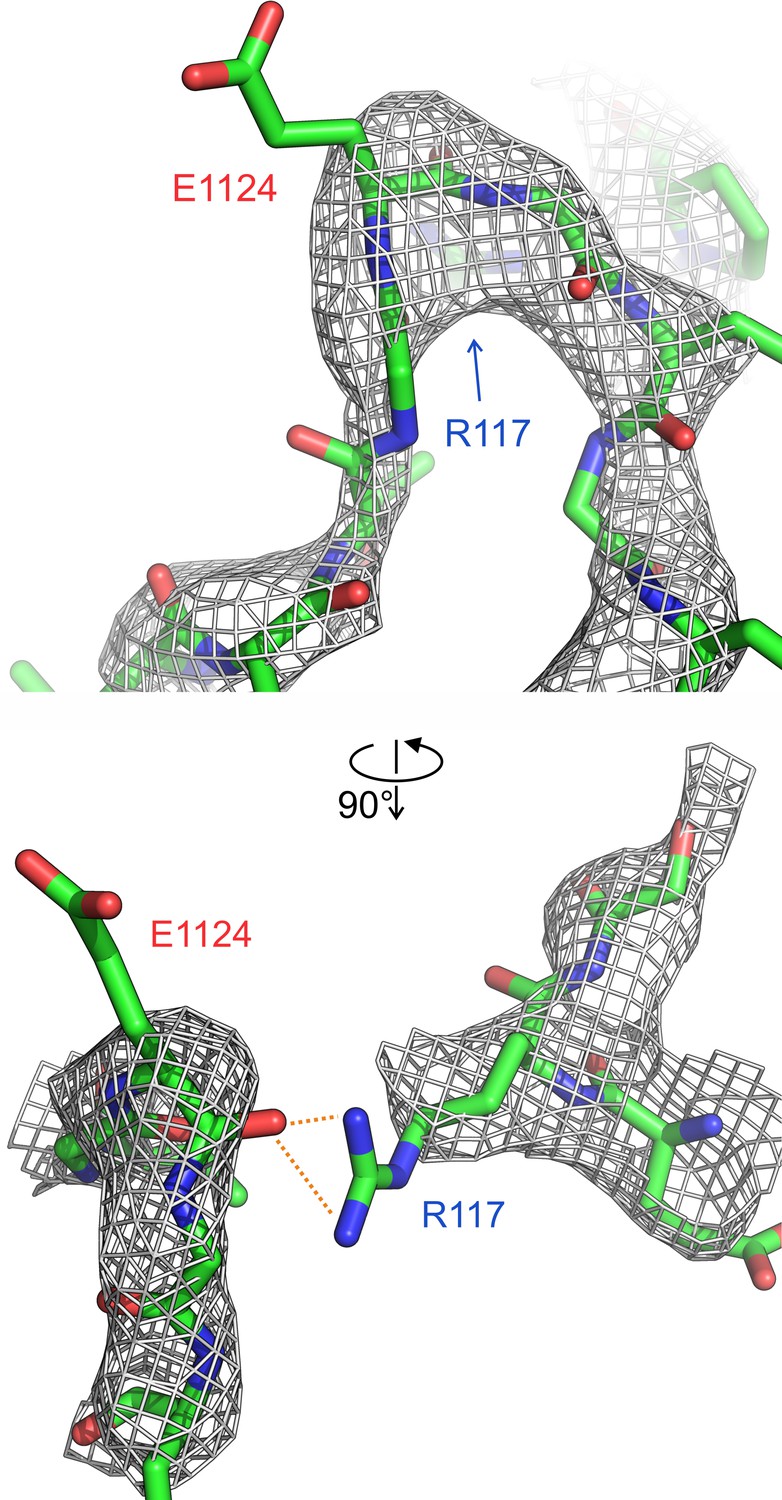
Close-up view of the R117-E1124 interaction in the quasi-open human CFTR structure.
Electron density (gray mesh, EMD-9230) and atomic model (sticks; pdbid: 6msm) of the ECL6 loop around position 1124 (top and bottom), and of the ECL1 loop around position 117 (bottom). Both loops are well represented, and density for the R117 side chain is visible down to the delta carbon.
Figure 2 with 2 supplements
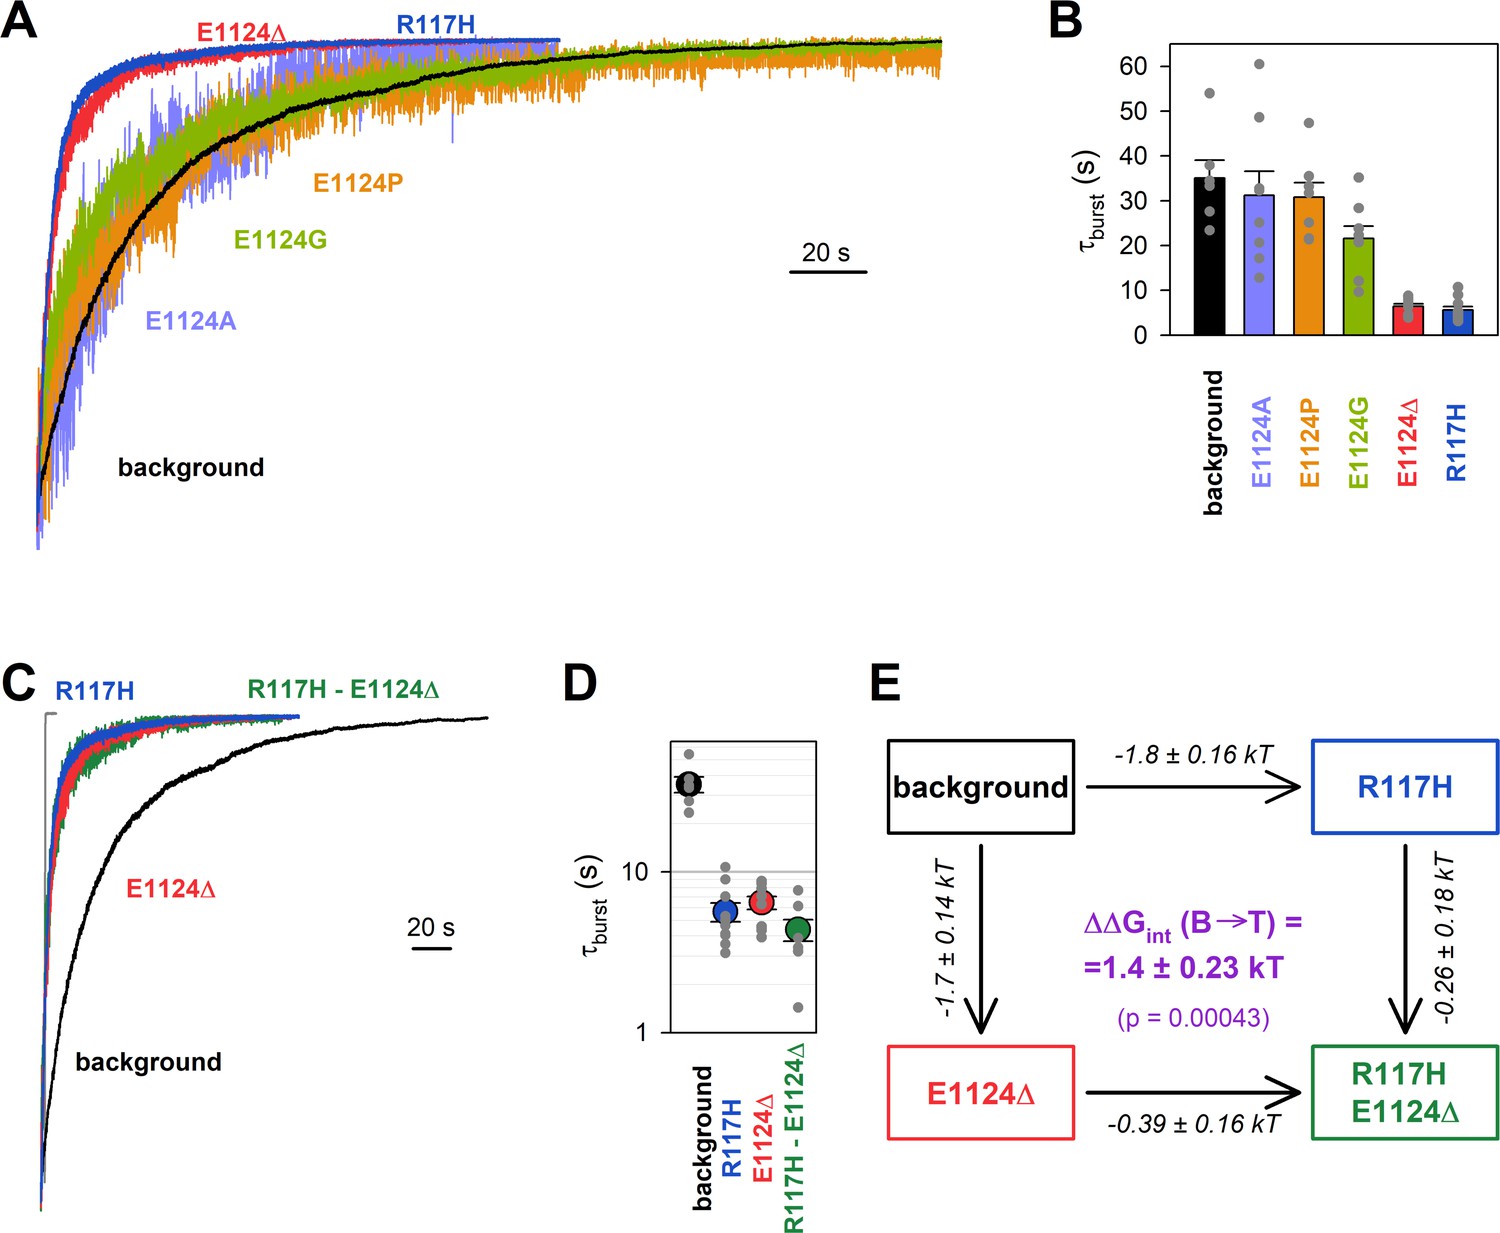
Energetic coupling between positions 117 and 1124 changes during non-hydrolytic closure.
(A, C) Macroscopic current relaxations following ATP removal for indicated CFTR mutants (color coded) harboring the E1371S background mutation. Inside-out patch currents were activated by exposure of pre-phosphorylated channels to 5 mM ATP. Current amplitudes are shown rescaled by their steady-state values. The gray trace in C illustrates the speed of solution exchange, estimated as the time constant of deactivation (~100 ms) upon Ca2+ removal of the endogenous Ca2+-activated chloride current, evoked by brief exposure to Ca2+. Membrane potential (Vm) was –20 mV. (B, D) Relaxation time constants of the currents in A and C, respectively, obtained by fits to single exponentials. Data are shown as mean ± SEM from 6 to 10 experiments. Note logarithmic ordinate in D. (E) Thermodynamic mutant cycle showing mutation-induced changes in the height of the free enthalpy barrier for the B→IB transition (, numbers on arrows; k, Boltzmann’s constant; T, absolute temperature). Each corner is represented by the mutations introduced into positions 117 and 1124 of E1371S-CFTR. (purple number) is obtained as the difference between values along two parallel sides of the cycle.
Figure 2—figure supplement 1
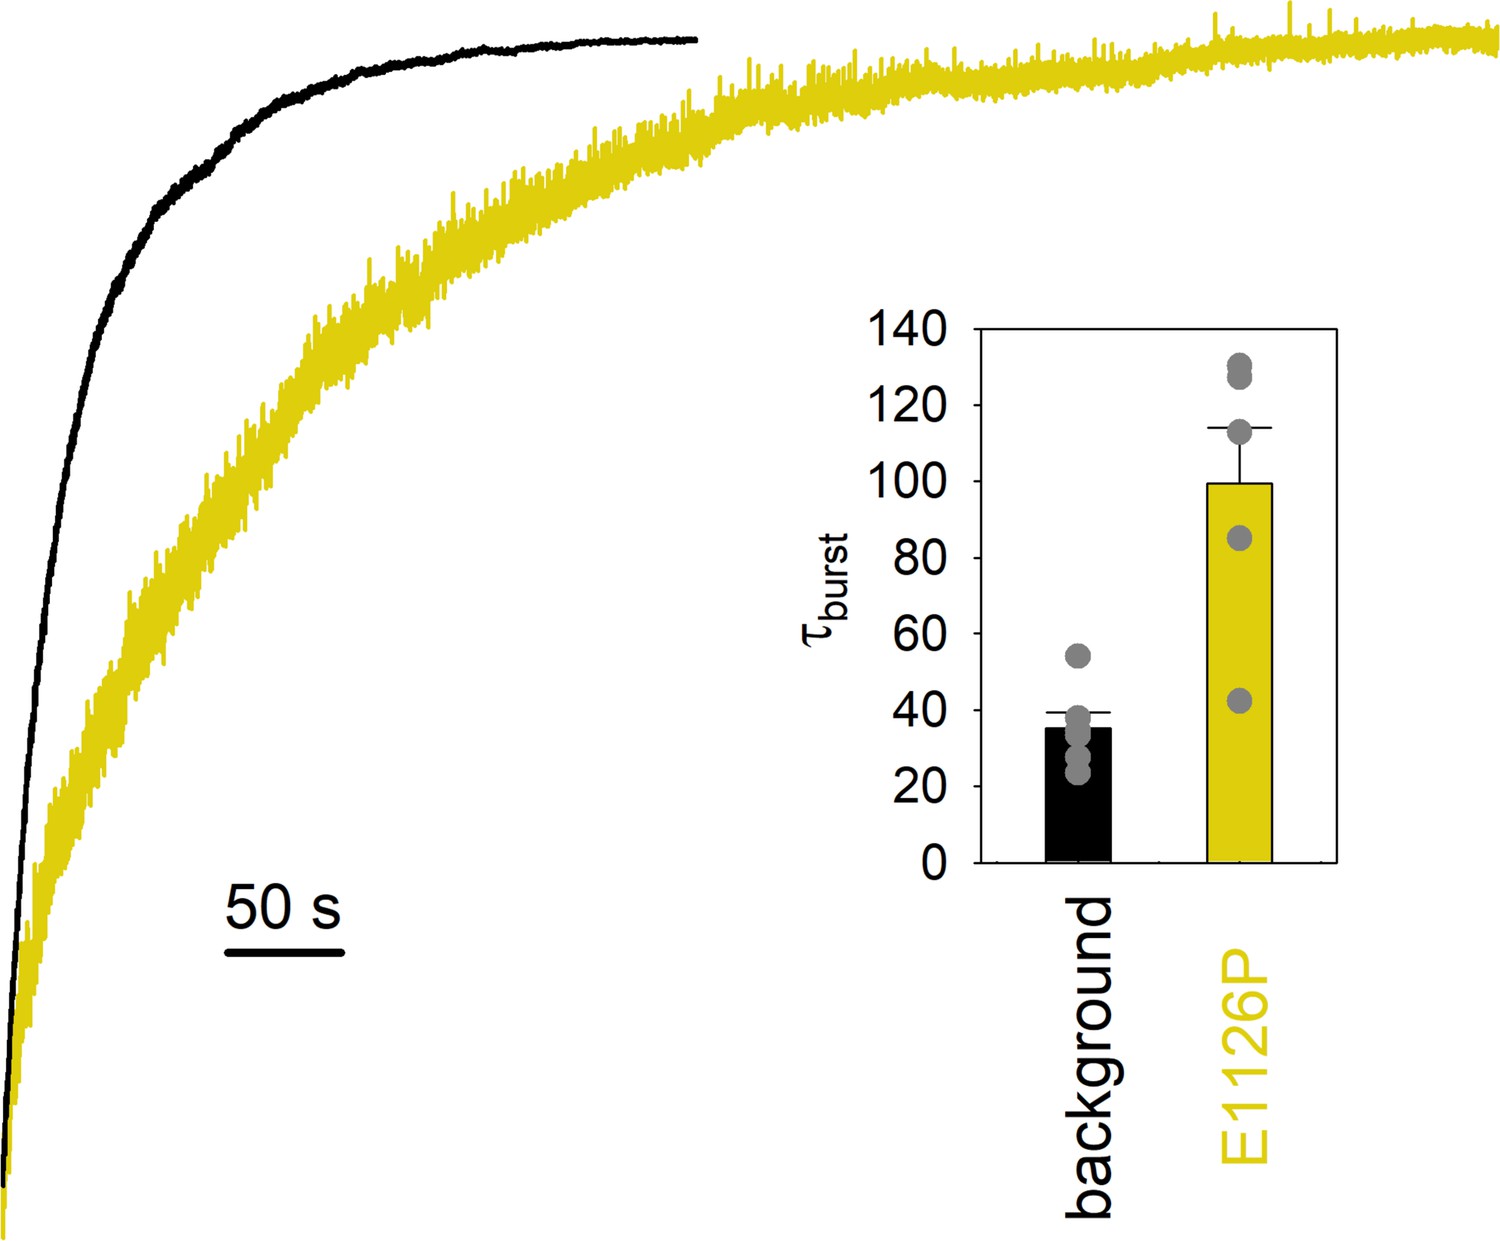
The E1126P mutation slows channel closure.
Macroscopic current relaxations following ATP removal for E1371S (black trace) and E1371S-E1126P-CFTR (yellow trace). Inside-out patch currents were activated by ~1 min exposure of pre-phosphorylated channels to 5 mM ATP. Current amplitudes are shown rescaled by their steady-state values. Membrane potential (Vm) was –20 mV. (Inset) Relaxation time constants obtained by fits to single exponentials. Data are shown as mean ± SEM from 6 and 5 experiments, respectively.
Figure 2—figure supplement 2
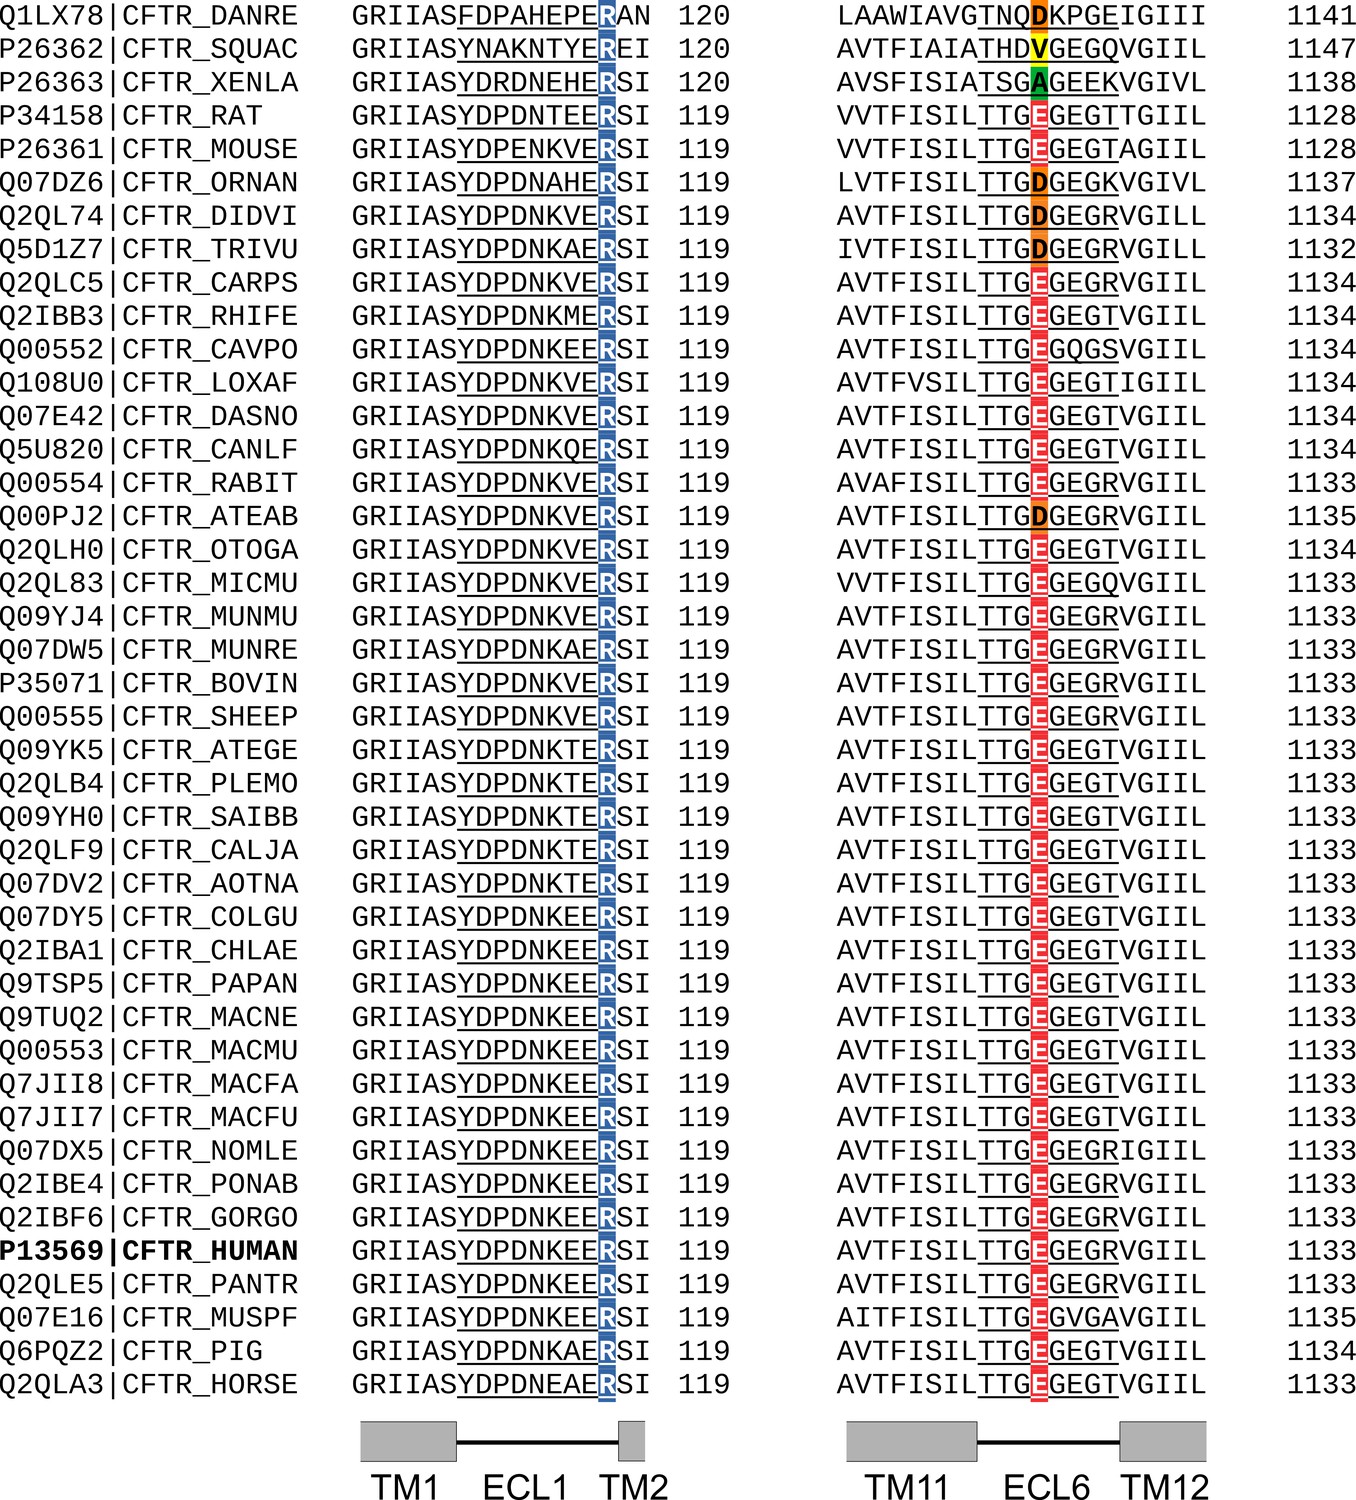
Sequence alignment of the ECL1 and ECL6 loops for CFTR orthologs.
Segments of a multiple sequence alignment generated by Clustal Omega for CFTR sequences from >40 species. Positions corresponding to human CFTR positions 117 and 1124 are highlighted in blue and red, respectively. The former position is conserved, the latter is not. However, the lengths of both ECL1 and ECL6 are invariable (underlined).
Figure 3 with 3 supplements

The H-bond between the target positions is formed only in the bursting state.
(A) Single-channel currents in 5 mM ATP of indicated CFTR mutants (color coded) harboring the D1370N background (BG) mutation. Channels were pre-phosphorylated by ~1 min exposure to 300 nM PKA +5 mM ATP. Vm was –80 mV. (B, D) Mean burst (B) and interburst (IB) (D) durations obtained by steady-state dwell-time analysis (see Materials and methods). Data are shown as mean ± SEM from five to eight patches; note logarithmic ordinates. (C, E) Thermodynamic mutant cycles showing mutation-induced changes in the height of the free enthalpy barrier for the (C) B→IB and (E) IB→B transition ( and , respectively, numbers on arrows; k, Boltzmann’s constant; T, absolute temperature). Each corner is represented by the mutations introduced into positions 117 and 1124 of D1370N-CFTR. ΔΔGint (purple number) is obtained as the difference between ΔΔG0 values along two parallel sides of the cycle. (F) (Top) Free enthalpy profile of the entire channel protein (black curve) and of the 117–1124 interaction (purple curve) along the states of the IB↔B gating process (see Materials and methods). (Bottom) Cartoon representation of channel conformations in the IB, T‡, and B states. Color coding as in Figure 1A; ATP, yellow circles. Blue and red moieties represent the R117 side chain and the E1124 backbone carbonyl group, respectively. Yellow star in state B represents formation of the H-bond.
Figure 3—figure supplement 1
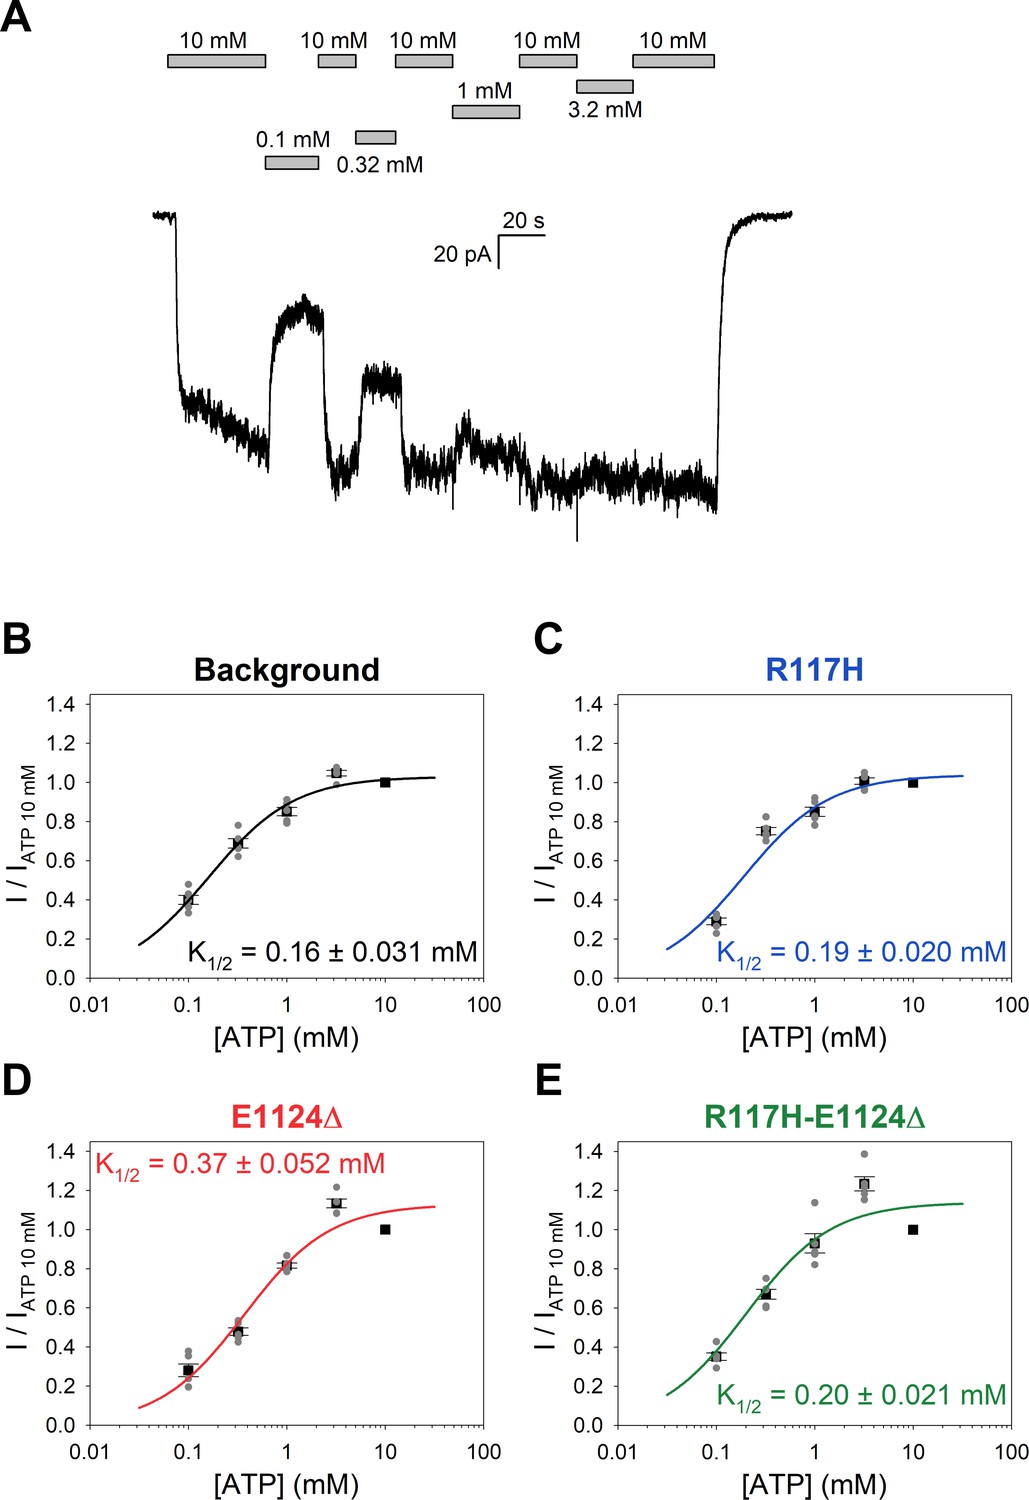
All tested constructs in the D1370N background are saturated by 5 mM ATP.
(A) Macroscopic current of pre-phosphorylated D1370N CFTR in response to exposure to various concentrations of ATP (bars). (B–E) ATP dose-response curves of the four indicated constructs in the D1370N background. Relative currents were obtained by normalizing the steady-state currents in each test segment to the mean of the steady-state currents during bracketing applications of 10 mM ATP. Each symbol represents mean ± SEM from five experiments. Solid red curves are fits to the Michaelis-Menten equation, K1/2 values are plotted in the panels.
Figure 3—figure supplement 2
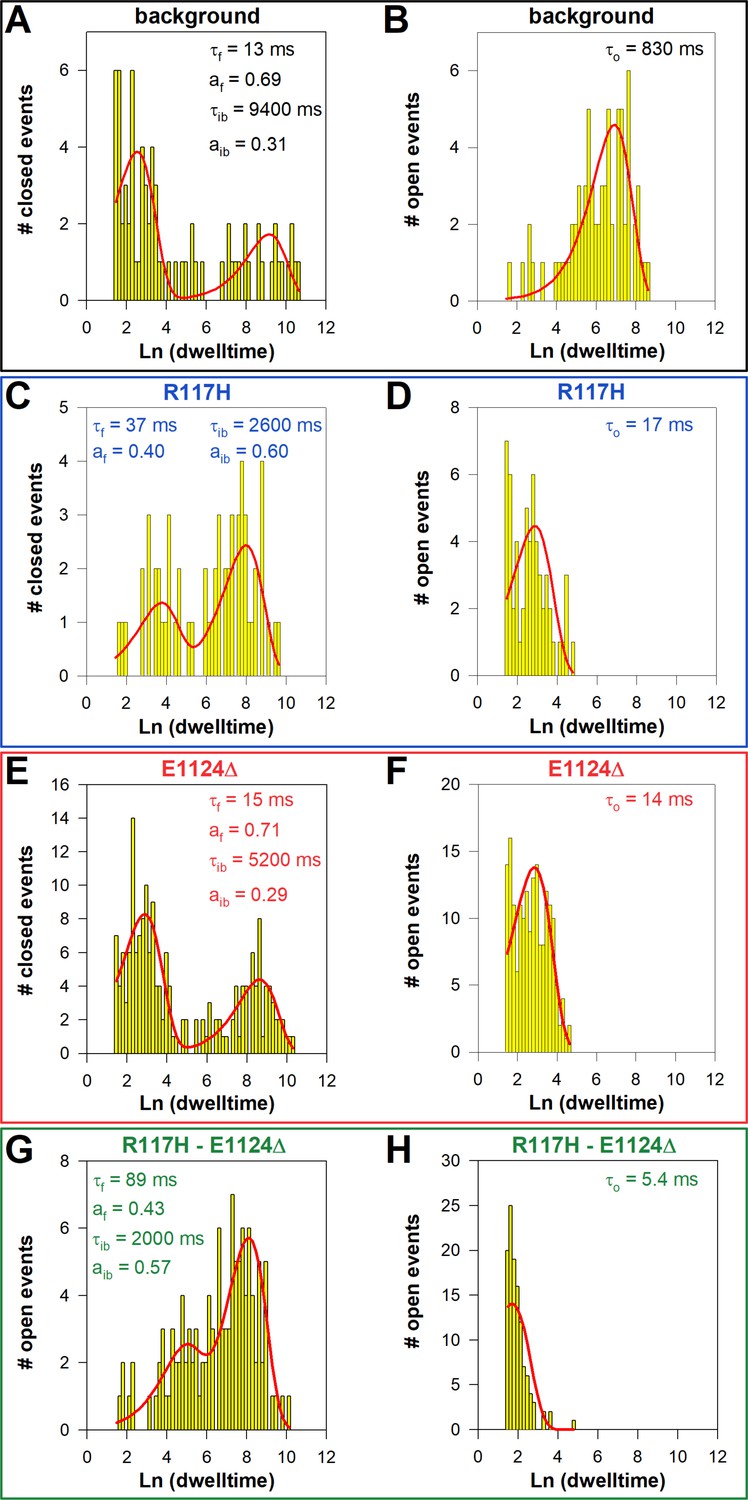
Steady-state dwell-time distributions of the target-site mutants in the D1370N background.
(A–H) Closed (A, C, E, G) and open (B, D, F, H) dwell-time histograms (Sigworth and Sine, 1987) constructed from the events list of single-channel records for the indicated CFTR mutants in the D1370N background; lower binning limit is 4 ms. Solid red lines are maximum likelihood fits of the dwell times by the Cs↔O↔Cf model (see Materials and methods). Calculated time constants, and for the closed-time histograms the fractional amplitudes (a), are printed in the panels. The two time constants of the closed-time distributions correspond to τinterburst and τflicker, respectively, that of the open-time distribution to τopen.
Figure 3—figure supplement 3
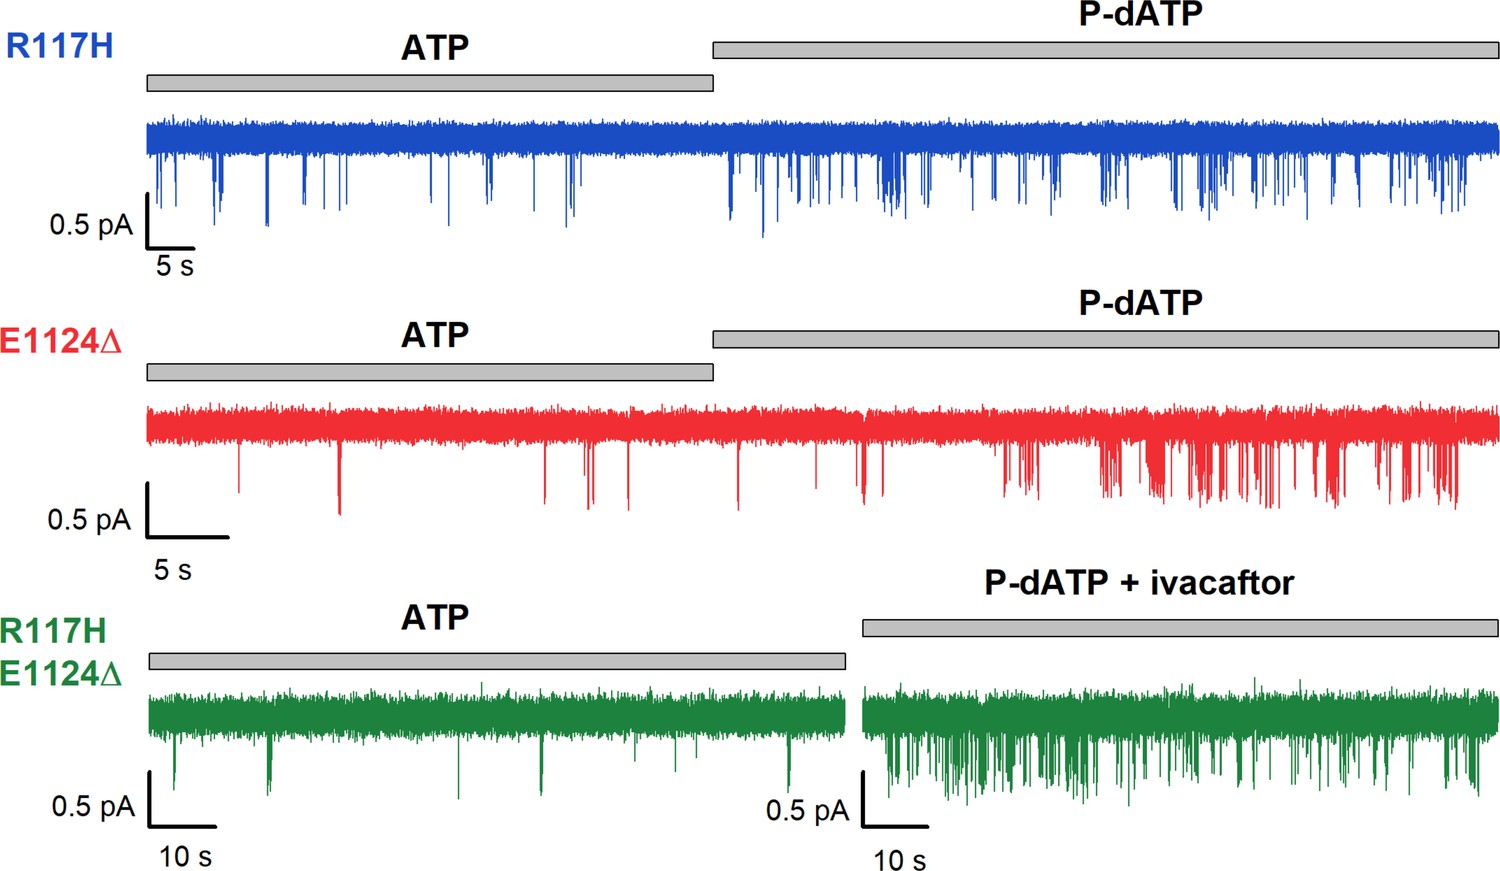
Stimulation by P-dATP or P-dATP+ Vx-770 facilitates counting channels for low-Po mutants.
Single-channel recordings in 5 mM ATP of the three low-Po mutants in the D1370N background, and robust stimulation of Po by 50 μM N6-(2-phenylethyl)-dATP (P-dATP), with or without 10 nM Vx-770 (ivacaftor). A statistical test based on comparison of the observed opening rate with the cumulative open time (Csanády et al., 2000a) allowed high-confidence exclusion of the presence of a second active channel for each of the three patches shown (p < 0.012, p < 0.03, and p < 0.003, respectively).
Figure 4
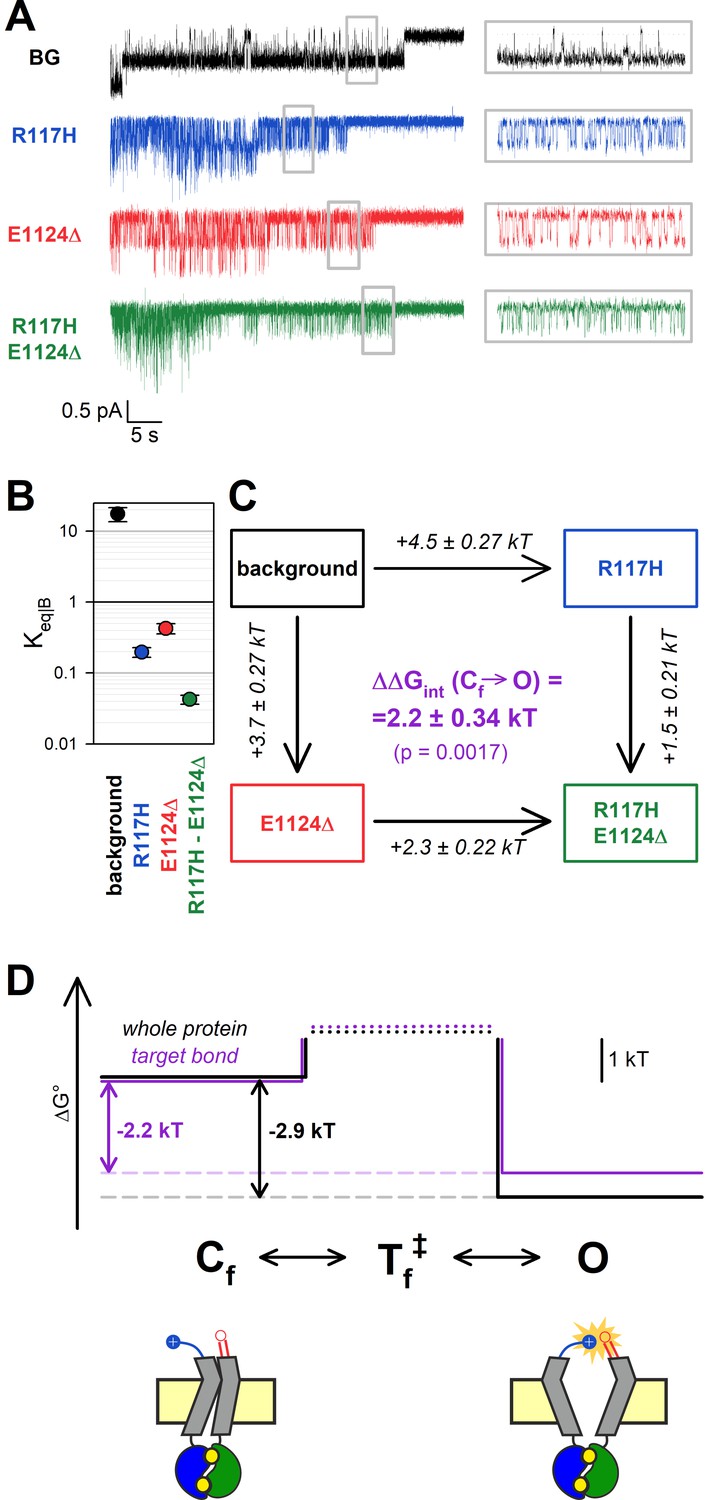
The H-bond between the target positions is broken in the flickery closed state.
(A) Currents of last open channels surviving ATP removal, for indicated CFTR mutants (color coded) harboring the E1371S background mutation. Inside-out patch currents were activated by exposure of pre-phosphorylated channels to 5 mM ATP. Insets (right) show 5 s segments corresponding to gray boxes at an expanded time scale. Vm was –80 mV. (B) Closed-open equilibrium constants within a burst (see Materials and methods). Data are shown as mean ± SEM from five to six patches; note logarithmic ordinate. SEM was calculated by error propagation (see Materials and methods). (C) Thermodynamic mutant cycle showing mutation-induced changes in the stability of the O state relative to the Cf state (, numbers on arrows; k, Boltzmann’s constant; T, absolute temperature). Each corner is represented by the mutations introduced into positions 117 and 1124 of E1371S-CFTR. ΔΔGint (purple number) is obtained as the difference between ΔΔG0 values along two parallel sides of the cycle. (D) (Top) Free enthalpy profile of the entire channel protein (black curve) and of the 117–1124 interaction (purple curve) along the states of the intraburst (O↔Cf) gating process (see Materials and methods). (Bottom) Cartoon representation of channel conformations in the Cf and O states. Color coding as in Figure 3F.
Figure 5 with 1 supplement
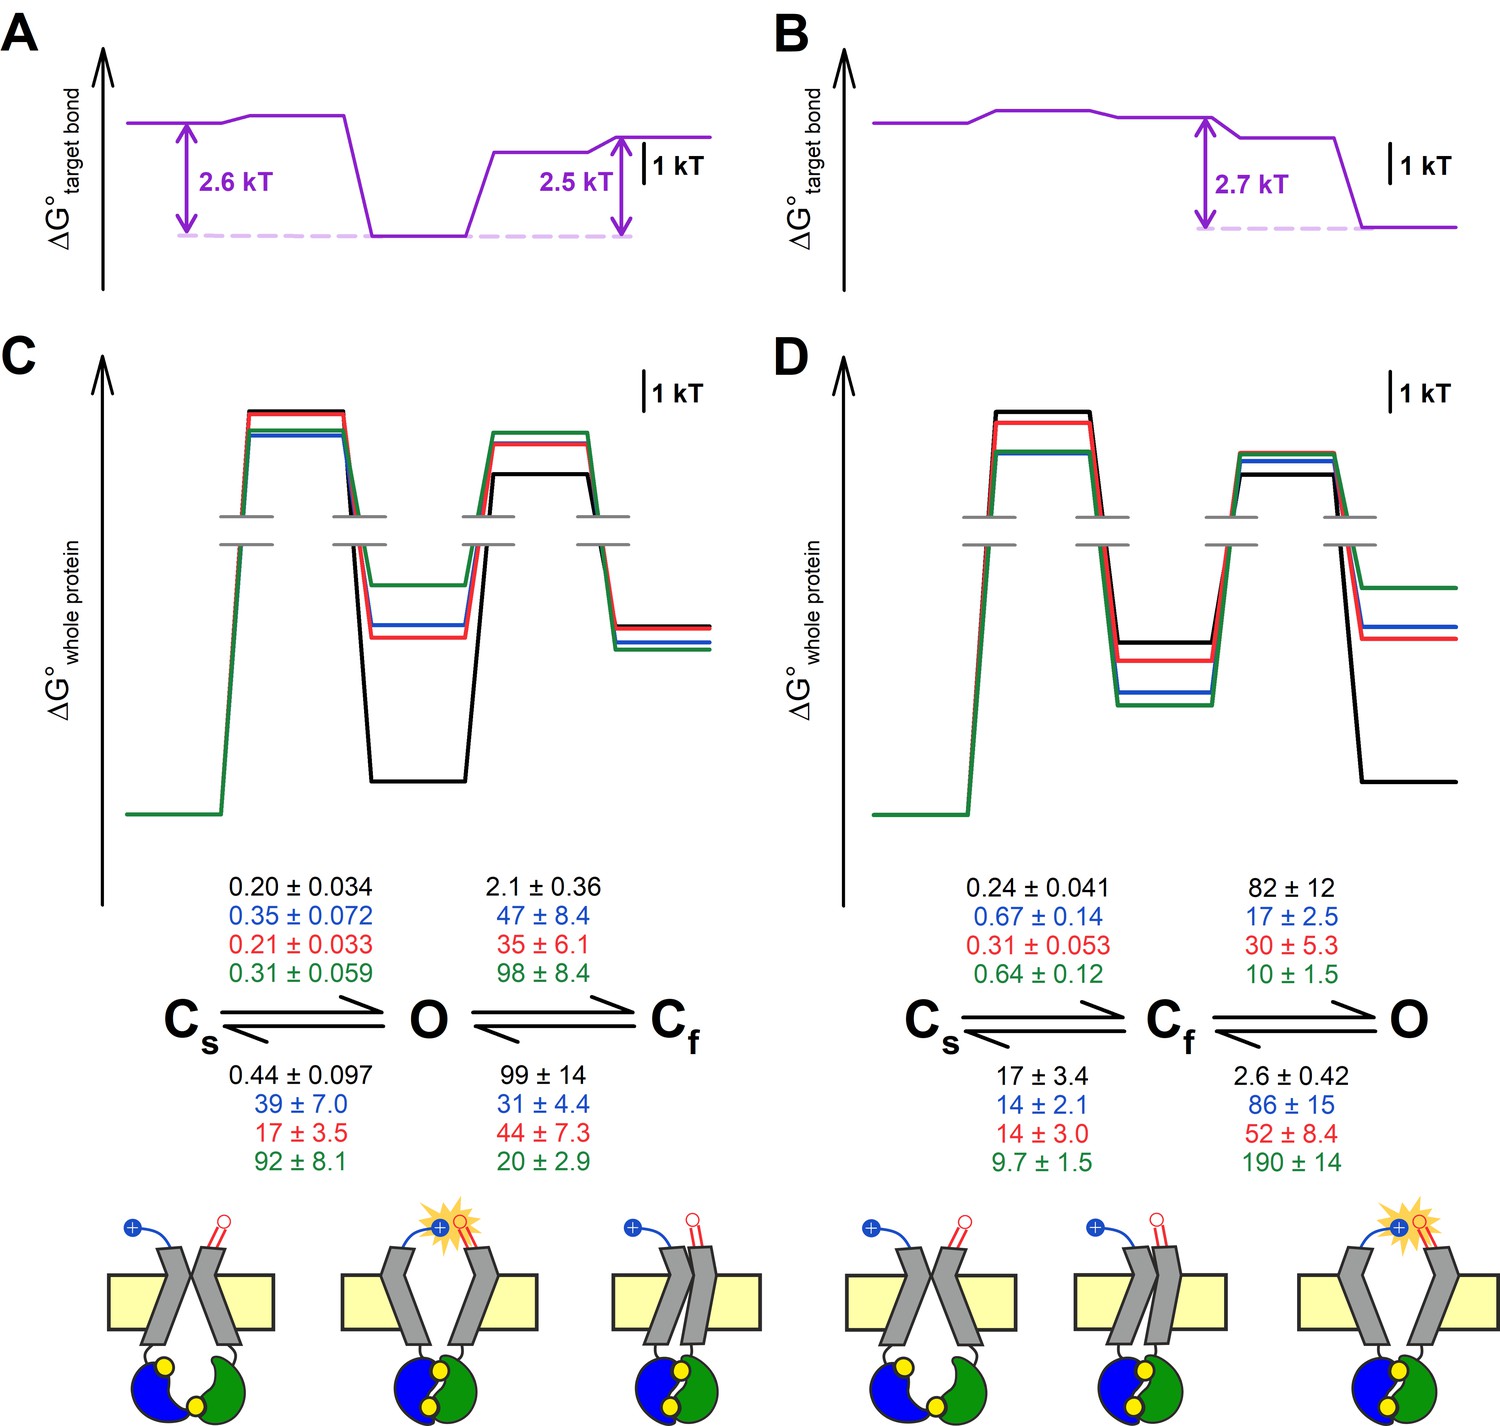
Both alternative linear three-state models adequately explain the effects of the mutations.
(A–D) Free enthalpy profiles (A–B) of the 117–1124 interaction in D1370N-CFTR, and (C–D) of the entire channel protein for various mutants (color coded) in the D1370N background, along all states of the gating process assuming either the Cs↔O↔Cf (A, C) or the Cs↔Cf↔O (B, D) model. The profiles in (A–B) were obtained from the ΔΔGint values for the four gating steps, those in (C–D) from the microscopic transition rate constants (numbers in s–1, color coded by mutants) obtained by fitting either model to the steady-state recordings in Figure 3A (see Materials and methods). Cartoons in C–D (bottom) represent the channel conformations in the Cs, O, and Cf states. Color coding as in Figure 3F.
Figure 5—figure supplement 1
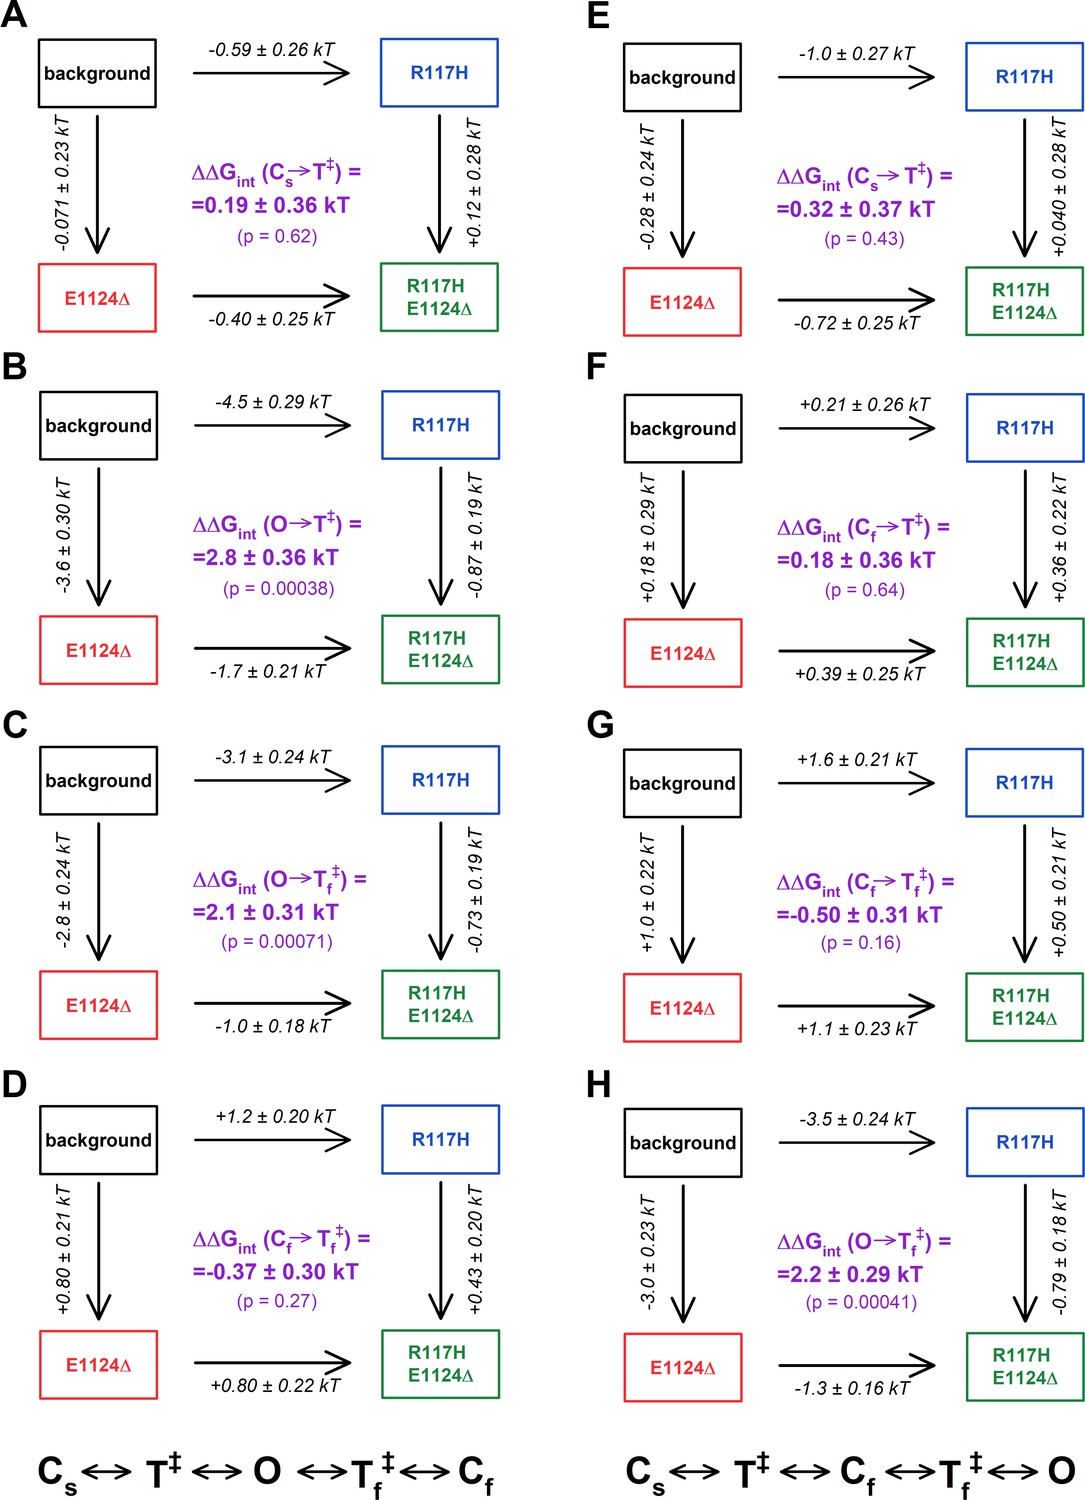
Mutant cycles built on the four microscopic transition rate constants for the two alternative three-state schemes.
(A–H) Thermodynamic mutant cycles showing mutation-induced changes in the heights of the free enthalpy barriers (ΔΔG0) for the four microscopic transitions contained in the (A–D) Cs↔O↔Cf or (E–H) Cs↔Cf↔O model, respectively (numbers on arrows; k, Boltzmann’s constant; T, absolute temperature). Each corner is represented by the mutations introduced into positions 117 and 1124 of D1370N-CFTR. ΔΔGint (purple numbers) are obtained as the differences between ΔΔG0 values along two parallel sides of a cycle. Gating steps: A, Cs→O; B, O→Cs; C, O→Cf; D, Cf→O; E, Cs→Cf; F, Cf→Cs; G, Cf→O; H, O→Cf.
Tables
Table 1
Model-independent descriptive gating parameters for the indicated mutant CFTR constructs in the D1370N background.
Gating parameters were obtained from steady-state recordings as described in Materials and methods. Data are displayed as mean ± SEM from five to eight patches.
| τburst (ms) | τinterburst (ms) | τflicker (ms) | nflicker | Po | |
|---|---|---|---|---|---|
| Background (D1370N) | 2000 ± 250 | 5100 ± 1100 | 10 ± 1.6 | 4.8 ± 0.82 | 0.35 ± 0.056 |
| R117H | 67 ± 8.8 | 2800 ± 800 | 33 ± 5.0 | 1.2 ± 0.12 | 0.017 ± 0.0055 |
| E1124Δ | 100 ± 16 | 4800 ± 810 | 23 ± 4.0 | 2.1 ± 0.41 | 0.013 ± 0.0033 |
| R117H E1124Δ | 58 ± 4.4 | 3200 ± 880 | 50 ± 7.9 | 1.1 ± 0.099 | 0.0054 ± 0.0011 |
Table 2
Model-independent descriptive parameters of intraburst gating for the indicated mutant CFTR constructs in the E1371S background.
Gating parameters were obtained from last-open-channel recordings as described in Materials and methods. Data are displayed as mean ± SEM from five to six patches.
| τflicker (ms) | τopen (ms) | Keq|B | |
|---|---|---|---|
| Background (E1371S) | 11 ± 2.3 | 200 ± 27 | 17 ± 3.9 |
| R117H | 58 ± 7.3 | 11 ± 1.1 | 0.20 ± 0.031 |
| E1124Δ | 42 ± 6.0 | 18 ± 1.7 | 0.42 ± 0.070 |
| R117H E1124Δ | 150 ± 18 | 6.2 ± 0.50 | 0.042 ± 0.0060 |
Key resources table
| Reagent type (species) or resource | Designation | Source or reference | Identifiers | Additional information |
|---|---|---|---|---|
| biological sample (Xenopus laevis) | Xenopus laevis oocytes | European Xenopus Resource Centre | RRID: NXR_0.0080 | – |
| Commercial assay or kit | HiSpeed Plasmid Midi Kit | Qiagen | 12643 | |
| Commercial assay or kit | QuickChange II Mutagenesis Kit | Agilent Technologies | 200524 | |
| Commercial assay or kit | mMESSAGE mMACHINE T7 Transcription Kit | ThermoFisher Scientific | AM1344 | |
| Chemical compound, drug | Collagenase type II | ThermoFisher Scientific | 17101–015 | |
| Chemical compound, drug | Adenosine 5′-triphosphoribose magnesium (ATP) | Sigma-Aldrich | A9187 | |
| Chemical compound, drug | Protein kinase A catalytic subunit, bovine | Sigma-Aldrich | P2645 | – |
| Chemical compound, drug | Vx-770 (solid) | Selleck Chemicals | S1144 | – |
| Chemical compound, drug | N6-(2-phenylethyl)-dATP | Biolog LSI | D 104 | – |
| Software, algorithm | Pclamp9 | Molecular Devices | RRID: SCR_011323 |
Additional files
Download links
A two-part list of links to download the article, or parts of the article, in various formats.
Downloads (link to download the article as PDF)
Open citations (links to open the citations from this article in various online reference manager services)
Cite this article (links to download the citations from this article in formats compatible with various reference manager tools)
Molecular pathology of the R117H cystic fibrosis mutation is explained by loss of a hydrogen bond
eLife 10:e74693.
https://doi.org/10.7554/eLife.74693


