Allosteric stabilization of calcium and phosphoinositide dual binding engages several synaptotagmins in fast exocytosis
- Department of Mathematical Sciences, University of Copenhagen, Denmark
- Department of Neuroscience, University of Copenhagen, Denmark
- Molecular and Theoretical Neuroscience, Leibniz-Institut für Molekulare Pharmakologie, FMP im CharitéCrossOver, Germany
Figures
Figure 1 with 2 supplements

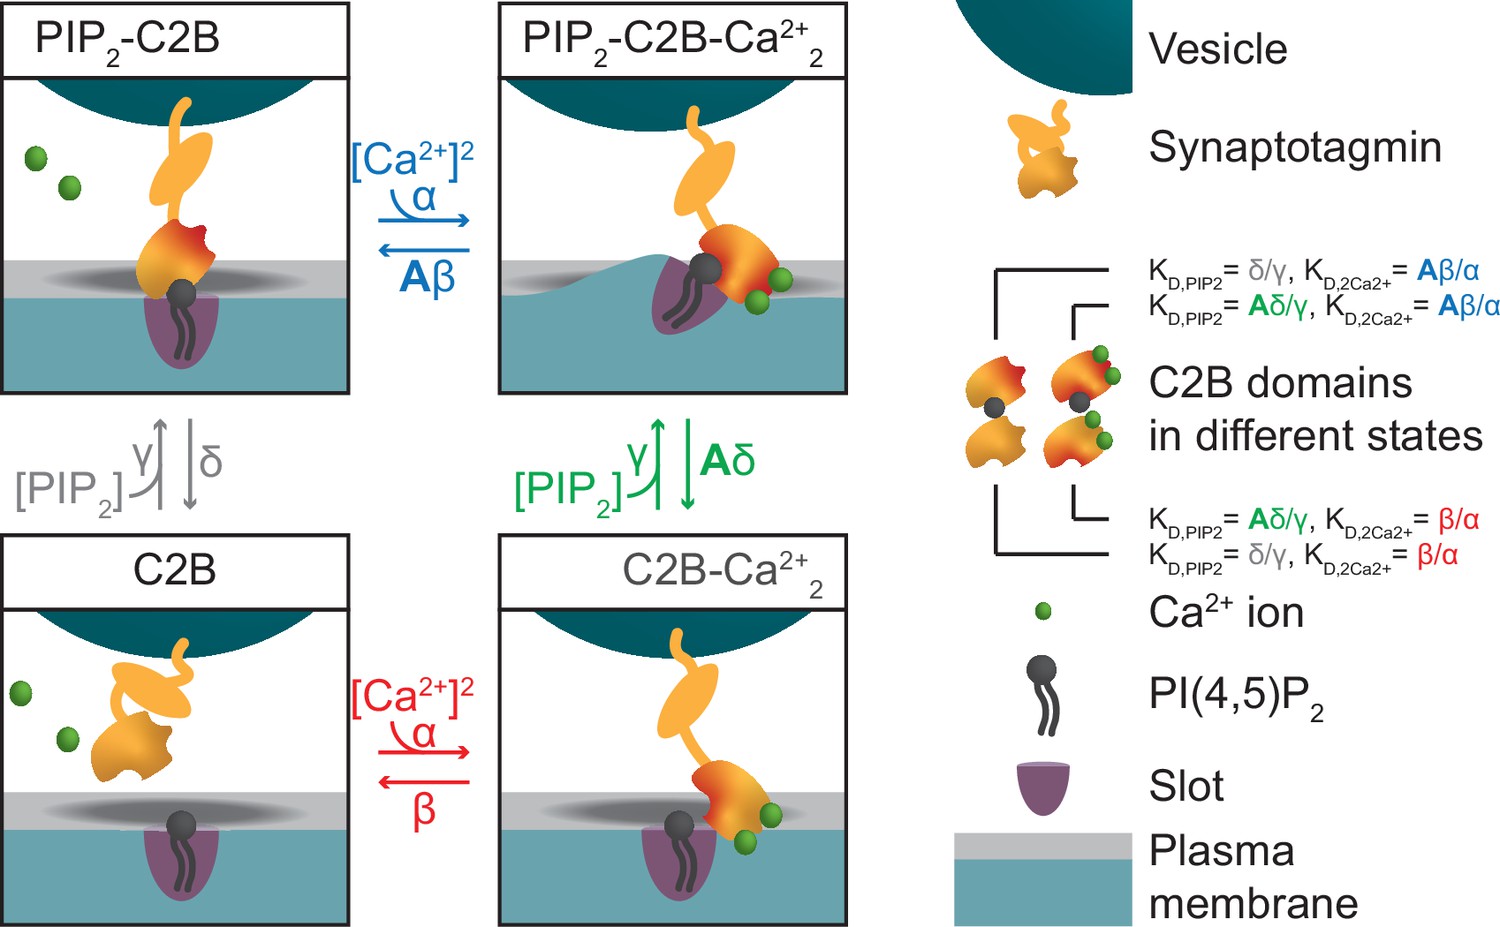
A molecular model of NT release triggered by Ca2+ and PI(4,5)P2 binding to the syt1 C2B domain.
(A) The reaction scheme of a single syt C2B domain. Each syt can be in one of four binding states: Nothing bound (top left), PI(4,5)P2 bound (top right), two Ca2+ ions bound (bottom left), and PI(4,5)P2 and two Ca2+ ions bound (bottom right). Simultaneous binding of Ca2+ and PI(4,5)P2 to the syt C2B domain is referred to as dual binding. The factor A<1 on the dissociation rates (β and δ) from the dual-bound state represents the positive allosteric effect of simultaneous PI(4,5)P2 and Ca2+ binding and leads to stabilization of the dual-bound state. The ratio between dissociation rate and association rate constants (β/α and δ/γ) is equal to the respective dissociation constants of syt1 determined in vitro (KD,2Ca2+ = 2212 µM2 and KD,PIP2 = 20 µM, van den Bogaart et al., 2012). An alternative reaction scheme where Ca2+ binding leads to association of the C2B domain with the plasma membrane is shown in Figure 1—figure supplement 1. Our model is not influenced by the assumptions on whether Ca2+ binding to syt leads to plasma membrane or vesicle association. (B) The stoichiometry at the SV fusion site. We assume 15 syts per SV (Takamori et al., 2006), and that the association of the syt C2B domain to PI(4,5)P2 is limited to a finite number of slots (here illustrated for Mslots = 3). (C) The effect of formation of multiple dual bindings on the energy barrier for SV fusion and the SV fusion rate. We assume that each dual-binding C2B domain lowers the energy barrier for fusion by the same amount (Esyt, illustrated in middle row), thereby increasing the fusion rate (kfuse) with a factor f for each dual binding (equation in bottom row). The fusion rate for an SV with no dual bindings formed is set to L+. The model is a Markov model, which can be summarized in a state diagram describing the reactions of the syt-harboring SV (Figure 1—figure supplement 2).
Figure 1—figure supplement 1
Alternative reaction scheme of a single syt in which Ca2+ binding leads to association to the plasma membrane.
Reaction scheme of a single syt C2B domain alternative to the one shown in Figure 1A. Instead of an association to the vesicular membrane, Ca2+ binding to the C2B domain in this illustration leads to an association with the plasma membrane. In this illustration, the dual-bound state affects the curvature of plasma membrane. Our model does not make a distinction between either of the two illustrations.
Figure 1—figure supplement 2
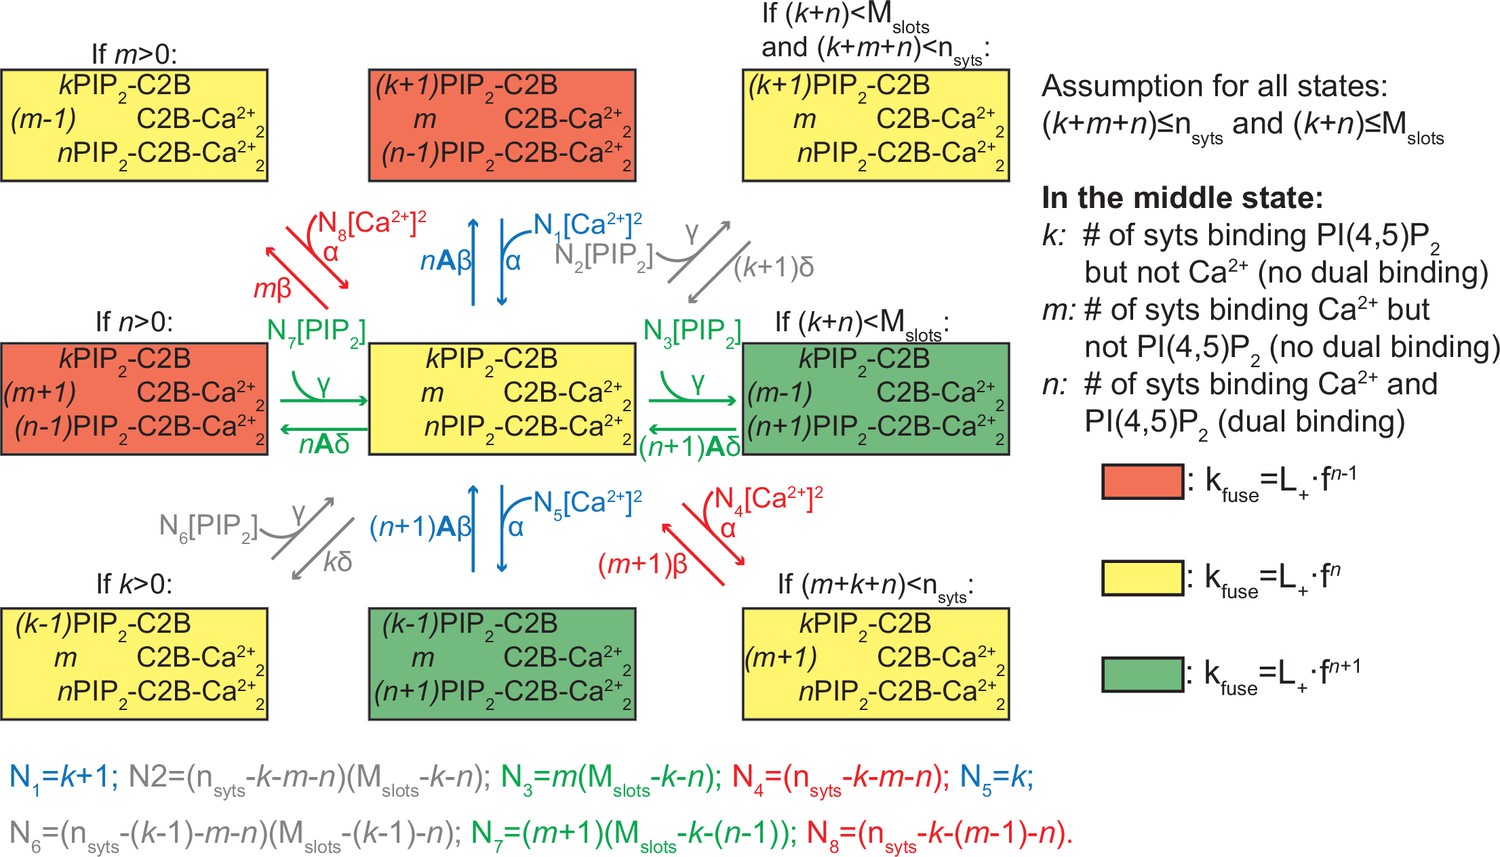
Reaction scheme for all reactions of an entire SV.
The diagram shows the possible (un)binding reactions and indicates the relative fusion rate of an SV with nsyts syts and Mslots slots. The state in the center of the diagram represents an SV with k syts having bound only PI(4,5)P2, m syts having bound only two Ca2+, and n syts having formed dual bindings by binding both PI(4,5)P2 and two Ca2+. From this state, the SV can (un)bind Ca2+ or PI(4,5)P2 (unbinding moves the SV to the state to the left or up, binding to the right or down). The number of syts, nsyts, and the number of slots, Mslots, limit the possible number of syts engaging in ligand binding in general and in binding of PI(4,5)P2, respectively, which is indicated by the assumption in the top right corner. Whether the SV can undergo a specific reaction (that is, whether a certain state exists and the SV can transit to it) depends on its current binding state as indicated by the assumptions above some of the states. The color shading of the states indicates the value of the fusion rate relative to the other states in the diagram. Yellow shading means a fusion rate equal to that from the state in the center. Red and green shading means a factor f lower and higher fusion rate, respectively. For detailed description of the reaction rate equations, see Materials and methods.
Figure 2 with 7 supplements
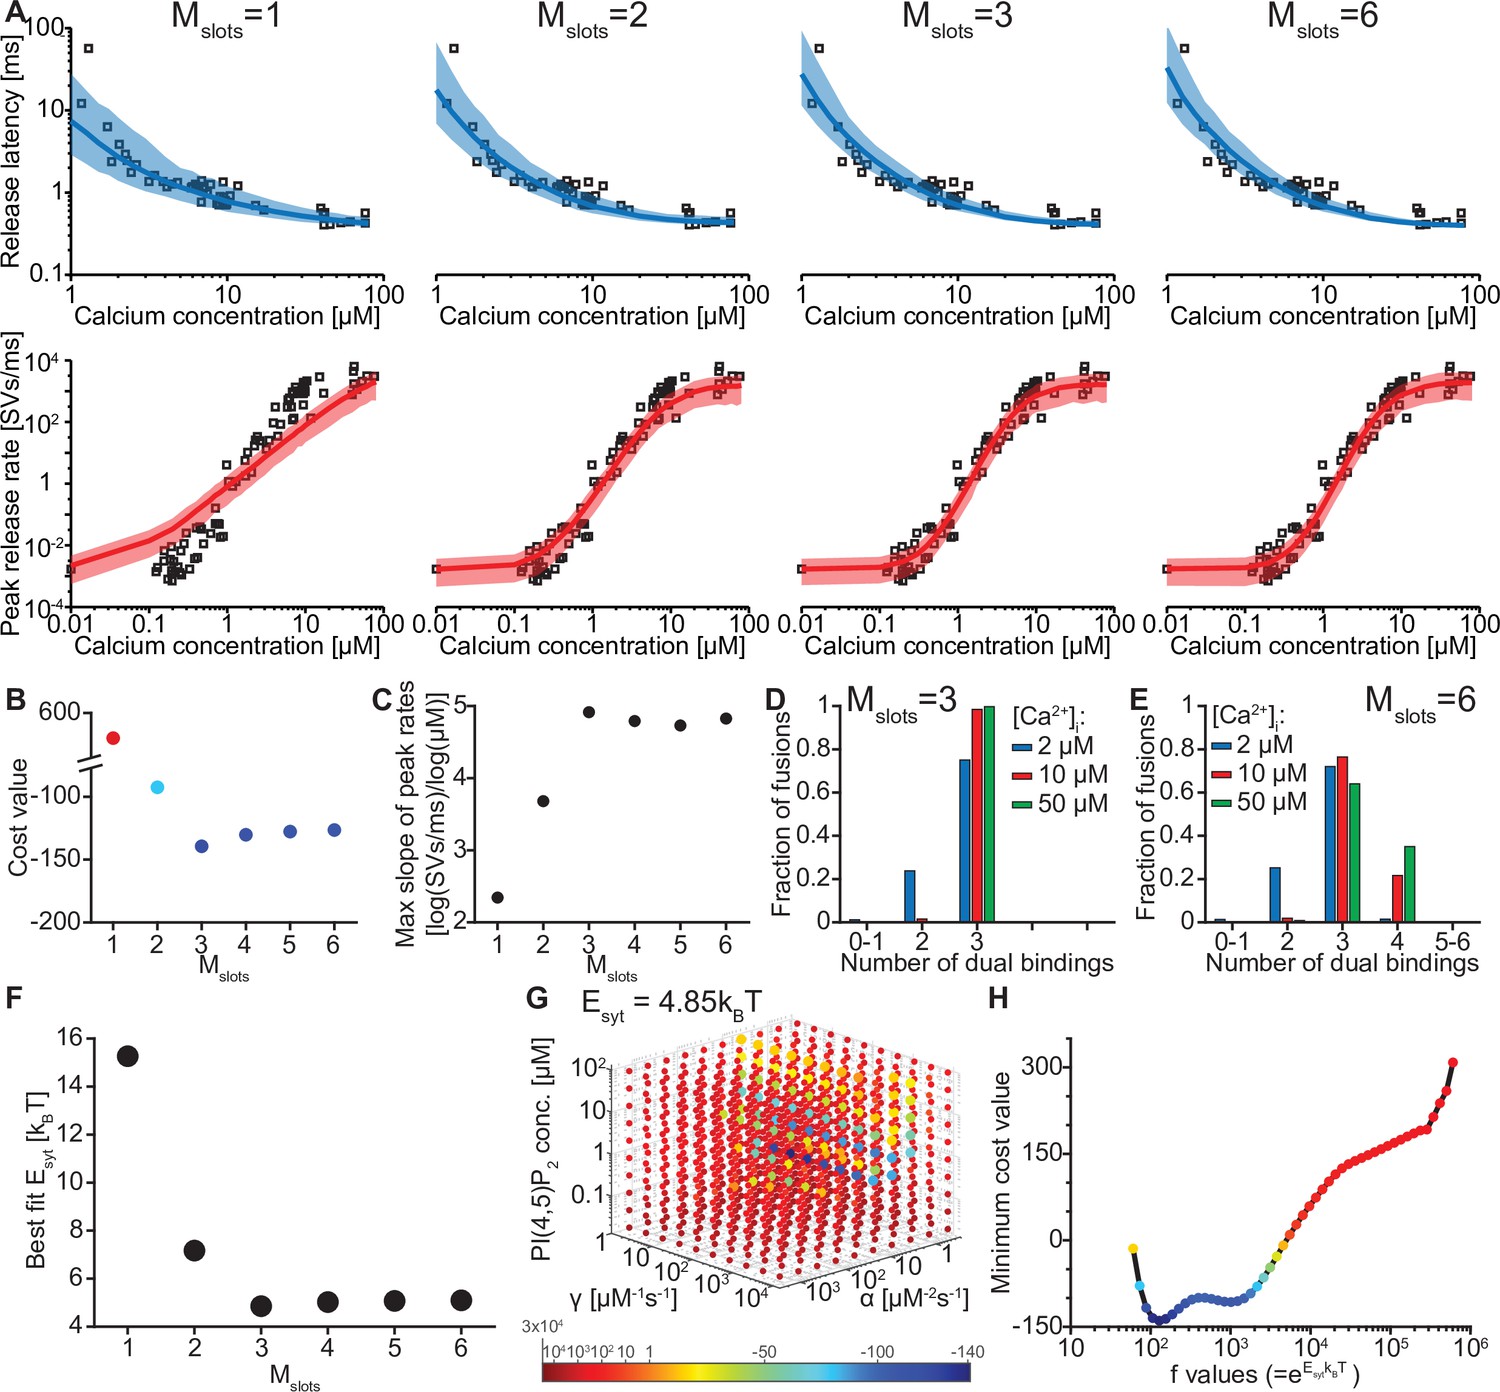
The model reproduces the Ca2+ dependency of SV fusion when at least three syts can simultaneously bind PI(4,5)P2.
(A) Best fit results for different choices of Mslots. The top panels show best fit model prediction of the release latencies (time to fifth SV fusion), and the bottom panels show the predicted peak release rates at varying Ca2+ concentrations. The black points are experimental data (individual measurements replotted from Kochubey and Schneggenburger, 2011). Solid lines represent the median release latencies and mean peak release rates predicted by the model from 1000 repetitions per simulated [Ca2+]i. The shaded areas indicate the 95% prediction interval of the model. The models with Mslots <3 failed to reproduce data, whereas models with Mslots ≥3 agreed with data. Optimization and simulation were performed using a variable RRP size (Figure 2—figure supplement 1). (B) Minimum cost value as a function of Mslots. With Mslots = 3 the minimum cost value was obtained, indicating the best correspondence to experimental release latencies and peak release rates. The point colors correspond to the color scale in panel G. (C) Maximal slope of logarithm of simulated peak release rate vs logarithm of [Ca2+]i. For Mslots <3 the model resulted in a too shallow Ca2+ dependency of release rates. (D–E) The number of dual bindings at the time point of fusion for Mslots = 3 (D) and Mslots = 6 (E) determined from simulations of 104 SVs using three different [Ca2+]i. Most fusions took place after forming three bindings, even when allowing more dual bindings to form. A larger set of Ca2+ stimuli was also explored (Figure 2—figure supplement 2 and Figure 2—figure supplement 3). Forcing a model with Mslots = 6 to fuse after 5/6 dual bindings were formed could not describe the experimental data and showed a too steep Ca2+ dependency of release (Figure 2—figure supplement 4). The number of dual bounds before fusion was slightly sensitive to the assumption on how many Ca2+ ions bind to a single syt (Figure 2—figure supplement 5). This simplified model assuming simultaneous binding of two Ca2+-ions agrees with one where the binding is sequential if the binding of the second Ca2+ ion is favoured (Figure 2—figure supplement 6) (F) The change in the energy barrier induced by dual binding formation (Esyt) as a function of Mslots. Esyt was computed from the fitted f values and was approximately constant for Mslots ≥3. (G) Exploring cost values in the parameter space for a model with Mslots = 3. With f fixed at the best fit value (f=128), we determined the cost value of all combinations of 30 choices of the three free parameters, α, γ and [PI(4,5)P2]. As the added delay only leads to a vertical shift in the release latencies plot (see Figure 2—figure supplement 7), this parameter was optimized for each choice of the other free parameters to minimize the costs. The plot shows a subset of the parameter combinations, and the colors indicate the cost value at each point. The color scale is linear below 1 and logarithmic above 1, and points with a cost value > 1 are smaller for better visibility. The darkest blue colored ball represents the overall minimum cost value in this parameter search and agrees with the best fit obtained. The effect of varying each of the free parameters on release latencies and peak release rates can be seen in Figure 2—figure supplement 7. (H) Minimum cost value as a function of f for a model with Mslots = 3. For each choice of f the model was fit to experimental data. This parameter exploration found the same minimum in the parameter space as found by fitting all free parameters. Simulation scripts can be found in Source code 1. Results depicted in Figure 2 and its figure supplements can be found in Figure 2—source data 1.
-
Figure 2—source data 1
Source data for Figure 2 and Figure 2—figure supplements 2–7.
- https://cdn.elifesciences.org/articles/74810/elife-74810-fig2-data1-v2.xlsx
Figure 2—figure supplement 1
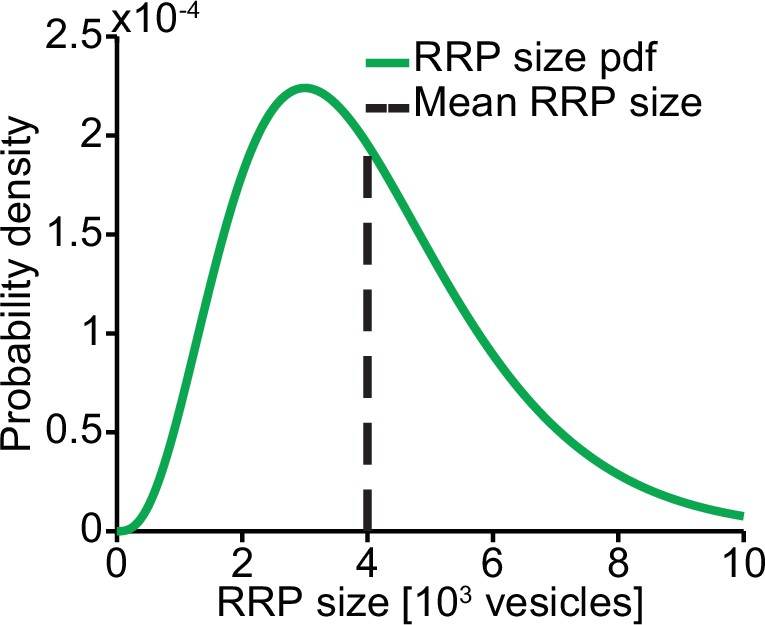
RRP distribution.
We assumed the RRP size to follow a gamma distribution with mean 4000 and SD 2000.
Figure 2—figure supplement 2
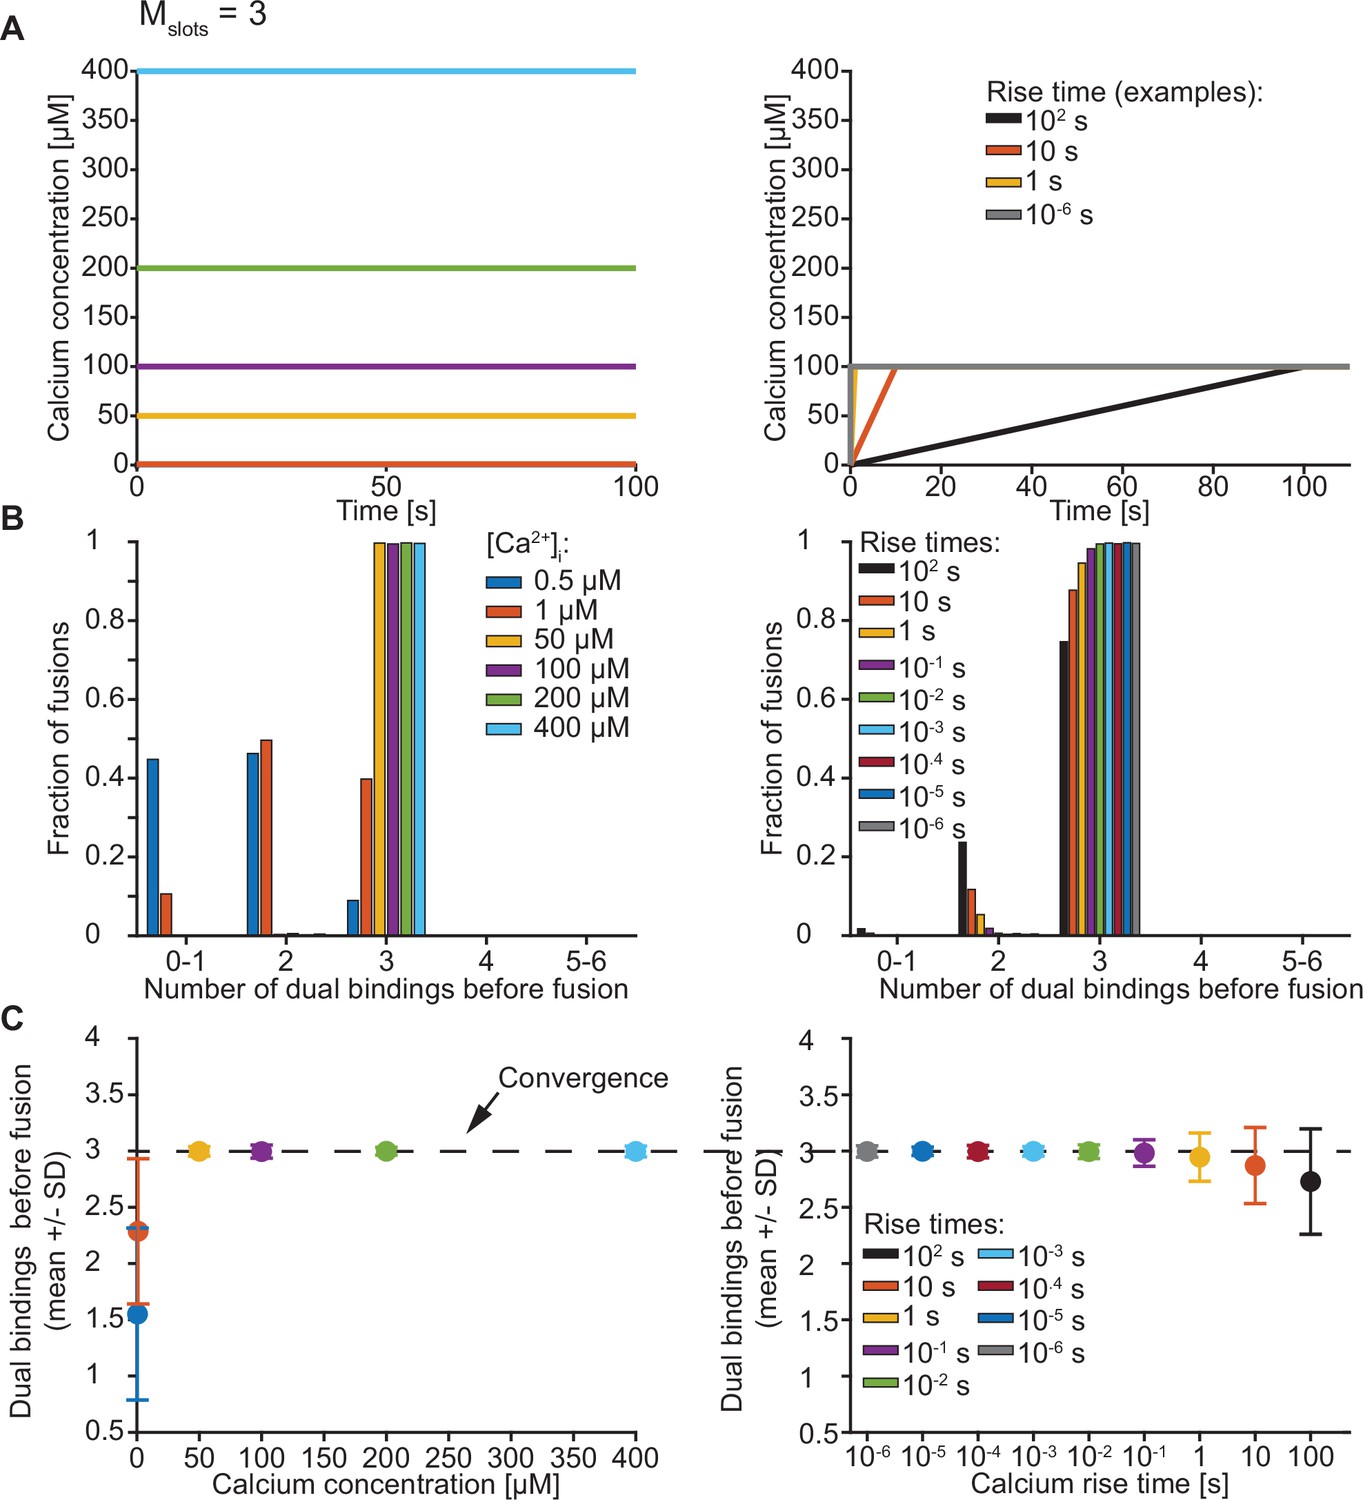
Exploration of the number of dual bindings formed before fusion of an SV with Mslots = 3.
(A) The Ca2+ signal used in simulations with step (left) and ramp (right) Ca2+ stimuli. In simulations with step Ca2+, the concentration rises instantly at t=0 from the basal Ca2+ concentration of 50 nM to various constant concentrations. In simulations with ramp Ca2+, the Ca2+ concentration increases linearly from the basal concentration of 50 nM to 100 µM Ca2+ with various rise times. (B) The number of dual bindings formed before fusion for various Ca2+ concentrations (step Ca2+, left) or Ca2+ rise times (ramp Ca2+, right) as depicted in A. The bars show proportion of 10,000 stochastically simulated SVs. The number of dual bindings formed before fusion increased with increasing step Ca2+ concentrations and decreasing Ca2+ rise times. At high concentrations or fast rise times, most fusions took place after forming three dual bindings. (C) Average number of dual bindings formed before fusion in simulations of 10,000 SVs with Ca2+ signals as depicted in A. The average number of dual bindings formed before fusion increases with increasing step Ca2+ concentration and decreases with increasing Ca2+ rise time. A plateau is reached at an average of three dual bindings at high step Ca2+ concentrations and low rise times. Error bars show ± standard deviation.
Figure 2—figure supplement 3
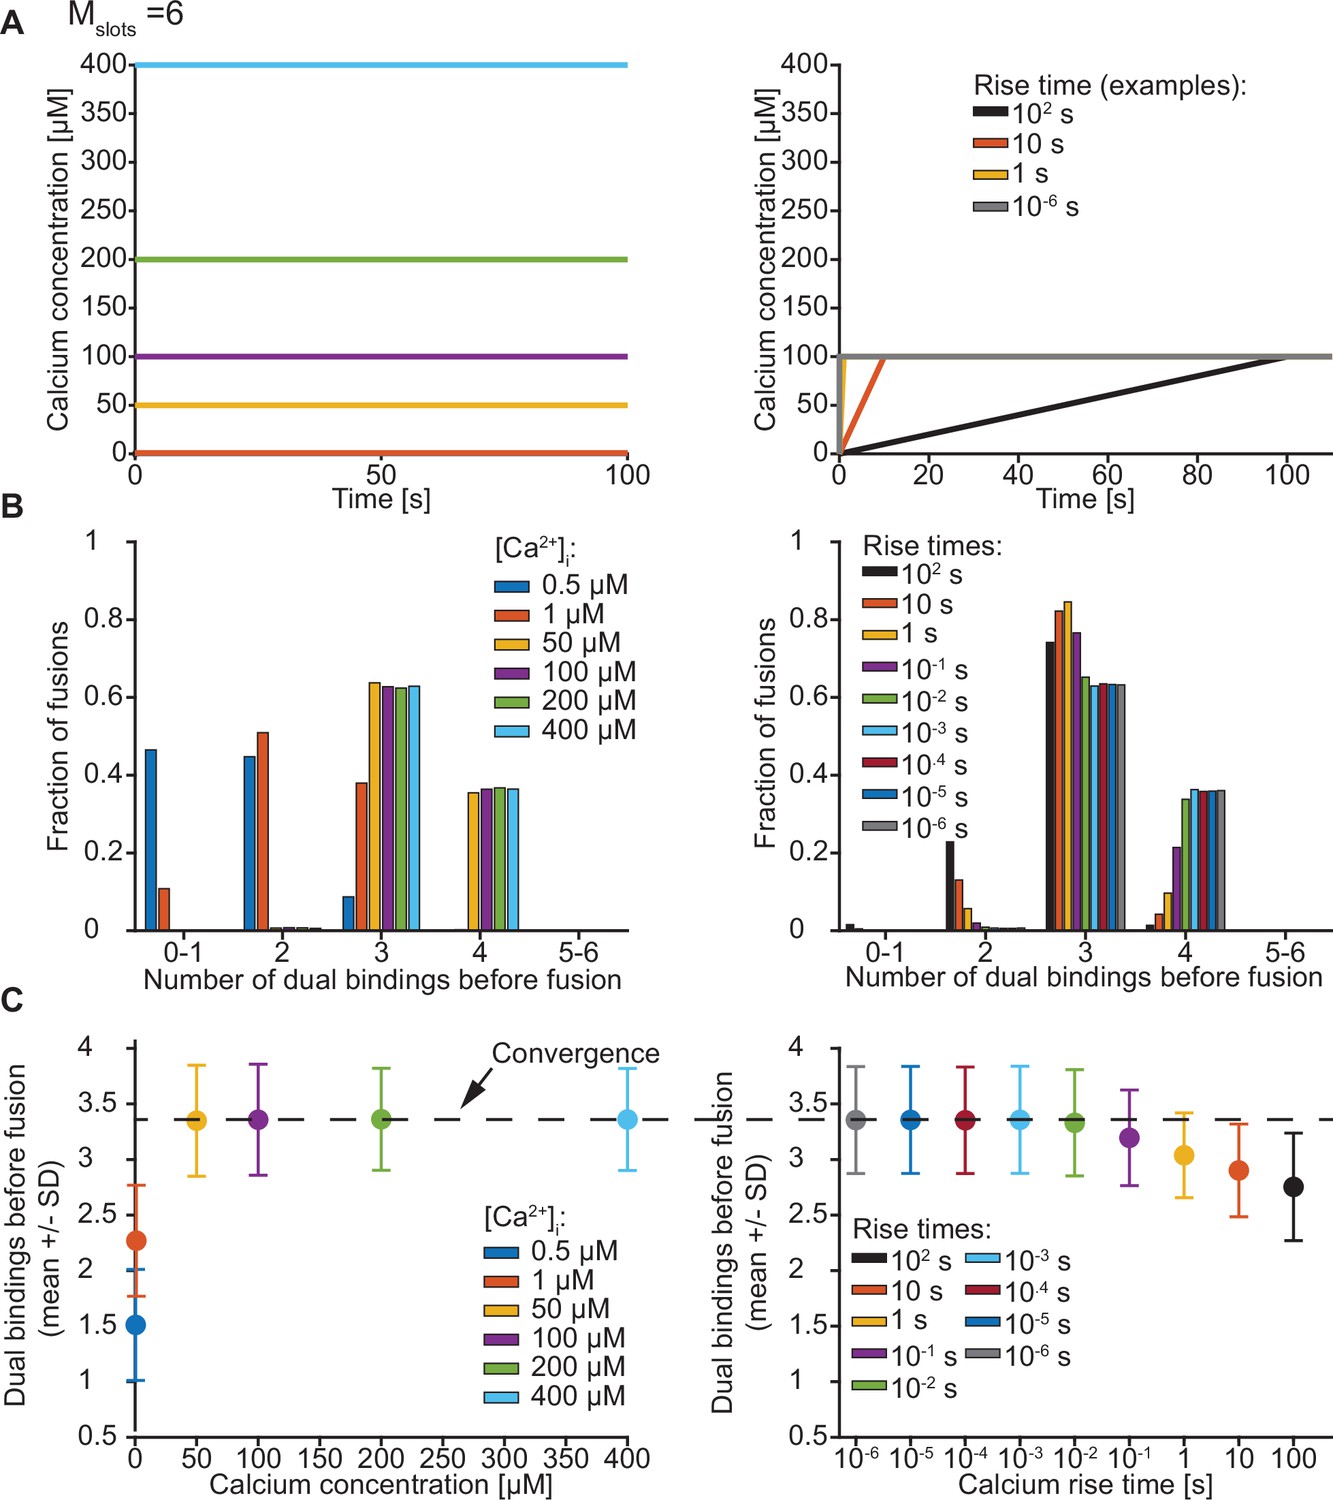
Exploration of the number of dual bindings formed before fusion of an SV with Mslots = 6.
(A) The Ca2+ signal used in simulations with step (left) and ramp (right) Ca2+ stimuli. In simulations with step Ca2+, the concentrations rises instantly at t=0 from the basal Ca2+ concentration of 50 nM to various constant concentrations. In simulations with ramp Ca2+, the Ca2+ concentration increases linearly from the basal concentration of 50 nM to 100 µM Ca2+ with various rise times. (B) The number of dual bindings formed before fusion for various Ca2+ concentrations (step Ca2+, left) or Ca2+ rise times (ramp Ca2+, right) as depicted in A. The bars show percentages of 10,000 stochastically simulated SVs. The number of dual bindings formed before fusion increased with increasing step Ca2+ concentrations and decreasing Ca2+ rise times. At high concentrations or fast rise times, most fusions took place after forming three to four dual bindings. (C) Average number of dual bindings formed before fusion in simulations of 10,000 SVs with Ca2+ signals as depicted in A. The average number of dual bindings formed before fusion increases with increasing step Ca2+ concentration and decreases with increasing Ca2+ rise time. A plateau is reached at an average of 3.4 dual bindings at high step Ca2+ concentrations and low rise times. Error bars show ± standard deviation.
Figure 2—figure supplement 4
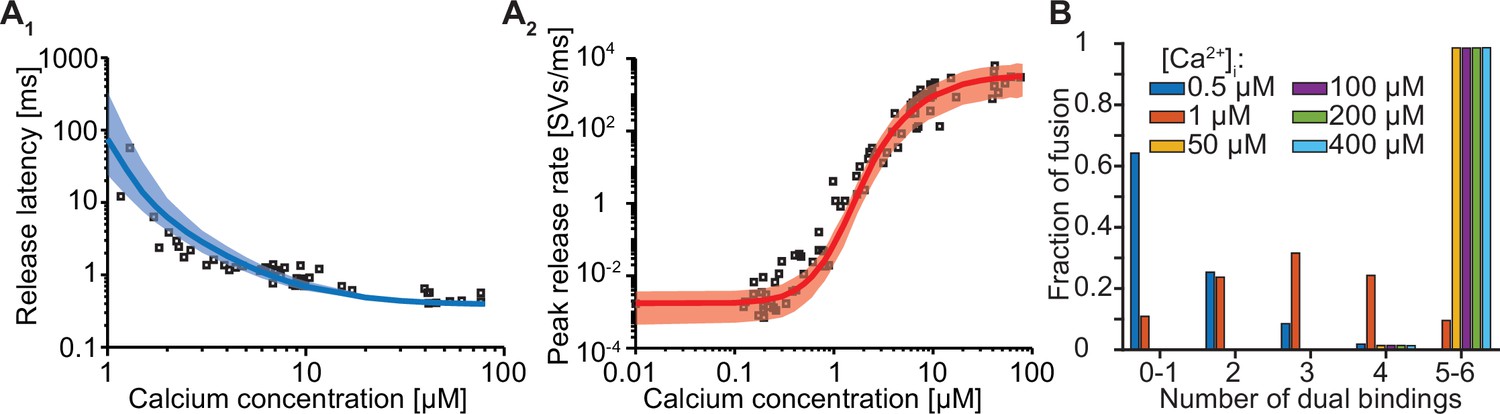
Forcing fusion from a state in which 5–6 syts are dual binding Ca2+ and PI(4,5)P2 causes a too steep Ca2+ dependency of the peak release rates.
(A) Best fit results for a model with 6 slots forced to show most fusion events when 5/6 dual-bounds were formed. We achieved this by setting f to a fixed value of 12.79 (computed following: , with being the best fit value at Mslots = 6 of f: 163.5) and we only fitted the four remaining parameters. The best fit results show larger deviation from the experimantally obtained release latencies (A1) and peak release rates (A2) compared to the initial fit with Mslots = 6 and f as a free parameter. Solid lines show median release latencies (A1) and mean peak release rates (A2) predicted by the model from 1000 repetitions per simulated [Ca2+]i. The shaded areas indicate the 95% prediction interval of the model. (B) Number of dual bindings formed before fusion for various Ca2+ concentrations. The bars show the proportion of 10,000 stochastically simulated SVs that fuse with a certain number of dual bindings formed. Most fusion events occur when five to six dual bindings have formed. Best fit parameters: α=22.96 µM–2s–1, γ=0.49 µM–1s–1, [PI(4,5)P2]=12.71 µM, f=12.79 (fixed), d=0.3850ms. Experimental data points in the figures are replotted from Kochubey and Schneggenburger, 2011.
Figure 2—figure supplement 5
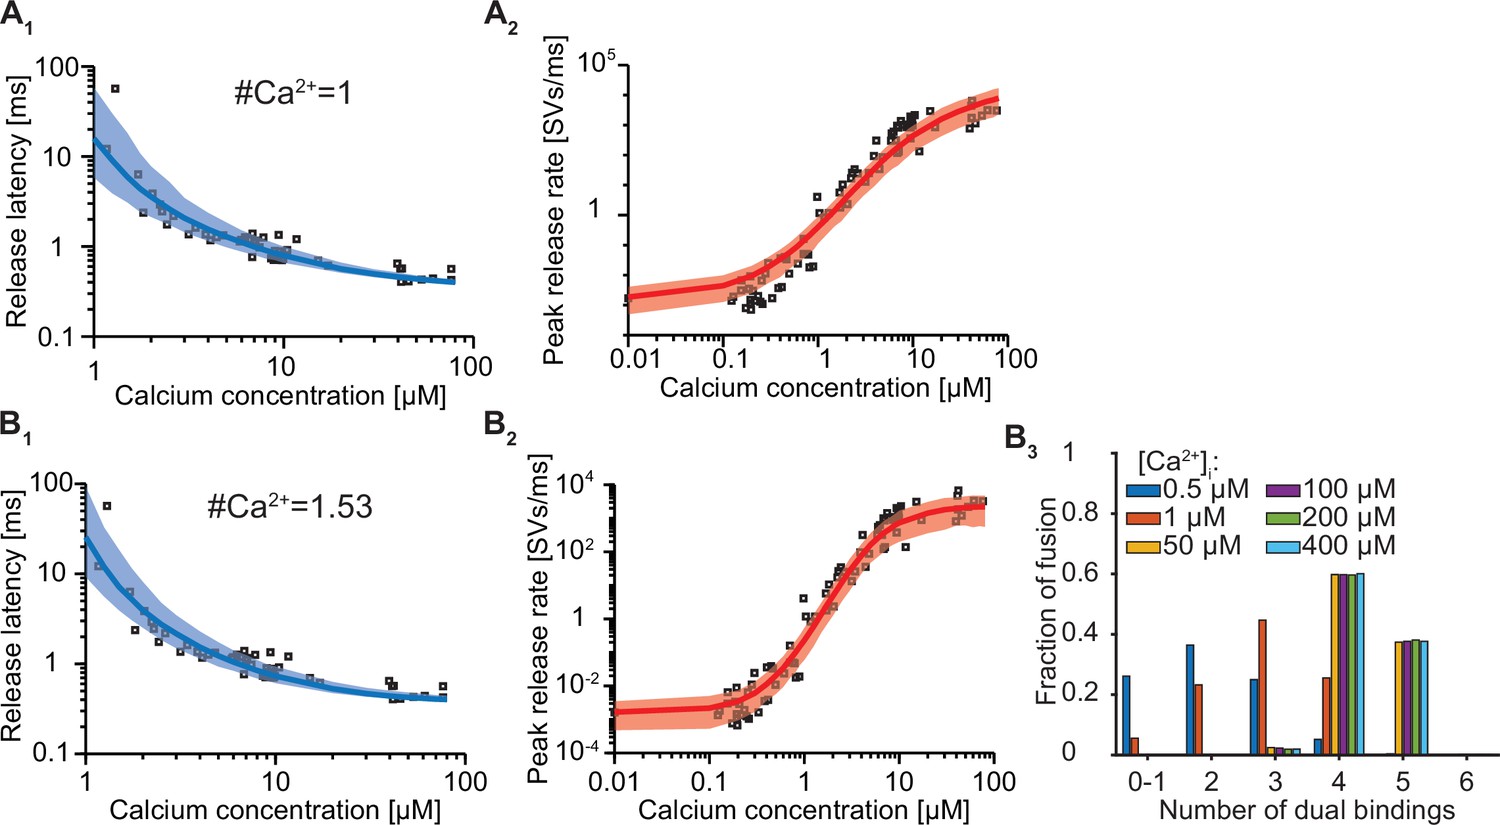
Exploration of how the estimated number of dual binding syts for fusion depends on the number of Ca2+ ions bound to one C2B domain.
(A) The best fit results for a model with six slots and only 1 Ca2+ ion binding per syt. Solid lines indicate median release latencies (A1) and mean peak release rates (A2). Shaded area shows 95% prediction interval. Best fit parameters: number of Ca2+ ions = 1, α=30.86 μM–1s–1, γ=1.56e9 μM–1s–1, [PI(4,5)P2]=0.85 μM, f=17.25, d=0.33ms. (B) The best fit results for a model with six slots and having the number of Ca2+ ions binding per syt (the exponent on the Ca2+ concentration) as a free parameter. B1, B2 show release latencies and peak release rates, respectively. B3 shows the number of dual bindings formed before fusion for various Ca2+ concentrations. The bars show the proportion of 10,000 stochastically simulated SV fusions for each number of dual bindings formed. Most fusion events occurred when four dual bindings were formed. Best fit parameters: number of Ca2+ ions = 1.53, α=82.7 μM-1.53s–1, γ=116.2 μM–1s–1, [PI(4,5)P2]=0.43 μM, f=45.2, d=0.37ms. Experimental data points in the figures are replotted from Kochubey and Schneggenburger, 2011.
Figure 2—figure supplement 6
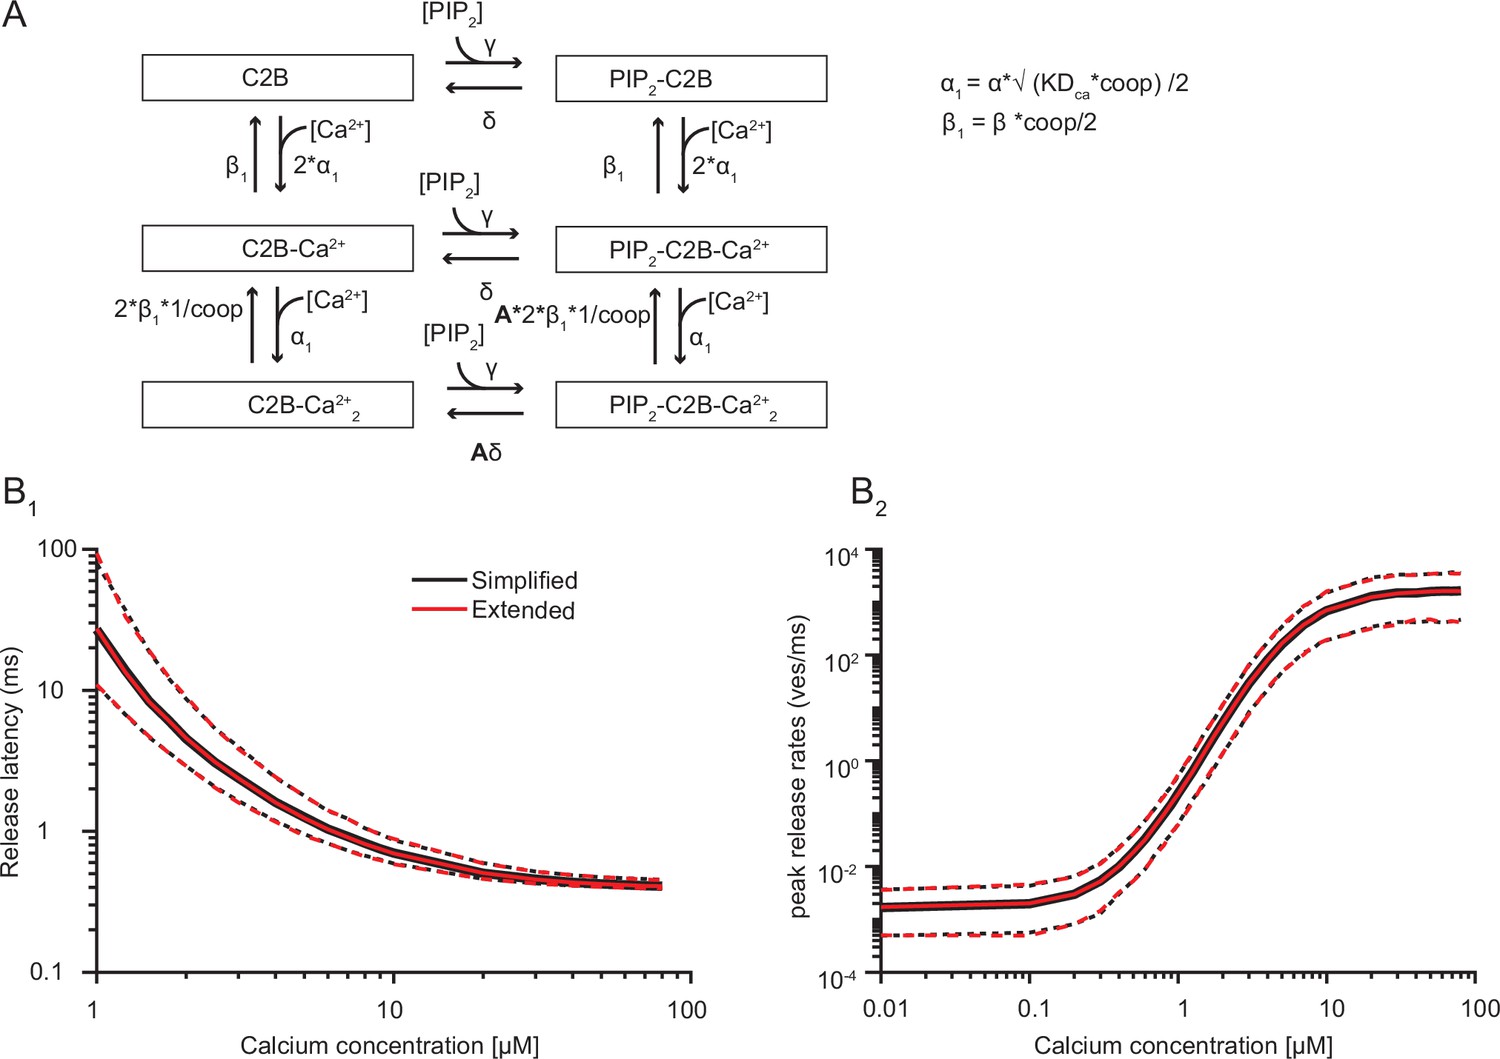
A model with two sequential Ca2+ binding steps compared to the simplified model with the simultaneous binding of two Ca2+ ions.
(A) Extended reaction scheme of a single syt C2B domain in which Ca2+ binding occurs in two separate steps. Unbinding of the second Ca2+ binding step is reduced by the factor 1/coop. The allosteric interaction between Ca2+ and PI(4,5)P2 is only induced once both Ca2+ ions are bound. Similarly, the energy barrier is only reduced once the two Ca2+ ions and PI(4,5)P2 are bound. The equations on the right show how the new model parameters (indicated by the subscript 1) are computed from the parameters in the simplified reaction scheme. (B) Simulation results from the simplified reaction scheme (black) and extended reaction scheme (red). For these simulations the best fit parameters from fitting with three slots were used. For these simulations, the coop was set to 5e4. It was not possible to simulate a model including sequential Ca2+ binding with 15 syts. Therefore, the model was simplified to contain 6 syts and the PI(4,5)P2 concentration was increased to 3.33 µM to compensate this (Figure 5—figure supplement 2). Solid lines indicate median and mean release latencies and peak release rates, respectively. Dotted lines indicate 95% prediction intervals.
Figure 2—figure supplement 7
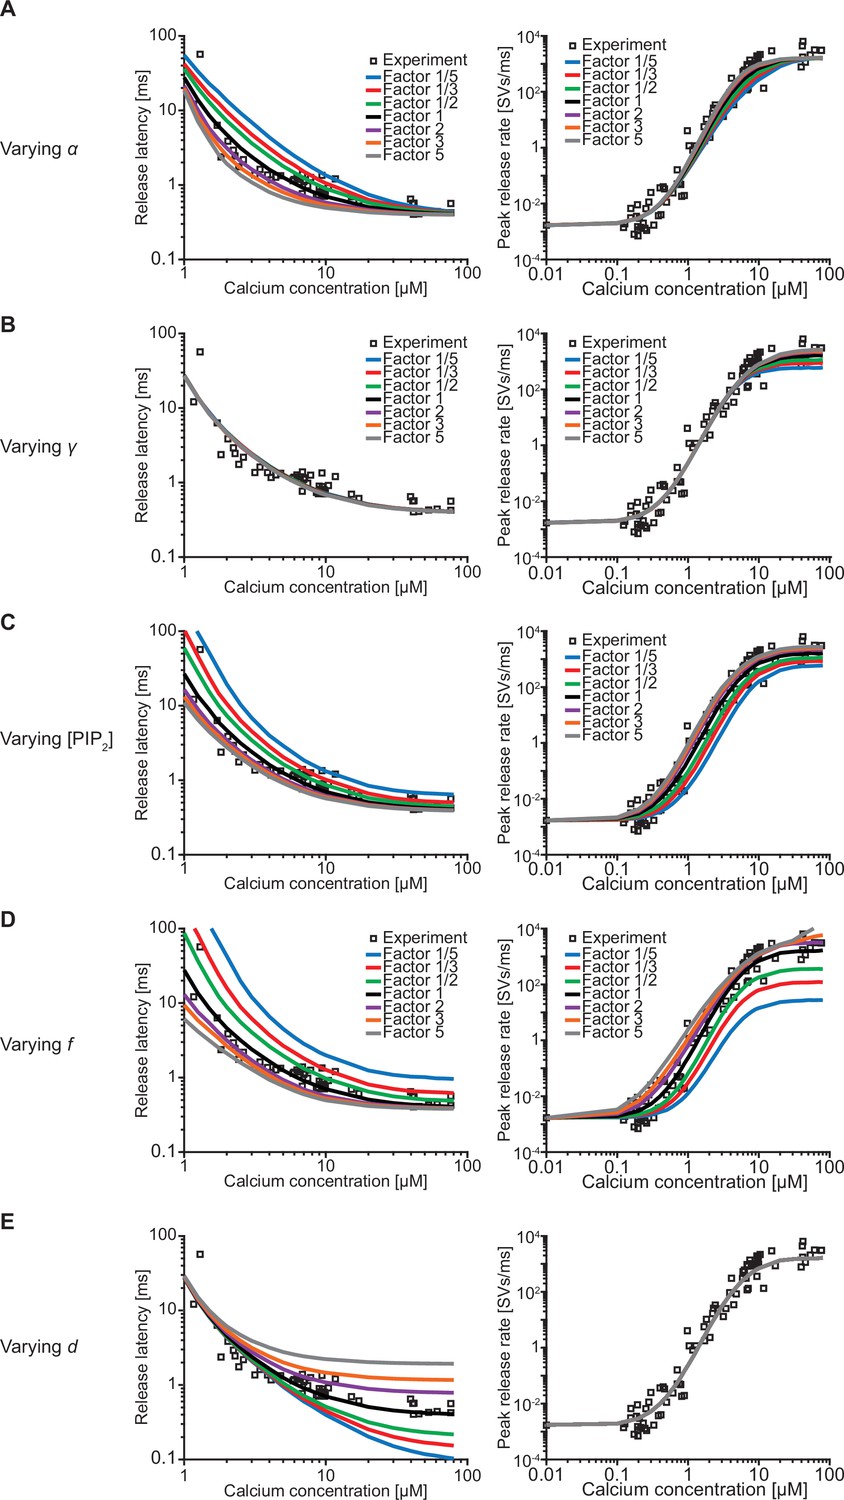
Effect of the free parameters on release latencies and peak release rates.
(A–E) Effect on release latencies (left) and peak release rates (right) when varying α (A), γ (B), [PI(4,5)P2] (C), f (D), and d (E). The best-fit values of each of the parameters were increased and decreased by a factor 2, 3, and 5. Varying α and γ leads to a change in β and δ so that the measured affinities for both Ca2+ and PI(4,5)P2 are still matched (van den Bogaart et al., 2012). (A) When varying α the release latency is mostly affected in the middle range of [Ca2+]i. The effect on the peak release rates is very small. (B) Varying γ has no effect on release latencies. The effect of varying γ on peak release is larger at high [Ca2+]i compared to low [Ca2+]i reflecting that at high [Ca2+]i PI(4,5)P2 binding limits dual binding formation. (C) Varying [PI(4,5)P2] has a large effect on the release latencies and peak release rates. The effect of varying [PI(4,5)P2] is much larger compared to varying γ, as changing [PI(4,5)P2] only affects the binding rate of PI(4,5)P2, whereas changing γ leads to an equal change in δ to match the published affinity values. Consequently, [PI(4,5)P2] affects the steady state distribution. (D) Varying f has a large effect on both release latency and fusion rate, as it directly impacts the effect of dual binding formation on SV fusion rates. (E) Varying the added delay, d, only shifts the release latencies linearly and does not affect the peak release rates. Experimental data points in these figures are replotted from Kochubey and Schneggenburger, 2011.
Figure 3 with 1 supplement
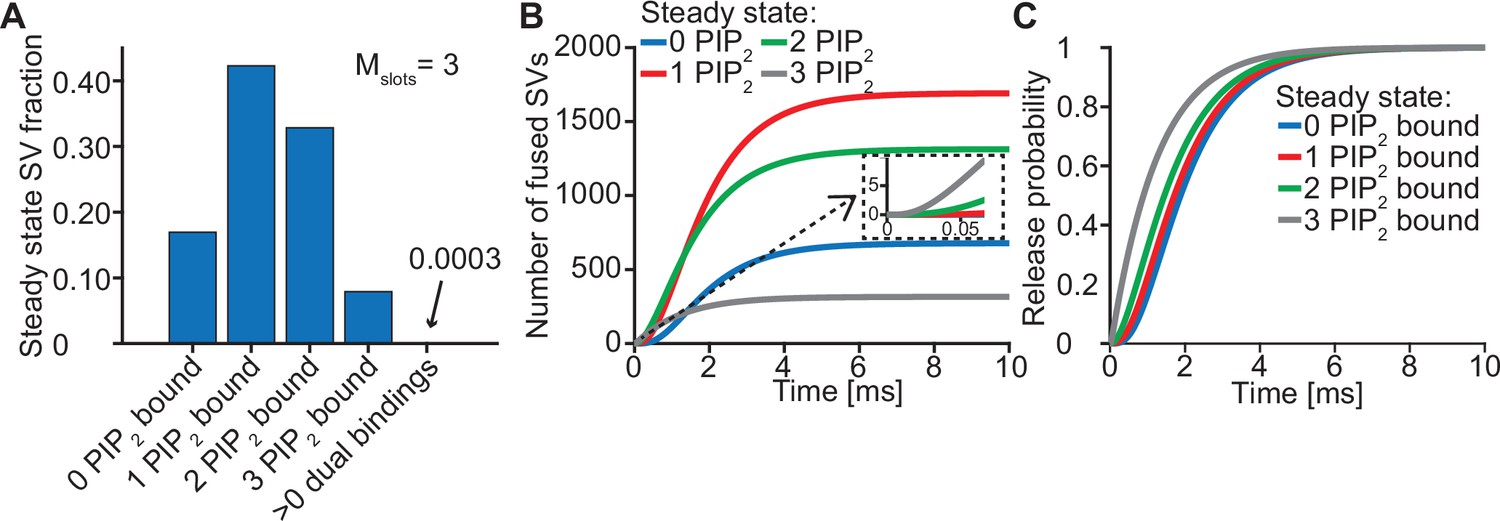
Syts binding to PI(4,5)P2 prior to Ca2+ stimulus underlies very fast SV fusion.
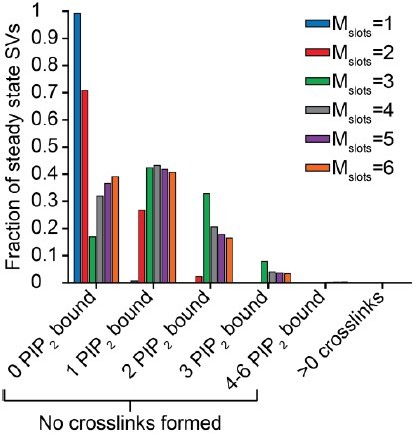
(A) PI(4,5)P2 binding status of SVs at steady state. At resting [Ca2+]i of 50 nM, more than 40% of SVs have bound a single PI(4,5)P2 molecule (not including those that have formed a dual binding), more than 30% have bound two PI(4,5)P2, while less than 10% have bound three PI(4,5)P2. Close to no SVs form dual bindings at steady state. (B) Cumulative fusion of SVs after 50 µM step Ca2+ at t=0, grouped according to their initial PI(4,5)P2 binding state. During the first ~0.5ms, release is dominated by SVs having two or three syts bound to PI(4,5)P2 prior to the stimulus. The insert shows that the SVs having prebound three PI(4,5)P2 constitute the majority of the first five SVs that fuse in response to the Ca2+ step and therefore largely impact the release latency. (C) Cumulative release probability of SVs over time after 50 µM step Ca2+ at t=0, grouped according to initial PI(4,5)P2 binding state. The dominance of SVs having pre-bound to PI(4,5)P2 with two or three syts in panel B is explained by their high release probability compared to SVs with no or only one PI(4,5)P2 bound. Figure 3—figure supplement 1 shows the same analysis for a model with Mslots = 6. Simulation scripts can be found in Source code 1. Depicted simulation results can be found in Figure 3—source data 1.
-
Figure 3—source data 1
Source data for Figure 3 and Figure 3—figure supplement 1.
- https://cdn.elifesciences.org/articles/74810/elife-74810-fig3-data1-v2.xlsx
Figure 3—figure supplement 1
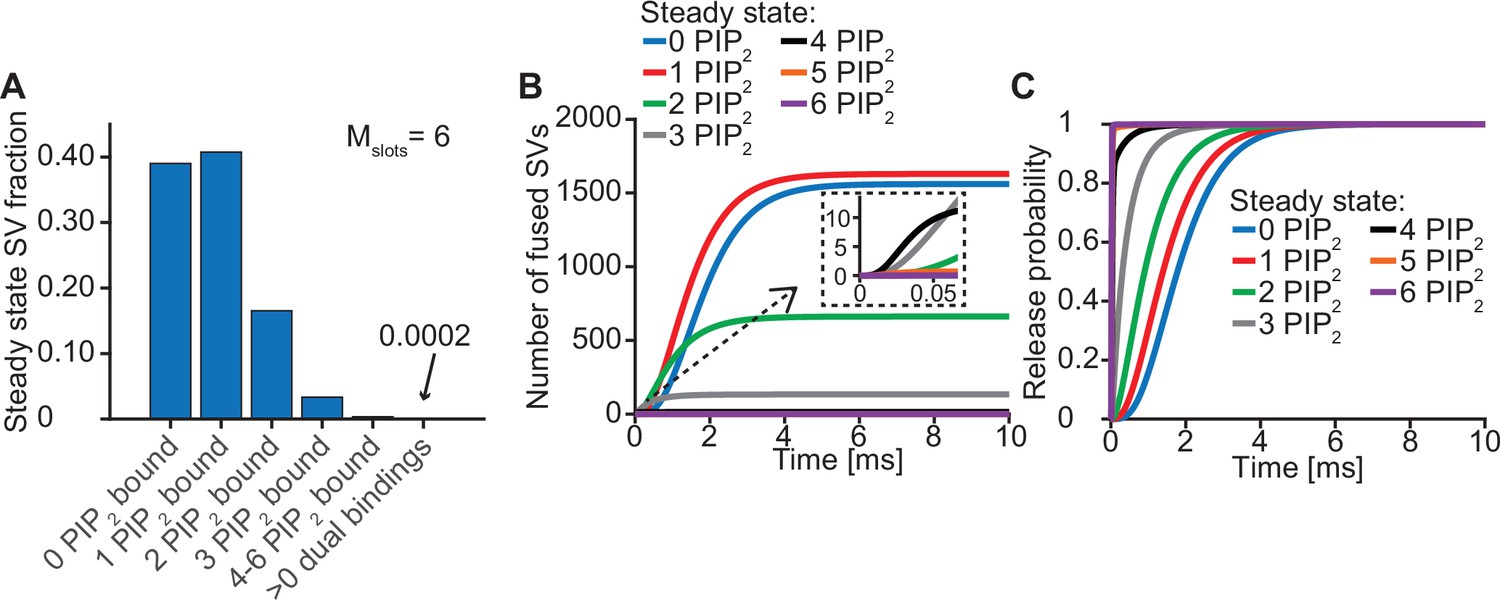
Syts binding to PI(4,5)P2 prior to the Ca2+ stimulus underlies very fast SV fusion (model with Mslots = 6).
(A) PI(4,5)P2 binding status of SVs at steady state. At resting [Ca2+]i of 50 nM, more than 40% of SVs have bound a single PI(4,5)P2 molecule (not including those that have formed a dual binding), more than 15% has bound two PI(4,5)P2, while less than 5% has bound three PI(4,5)P2. Very few SVs have bound more than 3 PI(4,5)P2 and almost no SVs form dual bindings at steady state. (B) Cumulative fusion of SVs after 50 µM step Ca2+ at t=0, grouped according to their initial PI(4,5)P2 binding state. During the first ~0.5ms, release is dominated by SVs having two or three syts bound to PI(4,5)P2 prior to the stimulus. The zoom-in shows that the SVs having three or four syts prebound to PI(4,5)P2 constitute the majority of release of the first five SVs and therefore determines the release latency. (C) Cumulative release probability over time of SVs after 50 µM step Ca2+ at t=0, grouped according to initial PI(4,5)P2 binding state. The dominance of SVs having pre-bound to PI(4,5)P2 with two to four syts in panel B is explained by their high release probability compared to SVs with no or only one PI(4,5)P2 bound.
Figure 4 with 1 supplement
The positive allostericity between Ca2+ and PI(4,5)P2 allows multiple syt C2B domains to engage in Ca2+/PI(4,5)P2 dual binding.
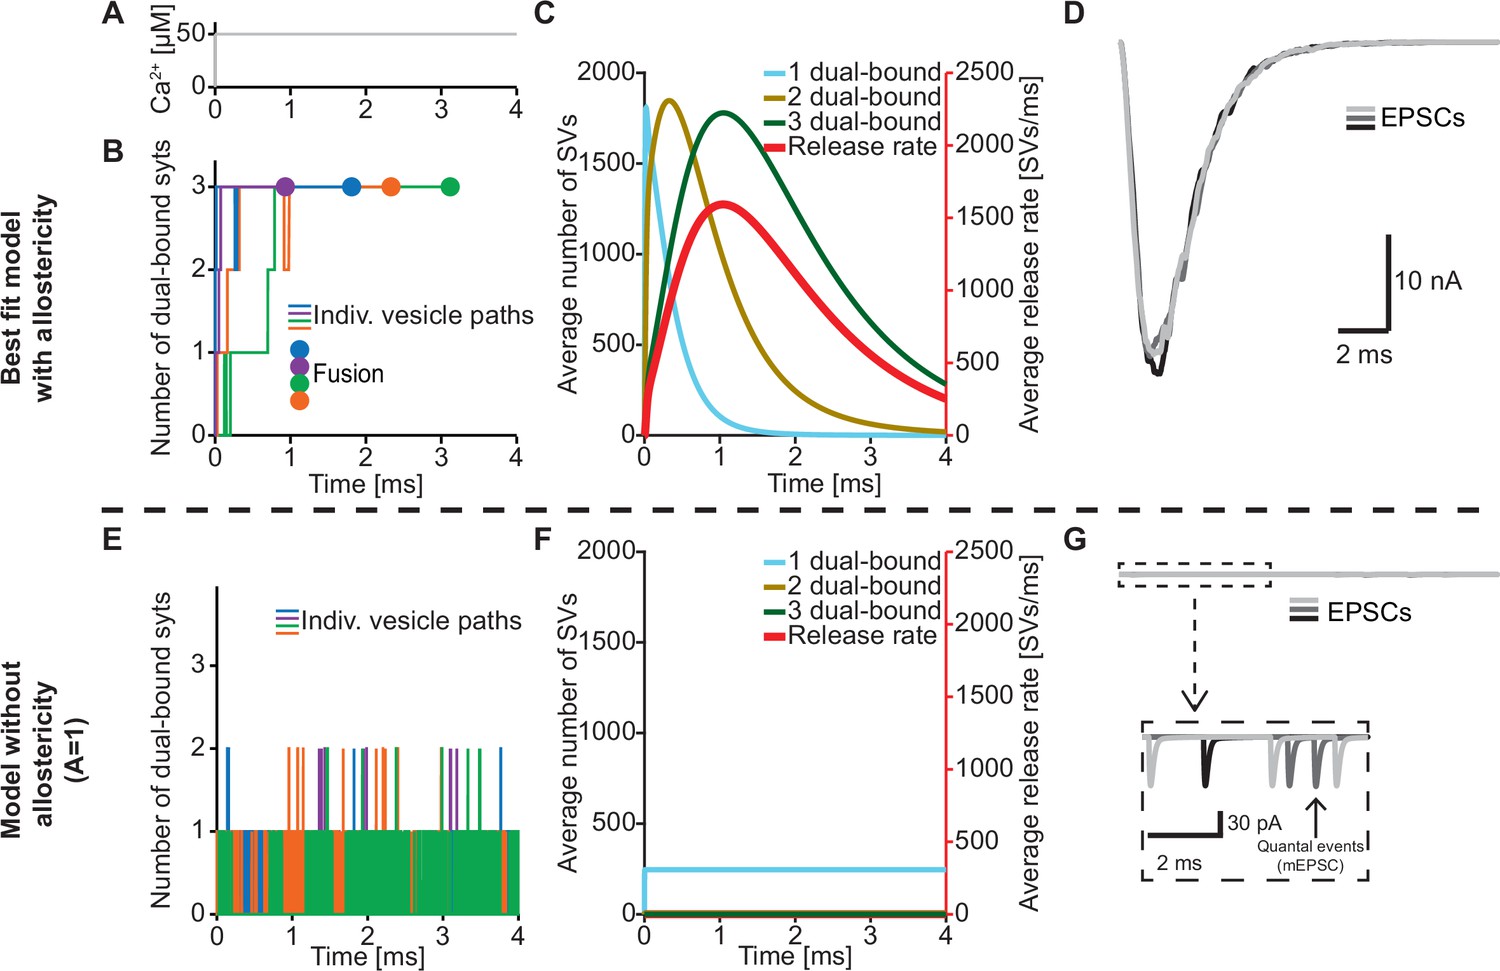
(A) Ca2+ signal used in simulations ([Ca2+]i=50 µM). This constant Ca2+ concentration was used for all simulations depicted in this figure. (B) The path towards fusion for four example SVs using stochastic simulations of the best fit model (with allostericity). The differently colored graphs show the number C2B domains engaging in Ca2+/PI(4,5)P2 dual binding for the four example SVs. The large dots indicate SV fusion. (C) Average number of SVs having one (blue), two (olive) and three (green) C2B domains engaging in Ca2+/PI(4,5)P2 dual binding and the fusion rate (red) over time in simulations including the entire RRP. In the best fit model, the number of SVs with three syts dual-binding Ca2+/PI(4,5)P2 peaks approximately at the same time as the fusion rate. The decrease in number of SVs with one or two C2B domains dual binding Ca2+/PI(4,5)P2 reflects formation of additional dual bindings. The decrease in total number of SVs is caused by fusion of RRP vesicles. (D) Excitatory Postsynaptic Currents (EPSCs) from three stochastic simulations with a fixed RRP size of 4000 SVs. The model predicts synchronous EPSCs with a small variation caused by the stochasticity of the molecular reactions. (E) The path towards fusion for four example SVs (similar to panel A) in the model without allostericity in stochastic simulation. All parameters other than the allosteric factor, A, are the same as in the best fit model. Without stabilization, the syts quickly engage and disengage in Ca2+/PI(4,5)P2 dual binding and rarely more than one syt engages in dual binding. Formation and dissociation of individual dual-bound syts is too fast to distinguish on the time scale depicted here. No fusions occurred in the depicted simulations. (F) Average number of SVs having one (blue), two (olive) and three (green) syts engaging in Ca2+/PI(4,5)P2 dual binding and the fusion rate (red) over time in the model without allostericity. Almost no SVs form more than one dual binding, which results in a very low fusion rate. (G) EPSCs from three stochastic simulations and with a fixed RRP size of 4000 SVs. A model lacking allostericity only shows sporadic, individual release events. The insert shows a zoom-in of the first 6ms of simulation and makes single SV fusion events giving rise to quantal, ‘miniature’ mEPSCs visible. Fitting the model without the allosteric effect to the experimental data was unsuccessful (Figure 4—figure supplement 1). Simulation scripts can be found in Source code 1. Results from fitting the model without allosteric effect can be found in .
Figure 4—figure supplement 1

Fitting of the model without allosteric interaction between Ca2+ and PI(4,5)P2 fails to reproduce the Ca2+ dependency of NT release.
(A–B) The best fit results for a model with 3 slots and no allosteric interaction between Ca2+ and PI(4,5)P2 (A=1). In A the median release latency and the 95% prediction interval of the best fit model are shown. Note that the y-axis range is different from Figure 2A, but the proportions of the ticks is maintained to help comparison. (B) The mean peak release rate as a function of [Ca2+]i and the corresponding 95% prediction interval. Best fit parameters used to generate these curves are: α=2.174 µM–2s–1, γ=6.773·105 µM–1s–1, [PI(4,5)P2]=2991 µM, f=3.943·105, d=0.4036ms. Experimental data points in the figures are replotted from Kochubey and Schneggenburger, 2011. Similar to the best fit solutions with too few slots (Figure 2A, left), the fitted f value was extremely high, which forced quick SV fusion before the newly formed dual binding dissolved. Thus, when assuming realistic affinities for Ca2+ and PI(4,5)P2, the allosteric property of the syt C2B domain, which leads to a stabilization of the dual-bound state, is necessary to ensure high Ca2+ sensitivity of release.
-
Figure 4—figure supplement 1—source data 1
Source data for Figure 4—figure supplement 1.
- https://cdn.elifesciences.org/articles/74810/elife-74810-fig4-figsupp1-data1-v2.xlsx
Figure 5 with 2 supplements
Simulations with reduced syt expression predict a reduction in SV fusion.
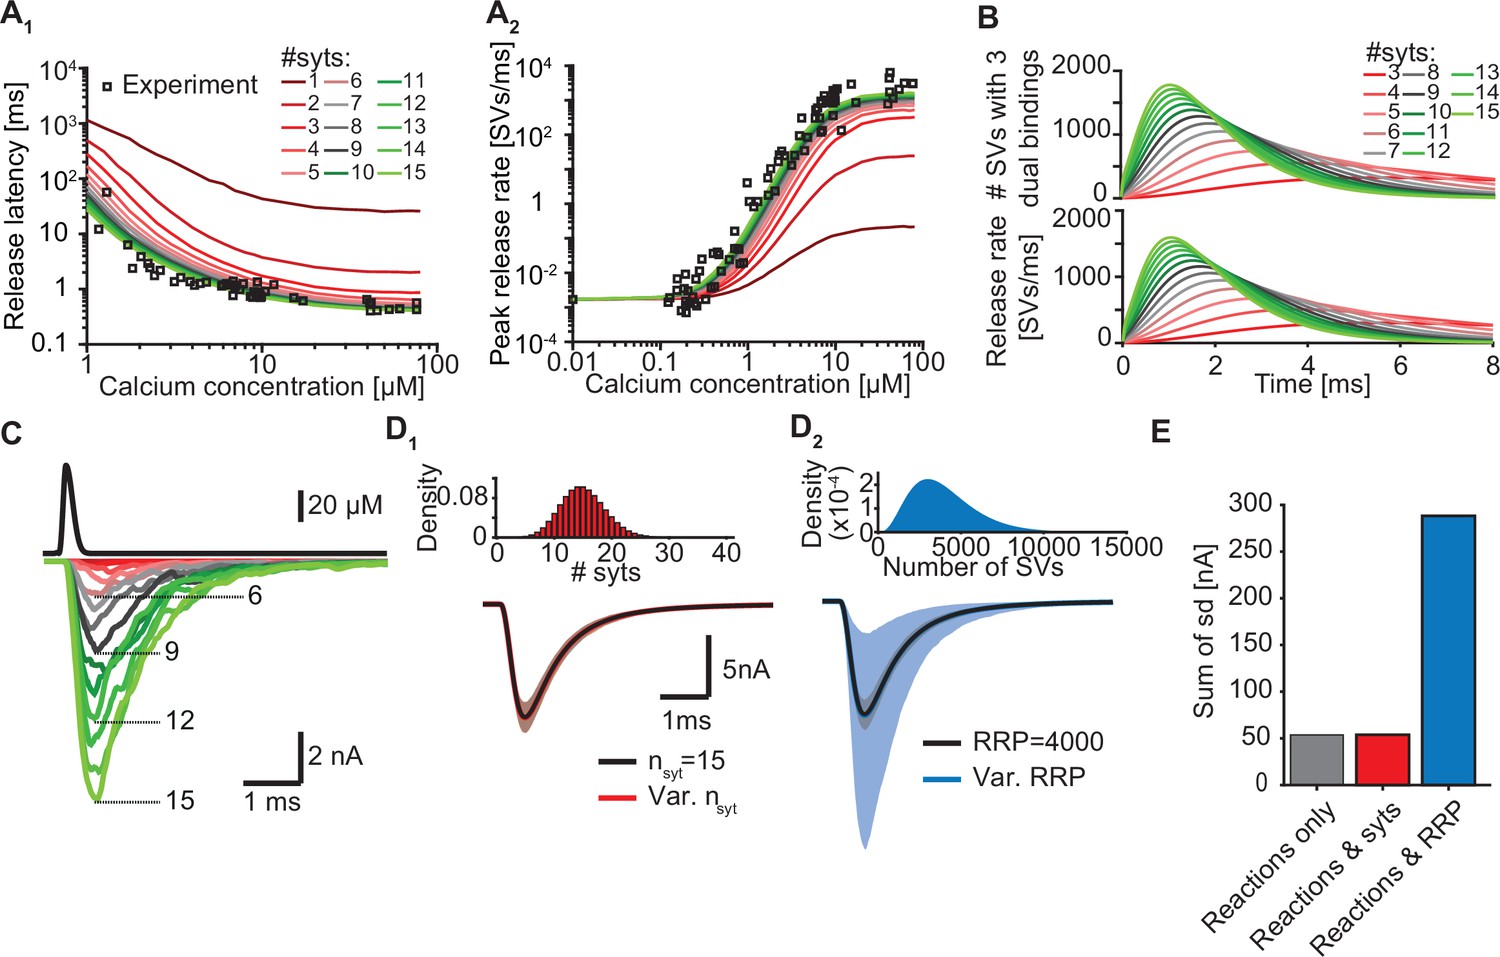
(A) Model predictions of median release latencies (A1) and mean peak release rates (A2) as a function of [Ca2+]i for different numbers of syts per SV. All simulations were performed with 1000 repetitions using the best fit parameters obtained by fitting with nsyts = 15 and Mslots = 3. Experimental data points are replotted from Kochubey and Schneggenburger, 2011. (B) The average number of SVs with three dual bindings formed (top) and release rate (bottom) as a function of time for 3–15 syt copies per SV from simulations with a Ca2+ flash of 50 µM. (C) Predicted AP-evoked responses (bottom) simulated using a realistic Ca2+ transient (top) (Wang et al., 2008) for different numbers of syts per SV. The AP-evoked response shown at the bottom are representative single stochastic simulations with an amplitude closest to the mean amplitude of 200 repetitions. Increasing [PI(4,5)P2] for each choice of nsyt ≥3 could fully rescue release latencies, release rates, and evoked responses (Figure 5—figure supplement 2). (D) Variability in simulated AP-evoked responses for a model with a variable number of syts and an RRP size of 4000 (D1, red, bottom) and a model with a variable RRP size and 15 syts per SV (D2, blue, bottom) compared to the variance induced by the stochasticity of the reactions only (with fixed number of SVs and syts, grey). Solid lines depict mean traces and the shaded area indicates the 95% prediction interval. Simulations were with 1000 repetitions. Top panels show the probability density distributions of the number of syts (Poisson distribution, lambda = 15) and of the number of SVs (gamma distribution, mean of 4000 SVs, standard deviation of 2000 SVs, outcome rounded to nearest integer). (E) Quantification of the variance in the traces introduced by the stochasticity of the model reactions (grey), by the stochasticity of model reactions and variable syt number (red), and by the stochasticity of model reactions and variable RRP size (blue) by computing the sum of the standard deviation (sd) determined over the entire trace (0–6ms, 300 data points). Simulation of the individual syts using the Gillespie algorithm agreed with simulations using the analytical solution of the Markov model (Figure 5—figure supplement 1 and Methods). Simulation scripts can be found in Source code 1. Simulation results shown in this figure can be found in Figure 5—source data 1.
-
Figure 5—source data 1
Source data for Figure 5 and Figure 5—figure supplement 1, Figure 5—figure supplement 2.
- https://cdn.elifesciences.org/articles/74810/elife-74810-fig5-data1-v2.xlsx
Figure 5—figure supplement 1

Comparing the two different model implementations.
QQ-plots comparing the first five fusion times obtained using stochastic simulations with an implementation based on the closed-form solution of the model and using the Gillespie algorithm for three different [Ca2+]i (see Materials and methods). The black line represent 1:1 correspondence, which would only happen in deterministic simulations. Red squares indicate fusion time simulated with both methods for 1000 repetitions.
Figure 5—figure supplement 2
Upregulation of PI(4,5)P2 can compensate for loss of syts.
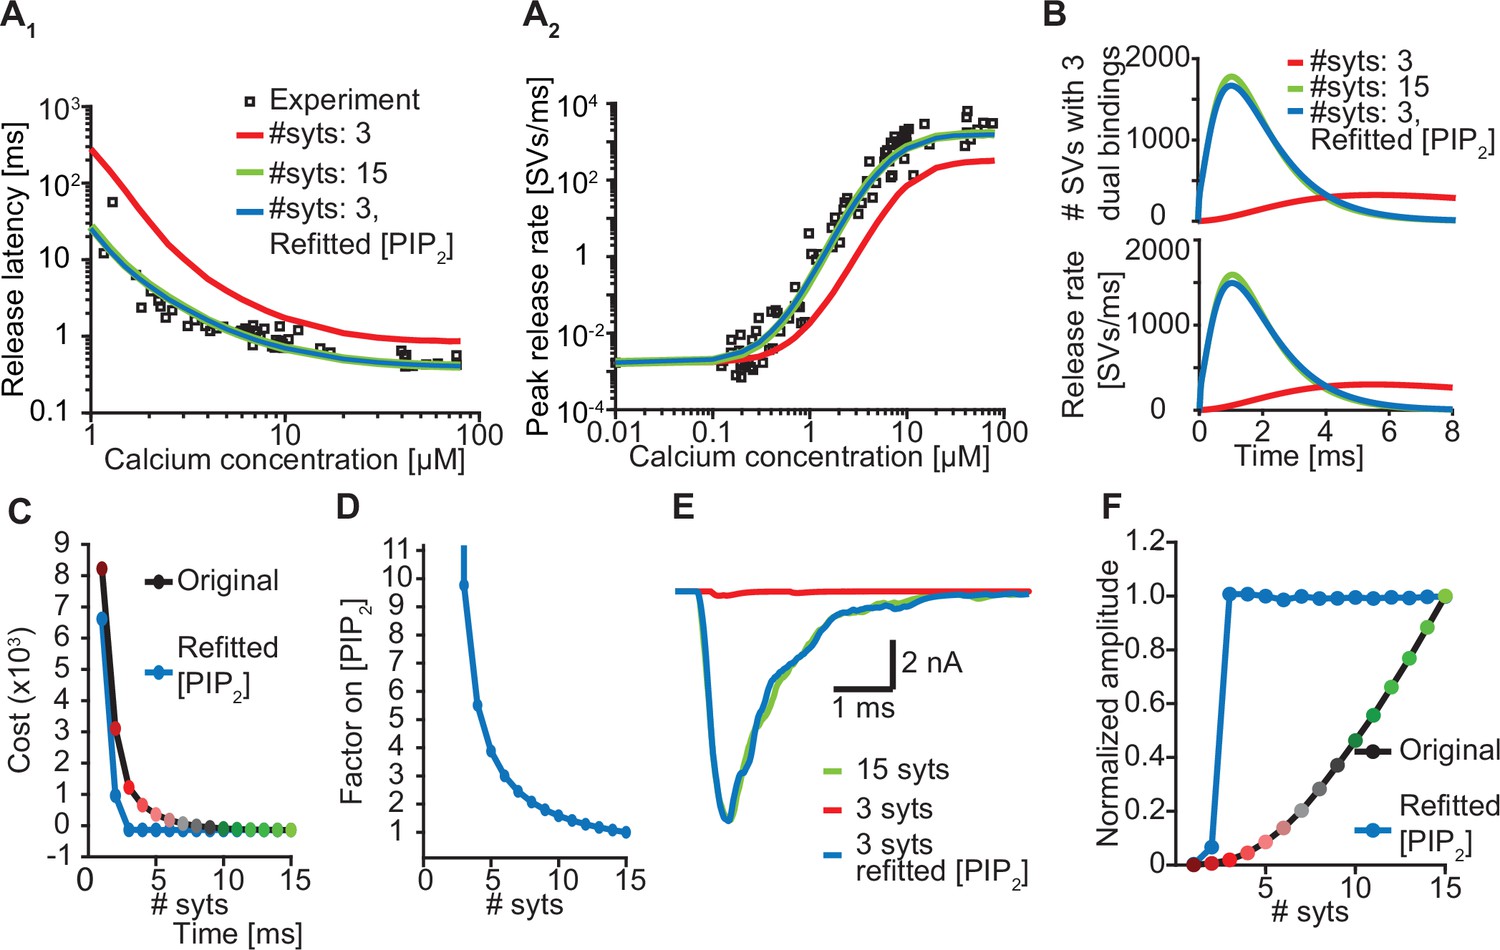
(A) Release latencies (A1) and peak release rates (A2) for a model with 15 syts (green) and with 3 syts before (red) and after (blue) refitting of [PI(4,5)P2]. Experimental data points in panels A are replotted from Kochubey and Schneggenburger, 2011. (B) The average number of SVs with three dual bindings formed (top) and the corresponding release rates (bottom) as a function of time upon stimulation with a Ca2+ flash of 50 µM for a model with 15 syts (green), and with 3 syts before (red) and after (blue) refitting of [PI(4,5)P2]. (C) The cost values associated with the Ca2+ uncaging data for different levels of syt with the original best fit parameters (black line) and after refitting [PI(4,5)P2] for each choice of nsyts (blue line). (D) The fold-increase in [PI(4,5)P2] obtained by refitting the model as a function of the number of syts. (E) Representative AP-evoked response of a model with 3 syts per SV obtained after increasing [PI(4,5)P2] plotted together with representative responses for a model with 3 and 15 syts with the original [PI(4,5)P2]. (F) Average amplitudes of simulated AP-evoked responses at original [PI(4,5)P2] and using the increased values.
Figure 6 with 1 supplement
Systematic evaluation of the effect of mutant syts on simulated AP-evoked fusion.
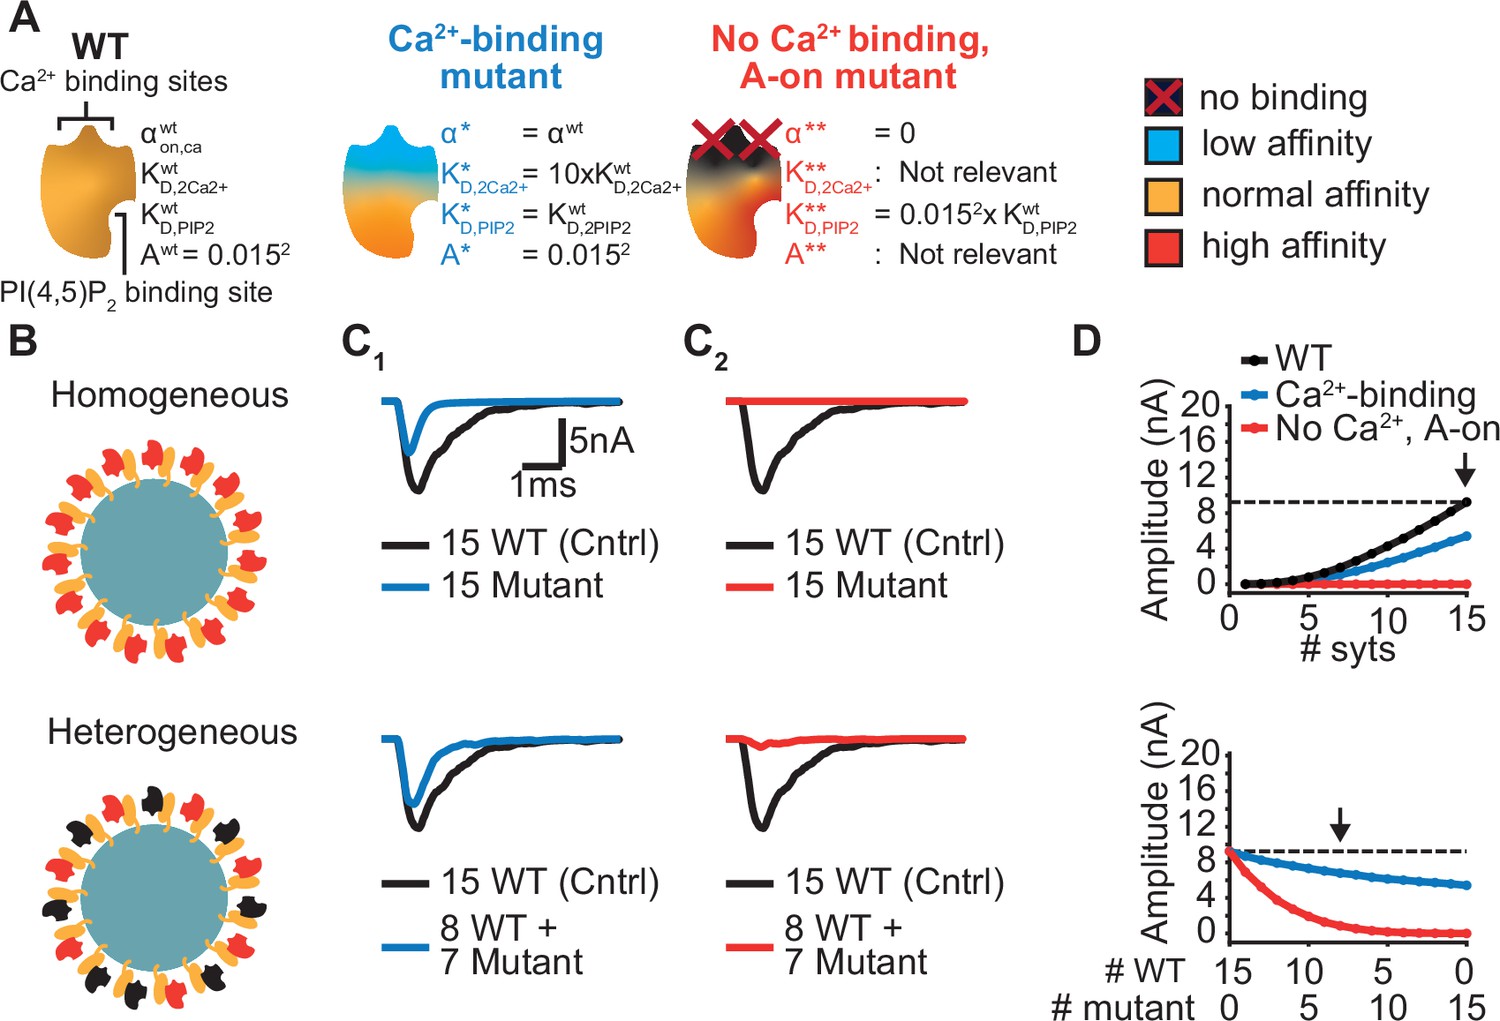
(A) Illustration of a WT syt and two mutant syts. The “Ca2+-binding” mutant has a lower affinity for Ca2+ (KD,2Ca2+ 10x increased, that is β 10 x increased). The “no-Ca22+ binding, A-on" mutant is not able to bind Ca2+ and has a high binding affinity for PI(4,5)P2, which is equal to the affinity for PI(4,5)P2 when the allostericity between Ca2+ and PI(4,5)P2 is “active” in WT syts (Ca2+-bound state). Because of the inability to bind Ca2+, allosteric interactions between Ca2+ and PI(4,5)P2 are not possible in this mutant. (B) Illustration of homogeneous (top) and heterogeneous expression (bottom) of the mutants. Mutant syts are depicted in red, WT syts are depicted in black. (C) Representative, stochastically simulated AP-evoked responses with homozygous (top, 15 mutant syt copies) and heterozygous (bottom, 8 WT and 7 mutant syt copies) expression of the different mutants (C1: ‘Ca2+-binding’ mutant, in blue; C2: ‘no Ca2+ binding, A-on’ mutant, in red). For each of the settings a representative trace of a condition with 15 WT syts is shown in black (control condition). A third mutation, the “no Ca2+ binding, A-off” was also explored (Figure 6—figure supplement 1). (D) Mean amplitudes of simulated AP-evoked responses (n=200) for the homogeneous (top) and heterogeneous (bottom) expression of the different mutants, and for WT syt (for homozygous condition only). Dotted line indicates the mean amplitude of simulated eEPSCs with 15 copies of WT syt (control). Arrow indicates the condition that is depicted in panels C. Simulation scripts can be found in Source code 1. Results from simulations can be found in Figure 6—source data 1.
-
Figure 6—source data 1
Source data for Figure 6 and Figure 6—figure supplement 1.
- https://cdn.elifesciences.org/articles/74810/elife-74810-fig6-data1-v2.xlsx
Figure 6—figure supplement 1
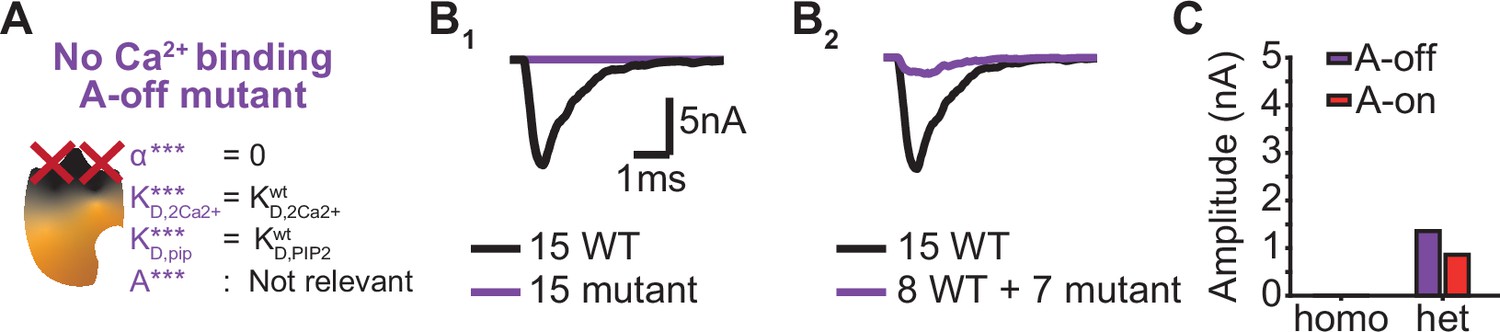
The dominant negative effect of a mutant that is unable to bind Ca22+ depend on the mutants PI(4,5)P2 affinity.
(A) Schematic illustration of the ‘No Ca2+ binding, A-off’ mutant, which is not able to bind Ca2+ implying that the allosteric interaction between Ca2+ and PI(4,5)P2 is always ‘inactive’. (B) Representative, stochastically simulated AP-responses with homozygous (left, 15 mutants) and heterozygous (right, 7 mutants +8 WT) expression of this mutant. For each of the examples, representative trace of a condition with 15 WT syts is shown in black. (C) Comparison of the mean amplitudes of AP-evoked responses (n=200) simulated with ‘No Ca2+ binding, A-off’ mutant to the mean amplitudes of the ‘No Ca2+ binding, A-on’ mutant (Figure 6).
Figure 7
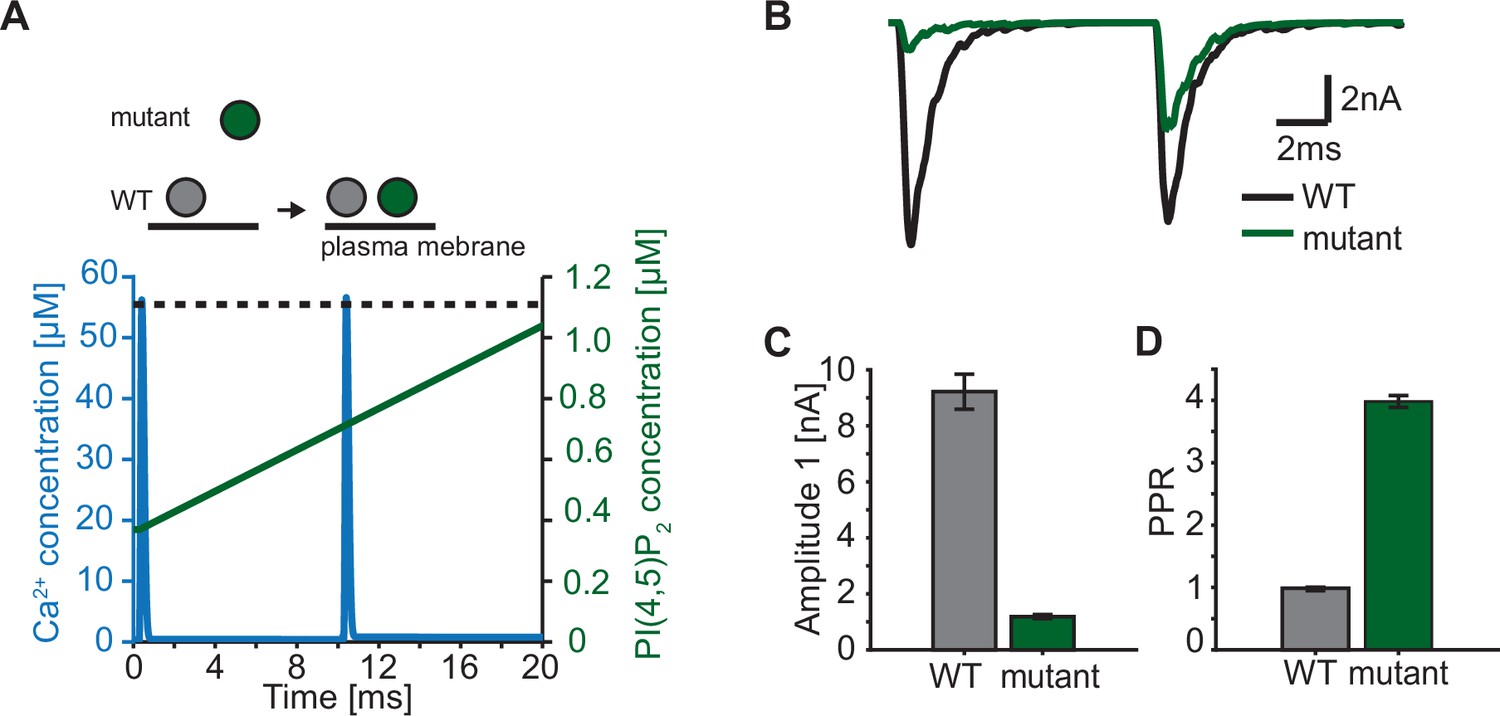
Paired-pulse stimulation in a membrane binding syt mutant.
(A) Time course of [Ca2+]i (blue) and [PI(4,5)P2](dashed black line: wildtype (WT), green line: mutant). Top panel illustrates the placement of vesicles with respect to the PM for SVs expressing WT syt (grey SVs) and SVs expressing a syt mutant deficient in membrane binding (green SVs, homozygous expression) before the first (left side of arrow) and second AP (right side of arrow). In WT conditions, most SVs reside close to the PM before the onset of the first stimulus. Before onset of the second pulse, WT SVs keep the same average distance to the PM. Mutant SVs, however, show a large distance to the PM at the onset of the first stimulus. Before the onset of the second AP, mutant SVs move closer to the PM due to a Ca2+-dependent mechanism (Chang et al., 2018). The bottom panel shows the Ca2+ (blue) and PI(4,5)P2 (green) transients over time in a paired pulse stimulus (10ms between stimuli). Due to the increased distance between the SV and the PM in the membrane binding mutant, mutant SVs are assumed to experience a lower [PI(4,5)P2] (solid green line) compared to WT SVs (dotted, black line) at the start of the first stimulus. Before the start of the second stimulus, mutant SVs move closer to the PM which increases the experienced [PI(4,5)P2] of these SVs. (B) Representative eEPSCs simulated using the Ca2+ and PI(4,5)P2 transients depicted in A. (C) Amplitude of the first eEPSC for WT and mutant. (D) Paired-pulse ratio (PPR) for WT and mutant. Data in C and D show mean ± SEM, using 50 repetitions and a variable RRP size (see Materials and methods for details, the same RRP values were used for both the mutant and the WT condition). Simulation scripts can be found in Source code 1. Depicted simulation results can be found in Figure 7—source data 1.
-
Figure 7—source data 1
Source data for Figure 7.
- https://cdn.elifesciences.org/articles/74810/elife-74810-fig7-data1-v2.xlsx
Author response image 1
Author response image 2

Author response image 3

Tables
Table 1
Fixed parameters in the model.
| Parameter | Description | Value | Reference |
|---|---|---|---|
| nsyts | Number of syts per SV | 15 | Takamori et al., 2006 |
| Mslots | Number of binding slots for syts to PI(4,5)P2 (see Figure 2) | Varied from 1 to 6 | This paper |
| nves | Number of RRP vesicles | Mean: 4000, sd: 2000, gamma distribution | Wölfel and Schneggenburger, 2003 |
| [Ca2+]0 | Resting [Ca2+]i | 0.05 µM | Helmchen et al., 1997 |
| KD,2Ca2+ | Dissociation constant of C2B for two Ca2+ ions | 2212 µM2 | van den Bogaart et al., 2012 |
| KD,PIP2 | Dissociation constant of C2B for PI(4,5)P2 | 20 µM | van den Bogaart et al., 2012 |
| A | Allosteric factor see Materials and methods for calculation | 0.00022 | van den Bogaart et al., 2012 |
| β | Ca2+ unbinding rate constant | KD,2Ca2+ ∙ α | Computed using best fit α (see Table 2) |
| δ | PI(4,5)P2 unbinding rate constant of C2B | KD,PIP2 ∙ γ | Computed using best fit α (see Table 2) |
| L+ | Basal fusion rate | 4.23 ∙10–4 s–1 | Computed using data from Kochubey and Schneggenburger, 2011 |
Table 2
Best fit model parameters and corresponding costs with different number of slots.
| Parameter | Description | Mslots = 1 | Mslots = 2 | Mslots = 3 | Mslots = 4 | Mslots = 5 | Mslots = 6 |
|---|---|---|---|---|---|---|---|
| α (µM–2s–1) | Ca2+ association rate constant | 0.03712 | 34.99 | 24.70 | 25.08 | 24.51 | 24.11 |
| γ (µM–1s–1) | PI(4,5)P2 association rate constant | 1.425·105 | 572.6 | 124.7 | 121.3 | 124.31 | 126.6 |
| [PI(4,5)P2] (µM) | Effective PI(4,5)P2 concentration for syt | 0.009658 | 0.2523 | 1.109 | 0.4528 | 0.3048 | 0.2320 |
| f (Esyt (kbT)) | Factor on the release rate for each Ca2+/PI(4,5)P2 dual bound C2B domain (resulting from a fusion barrier reduction of Esyt) | 4.259·106 (15.3) | 1298 (7.17) | 128.2 (4.85) | 152.1 (5.02) | 159.6 (5.07) | 163.5 (5.10) |
| d (ms) | Added delay | 0.3211 | 0.3761 | 0.3803 | 0.3866 | 0.3876 | 0.3881 |
| Costs | Quantification of goodness of fit | 581.9 | –92.50 | –139.4 | –130.3 | –127.7 | –126.5 |
Table 3
Overview of possible reactions and their rates in the model.
| Reaction | Condition | Triplet notation | Reaction rate |
|---|---|---|---|
| Binding of PI(4,5)P2 to unbound syt | n+m+k<nsyts and n+k < Mslots | (n,m,k)->(n,m,k+1) | (nsyts-n-m-k)(Mslots-n-k) [PI(4,5)P2]γ |
| Unbinding of PI(4,5)P2 | k>0 | (n,m,k)->(n,m,k-1) | kδ |
| Binding of Ca2+2 to unbound syt | n+m+k<nsyts | (n,m,k)->(n,m+1,k) | (nsyts-n-m-k)[Ca2+]2α |
| Unbinding of Ca2+2 | m>0 | (n,m,k)->(n,m-1,k) | mβ |
| Binding of PI(4,5)P2 to form dual binding | n+k<Mslots and m>0 | (n,m,k)->(n+1,m-1,k) | m(Mslots-n-k)[PI(4,5)P2] γ |
| Unbinding of PI(4,5)P2 from a dual binding | n>0 | (n,m,k)->(n-1, m+1,k) | Anδ |
| Binding of Ca2+2 to form a dual binding | k>0 | (n,m,k)->(n+1,m,k-1) | k[Ca2+]2α |
| Unbinding of Ca2+2 from a dual binding | n>0 | (n,m,k)->(n-1,m,k+1) | Anβ |
| Fusion | (n,m,k)->(F) | L+⋅fn |
Author response table 1
| Calcium concentration (µM) | Fraction of PI(4,5)P2-prebound Syts that engage in Ca2+/PI(4,5)P2 dual-binding during fusion |
|---|---|
| 1 | 3.876e-5 |
| 5 | 0.0479 |
| 10 | 0.3319 |
| 50 | 0.9439 |
| 100 | 0.9850 |
Author response table 2
| Parameter | Mslots = 6, original fit | Mslots = 6, Fixed F | Mslots = 6, single Ca2+ binding |
|---|---|---|---|
| α (µM-2s-1) | 24.11 | 22.96 | - |
| αsingle (µM-1s-1) | - | - | 30.86 |
| γ (µM-1s-1) | 126.6 | 0.49 | 1.56e9 |
| [PI(4,5)P2] (µM) | 0.2320 | 12.71 | 0.85 |
| f (Esyt (KbT)) | 163.5(5.10) | 12.79 | 17.25 |
| d, added delay (ms) | 0.3881 | 0.3850 | 0.33 |
| Costs | -126.5 | 8.778 | 3.52 |
Additional files
-
Transparent reporting form
- https://cdn.elifesciences.org/articles/74810/elife-74810-transrepform1-v2.pdf
-
Source code 1
Source code for simulation, analysis and visualisation.
- https://cdn.elifesciences.org/articles/74810/elife-74810-code1-v2.zip
Download links
A two-part list of links to download the article, or parts of the article, in various formats.
Downloads (link to download the article as PDF)
Open citations (links to open the citations from this article in various online reference manager services)
Cite this article (links to download the citations from this article in formats compatible with various reference manager tools)
Allosteric stabilization of calcium and phosphoinositide dual binding engages several synaptotagmins in fast exocytosis
eLife 11:e74810.
https://doi.org/10.7554/eLife.74810


