SAFB regulates hippocampal stem cell fate by targeting Drosha to destabilize Nfib mRNA
- Department of Biomedicine, University of Basel, Switzerland
- Department of Biosciences, University of Milan, Italy
- Proteomics Core Facility, Biozentrum, University of Basel, Switzerland
Figures
Figure 1 with 3 supplements
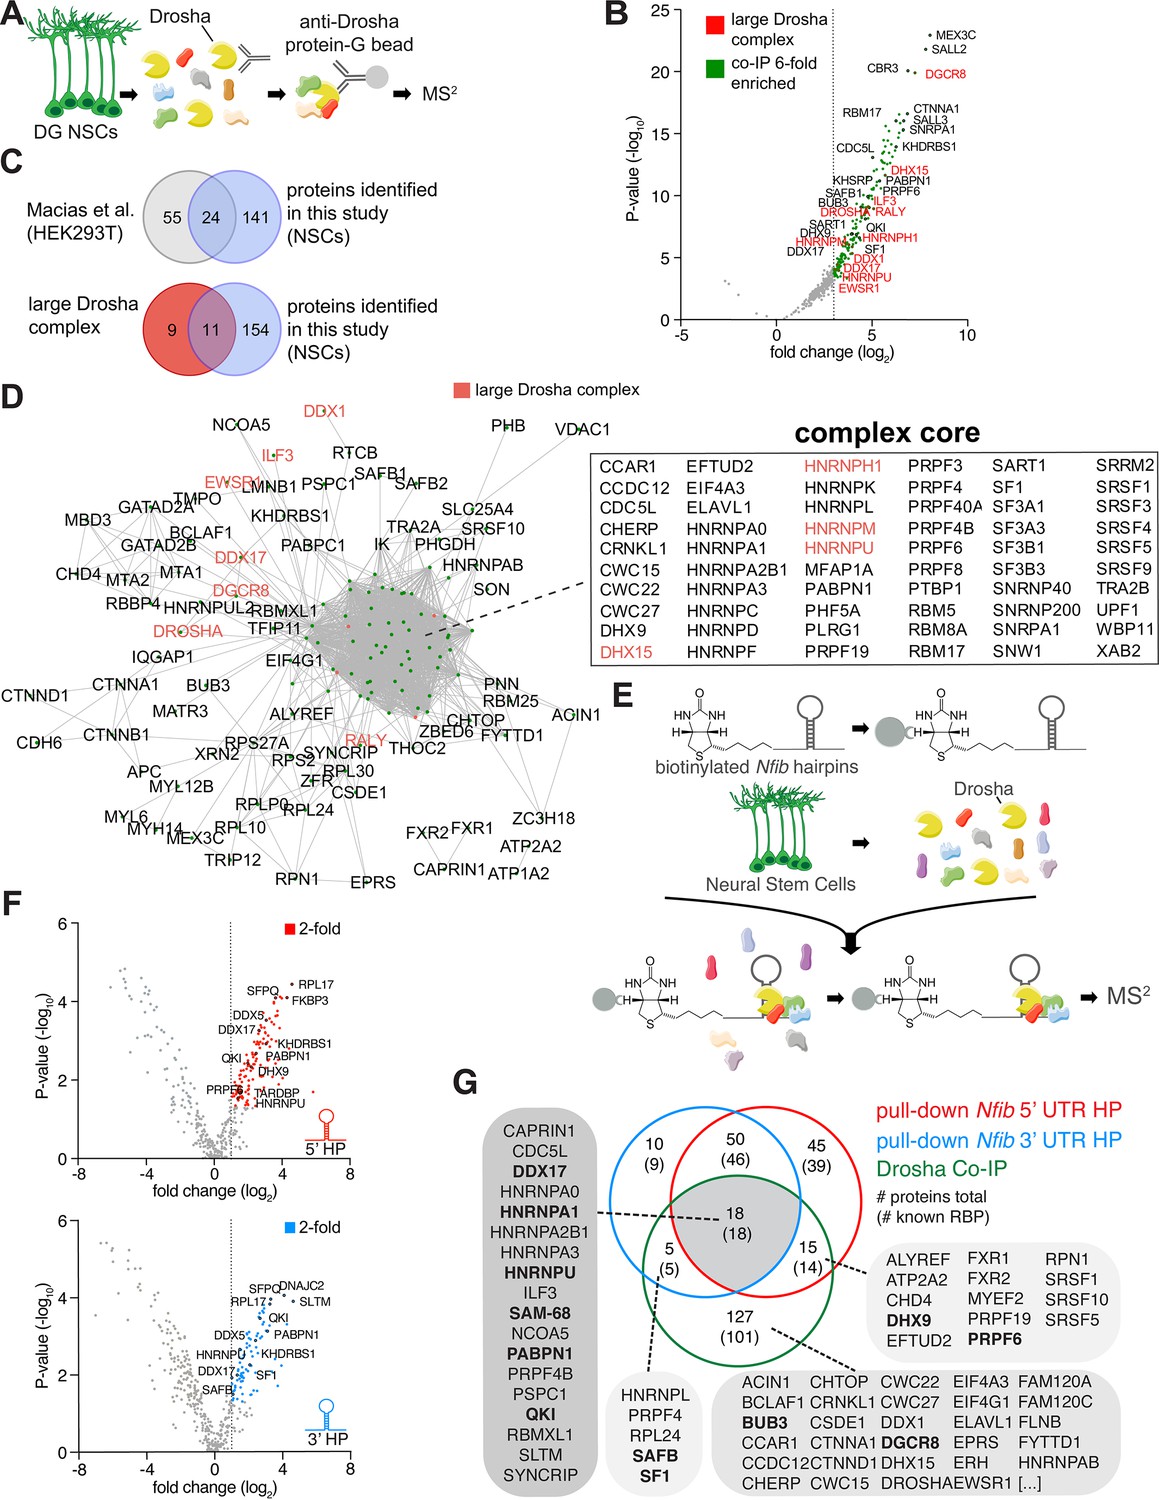
Identification of Drosha and Nfib mRNA with RNA-binding proteins in dentate gyrus (DG) neural stem cells (NSCs).
(A) Scheme of the endogenous Drosha co-immunoprecipitation procedure from DG NSCs followed by tandem mass spectrometry (MS2) analysis. (B) Volcano plot of MS2 quantified proteins displayed as fold change log2 of Drosha co-precipitated proteins over control (x-axis) and p-value -log10 (y-axis). Significantly enriched Drosha-associated proteins (green dots) were determined as having p-value < 0.05, log2 fold change ≥3 and false discovery rate (FDR)≤0.001. Eleven proteins of the known ‘large Drosha complex’ (red) were also enriched in the co-precipitation with Drosha from DG NSCs. Selected novel proteins are also shown (black). For full list of MS2 quantified proteins, see Supplementary file 1. (C) Venn diagrams of pairwise comparisons of Drosha-interacting proteins identified in DG NSCs in this study and Drosha-interacting proteins in HEK293T cells and the CORUM large Drosha complex (Rouillard et al., 2016; Macias et al., 2015). (D) STRING network analysis of Drosha-interacting proteins in DG NSCs. Nodes are indicated as green dots; edges correspond to known interactions substantiated by experimental data. Only nodes with one or more edges are displayed, protein isoforms are shown collectively. The proteins in the densely packed core complex are listed alphabetically. (E) Scheme of the Nfib hairpin pull-down assay using biotinylated RNA probes as bait to capture binding proteins followed by precipitation with streptavidin-coupled beads and MS2 analysis. (F) Volcano plots of MS2 quantified Nfib 5’ untranslated region (UTR) hairpin (HP) (top - red) and Nfib 3’ UTR HP (bottom - blue) interacting proteins displayed as fold change log2 (x-axis) versus p-value -log10 (y-axis). Significant enriched proteins (red and blue dots) were defined as having p-value<0.05, log2 fold change ≥1 and FDR≤0.1. Selected novel proteins are also shown (black). For full list of interacting proteins, see Supplementary file 1. (G) Venn diagram of comparisons between Drosha-interacting proteins in DG NSCs (green circle), Nfib 3’ UTR HP-binding proteins (blue circle), and Nfib 5’ UTR HP-binding proteins (red circle). The numbers indicate the total number of proteins, the numbers in brackets indicate how many of the proteins are known RNA-binding proteins (RBPs). Proteins selected for the functional assay are highlighted in the lists in bold type.
Figure 1—figure supplement 1
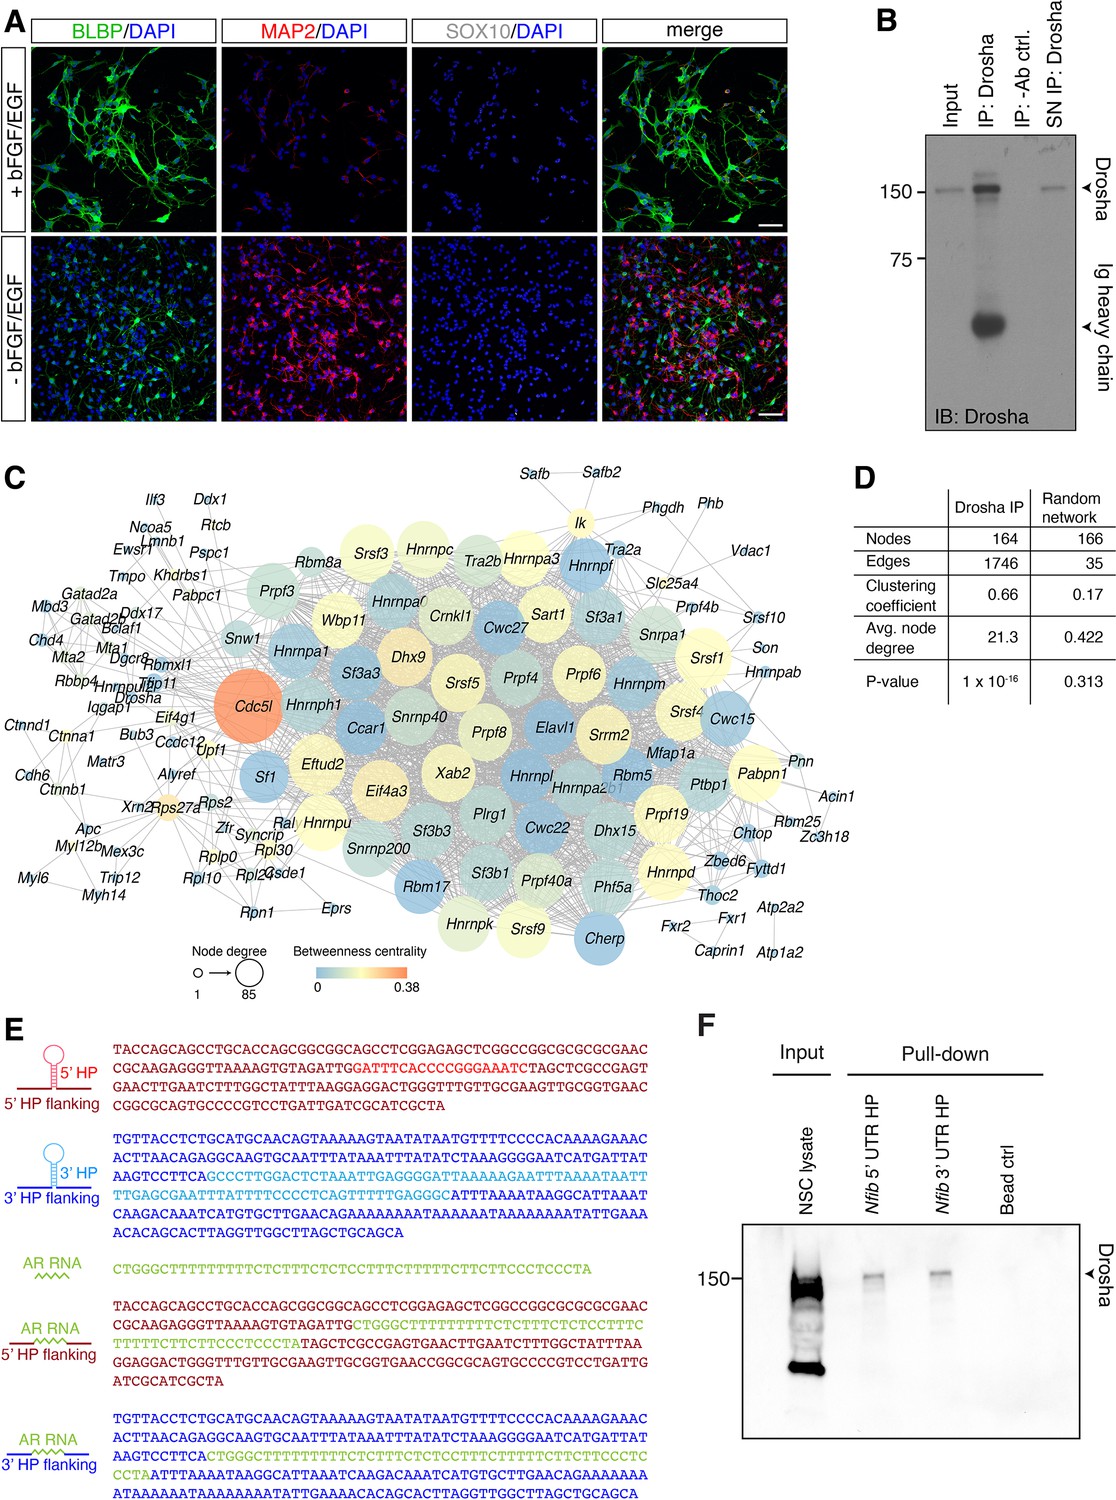
Dentate gyrus (DG) neural stem cells (NSCs) contain large Drosha complexes.
(A) Characterization of DG NSCs under expansion (+bFGF/EGF) and differentiation (-bFGF/EGF) culture conditions. Immunohistochemistry for the progenitor marker BLBP, neuronal protein MAP2, and oligodendrocyte protein SOX10. Scale bar 50 µm. (B) Immunoblot (IB) validation of Drosha immunoprecipitation (IP). IP with anti-Drosha antibodies shows precipitation of Drosha. Negative control precipitation without antibody (-Ab). Input is 2.5% of total lysate used in the IP. Drosha protein and immunoglobulin (Ig) heavy chain from the precipitating antibody are indicated. SN: supernatant. (C) STRING network analysis of the Drosha-interacting proteins identified by tandem mass spectrometry (MS2) (related to Figure 1D). Node size corresponds to node degree, node color corresponds to betweenness centrality, edges exclusively correspond to known interactions based on experimental data and databases. Only nodes with one or more edges are displayed, protein isoforms were analyzed collectively. (D) Common network parameters for Drosha IP network compared with a random network of similar node size. (related to Figure 1D). (E) Base sequence of the Nfib 5’ untranslated region (UTR) hairpin (HP) and 3’ UTR HP RNA probes, the binding sequence for HuR from the androgen receptor mRNA (AR), and AR RNA-Nfib UTR hybrid probes used in the pull-down experiments. The colors correspond to the relative RNA domains shown in the secondary structure schemes. (F) IB validation of Drosha precipitation with Nfib RNA 3’ UTR HP and Nfib 5’ UTR HP pull-down probes. Negative control precipitation is bead-only control (Bead ctrl).
-
Figure 1—figure supplement 1—source data 1
Original data for Figure 1—figure supplement 1B and F.
- https://cdn.elifesciences.org/articles/74940/elife-74940-fig1-figsupp1-data1-v2.zip
-
Figure 1—figure supplement 1—source data 2
Original data for Figure 1—figure supplement 1B and F.
Unlabelled.
- https://cdn.elifesciences.org/articles/74940/elife-74940-fig1-figsupp1-data2-v2.zip
Figure 1—figure supplement 2
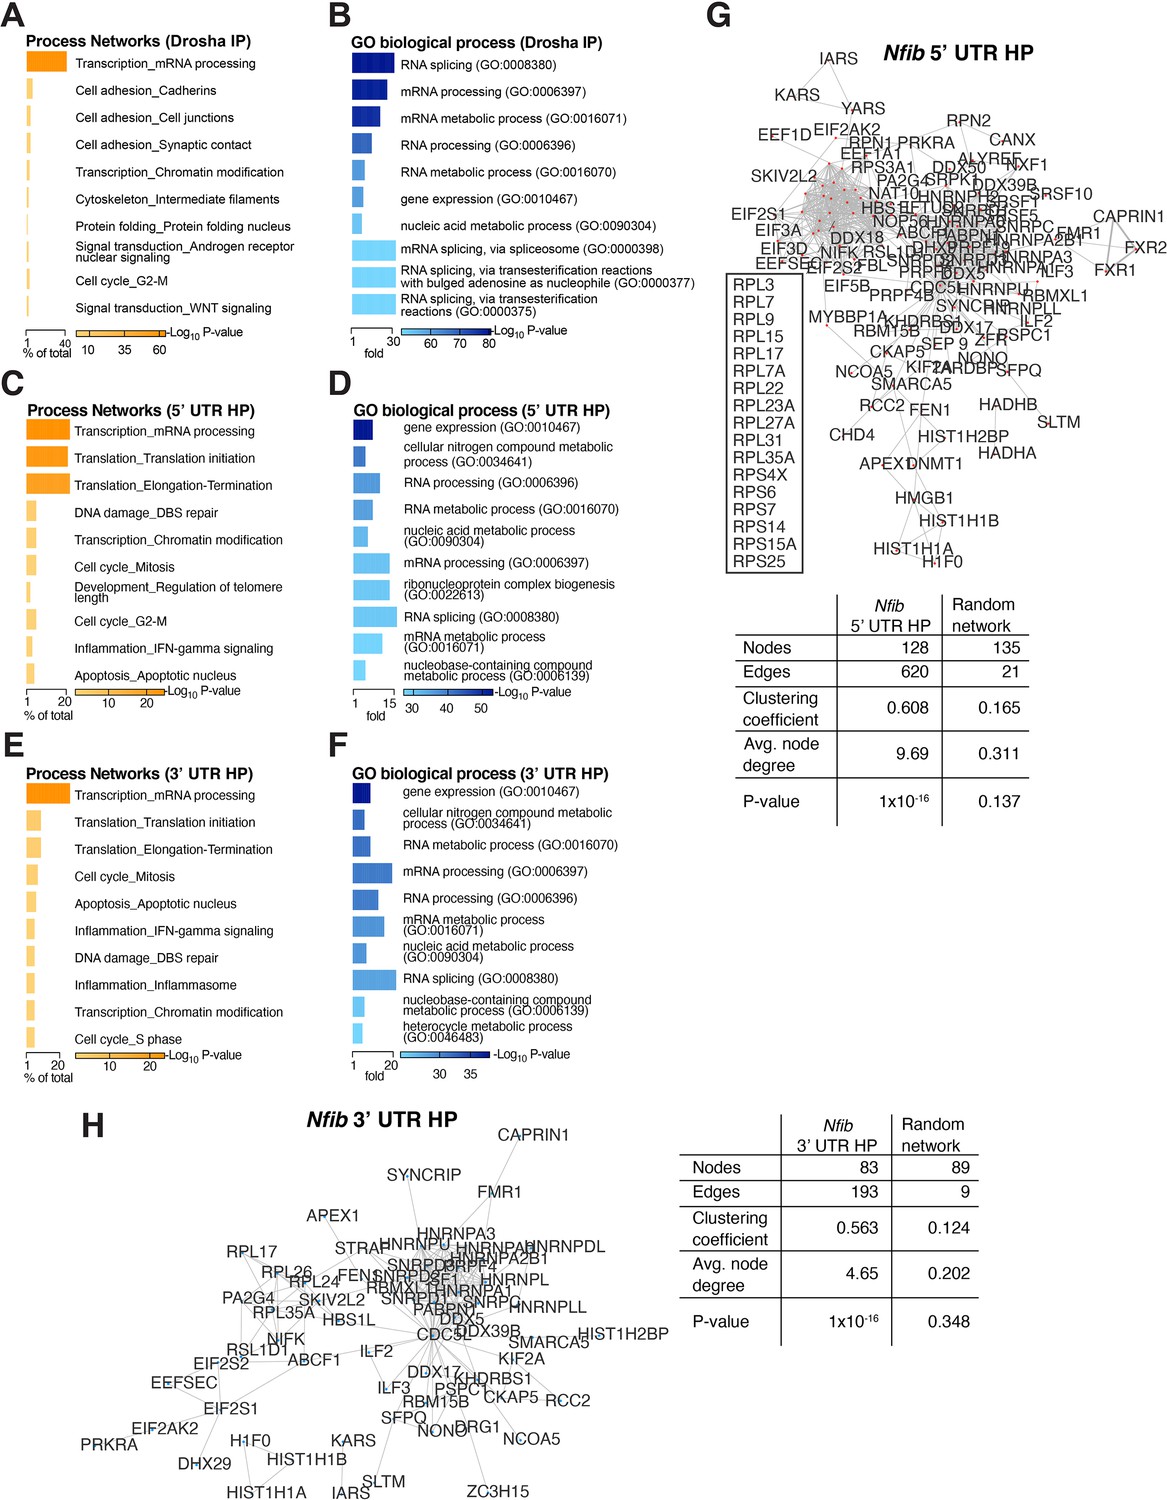
Process analysis of Drosha and Nfib mRNA-interacting proteins.
(A) MetaCore enrichment analysis of process networks for the identified Drosha-interacting proteins. Bar length corresponds to percentage of protein number out of total identified Drosha-interacting proteins for each of the indicated categories. p-Values are indicated by color. (B) Gene Ontology (GO) terms (PANTHER) of biological processes for the identified Drosha-interacting proteins. Bar length corresponds to fold change enrichment per category. p-Values are indicated by color. (C, D) MetaCore enrichment analysis of Process Networks and GO terms (PANTHER) of biological processes for the Nfib 5’ UTR HP-interacting proteins. Bar length corresponds to the percentage of protein out of total identified Nfib 5’ UTR HP-interacting proteins per category (Process Networks) or to fold change per category (GO biological processes). p-Values are indicated by color. (E, F) MetaCore enrichment analysis of Process Networks and GO terms (PANTHER) of biological processes for the Nfib 3’ UTR HP-interacting proteins. Bar length corresponds to the percentage of proteins out of total identified Nfib 3’ UTR HP-interacting proteins per category (Process Networks) or to fold change per category (GO biological processes). p-Values are indicated by color. (G, H) STRING network analysis of Nfib 5’ UTR HP and 3’ UTR HP-interacting proteins. Nodes are indicated by colored dots; edges exclusively correspond to known interactions from experimental data and databases. Only nodes with one or more edges are displayed, protein isoforms are shown collectively. Tables: Common network parameters for pull-down networks compared with random networks of similar node size for the Nfib 5’ UTR HP (left) and Nfib 3’ UTR HP (right) probes.
Figure 1—figure supplement 3
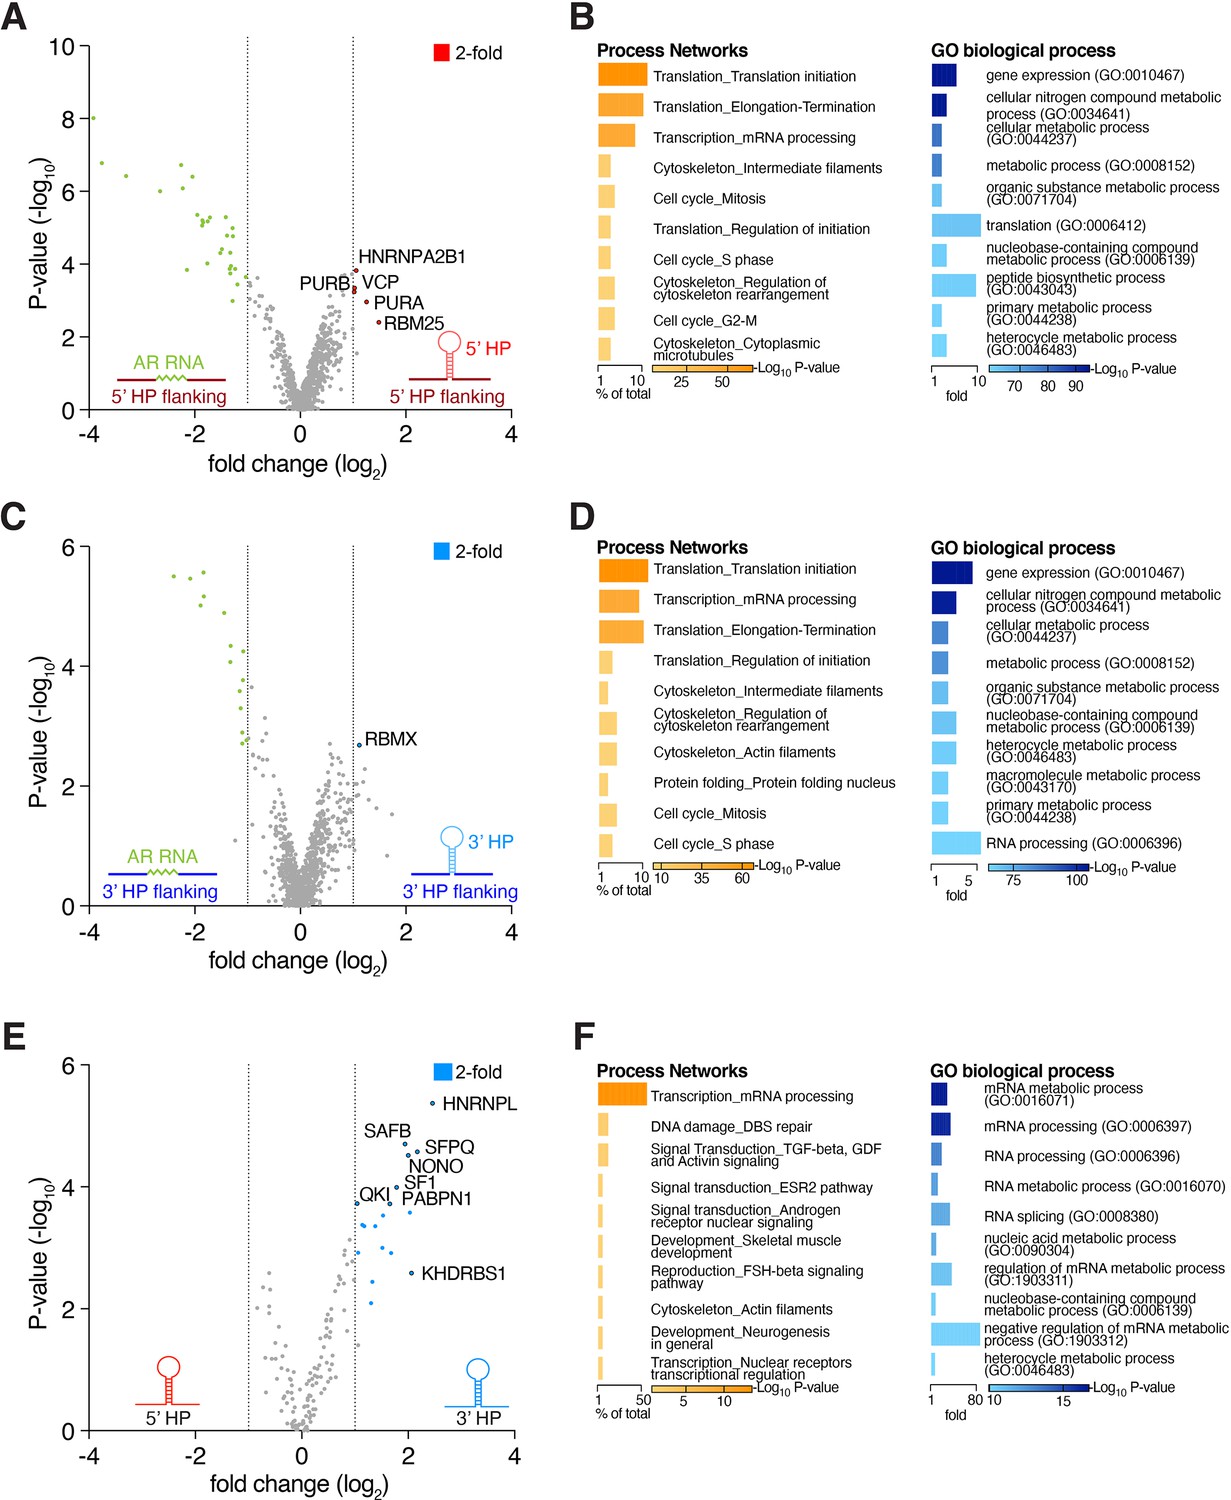
Nfib mRNA interactome analysis uncovers regional binding preferences.
(A) Proteomic analysis of interactors with the Nfib 5’ untranslated region (UTR) hairpin (HP) (including the HP flanking sequences). Volcano plot of tandem mass spectrometry (MS2) quantified proteins displaying log2 fold change (x-axis) versus -log10 p-value (y-axis). (B) Nfib 5’ UTR HP flanking region protein association analysis. The dataset of flanking proteins includes proteins not enriched for 5’ UTR HP or control in the MS2 analysis. Non-specific bead-binding proteins were subtracted from the analysis. MetaCore enrichment analysis of process networks and Gene Ontology (GO) terms (PANTHER) of biological processes for identified Nfib 5’ UTR HP flanking binding proteins. (C) Proteomics analysis of interactors with the Nfib 3’ UTR HP (including the HP flanking sequences). Volcano plot of MS2 quantified proteins displaying log2 fold change (x-axis) versus -log10 p-value (y-axis). (D) Nfib 3’ UTR HP flanking region protein association analysis. The dataset of flanking proteins includes proteins not enriched for 3’ UTR HP or control in MS2 analysis. Non-specific bead-binding proteins were subtracted from the analysis. MetaCore enrichment analysis of process networks and GO terms (PANTHER) of biological processes for identified Nfib 3’ UTR HP flanking binding proteins. (E) Proteomics analysis of Nfib 3’ UTR HP versus Nfib 5’ UTR HP interactors. Volcano plot of MS2 quantified proteins displaying log2 fold change (x-axis) versus -log10 p-value (y-axis). (F) MetaCore enrichment analysis of process networks and GO terms (PANTHER) of biological processes for specific Nfib 3’ UTR HP flanking proteins. Volcano plots: Significant enrichment for highlighted proteins (colored dots) was achieved by p-value<0.05, log2 fold change ≥1, and false discovery rate (FDR) ≤ 0.1. A subset of proteins is displayed. Bar plots: Bar length corresponds to percentage of protein number out of total identified Nfib UTR HP-interacting proteins per category or to fold change per category, respectively. p-Values indicated by color.
Figure 2
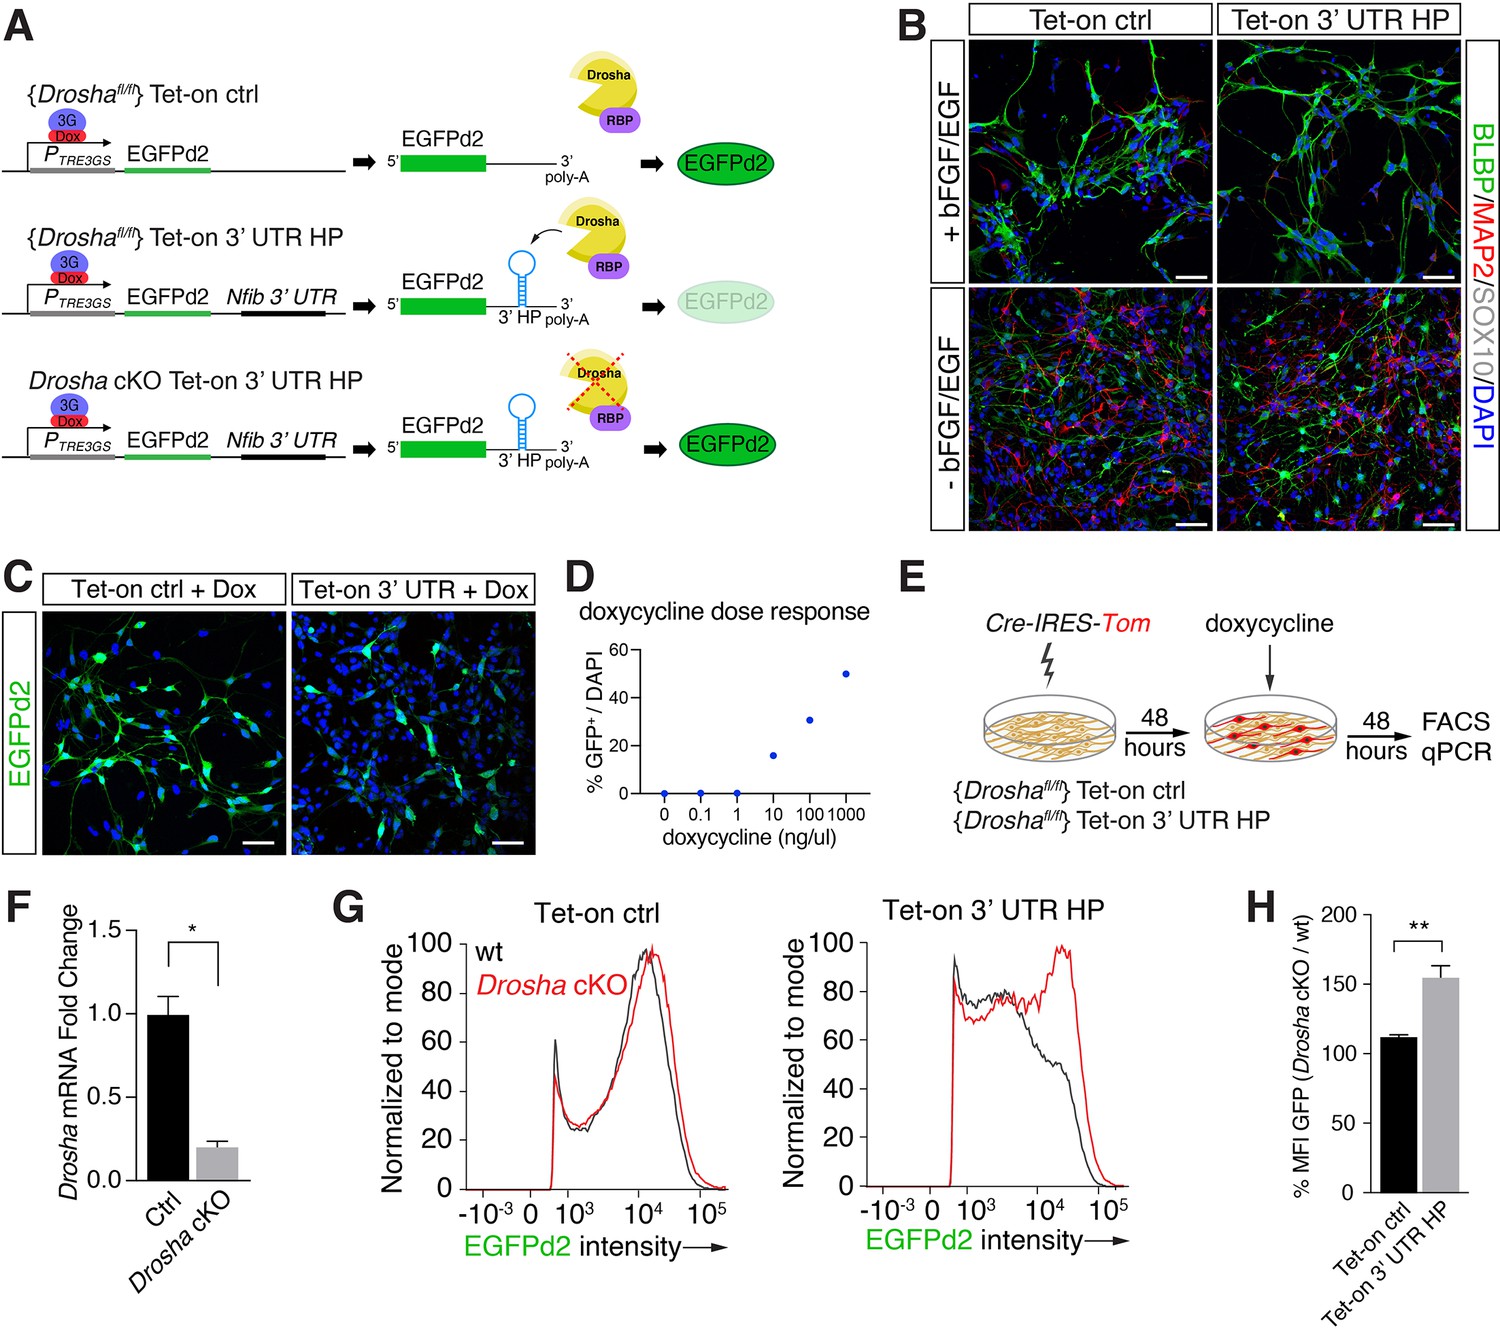
Conditional dentate gyrus (DG) neural stem cells (NSCs) report Drosha processing of Nfib constructs.
(A) Scheme of the experimental paradigm using the Tet-on reporter lines to examine the effects of the Nfib 3’ untranslated region (UTR) hairpin (HP) (composed of Nfib 3’ UTR HP inserted into the UTR downstream of EGFPd2 cDNA) on expression. Stable floxed Drosha (Droshafl/fl) DG NSCs lines carrying doxycycline inducible Tet-on ctrl, or Tet-on 3’ UTR HP constructs were generated and selected. Drosha/RNA-binding protein (RBP) complexes regulate stability of the reporter RNA and EGFPd2 expression levels. Deletion of Drosha stabilizes the Tet-on 3’ UTR HP construct mRNA and EGFPd2 expression. (B) Characterization of the Tet-on ctrl and Nfib 3’ UTR HP (Tet-on 3’ UTR) expressing DG NSCs under expansion (+bFGF/EGF) and differentiation (-bFGF/EGF) culture conditions. Immunohistochemistry for the progenitor marker BLBP, neuronal protein MAP2, and oligodendrocyte protein SOX10. Scale bars 50 µm. (C) Expression of EGFPd2 by doxycycline-induced (48 hr) Tet-on ctrl and Tet-on Nfib 3’UTR HP DG NSC line under Droshafl/fl conditions. Scale bar 50 µm. (D) Doxycycline dose-response curve of Tet-on ctrl DG NSC line. Quantification of EGFPd2+ (GFP+) cells over total cells (DAPI). (E) Experimental paradigm for Drosha conditional deletion (Drosha cKO) experiments from Tet-on ctrl and Tet-on 3’ UTR HP DG NSCs followed by quantitative FACS analysis for EGFPd2 expression and quantitative reverse transcriptase PCR (RT-qPCR). (F) RT-qPCR quantification of Drosha mRNA levels before (Ctrl) and after Drosha cKO from Tet-on 3’ UTR HP DG NSCs. n=4, two-tailed Mann-Whitney test: *p<0.05. Error bars SEM. (G) FACS analysis of EGFPd2 fluorescence by Tet-on ctrl and Tet-on 3’ UTR HP DG NSCs after doxycycline induction (48 hr). EGFPd2 intensity (x-axis) versus cell number normalized to mode (y-axis) of Tet-on ctrl and Tet-on 3’ UTR HP DG NSC lines before Drosha cKO (WT: black line) and after Drosha cKO (red line). Note the recovery of high EGFPd2-expressing cells (intensity >104) in the Drosha cKO Tet-on 3’ UTR HP DG NSC (red line) compared to the same cells before Drosha deletion (WT: black line). (H) Quantification of median fluorescence intensity of EGFPd2 (GFP) from Drosha cKO over WT in Tet-on ctrl and Tet-on 3’ UTR HP lines. n=5, two-tailed Mann-Whitney test: **p<0.01. Error bars SEM.
Figure 3
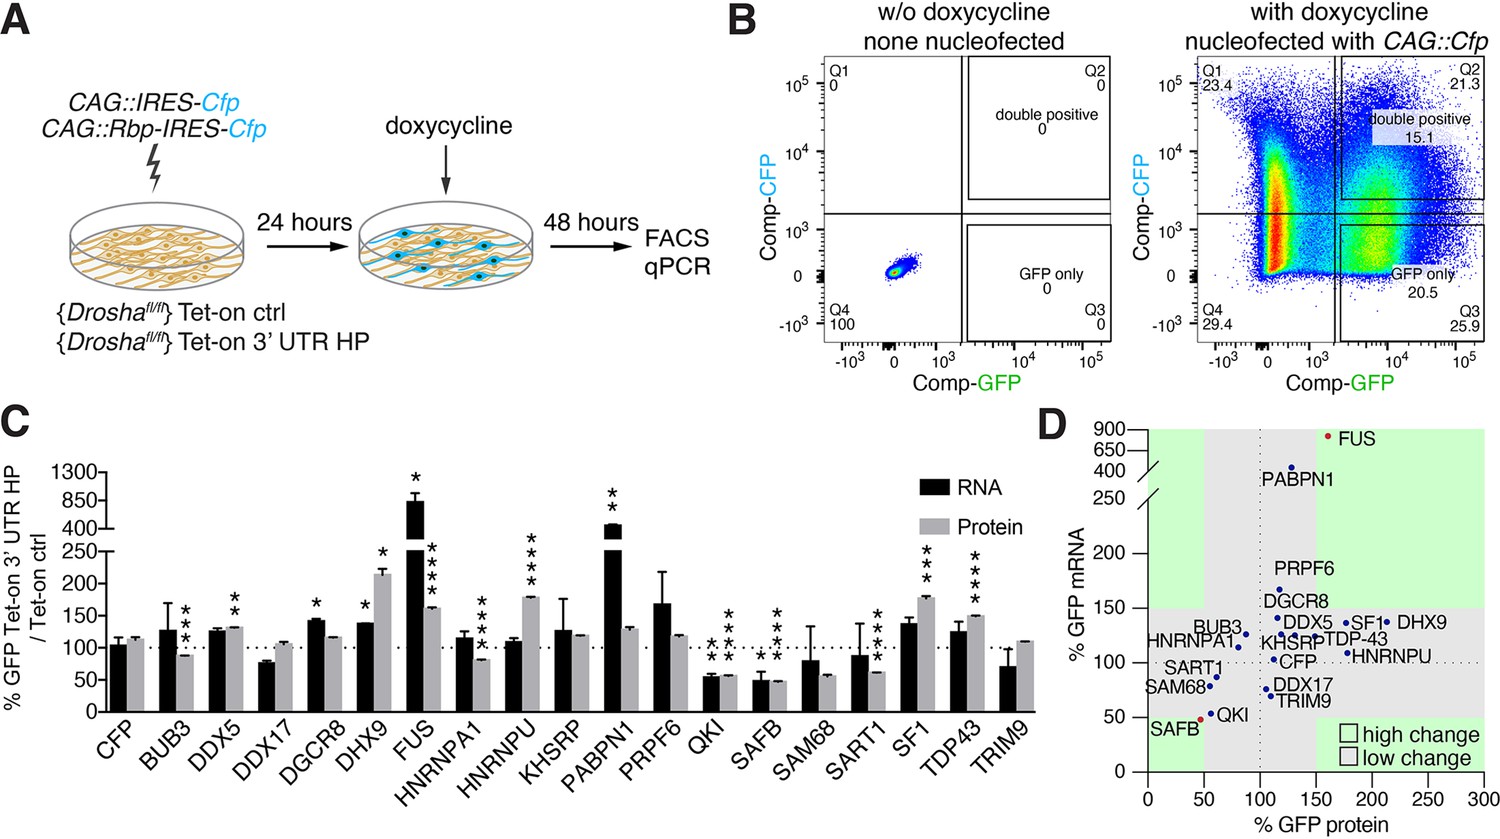
Overexpression of Drosha interactors affects cleavage of Nfib mRNA.
(A) Scheme of the experimental setup to screen the effects of RNA-binding proteins (RBPs) on the expression of Tet-on ctrl and Tet-on 3’ untranslated region (UTR) hairpin (HP) constructs in dentate gyrus (DG) neural stem cells (NSCs) by FACS and quantitative reverse transcriptase PCR (RT-qPCR) analysis. RBPs (CAG::Rbp-IRES-Cfp) were expressed in Tet-on ctrl and Tet-on 3’ UTR HP DG NSCs by nucleofection and the levels of EGFPd2 (GFP) protein and mRNA compared to the expression by NSCs expressing a CFP control construct (CAG::IRES-Cfp) after 48 hr of doxycycline induction. (B) Representative FACS plot from flow cytometric analyzes of Tet-on ctrl DG NSCs with or without nucleofection with the control (CAG::IRES-Cfp) expression vector, with or without doxycycline induction (48 hr). Untransfected and uninduced Tet-on ctrl DG NSCs do not show EGFPd2 (GFP) or CFP expression compared to doxycycline-induced and CAG::IRES-Cfp nucleofected Tet-on ctrl DG NSCs. (C) Analysis of RBP effects on Tet-on 3’ UTR HP construct expression in doxycycline-induced Tet-on 3’ UTR HP DG NSCs. Nucleofected cells were sorted by FACS, gating on the CFP+ cells. EGFPd2 (GFP) levels of CFP+ cells were quantified by flow cytometry and RNA isolated for RT-qPCR analysis. Quantification of relative EGFPd2 (GFP) mRNA (RT-qPCR) and protein levels (flow cytometry) following overexpression of RPBs by nucleofection in Tet-on 3’ UTR HP DG NSCs compared to control vector (CAG::IRES-Cfp) transfected cells. To eliminate effects of the RBPs on transcription, RNA stability or translation not linked to the Nfib 3’ UTR HP, the changes in expression were calculated as the differences in EGFPd2 levels in Tet-on 3’ UTR HP DG NSCs and Tet-on ctrl DG NSCs (%GFP Tet-on 3’ UTR HP/Tet-on ctrl). Black dotted line indicates no change. Error bars SEM. (D) Summary diagram of RBP effects on Tet-on 3’ UTR HP relative to Tet-on ctrl construct expression in DG NSCs. Relative EGFPd2 (GFP) protein levels (fluorescence intensity by FACS, x-axis) and mRNA levels (RT-qPCR, y-axis). Green areas represent changes of ±>50% of Tet-on 3’ UTR HP relative to Tet-on ctrl construct.
Figure 4 with 1 supplement
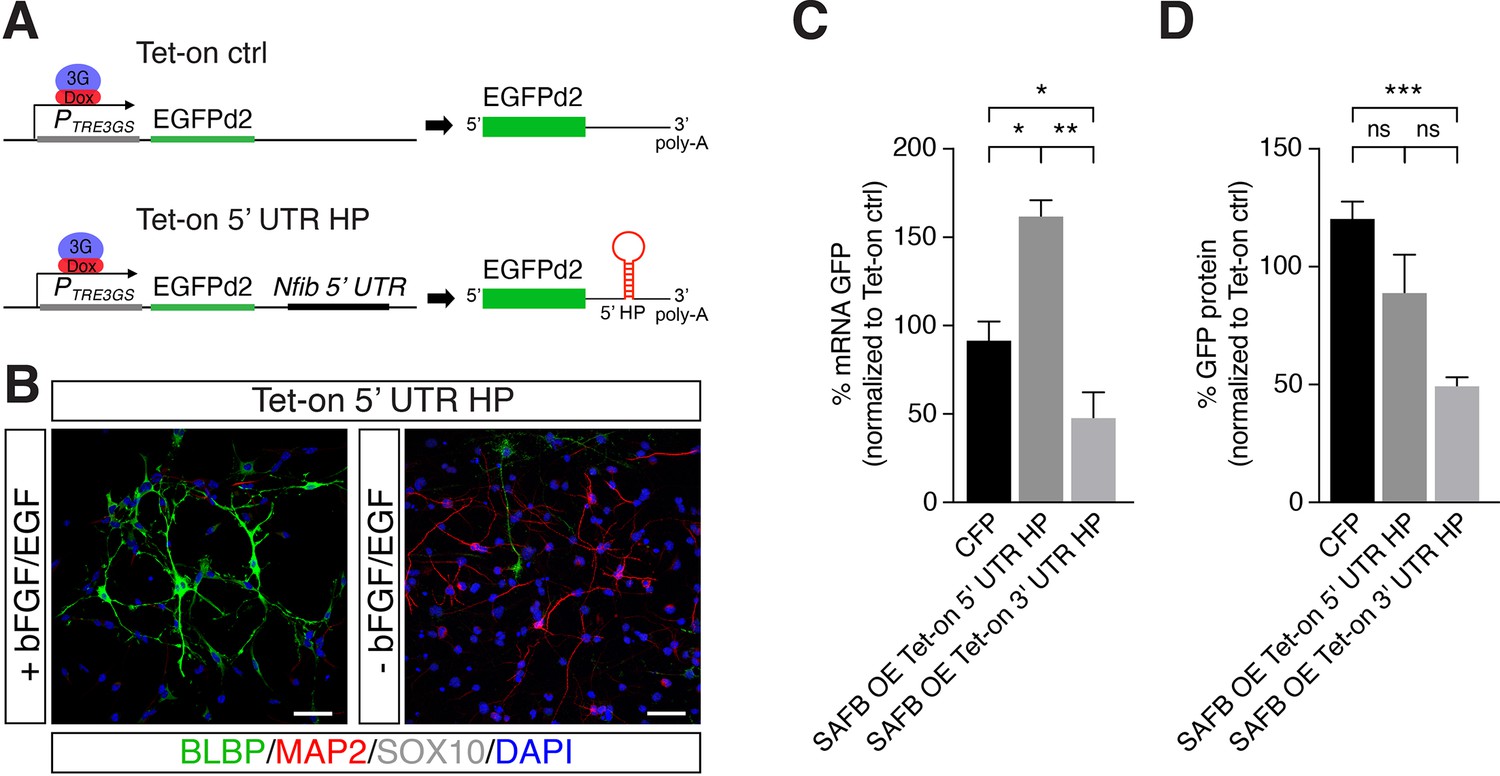
SAFB overexpression modulates Nfib reporter expression.
(A) Scheme of the constructs used for generating Tet-on ctrl and Tet-on 5’ untranslated region (UTR) hairpin (HP) dentate gyrus (DG) neural stem cells (NSCs). (B) Characterization of the Nfib 5’ UTR HP expressing DG NSCs under expansion (+bFGF/EGF) and differentiation (-bFGF/EGF) culture conditions. Immunohistochemistry for the progenitor marker BLBP, neuronal protein MAP2, and oligodendrocyte protein SOX10. Scale bar 50 µm. (C) Quantitative reverse transcriptase PCR (RT-qPCR) analysis of EGFPd2 (GFP) mRNA levels of CFP expressing and SAFB overexpressing (SAFB OE) Tet-on 3’ UTR HP and Tet-on 5’ UTR HP DG NSCs (x-axis). Percent mean EGFPd2 (GFP) mRNA expression by Tet-on 3’ UTR HP and Tet-on 5’ UTR HP DG NSCs normalized to expression by Tet-on ctrl DG NSCs (y-axis). n=3; one-way ANOVA with Holm-Sidak’s test: *p<0.05, **p<0.01. Error bars SEM. (D) FACS analysis of EGFPd2 (GFP) protein fluorescence of CFP expressing and SAFB overexpressing (SAFB OE) Tet-on 3’ UTR HP and Tet-on 5’ UTR HP DG NSCs (x-axis). Percent median EGFPd2 (GFP) protein fluorescence intensity of Tet-on 3’ UTR HP and Tet-on 5’ UTR HP DG NSCs normalized to fluorescence intensity of Tet-on ctrl DG (y-axis). n=6; one-way ANOVA with Holm-Sidak’s test: ***p<0.001, ns - not significant. Error bars SEM.
Figure 4—figure supplement 1
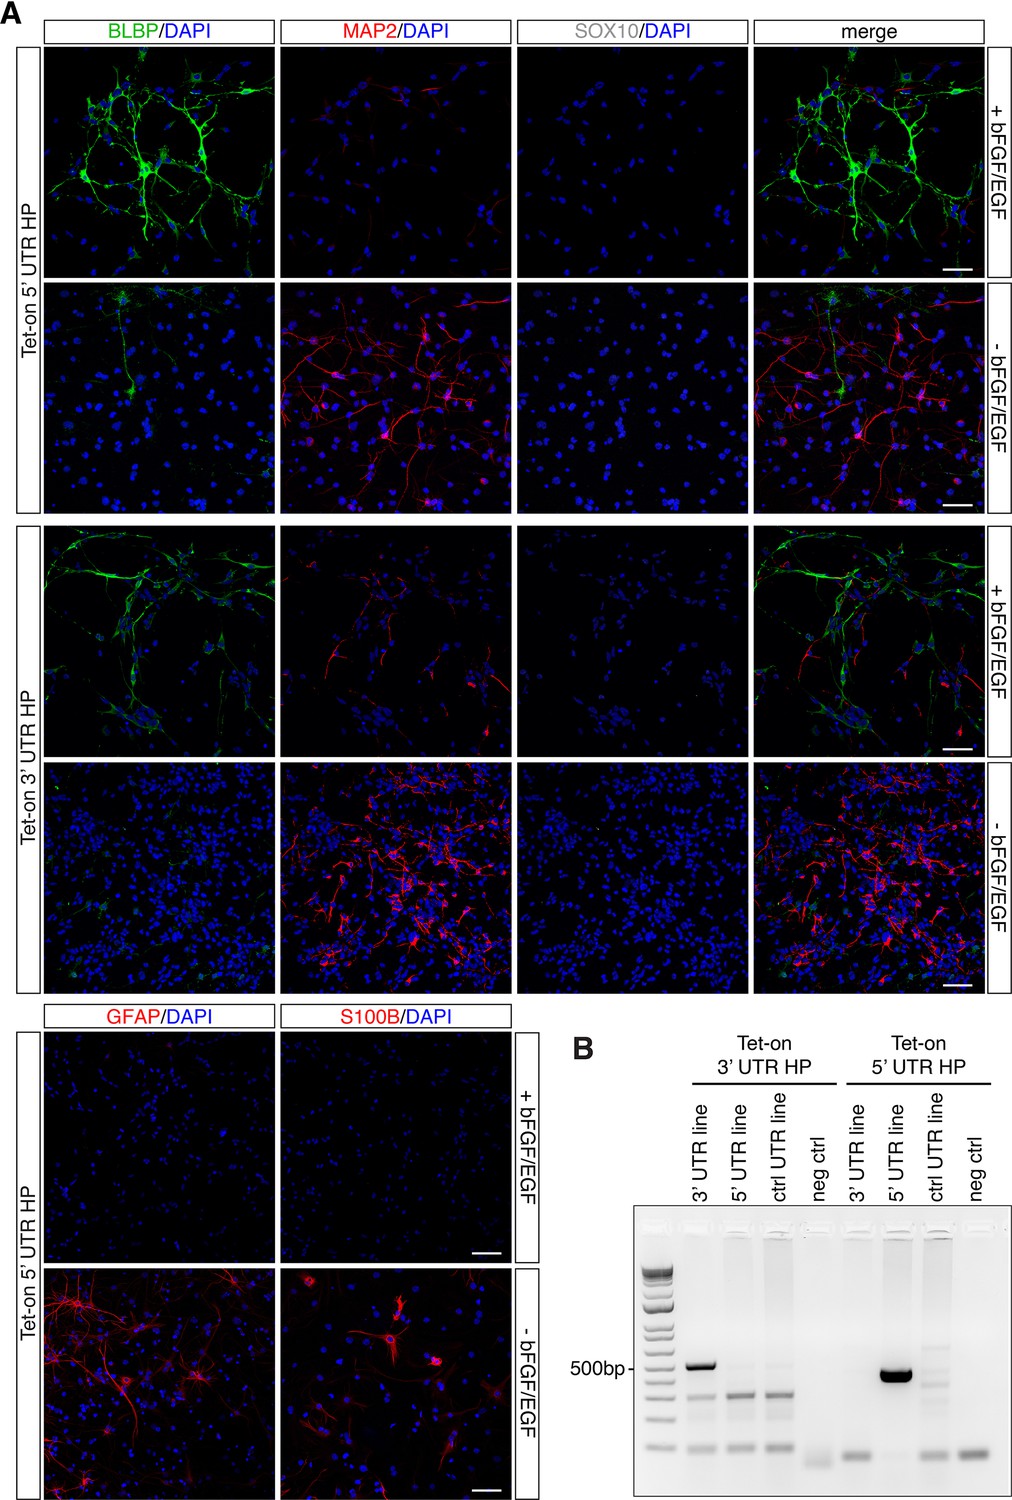
Dentate gyrus (DG) neural stem cell (NSC) Nfib untranslated region (UTR) reporter lines retain NSC properties.
(A) DG NSCs Tet-on 5’ UTR hairpin (HP) and DG NSC Tet-on 3’ UTR HP reporter lines under expansion (+bFGF/EGF) and differentiation (-bFGF/EGF) culture conditions. Immunohistochemistry for progenitor marker BLBP, neuronal marker MAP2, and oligodendrocyte marker SOX10, as well as astrocyte markers glial fibrillary acidic protein (GFAP) and S100 calcium-binding protein B (S100B). The individual color channel panels are shown for the DG NSCs Tet-on 5’ UTR HP reporter line images presented in Figure 4B. Scale bar 50 µm. (B) Genotyping of the stable Tet-on 3’ UTR HP DG NSCs and Tet-on 5’ UTR HP DG NSCs. Specific amplicons for the Tet-on 3’ UTR HP construct and (514 bp) and 5’ UTR HP construct (430 bp) are found only in the respective lines. Left: amplification with primers specific for the Nfib 3’ UTR HP construct; right: amplification with primers specific for the Nfib 5’ UTR HP construct. Negative control: (neg ctrl) H2O.
-
Figure 4—figure supplement 1—source data 1
Original data for Figure 4—figure supplement 1B.
- https://cdn.elifesciences.org/articles/74940/elife-74940-fig4-figsupp1-data1-v2.zip
-
Figure 4—figure supplement 1—source data 2
Original data for Figure 4—figure supplement 1B.
Unlabelled.
- https://cdn.elifesciences.org/articles/74940/elife-74940-fig4-figsupp1-data2-v2.zip
Figure 5 with 1 supplement
SAFB-mediated reduction in Nfib expression depends on Drosha activity.
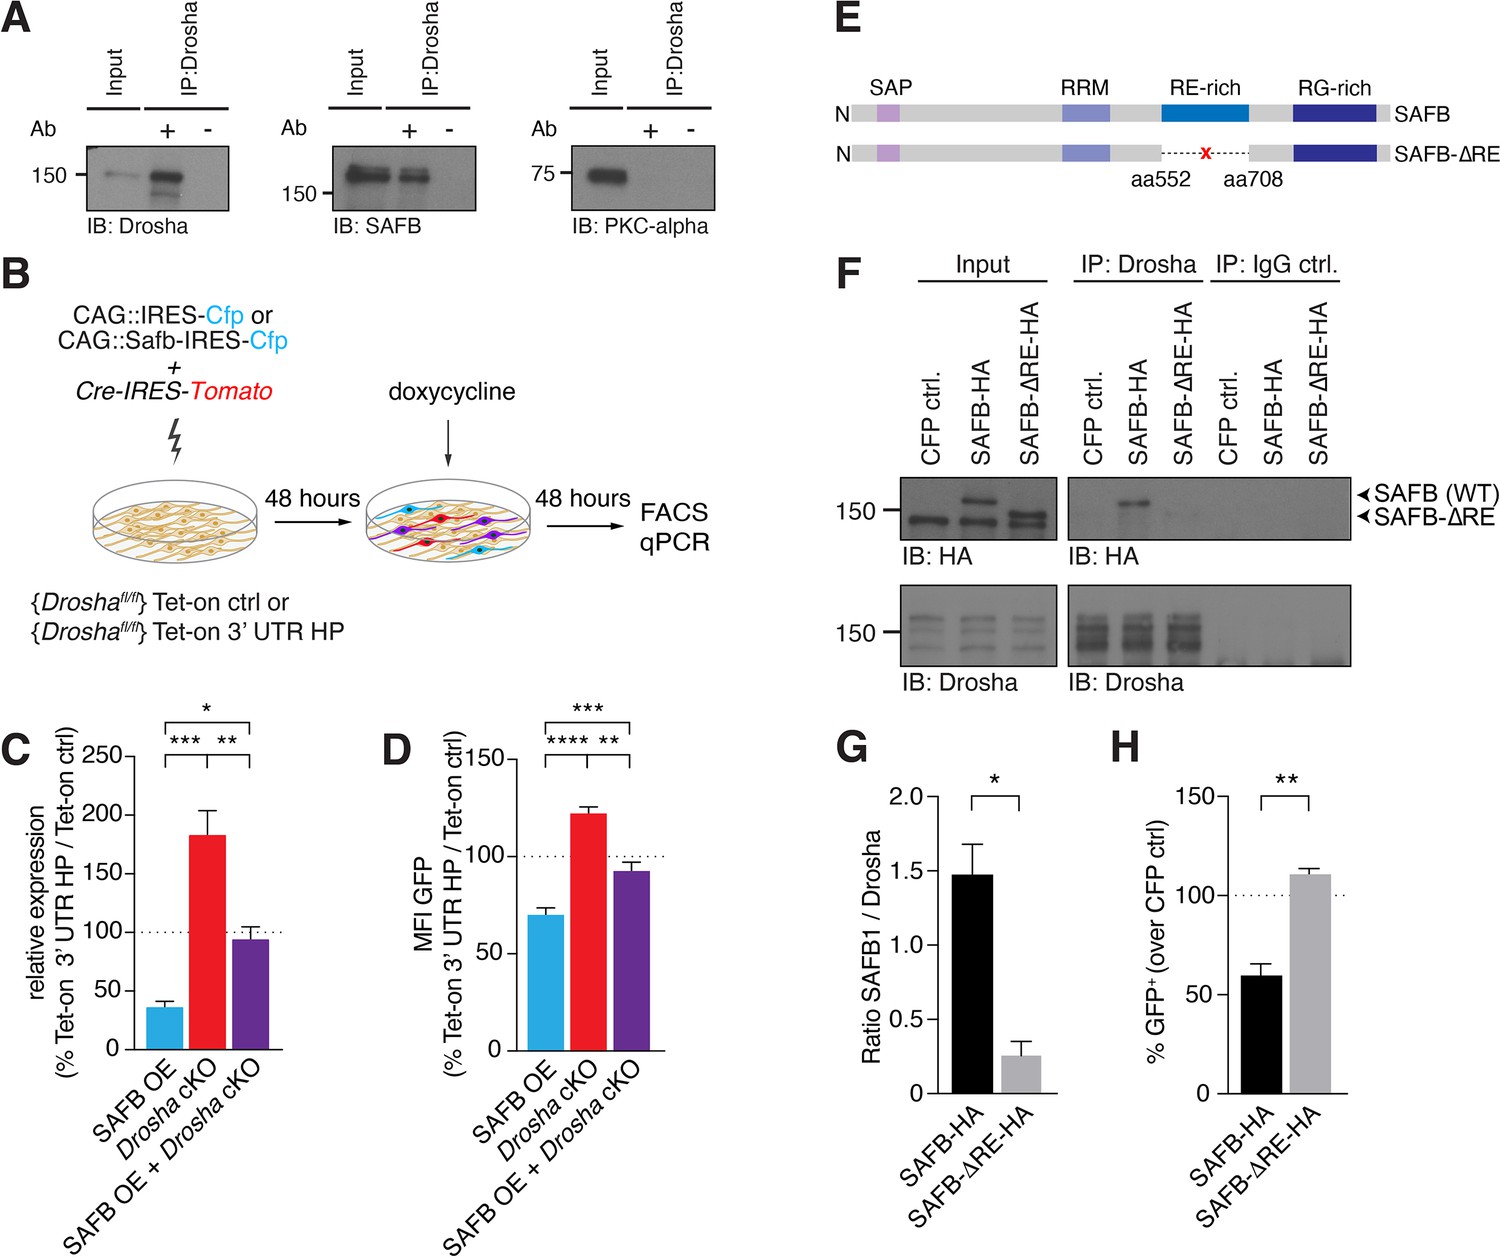
(A) Immunoblot validation of Drosha-SAFB interaction. Drosha immunoprecipitation (IP) shows enrichment of Drosha (13% of input) and co-IP of SAFB. Input: 2.5% of total lysate. PKC-α was used as negative control for the co-IP. (B) Scheme of the experimental setup for analysis of the effects of SAFB overexpression (OE) (CAG::Safb-IRES-Cfp) on Tet-on ctrl and Tet-on 3’ untranslated region (UTR) HP expression in floxed Drosha (Droshafl/fl) dentate gyrus (DG) neural stem cells (NSCs) by FACS and quantitative reverse transcriptase PCR (RT-qPCR) analysis. (C) RT-qPCR analysis of EGFPd2 (GFP) mRNA levels in Tet-on 3’ UTR HP DG NSCs. Quantification of mean EGFPd2 (GFP) mRNA expression in Tet-on 3’ UTR HP DG NSCs after Drosha cKO and OE of SAFB with/without Drosha cKO relative to Tet-on ctrl DG NSCs. 100% line indicates no difference in expression. n=3, one-way ANOVA with Holm-Sidak’s test: *p<0.05, **p<0.01, ***p<0.001. Error bars SEM. (D) FACS analysis of EGFPd2 (GFP) protein fluorescence in Tet-on 3’ UTR HP DG NSCs. Quantification of median EGFPd2 intensity (MFI GFP) of Tet-on 3’ UTR HP DG NSCs after Drosha cKO and OE of SAFB with/without Drosha cKO relative to Tet-on ctrl DG NSCs. 100% line indicates no difference in expression. n=5, one-way ANOVA with Holm-Sidak’s test: *p<0.05, **p<0.01, ****p<0.0001. Error bars SEM. (E) Schematic representation of the SAFB and SAFB-ΔRE mutant lacking amino acids 552–708 encoding the RE domain. (F) Immunoblot (IB) analysis of SAFB-HA (wild type [WT]), SAFB-ΔRE-HA and Drosha in the Drosha IP and IgG isotype control IP from transfected N2A cells. Input: 2.5% of total lysate. (G) Quantification of binding capacity of Drosha to SAFB and SAFB-ΔRE. Binding was quantified as the levels of SAFB-HA or SAFB-ΔRE-HA relative to Drosha in the respective co-IP measured by densitometry of immunoblots. n=3, two-tailed t-test with Welch’s correction: *p<0.05. Error bars SEM. (H) FACS analysis of EGFPd2 (GFP) protein fluorescence in Tet-on 3’ UTR HP DG NSCs following SAFB and SAFB-ΔRE OE. Percentage of median EGFPd2 (GFP) intensity over CAG::IRES-Cfp control transfection. 100% line indicates no difference in expression. n=4, two-tailed Mann-Whitney test: **p<0.01. Error bars SEM.
-
Figure 5—source data 1
Original data for Figure 5 and Figure 5—figure supplement 1.
- https://cdn.elifesciences.org/articles/74940/elife-74940-fig5-data1-v2.zip
-
Figure 5—source data 2
Original data for Figure 5 and Figure 5—figure supplement 1.
Unlabelled.
- https://cdn.elifesciences.org/articles/74940/elife-74940-fig5-data2-v2.zip
Figure 5—figure supplement 1
SAFB and Drosha are able to form a protein complex.
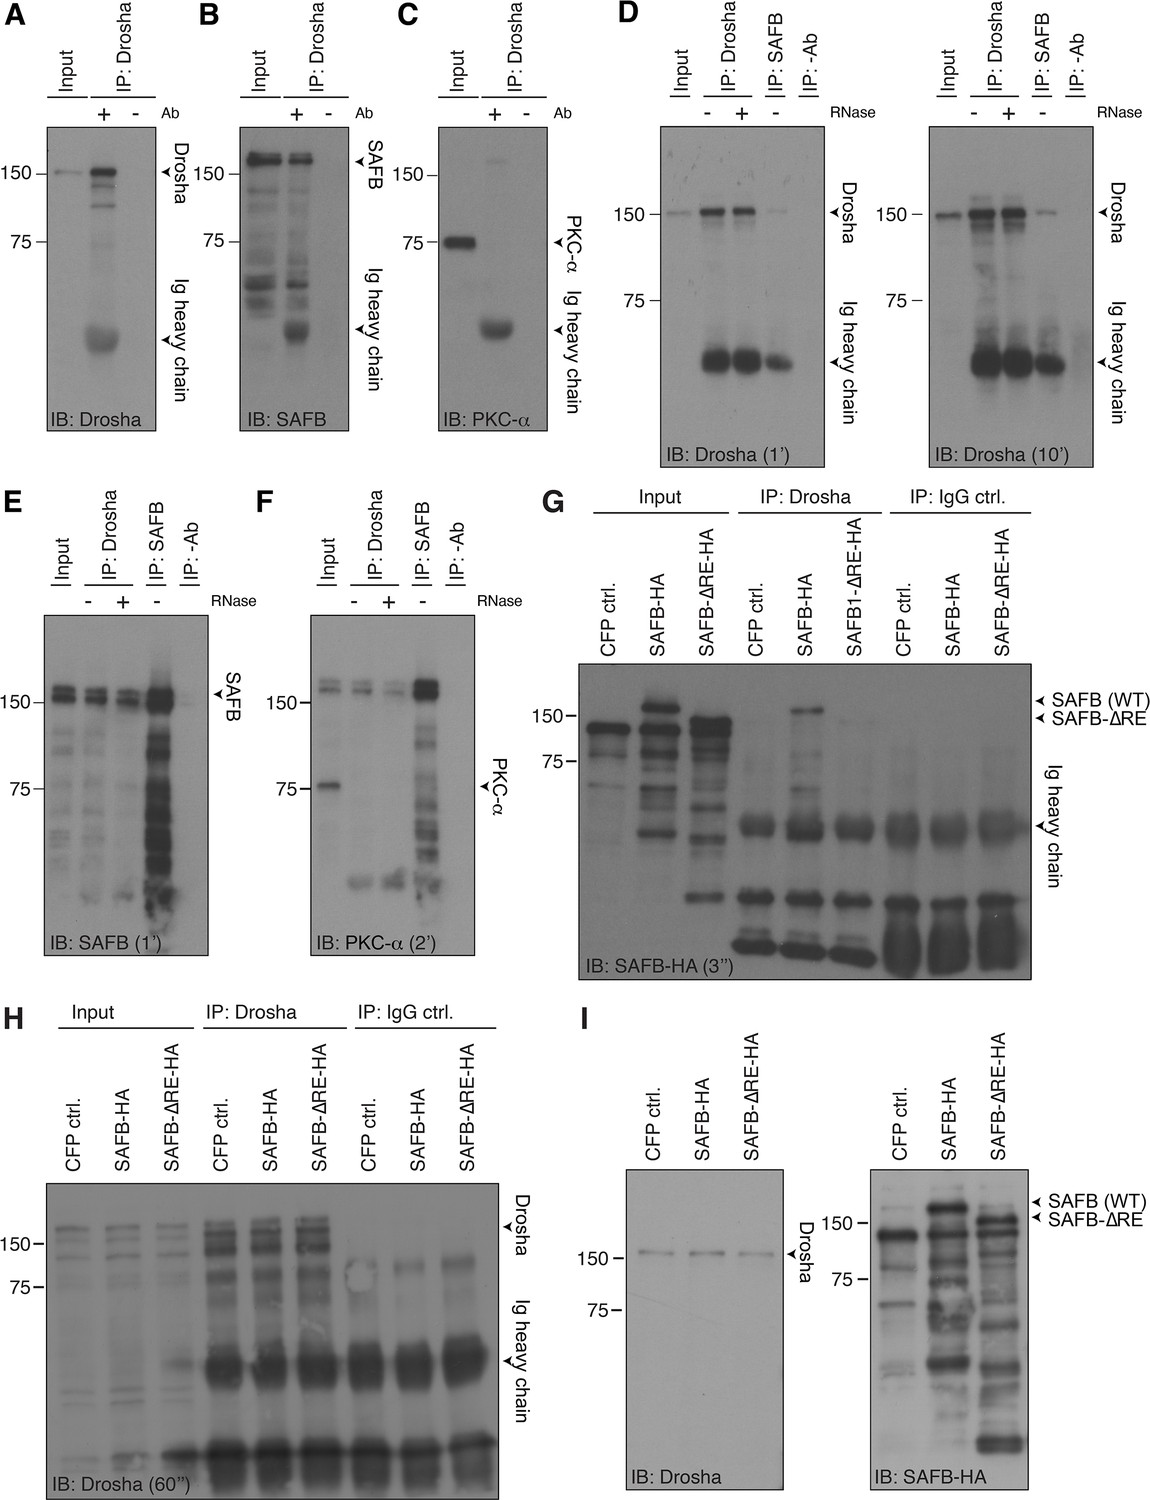
(A) Immunoblot (IB) of Drosha immunoprecipitation (IP) (related to Figure 5A) showing precipitation of Drosha. Immunoglobulin (Ig) heavy chain of the precipitating antibody detected in the immunoblots. Input: 2.5% of the lysate used in the IP. Negative control precipitation without antibody (-Ab). (B) IB of Drosha IP (related to Figure 5A) showing co-precipitation of SAFB. Ig heavy chain of the precipitating antibody detected in the immunoblots. Input: 2.5%. Negative control precipitation without antibody (-Ab). (C) IB of Drosha IP (related to Figure 5A) showing no precipitation of PKC-α. Ig heavy chain of the precipitating antibody detected in the IB. Input: 2.5%. Negative control precipitation without antibody (-Ab). (D) IB for Drosha of Drosha IP performed in the presence (+) or absence (-) of RNase and SAFB IP. Ig heavy chain of the precipitating antibody detected in the IB. Input: 2.5%. Negative control precipitation without antibody (-Ab). Exposure times: 1 and 10 min. (E) IB for SAFB of Drosha IP and SAFB IP performed in the presence (+) or absence (-) of RNase. Input: 2.5% of the lysate used in the IP. Negative control precipitation without antibody (-Ab). Exposure time: 1 min. (F) IB for PKC-α of Drosha IP and SAFB IP performed in the presence (+) or absence (-) of RNase showing no precipitation of PKC-α (note: re-blotted after SAFB detection without stripping of the blot). Input: 2.5% of the lysate used in the IP. Negative control precipitation without antibody (-Ab). Exposure time: 2 min. (G) IB with anti-HA antibodies of Drosha IP and control IgG-IP of transfected N2A cells expressing CFP ctrl. (not HA-tagged), SAFB-HA, or SAFB-ΔRE-HA. Input: 2.5% of the lysate used in the IP. Negative control precipitation without/with IgG isotype control antibody (IgG ctrl.). (H) IB for Drosha of Drosha IP and control IgG IP of transfected N2A cells expressing CFP ctrl. (not HA-tagged), SAFB-HA, or SAFB-ΔRE-HA showing precipitation of endogenous Drosha. Analysis confirms equal levels of Drosha in all three samples in input and IP, respectively. Input: 2.5% of the lysate used in the IP. Negative control precipitation without with IgG isotype control antibody (IgG ctrl.). (I) IB for endogenous Drosha as loading control and with anti-HA antibodies of transfected dentate gyrus (DG) neural stem cells (NSCs) cells expressing CFP ctrl. (not HA-tagged), SAFB-HA (migrating at ~160 kDa), or SAFB-ΔRE-HA (migrating at ~145 kDa).
Figure 6 with 1 supplement
SAFB binds and regulates endogenous Nfib expression.
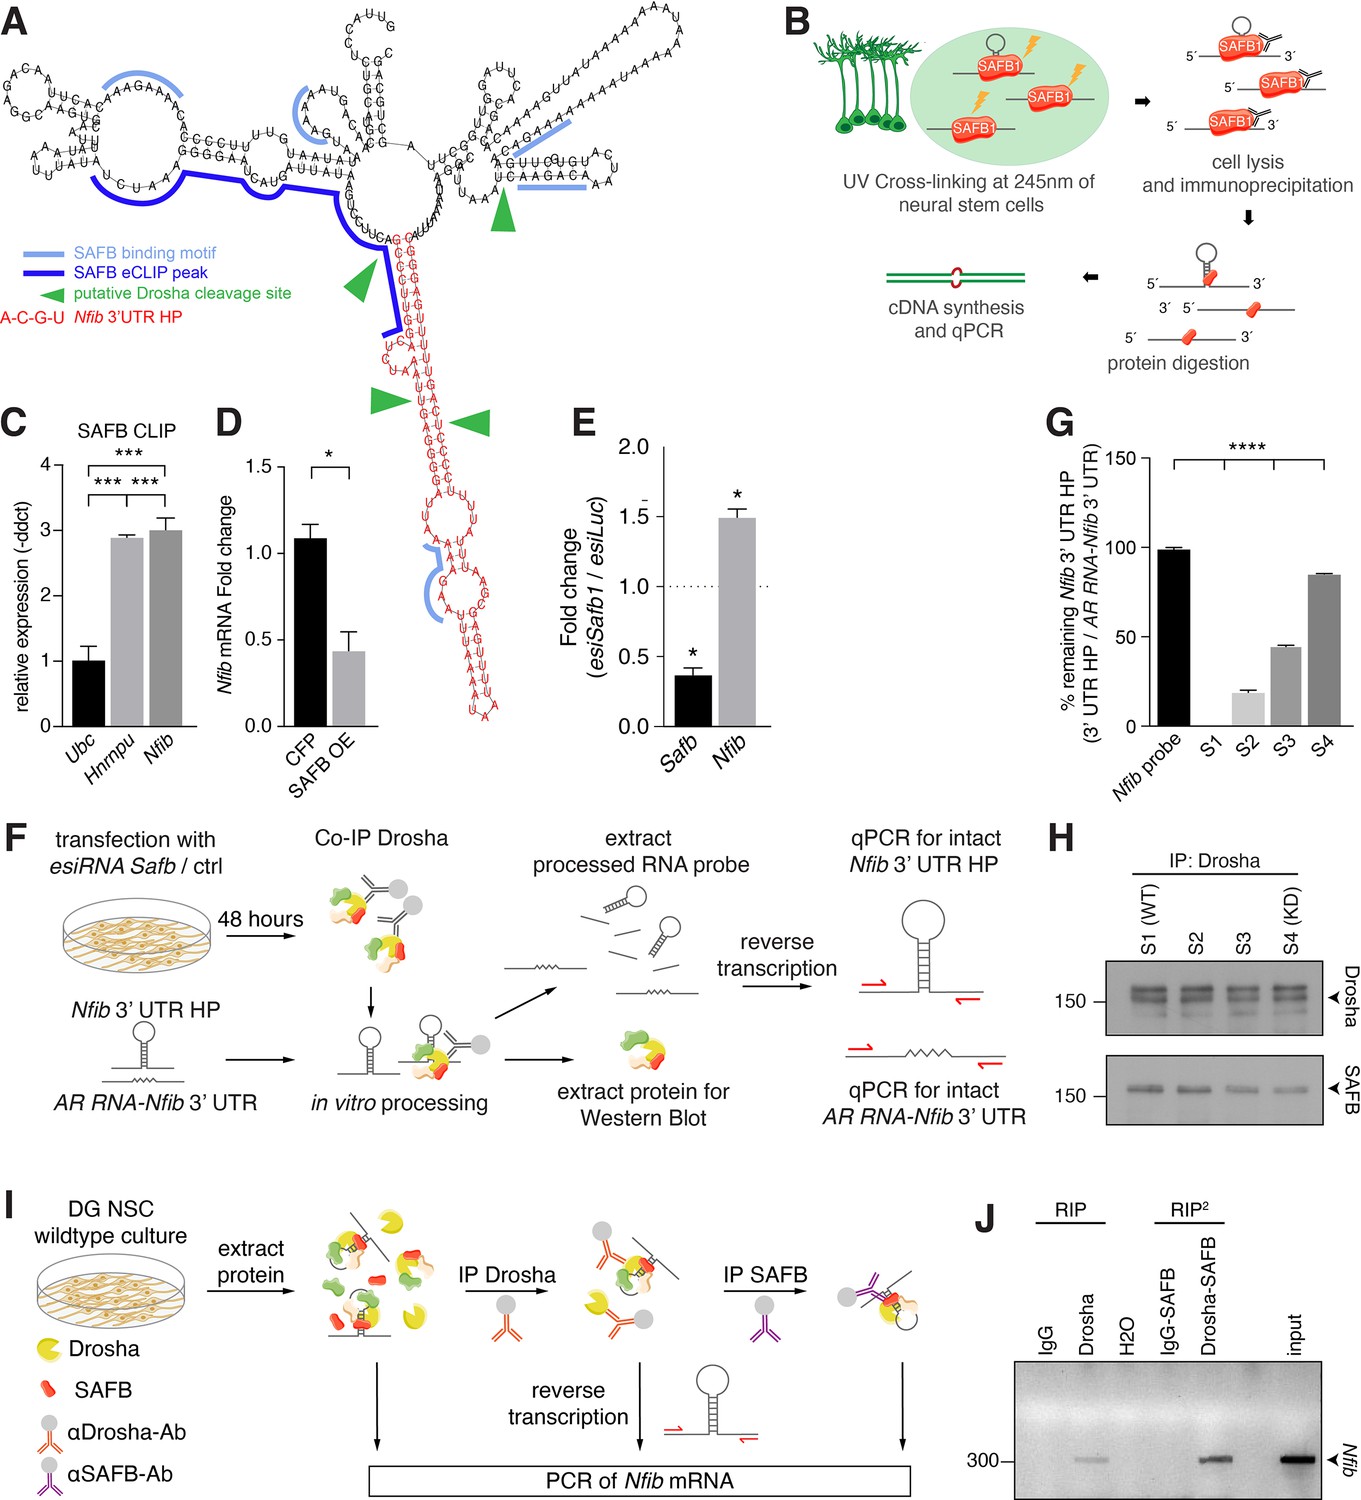
(A) In silico motif analysis of SAFB-binding sites (light and dark blue) and the predicted secondary structure of the Nfib 3’ untranslated region (UTR) hairpin (HP) (red). SAFB crosslinking and immunoprecipitation (CLIP) peak mapped on the Nfib mRNA in HepG cells by Van Nostrand et al., 2020. Putative Drosha cleavage sites (green arrowheads) mapped in Rolando et al., 2016. (B) Scheme of the experimental setup for SAFB CLIP from dentate gyrus (DG) neural stem cells (NSCs) and detection of bound RNA transcripts by quantitative reverse transcriptase PCR (RT-qPCR). (C) RT-qPCR analysis of SAFB CLIP from DG NSCs. Relative levels of Ubc, Hnrnpu, and Nfib pull-down (-ddct values) calculated over input and minus antibody (-Ab) control. Negative control: Ubc, positive control: Hnrnpu. n=3, one-way ANOVA with Holm-Sidak’s test: ***p<0.001. Error bars SEM. (D) RT-qPCR analysis of Nfib mRNA levels in DG NSCs transfected with Cfp or Safb overexpression (OE) vectors displayed as fold change Nfib mRNA over untransfected cells. n=4, two-tailed Mann-Whitney test: *p<0.05. Error bars SEM. (E) Quantification of relative Safb and Nfib mRNA expression levels in Safb knockdown (esiSafb) N2A cells after 48 hr compared to control (esiLuc) transfected cells. Two-tailed Student’s t-test: *p<0.05. Error bars SEM. (F) Scheme of the experimental setup for Drosha complex immunoprecipitation from N2A cells with/without Safb knockdown (esiSafb) and in vitro processing of Nfib 3’ UTR HP and AR RNA-Nfib 3’ UTR (control) RNA probes. Drosha complexes were immunoprecipitated with anti-Drosha antibodies under native conditions from Safb esiRNA knockdown (esiRNA Safb) N2A and untransfected (control) N2A cells. Drosha complexes from control and Safb knockdown cells were mixed (ratios 100:0, 66:33, 33:66, and 0:100) and incubated with 500 ng Nfib 3’ UTR HP RNA or AR RNA-Nfib 3’ UTR RNA probe for 30 min. Proteins and RNA were extracted and analyzed by immunoblot and RT-qPCR for intact Nfib 3’ UTR HP RNA and AR RNA-Nfib 3’ UTR RNA. Both the Nfib 3’ UTR HP RNA and AR RNA-Nfib 3’ UTR RNA probe share the same primer binding sequences. Although the in vitro processing experiment was performed in the presence of RNase inhibitor, the AR RNA-Nfib 3’ UTR RNA probe served as a control for non-specific RNase activity. (G) RT-qPCR analysis of intact Nfib 3’ UTR HP RNA probe after incubation with Drosha complexes (S1–S4). Unprocessed probe Nfib 3’ UTR HP (Nfib probe) was used to calculate the percent remaining intact probe in samples S1–S4. The levels of intact Nfib 3’ UTR HP probe were normalized to the levels of AR RNA-Nfib 3’ UTR hybrid probe (AR RNA-Nfib 3’ UTR) incubated with the same lysates and compared to input unprocessed Nfib probe levels (see Figure 6—figure supplement 1F and G). n=3, one-way ANOVA with Holm-Sidak’s test: ****p<0.0001. Error bars SEM. (H) Immunoblot analysis of Drosha and SAFB in the Drosha IP (immunoprecipitation) complexes in samples S1–S4 of the in vitro Nfib 3’ UTR HP and AR RNA-Nfib 3’ UTR probe processing experiments. Sample S1 has endogenous levels of SAFB, S4 is a SAFB KD (knockdown) sample. S2 and S3 are mixes of S1 and S4 in ratios 66:33 and 33:66, respectively. Drosha levels were constant in S1–S4. (I) Experimental scheme of tandem RNA-immunoprecipitation (RIP2), precipitating Nfib transcript with anti-Drosha and subsequentially with anti-SAFB antibodies in two consecutive RNA-immunoprecipitations (RIP). Samples for RT-PCR were analyzed after cell lysis (input), the first RIP (RIP) and reRIP (RIP2). (J) Gel electrophoresis of non-quantitative PCR samples from input, RIP, and RIP2 with specific amplicons for endogenous Nfib transcript (314 bp) in the respective sample lanes as opposed to IgG controls.
-
Figure 6—source data 1
Original data for Figure 6J.
- https://cdn.elifesciences.org/articles/74940/elife-74940-fig6-data1-v2.zip
-
Figure 6—source data 2
Original data for Figure 6J.
Unlabelled.
- https://cdn.elifesciences.org/articles/74940/elife-74940-fig6-data2-v2.zip
Figure 6—figure supplement 1
SAFB contributes to regulation of Nfib mRNA level.
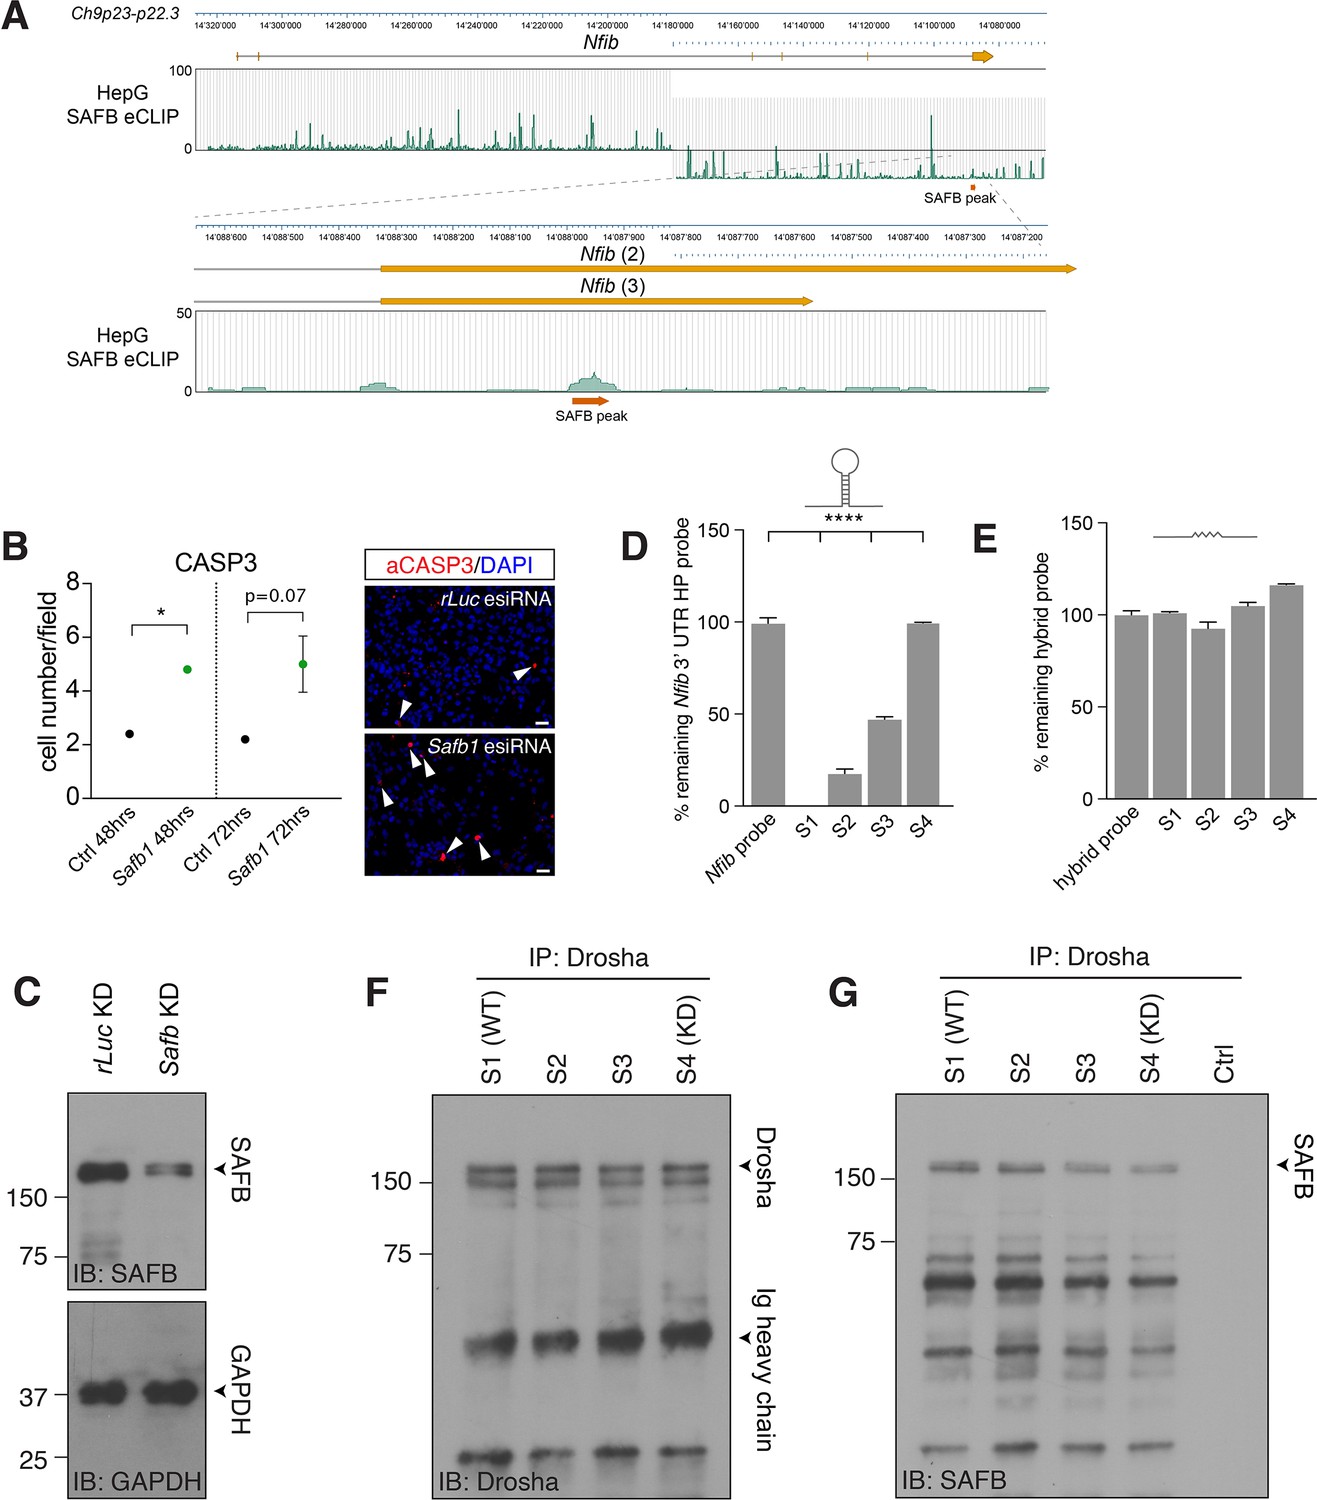
(A) Mapping of SAFB crosslinking and immunoprecipitation (CLIP) peaks from HepG cells to the Nfib in the minus strand of chromosome 9p23-p22.3 by Van Nostrand et al., 2020. Lower panel shows the peak call for SAFB binding in the two alternative 3’ untranslated region (UTR) regions of Nfib (transcripts 2 and 3), which corresponds precisely to the hairpin region and the CLIP site shown by Figure 6A; Rivers et al., 2015. (B) Quantification of activated Caspase 3 expression in Safb esiRNA knockdown and control (esiRNA rLuc) transfected cells after 48 and 72 hr. Safb knockdown results in a rapid induction of apoptosis. Two-tailed Student’s t-test: *p<0.05. Error bars SEM. (C) Immunoblot (IB) for SAFB in ctrl KD (esiRNA rLuc) and Safb KD (esiRNA Safb) lysates (related to Figure 6F). Densitometric analysis revealed 70% reduction in SAFB protein levels in the Safb knockdown (Safb KD) sample compared to control (ctrl: esiRNA rLuc). Loading control IB for GAPDH. (D) Quantitative reverse transcriptase PCR (RT-qPCR) analysis of intact Nfib 3’ UTR HP RNA probe after incubation with Drosha IP (immunoprecipitation) complexes. Unprocessed probe Nfib 3’ UTR HP (Nfib probe) was used to calculate the percent remaining of intact probe in samples S1–S4 (control- and Safb knockdown-Drosha complexes mixed at ratios S1 - 100:0, S2 - 66:33, S3 - 33:66, and S4 - 0:100, respectively). In vitro processing reactions were performed in the presence of RNase inhibitor. n=3, one-way ANOVA with Holm-Sidak’s test: ****p<0.0001. Error bars SEM. (E) RT-qPCR analysis of intact AR RNA-Nfib 3’ UTR hybrid probe after incubation with Drosha IP complexes. Unprocessed AR RNA-Nfib 3’ UTR hybrid probe (hybrid probe) was used to calculate the percent remaining, intact probe in samples S1–S4. In vitro processing reactions were performed in the presence of RNase inhibitor. (F) IB analysis of Drosha in Drosha IP complexes in samples S1–S4. Sample S1 is wild type SAFB, S4 corresponds to Safb KD sample. S2 and S3 are mixed S1 and S4 in ratios 66:33 and 33:66, respectively. Drosha levels were similar in S1–S4 used in in vitro Nfib 3’ UTR HP and hybrid Nfib-AR probe processing experiments. (G) IB analysis of SAFB expression in S1–S4 confirming a linear reduction in SAFB levels across the samples. Crtl - no Drosha IP complex.
-
Figure 6—figure supplement 1—source data 1
Original data for Figure 6—figure supplement 1C, F and G.
- https://cdn.elifesciences.org/articles/74940/elife-74940-fig6-figsupp1-data1-v2.zip
-
Figure 6—figure supplement 1—source data 2
Original data for Figure 6—figure supplement 1C, F and G.
Unlabelled.
- https://cdn.elifesciences.org/articles/74940/elife-74940-fig6-figsupp1-data2-v2.zip
Figure 7 with 1 supplement
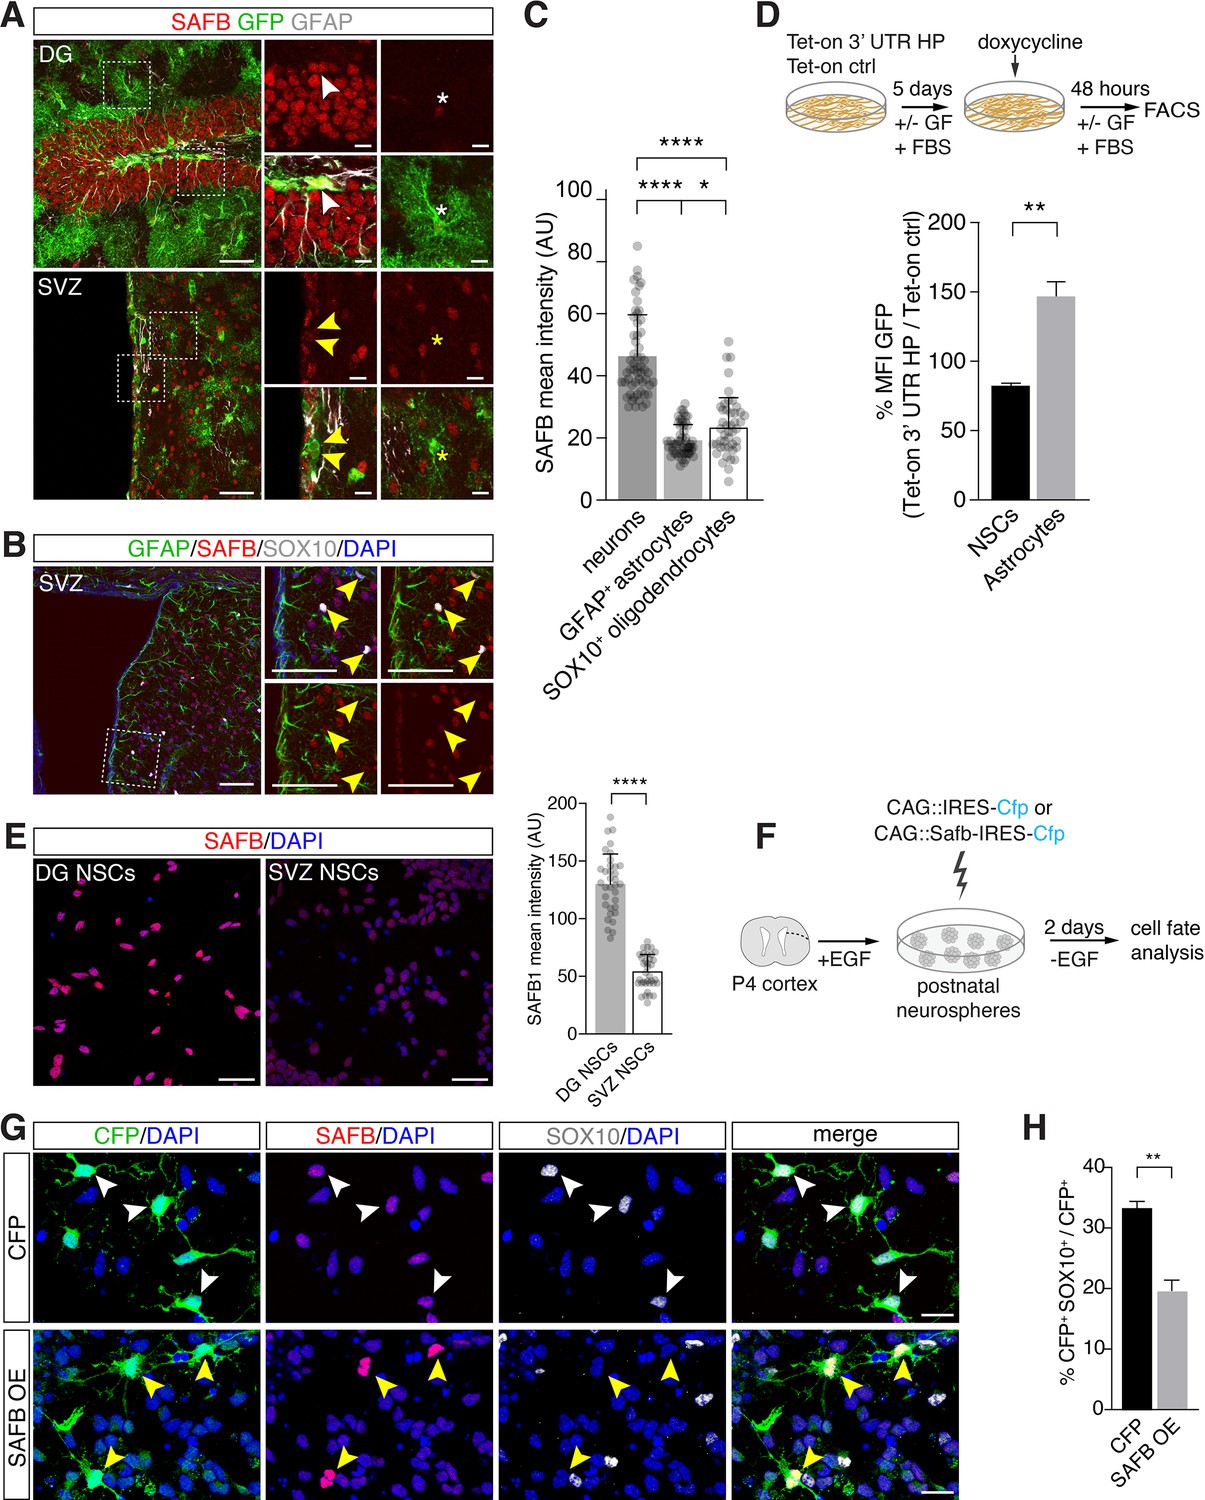
SAFB overexpression regulates oligodendrogenesis.
(A) SAFB expression in adult HES5+ dentate gyrus (DG) neural stem cell (NSC) marked with Hes5::CreERT2 and Rosa26-CAG::Egfp Cre-reporter (upper panels white arrowheads) and ventricular-subventricular zone (V-SVZ) NSCs genetically labeled with Hes5::CreERT2 and Rosa26-CAG::Egfp Cre-reporter (lower panels yellow arrowheads) in vivo. NSCs were labeled in vivo by Tamoxifen treatment of Hes5::CreERT2 Rosa26-CAG::Egfp mice (see Materials and methods). Regions of high-magnification images are indicated. DG NSCs (GFP+; white arrowheads upper panels) and DG neurons (GFP- cells) express higher levels of SAFB than astrocytes (white *). V-SVZ NSCs (GFP+; yellow arrowheads lower panels) and astrocytes (yellow *) express lower levels of SAFB than striatal neurons (GFP- cells). Scale bars: low-magnification images 100 µm, high-magnification images 20 µm. (B) V-SVZ of adult wild type mouse with astrocytic GFAP, oligodendrocytic SOX10, nuclear DAPI and SAFB labeling. High-magnification images correspond to region indicated. SOX10+ SVZ cells show low levels of SAFB (yellow arrowheads). Scale bars 100 µm. (C) Quantification of SAFB expression by neurons, astrocytes, and oligodendrocytes in vivo based on mean intensity levels (arbitrary units). One-way ANOVA with Holm-Sidak’s test: ****p<0.0001, ns - not significant. Error bars SEM. (D) Scheme of the experimental setup for quantification of EGFPd2 (GFP) protein fluorescence comparing Tet-on 3’ untranslated region (UTR) hairpin (HP) over Tet-on ctrl DG NSCs by FACS in undifferentiated NSC state and after growth factor (GF) removal and addition of fetal bovine serum (FBS) for 5 days to induce differentiation to astrocytes followed by a 48 hr doxycycline induction. Quantification of the median EGFPd2 (GFP) intensity of Tet-on 3’ UTR HP relative to Tet-on ctrl in NSCs and astrocytes. n=3, two-tailed Student’s t-test: **p<0.01. Error bars SEM. (E) Images and quantification of SAFB protein expression by adult DG NSCs and V-SVZ NSCs in vitro. Scale bar 20 µm. Kolmogorov-Smirnov test: ****p<0.0001. Error bars SEM. Scale bars 50 µm. (F) Scheme for the experimental setup for SAFB (CAG::Safb-IRES-Cfp) and control CFP (CAG::IRES-Cfp) overexpression in postnatal V-SVZ NSCs (postnatal day 4: P4) grown as neurospheres in the presence of EGF and cell fate analysis 2 days after EGF withdrawal (w/o EGF) to induce differentiation. (G) Analysis of the effects of SAFB overexpression (OE) in V-SVZ neurospheres and effects on oligodendrocyte (SOX10+) differentiation compared to CFP (control) expression. Scale bars 20 µm. (H) Quantification of the percentage of transfected cells (CFP+) expressing SOX10 (oligodendrocytes) after SAFB overexpression (OE) (n=4) or CFP alone (n=3). Two-tailed t-test with Welch’s correction: **p<0.01. Error bars SEM.
Figure 7—figure supplement 1
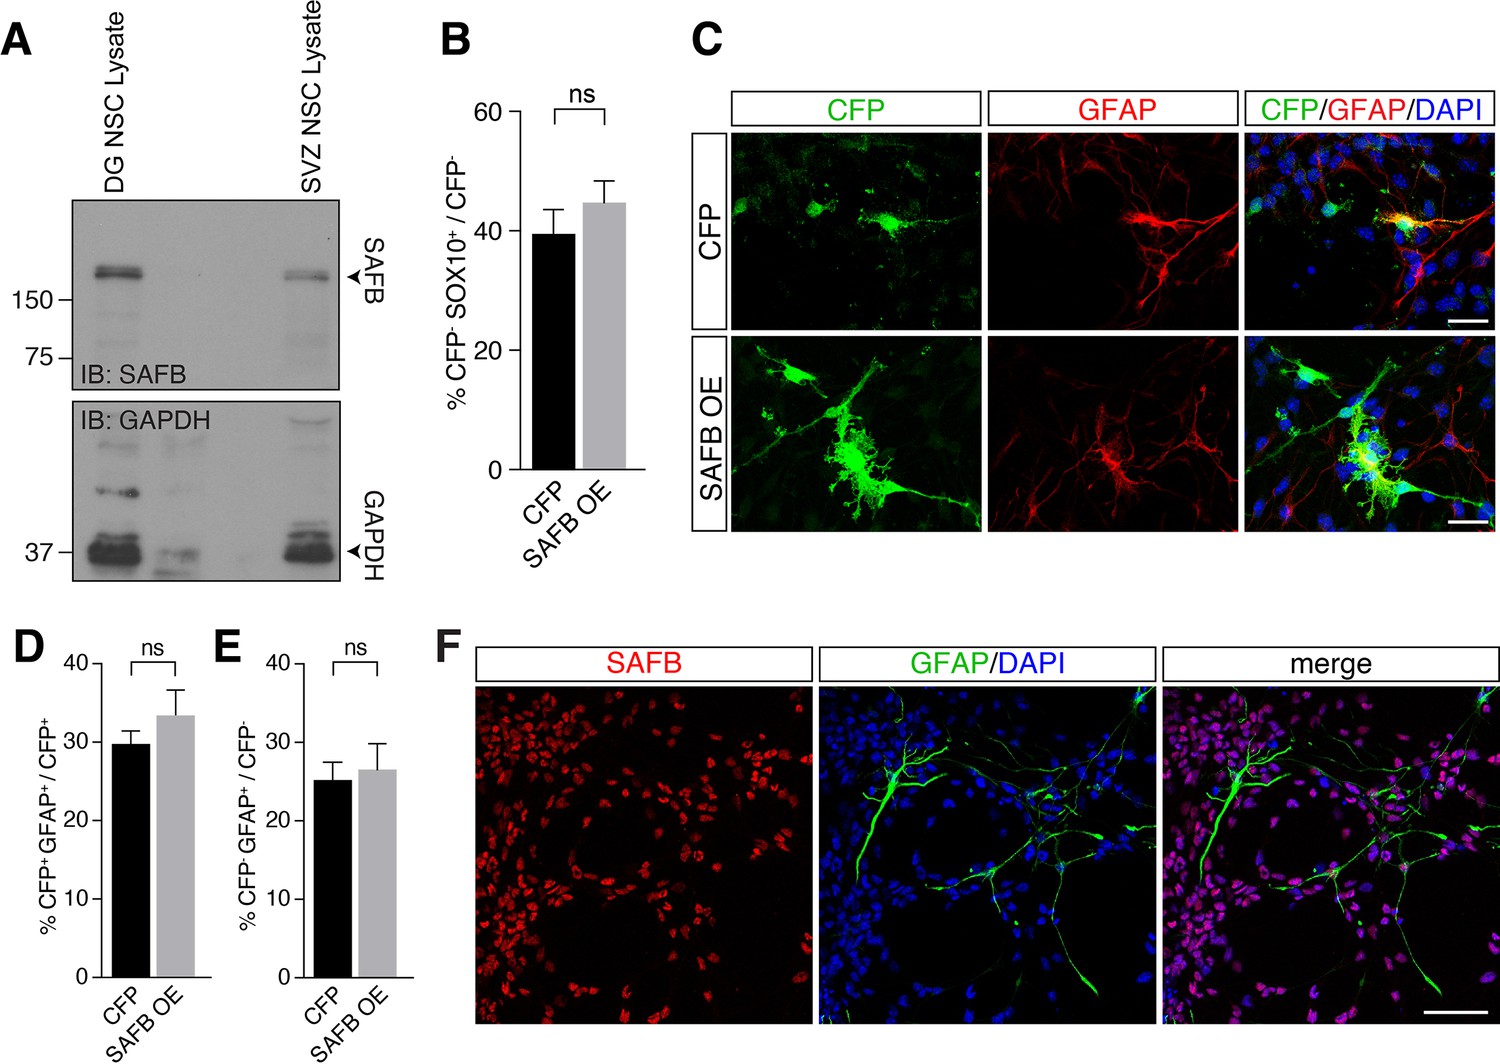
SAFB overexpression (OE) does not increase astrocyte differentiation.
(A) Immunoblot (IB) of cultured dentate gyrus (DG) and ventricular-subventricular zone (V-SVZ) neural stem cells (NSCs) (related to Figure 7E). Densitometric analysis indicates lower SAFB expression in the V-SVZ NSCs (49% of DG NSCs) compared to DG NSCs. Loading control IB for GAPDH. (B) Quantification of immunohistochemistry for CFP negative cells (related to Figure 7G). Mean percentage of CFP-SOX10+ cells in the CFP control transfected (CAG::IRES-Cfp, n=3) and SAFB OE (CAG::Safb-IRES-Cfp, n=4) samples are shown as percentage of untransfected (CFP-). Two-tailed t-test with Welch’s correction: **p<0.01. Error bars SEM. (C) SAFB OE in perinatal V-SVZ NSC neurospheres. Cells were transfected with CFP (CAG::IRES-Cfp) or SAFB OE vectors (CAG::Safb-IRES-Cfp). Staining for CFP and GFAP. Scale bar: 20 µm. (D) Quantification of immunohistochemistry for CFP positive cells. Mean percentage of CFP+GFAP+ cells in the CFP control transfected (CAG::IRES-Cfp, n=3) and SAFB OE (CAG::Safb-IRES-Cfp, n=4) samples are shown as percentage of transfected cells (CFP+). Two-tailed t-test with Welch’s correction: **p<0.01. Error bars SEM. (E) Quantification of immunohistochemistry for CFP negative cells. Mean percentage of CFP-GFAP+ cells in the CFP control transfected (CAG::IRES-Cfp, n=3) and SAFB OE (CAG::Safb-IRES-Cfp, n=4) samples are shown as percentage of untransfected (CFP-). Two-tailed t-test with Welch’s correction: **p<0.01. Error bars SEM. (F) SAFB expression in cultured DG NSCs. Immunofluorescent staining for SAFB and GFAP. Scale bar 50 µm.
-
Figure 7—figure supplement 1—source data 1
Original data for Figure 7—figure supplement 1A.
- https://cdn.elifesciences.org/articles/74940/elife-74940-fig7-figsupp1-data1-v2.zip
-
Figure 7—figure supplement 1—source data 2
Original data for Figure 7—figure supplement 1A.
Unlabelled.
- https://cdn.elifesciences.org/articles/74940/elife-74940-fig7-figsupp1-data2-v2.zip
Figure 8
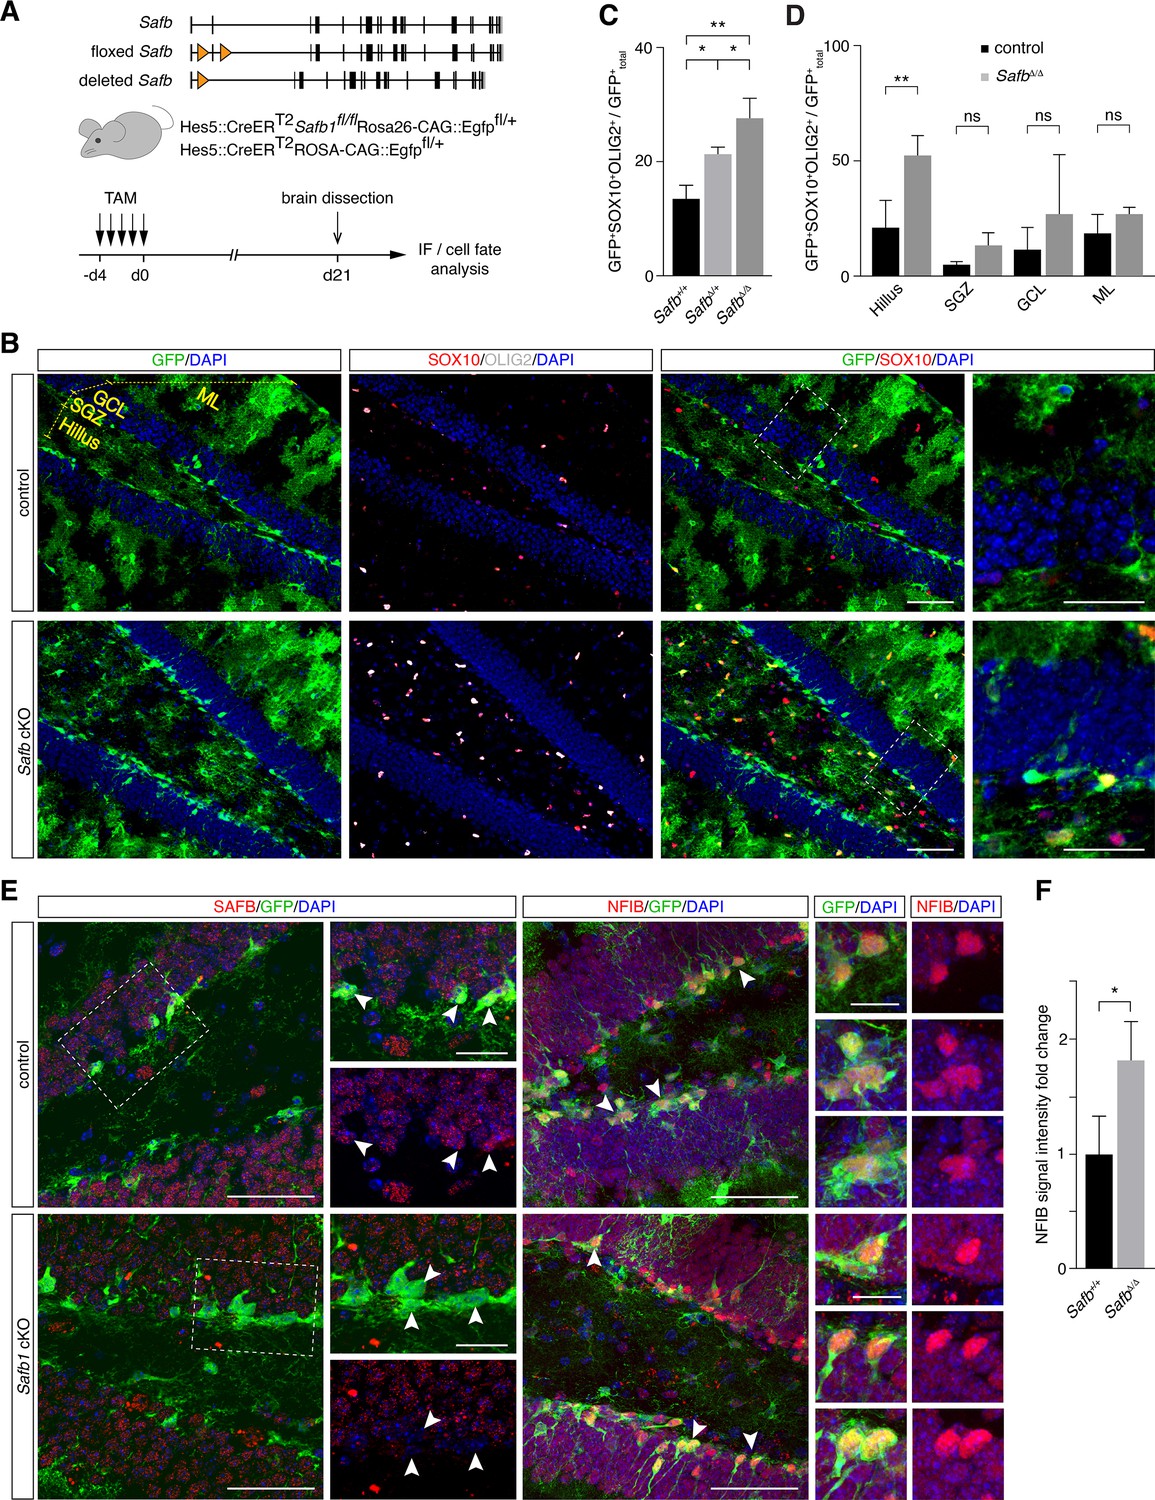
Safb cKO in neural stem cells (NSCs) increases oligodendrogenic fate in the adult hippocampus.
(A) Exon II floxed Safb (Safbfl/fl) mice were bred with Hes5::CreERT2 Rosa26-CAG::Egfp Cre-reporter mice to generate Safbfl/fl Hes5::CreERT2 Rosa26-CAG::Egfp and Safb+/+ Hes5::CreERT2 Rosa26-CAG::Egfp control animals. Cre-recombinase deletes the exon II of the Safb gene resulting in a null allele and expression of GFP from the Rosa26-CAG::Egfp allele to trace the fate of the NSCs and their progeny. Eight-week-old adult mice were treated with Tamoxifen (TAM) by intraperitoneal injection for 5 consecutive days and the animals sacrificed 21 days later for analysis by immunofluorescence (IF). (B) Representative immunofluorescent images of the dentate gyrus (DG) stained with antibodies against GFP, SOX10, and OLIG2 and counterstained with DAPI. Scale bar low-magnification images: 50 µm, high-magnification images: 20 µm. High-magnification images correspond to regions indicated by boxes in the lower magnification images. Subdivision of DG compartments indicated and labeled in yellow. (C) Quantification of GFP+SOX10+OLIG2+ triple-positive cells over total GFP+ cells (arbitrary units). Statistical comparison of GFP+SOX10+OLIG2+ oligodendrocytes over total GFP+ cells in control (Safb+/+), heterozygous (SafbΔ/+), and homozygous (SafbΔ/Δ) mice. Δ - Cre-deleted allele. ANOVA with Holm-Sidak’s test: *p<0.05, **p<0.01. Error bars SEM. (D) Subdivision and quantification in distinct compartments of the DG comparing GFP+SOX10+OLIG2+ oligodendrocytes over total GFP+ in control and Safb cKO (homozygous SafbΔ/Δ) mice. Individual two-tailed t-test with Welch’s correction: **p<0.01, ns: not significant. Error bars SEM. Safb cKO: conditional knockout. (E) Immunofluorescent images of the DG of control and Safb cKO mice stained with antibodies against SAFB, GFP, and NFIB and counterstained with DAPI. GFP-expressing cells are Hes5::CreERT2-expressing NSC (white arrowheads) and their progeny. Scale bar low-magnification images: 50 µm, high-magnification images: 20 µm. High-magnification images correspond to regions indicated by boxes in the lower magnification images. (F) Quantification of the relative NFIB signal intensity in GFP+ cells in the DG of control (Safb+/+) and Safb cKO (SafbΔ/Δ) animals (arbitrary units). Two-tailed t-test with Welch’s correction: *p<0.05. Error bars SEM.
Author response image 1

Expression of NFIB in the V-SVZ of adult Hes5::CreERT2 Rosa26-CAG::Egfp mice 21 days after Tamoxifen induction (as described in Figure 8A of the manuscript) and lineage tracing of V-SVZ neural stem cells and their progeny (GFP+).
NFIB expression was found in the stem and progenitor cells of the V-SVZ (arrowheads) and GFAP+ astrocytes in the striatum (*).
Tables
Appendix 1—key resources table
| Reagent type (species) or resource | Designation | Source or reference | Identifiers | Additional information |
|---|---|---|---|---|
| Antibody | Anti-BLBP (rabbit polyclonal) | Millipore | Cat #ABN14, RRID:AB_10000325 | IF: 1:500 |
| Antibody | Anti-activated cleaved Caspase-3 (rabbit monoclonal) | Cell Signaling Technology | Cat #9664, RRID:AB_2070042 | IF: 1:400 |
| Antibody | Anti-goat Alexa647 (donkey polyclonal) | Jackson ImmunoResearch | Cat #705-605-147, RRID:AB_2340437 | IF: 1:600 |
| Antibody | Anti-mouse Cy3 (donkey polyclonal) | Jackson ImmunoResearch | Cat #715-165-151, RRID:AB_2315777 | IF: 1:600 |
| Antibody | Anti-rabbit Alexa488 (donkey polyclonal) | Jackson ImmunoResearch | Cat #711-545-152, RRID:AB_2313584 | IF: 1:600 |
| Antibody | BV421-labeled anti-CD44 (mouse monoclonal) | BioLegend | Cat #103039, RRID:AB_10895752 | FACS: 1:10 |
| Antibody | BV421-labeled anti-rat IgG2b isotype control (mouse monoclonal) | BioLegend | Cat #400639, RRID:AB_10895758 | FACS: 1:10 |
| Antibody | Anti-Drosha (rabbit monoclonal) | Cell Signaling Technology | Cat #3364, RRID:AB_2238644 | IB: 1:1000 IP: 1:50 |
| Antibody | IgG control (rabbit monoclonal) | Cell Signaling Technology | Cat #3900, RRID:AB_1550038 | IP: 1:50 |
| Antibody | Anti-HA tag (rabbit monoclonal) | Cell Signaling Technology | Cat #3724, RRID:AB_1549585 | IB: 1:1000 |
| Antibody | Anti-GAPDH (mouse monoclonal) | Calbiochem | CB1001, RRID:AB_2107426 | IB: 1:1500 |
| Antibody | Anti-GFAP (Glial Fibrillary acidic protein) (mouse monoclonal) | Sigma-Aldrich | Cat #G3893, RRID:AB_477010 | IF: 1:200 |
| Antibody | Anti-GFP (Green fluorescent protein) (sheep polyclonal) | AbD Serotec/Bio-Rad | Cat #4745–1051 RRID:AB_619712 | IF: 1:250 |
| Antibody | Anti-GFP (Green fluorescent protein) (rabbit polyclonal) | Invitrogen/Thermo Fisher Scientific | Cat #A11122 RRID:AB_221569 | IF: 1:700 |
| Antibody | Anti-GFP (Green fluorescent protein) (chicken) | Aves Labs | Cat #GFP-1020, RRID:AB_10000240 | IF: 1:500 |
| Antibody | Anti-MAP2 (mouse monoclonal) | Sigma-Aldrich | Cat #M4403, RRID:AB_477193 | IF: 1:200 |
| Antibody | Anti-NFIB (rabbit polyclonal) | Invitrogen/Thermo Fisher Scientific | Cat #PA5-52032, RRID:AB_2644645 | IF: 1:1000 |
| Antibody | Anti-OLIG2 (rabbit polyclonal) | Chemicon | Cat #AB9610, RRID:AB_570666 | IF: 1:500 |
| Antibody | Anti-PKC-alpha (mouse monoclonal) | Santa Cruz | Cat #sc-8393, RRID:AB_628142 | IB: 1:500 |
| Antibody | HRP-conjugated anti-Rabbit IgG, light chain (mouse monoclonal) | Jackson ImmunoResearch Labs | Cat #211-032-171, RRID:AB_2339149 | IB: 1:5000 |
| Antibody | Anti-S100b (mouse monoclonal) | Sigma-Aldrich | Cat #S2532, RRID:AB_477499 | IF: 1:100 |
| Antibody | Anti-SAFB (rabbit monoclonal) | Abcam | Cat #ab187650, RRID:AB_2814774 | IF: 1:200 IP: 1:50 |
| Antibody | Anti-SOX10 (goat polyclonal) | Santa Cruz | Cat #sc-17342; RRID:AB_2195374 | IF: 1:500 |
| Chemical compound, drug | B27 Supplement (50×) | Gibco | Cat #17504044 | |
| Chemical compound, drug | DMEM:F-12+GlutaMAX | Gibco | Cat #31331-028 | |
| Chemical compound, drug | cOmplete Protease Inhibitor Cocktail | Roche/Sigma-Aldrich | Cat #11697498001 | |
| Chemical compound, drug | EGF (Recombinant Mouse EGF Protein, CF) | R&D Systems | Cat #MAB2028-100 | |
| Chemical compound, drug | FGF2 (Recombinant Mouse FGF basic, CF) | R&D Systems | Cat #233-FB-025 | |
| Chemical compound, drug | Formaldehyde (16% methanol free) | Thermo Fisher Scientific | Cat #28906 | |
| Chemical compound, drug | Glycine | Sigma-Aldrich | Cat #50046-1KG | |
| Chemical compound, drug | L-15 Medium | Invitrogen | Cat #31415029 | |
| Chemical compound, drug | Normal Donkey Serum | Jackson ImmunoResearch | Cat #017-000-121 | |
| Chemical compound, drug | Papain | Sigma-Aldrich | Cat #P3125-100MG | |
| Chemical compound, drug | Protein G Dynabeads | Invitrogen | Cat #10003D | |
| Chemical compound, drug | SsoAdvanced Universal Probes Supermix | Bio-Rad | Cat #172-5280 | |
| Chemical compound, drug | Trizol | Invitrogen | Cat #VX15596026 | |
| Chemical compound, drug | Trypsin inhibitor Glycine max (Soybean)/Ovomucoid | Sigma-Aldrich | Cat #T6522-100MG | |
| Commercial assay or kit | ECL Blotting Reagents | GE Healthcare | Cat #GERPN2109 | |
| Commercial assay or kit | HiScribe T7 High Yield RNA Synthesis Kit | New England Biolabs | Cat #E2040 | |
| Commercial assay or kit | In-Fusion HD Cloning Plus | Takara-Clontech | Cat #638910 | |
| Commercial assay or kit | Pierce BCA Protein Assay Kit | Thermo Fisher Scientific | Cat #23225 | |
| Commercial assay or kit | Pierce Magnetic RNA-Protein Pull-Down Kit | Thermo Fisher Scientific | Cat #20164 | |
| Commercial assay or kit | Pierce RNA 3' End Desthiobiotinylation Kit | Thermo Fisher Scientific | Cat #20163 | |
| Commercial assay or kit | P3 Primary Cell 4D- Nucleofector X Kit S | Lonza | Cat #V4XP-3032 | |
| Commercial assay or kit | Q5 Site-Directed Mutagenesis Kit | New England Biolabs | Cat #E0554S | |
| Commercial assay or kit | Lipofectamine RNAiMAX Transfection Reagent | Thermo Fisher Scientific | Cat #13778100 | |
| Commercial assay or kit | SuperScript IV VILO Master Mix with ezDNase Enzyme | Thermo Fisher Scientific | Cat #11766500 | |
| Commercial assay or kit | TransFectin Lipid Reagent | Bio-Rad | Cat #1703351 | |
| Commercial assay or kit | Re-ChIP-IT | Active Motif | Cat #53016 | |
| Genetic reagent (Mouse) | Rosa26-CAG::Egfp | Lugert et al., 2012 | Gt(ROSA)26Sortm1(CAG-EGFP) | C57BL6 genetic background |
| Genetic reagent (Mouse) | Hes5::CreERT2 | Lugert et al., 2010 | Tg(Hes5-cre/ERT2)2Vtlr | C57BL6 genetic background |
| Genetic reagent (Mouse) | Rosa26-CAG::Egfp Hes5::CreERT2 | This paper | Gt(ROSA)26Sortm1(CAG-EGFP) Tg(Hes5-cre/ERT2)2Vtlr | C57BL6 genetic background |
| Genetic reagent (Mouse) | Droshafl/fl | Chong et al., 2010 | Droshatm1Litt | C57BL6 genetic background |
| Genetic reagent (Mouse) | Rosa26-CAG::Egfp Hes5:: CreERT2 Droshafl/fl | This paper | Gt(ROSA)26Sortm1(CAG-EGFP) Tg(Hes5-cre/ERT2)2Vtlr Droshatm1Litt | C57BL6 genetic background |
| Genetic reagent (Mouse) | Safbfl/fl | This paper | Safbem1(flE2)Vtlr | C57BL6 genetic background |
| Genetic reagent (Mouse) | Rosa26-CAG::Egfp Hes5::CreERT2 Safbfl/fl | This paper | Gt(ROSA)26Sortm1(CAG-EGFP) Tg(Hes5-cre/ERT2)2Vtlr Safbem1(flE2)Vtlr | C57BL6 genetic background |
| Biological sample (Mouse) | Adult hippocampal WT neural stem cells | This paper | WT DG NSCs | Primary neural stem cells from C57BL6 mice |
| Biological sample (Mouse) | Adult hippocampal Droshafl/fl Tet-on EGFPd2 neural stem cells | This paper | Tet-on ctrl DG NSCs | Primary neural stem cells from C57BL6 mice |
| Biological sample (Mouse) | Adult hippocampal Droshafl/fl Tet-on Nfib 3'UTR- EGFPd2 neural stem cells | This paper | Tet-on 3’UTR DG NSCs | Primary neural stem cells from C57BL6 mice |
| Biological sample (Mouse) | Adult hippocampal Droshafl/fl Tet-ON Nfib 5'UTR- EGFPd2 neural stem cells | This paper | Tet-on 5’UTR DG NSCs | Primary neural stem cells from C57BL6 mice |
| Sequence-based reagent | Drosha-f | Roche | N/A | CCGTCTCTAGAAAGGTCCTACAAG (with UPL probe 12) |
| Sequence-based reagent | Drosha-r | Roche | N/A | GGCTCAGGAGCAACTGGTAA (with UPL probe 12) |
| Sequence-based reagent | Egfpd2-f | Roche | N/A | GAAGCGCGATCACATGGT (with UPL probe 67) |
| Sequence-based reagent | Egfpd2-r | Roche | N/A | CCATGCCGAGAGTGATCC (with UPL probe 67) |
| Sequence-based reagent | HNRNPU-f | Roche | N/A | CAACAGAGGGAACTATAACCAGAAC(with UPL probe 74) |
| Sequence-based reagent | HNRNPU-r | Roche | N/A | GCTTCTGACCCCAGAATTGA(with UPL probe 74) |
| Sequence-based reagent | MISSION esiRNA Safb | Sigma-Aldrich | Cat #EMU167381 | esiRNA |
| Sequence-based reagent | MISSION esiRNA rLuciferase | Sigma-Aldrich | Cat #EHURLUC | esiRNA |
| Sequence-based reagent | BLOCK-iT Alexa Fluor 555 | Sigma-Aldrich | Cat #14750100 | esiRNA control |
| Sequence-based reagent | Nfib-f | Roche | N/A | TCAAGCCAATCGATATGTGG(with UPL probe 4) |
| Sequence-based reagent | Nfib-r | Roche | N/A | GAACCAAGCTAGCCCAGGTA (with UPL probe 4) |
| Sequence-based reagent | Nfib 3'-f | This paper | N/A | GTTACCTCTGCATGCAACAG |
| Sequence-based reagent | Nfib 3’-r | This paper | N/A | GCTGCAGCTAAGCCAACCT |
| Sequence-based reagent | UBC-f | Roche | N/A | GACCAGCAGAGGCTGATCTT(with UPL probe 11) |
| Sequence-based reagent | UBC-r | Roche | N/A | CCTCTGAGGCGAAGGACTAA(with UPL probe 11) |
| Sequence-based reagent | Safb-f2 | This paper | N/A | GAGAAAGCCTTTGTCGAGGAGCTAGG |
| Sequence-based reagent | Safb-r2 | This paper | N/A | GAGGCTATGTGAAGCTGGAAGACCA |
| Recombinant DNA reagent | pSplit2-NO-PRPF6 (plasmid) | Maita et al., 2014 | RRID: Addgene_51740 | pSplit2 expression vector |
| Recombinant DNA reagent | pcDNA3.1 SAFB (plasmid) | Townson et al., 2003 | RRID: Addgene_32742 | pcDNA3.1 expression vector |
| Recombinant DNA reagent | GUM BUB3 (plasmid) | Toledo et al., 2014 | RRID: Addgene_84029 | expression vector |
| Recombinant DNA reagent | mCherry-PABPN1 (plasmid) | Chou et al., 2015 | https://doi.org/10.1093/hmg/ddv238 | CMV-based expression vector |
| Recombinant DNA reagent | pCAG TDP-43 (plasmid) | Verdon Taylor Lab | N/A | pCAG expression vector |
| Recombinant DNA reagent | pcDNA3.2-FUS- 1-526aa-V5 (plasmid) | Yoo et al., 2011 | RRID: Addgene_29609 | pcDNA3.2 expression vector |
| Recombinant DNA reagent | pcDNA3 HA Sam68 WT (plasmid) | Lin et al., 1997 | RRID: Addgene_17690 | pcDNA3 expression vector |
| Recombinant DNA reagent | pCDNA3.1 DGCR8-FLAG (plasmid) | Ueli Suter | N/A | pcDNA3.1 expression vector |
| Recombinant DNA reagent | pcDNA4 DDX5-HA-myc-His (plasmid) | Tanja Vogel Lab | N/A | pcDNA4 expression vector |
| Recombinant DNA reagent | pDESTmycDDX17 (plasmid) | Landthaler et al., 2008 | RRID: Addgene_19876 | pDEST expression vector |
| Recombinant DNA reagent | pEGFP-DHX9 (plasmid) | Fidaleo et al., 2015 | https://doi.org/10.18632/oncotarget.5033 | pEGFP expression vector |
| Recombinant DNA reagent | pEGFPC1-6XHis- FLKSRP (plasmid) | Hall et al., 2004 | RRID: Addgene_23001 | pEGFPC1 expression vector |
| Recombinant DNA reagent | pENTR-D-Topo- hTRIM9 (plasmid) | Short and Cox, 2006 | RRID: Addgene_51032 | pENTR expression vector |
| Recombinant DNA reagent | pFRT/FLAG/HA-DEST QKI (plasmid) | Landthaler et al., 2008 | RRID: Addgene_19891 | pFRT expression vector |
| Recombinant DNA reagent | pFRT/TO/HIS/FLAG/ HA-HNRNPU (plasmid) | Baltz et al., 2012 | RRID: Addgene_38068 | pFRT expression vector |
| Recombinant DNA reagent | pFRT/TO/HIS/FLAG/ HA-SART1 (plasmid) | Baltz et al., 2012 | RRID: Addgene_38087 | pFRT expression vector |
| Recombinant DNA reagent | pHR-HNRNPA1C- mCh-Cry2WT (plasmid) | Shin et al., 2017 | RRID: Addgene_101226 | pHR expression vector |
| Recombinant DNA reagent | pCAG::[RBP]-IRES- Cfp (plasmid) | This paper | N/A | pCAG expression vector |
| Recombinant DNA reagent | pCAG::IRES-Cfp (plasmid) | Moore et al., 2015 | N/A | pCAG expression vector |
| Recombinant DNA reagent | pGEMT Nfib 3'UTR HP (plasmid) | Rolando et al., 2016 | https://doi.org/10.1016/j.stem.2016.07.003 | pGEM cloning plasmid |
| Recombinant DNA reagent | pGEMT Nfib 5'UTR HP (plasmid) | Rolando et al., 2016 | https://doi.org/10.1016/j.stem.2016.07.003 | pGEM cloning plasmid |
| Recombinant DNA reagent | pCAG::GFPd2 (plasmid) | Matsuda and Cepko, 2007 | RRID: Addgene_14760 | pCAG expression vector |
| Recombinant DNA reagent | pMITom::nlsCre (plasmid) | Verdon Taylor Lab | N/A | Retrovirus-based expression vector |
| Recombinant DNA reagent | Tet-on::Egfpd2 (plasmid) | This paper | N/A | pTET-ONE expression vector |
| Recombinant DNA reagent | Tet-on::Nfib 3' UTR Egfpd2 (plasmid) | This paper | N/A | pTET-ONE expression vector |
| Recombinant DNA reagent | Tet-on::Nfib 5' UTR Egfpd2 (plasmid) | This paper | N/A | pTET-ONE expression vector |
| Recombinant DNA reagent | Tet-One Inducible Expression System (plasmid) | Takara-Clontech | Cat #634301 | pTET-ONE expression vector |
| Software, algorithm | Cytoscape | Cytoscape Consortium | https://cytoscape.org/ | |
| Software, algorithm | FlowJo | Becton, Dickinson & Company | https://www.flowjo.com/ | |
| Software, algorithm | GO PANTHER | GENEONTOLOGY | http://geneontology.org/ | |
| Software, algorithm | GraphPad Prism 8 | GraphPad | https://www.graphpad.com/scientific-software/prism/ | |
| Software, algorithm | Illustrator | Adobe | https://www.adobe.com/Illustrator | |
| Software, algorithm | Lasergene | DNASTAR | https://www.dnastar.com/software/lasergene/ | |
| Software, algorithm | MetaCore | Cortellis | OMICS_02716 | |
| Software, algorithm | Omero | OME | https://www.openmicroscopy.org/about/ | |
| Software, algorithm | Photoshop | Adobe | https://www.adobe.com/Photoshop | |
| Software, algorithm | Fiji (Fiji is just ImageJ) | Open Source | https://fiji.sc/ | |
| Software, algorithm | STRING database | ELIXIR | https://string-db.org/ |
Additional files
-
Supplementary file 1
List of proteins identified in the Drosha IP experiments.
Proteins significantly enriched over control IP are marked in green.
- https://cdn.elifesciences.org/articles/74940/elife-74940-supp1-v2.xlsx
-
Supplementary file 2
Proteomics data and lists of proteins identified in the Nfib mRNA pulldown experiments including non-specific bead interacting proteins and proteins interacting with the Nfib-AR hybrid mRNA probes.
- https://cdn.elifesciences.org/articles/74940/elife-74940-supp2-v2.xlsx
-
Supplementary file 3
Interactive iVenn data set comparing proteins identified in the Drosha IP, Nfib 3' UTR HP pull-down and Nfib 5' UTR HP pull-down experiments.
- https://cdn.elifesciences.org/articles/74940/elife-74940-supp3-v2.xlsx
-
Source data 1
Excel sheet of quantificantion data and statistical analyses for all figures and figure supplement data.
- https://cdn.elifesciences.org/articles/74940/elife-74940-data1-v2.xlsx
-
Transparent reporting form
- https://cdn.elifesciences.org/articles/74940/elife-74940-transrepform1-v2.pdf
Download links
A two-part list of links to download the article, or parts of the article, in various formats.
Downloads (link to download the article as PDF)
Open citations (links to open the citations from this article in various online reference manager services)
Cite this article (links to download the citations from this article in formats compatible with various reference manager tools)
SAFB regulates hippocampal stem cell fate by targeting Drosha to destabilize Nfib mRNA
eLife 13:e74940.
https://doi.org/10.7554/eLife.74940


