The missing link between genetic association and regulatory function
- Department of Biomedical Informatics, Harvard Medical School, United States
- Brigham and Women’s Hospital, Division of Genetics, Harvard Medical School, United States
- Program in Medical and Population Genetics, Broad Institute of MIT and Harvard, United States
- Brigham and Women’s Hospital, Department of Neurology, Harvard Medical School, United States
- Department of Epidemiology, Harvard T.H. Chan School of Public Health, United States
- Altius Institute, United States
- Division of Pulmonary Medicine, Boston Children’s Hospital, United States
- Department of Neurology, Yale Medical School, United States
- Department of Genetics, Yale Medical School, United States
Figures
Figure 1 with 2 supplements
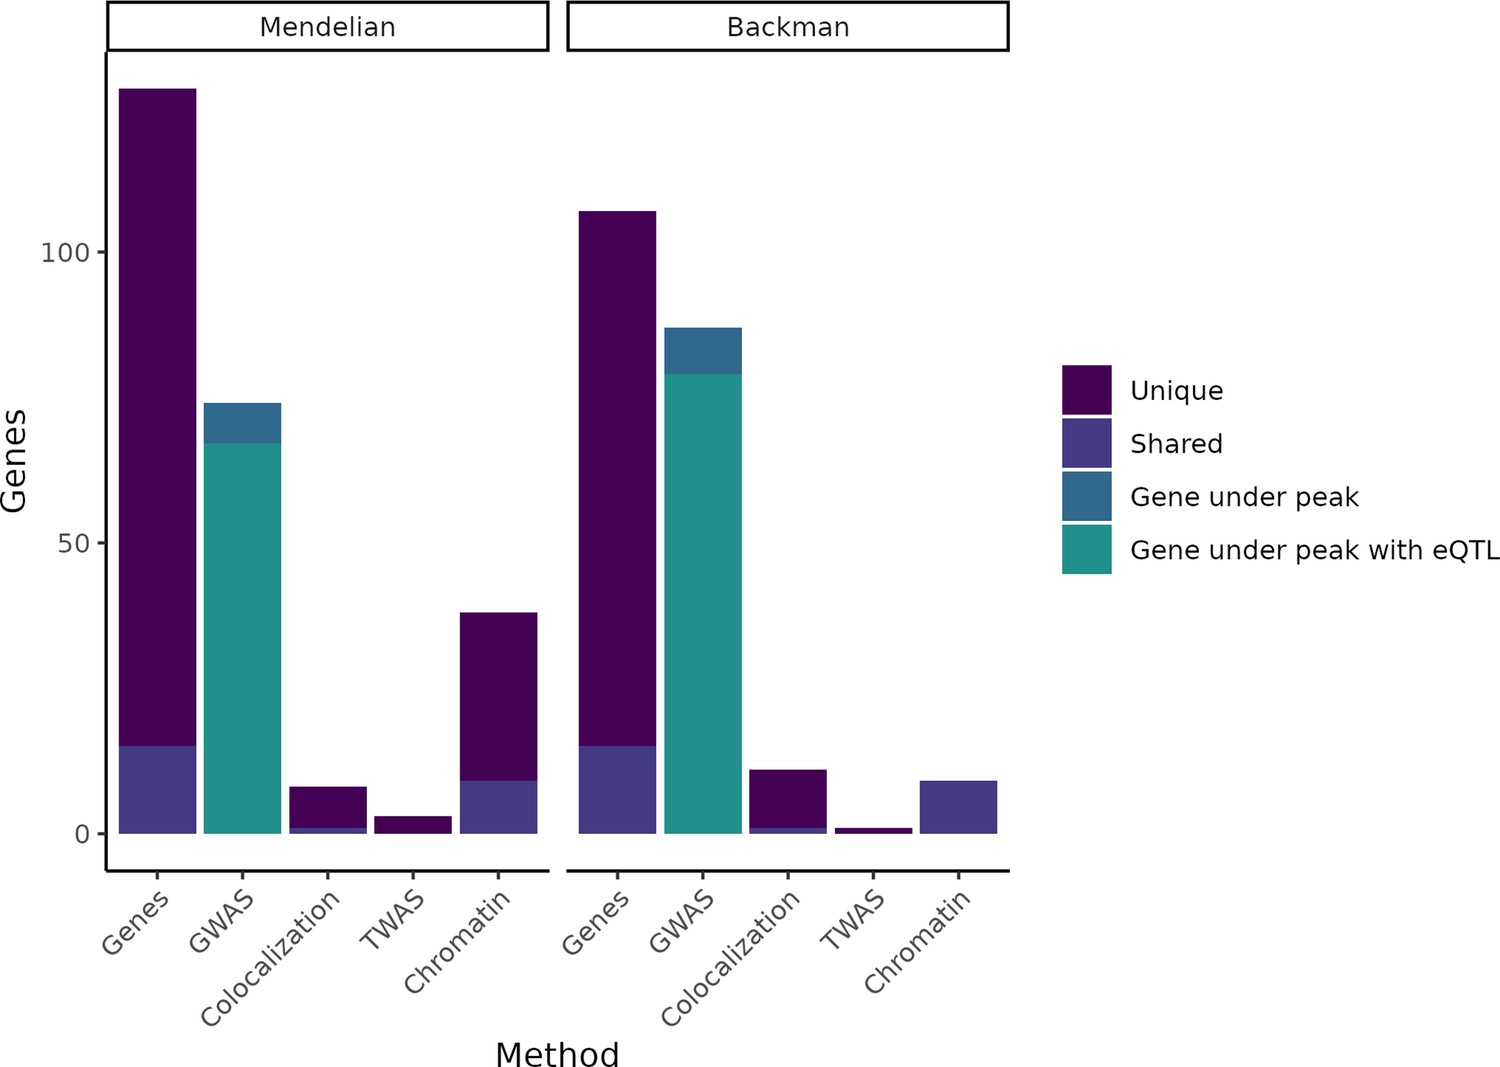
Putatively causative genes identified by each method category.
The leftmost column in each half of the plot displays the entire group of putatively causative genes for our Mendelian set of genes and our (Backman et al., 2021) set of genes, respectively, as well as noting how many are unique to each set or shared between the two sets. The second column in each half indicates how many genes from each set have a nearby GWAS peak or have both a nearby GWAS peak and an expression QTL (eQTL). The remaining columns indicate how many genes were identified through colocalization, transcriptome-wide association studies (TWAS), or chromatin methods, while noting how many of these genes are unique vs. shared between the Mendelian and Backman sets.
Figure 1—figure supplement 1
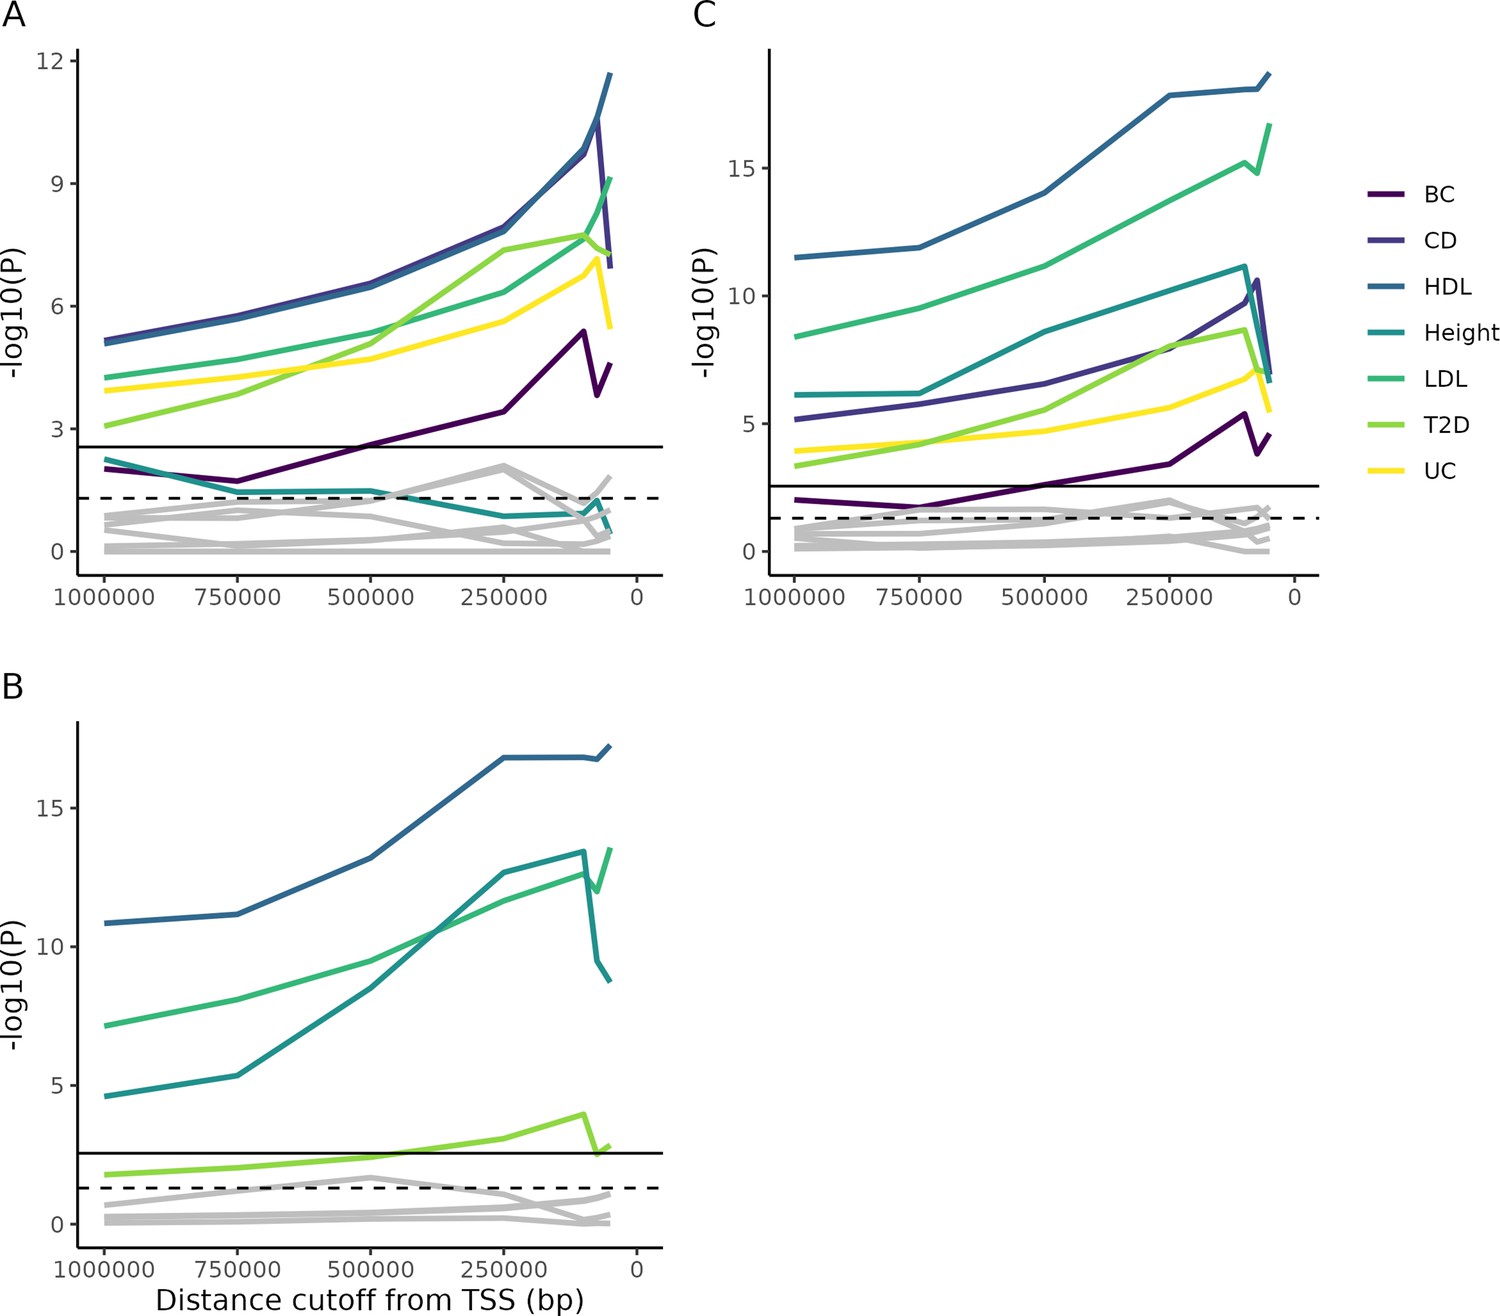
Enrichment of Mendelian genes near GWAS peaks.
(A) As the window around GWAS peaks shrinks, the enrichment of Mendelian genes within the window becomes increasingly significant, while the enrichment of non-matching trait pairs used as controls (gray lines; permutation test described in 'Materials and methods') is not consistently increased. Some controls achieve nominal significance (dotted horizontal line), but none reach significance once multiple testing is corrected for (solid horizontal line). (B) As above, but for genes from Backman et al., 2021. (C) The combined gene lists from parts (A) and (B). Note that, accounting for multiple test correction (based on the total number of tests across all panels), height does not reach significance using the Mendelian gene list, while T2D is barely significant using the Backman list. However, combining the lists increases power and demonstrates significance for all traits.
Figure 1—figure supplement 2
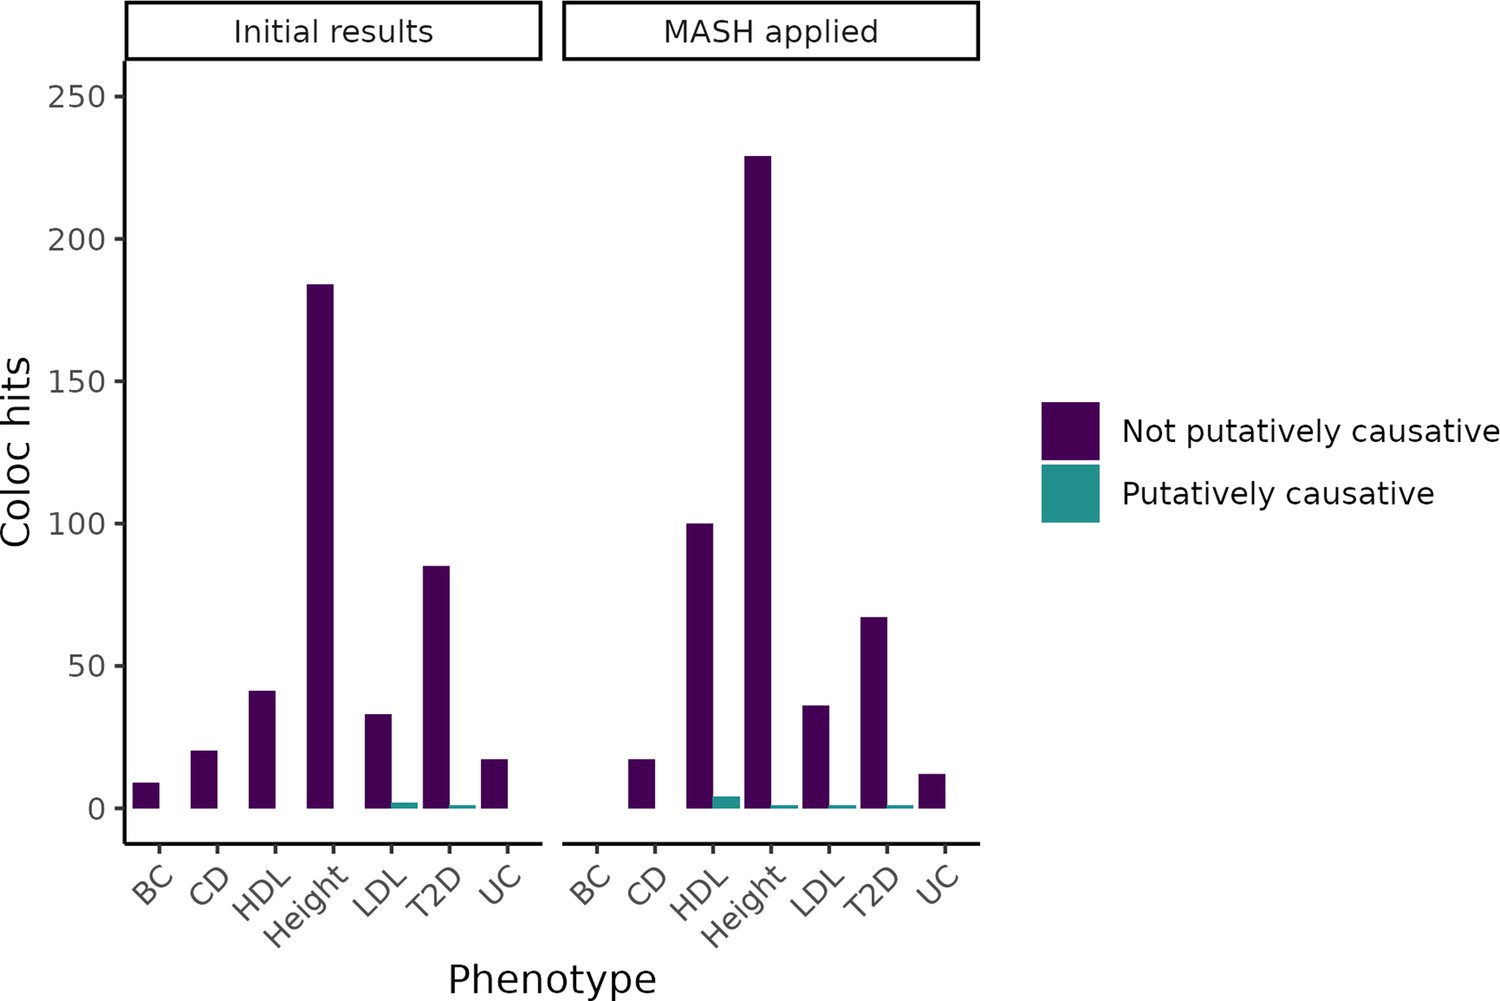
Change in coloc hits when adjusting expression QTL(eQTL) statistics using Multivariate Adaptive Shrinkage Method (MASH).
By using the Bayesian method MASH to update our measurements of eQTLs based on tissues with similar expression patterns, we increased the number of colocalizations found. However, even in tissues in which the number of genes identified increased substantially, we did not meaningfully increase the number of putatively causative genes identified.
Figure 2
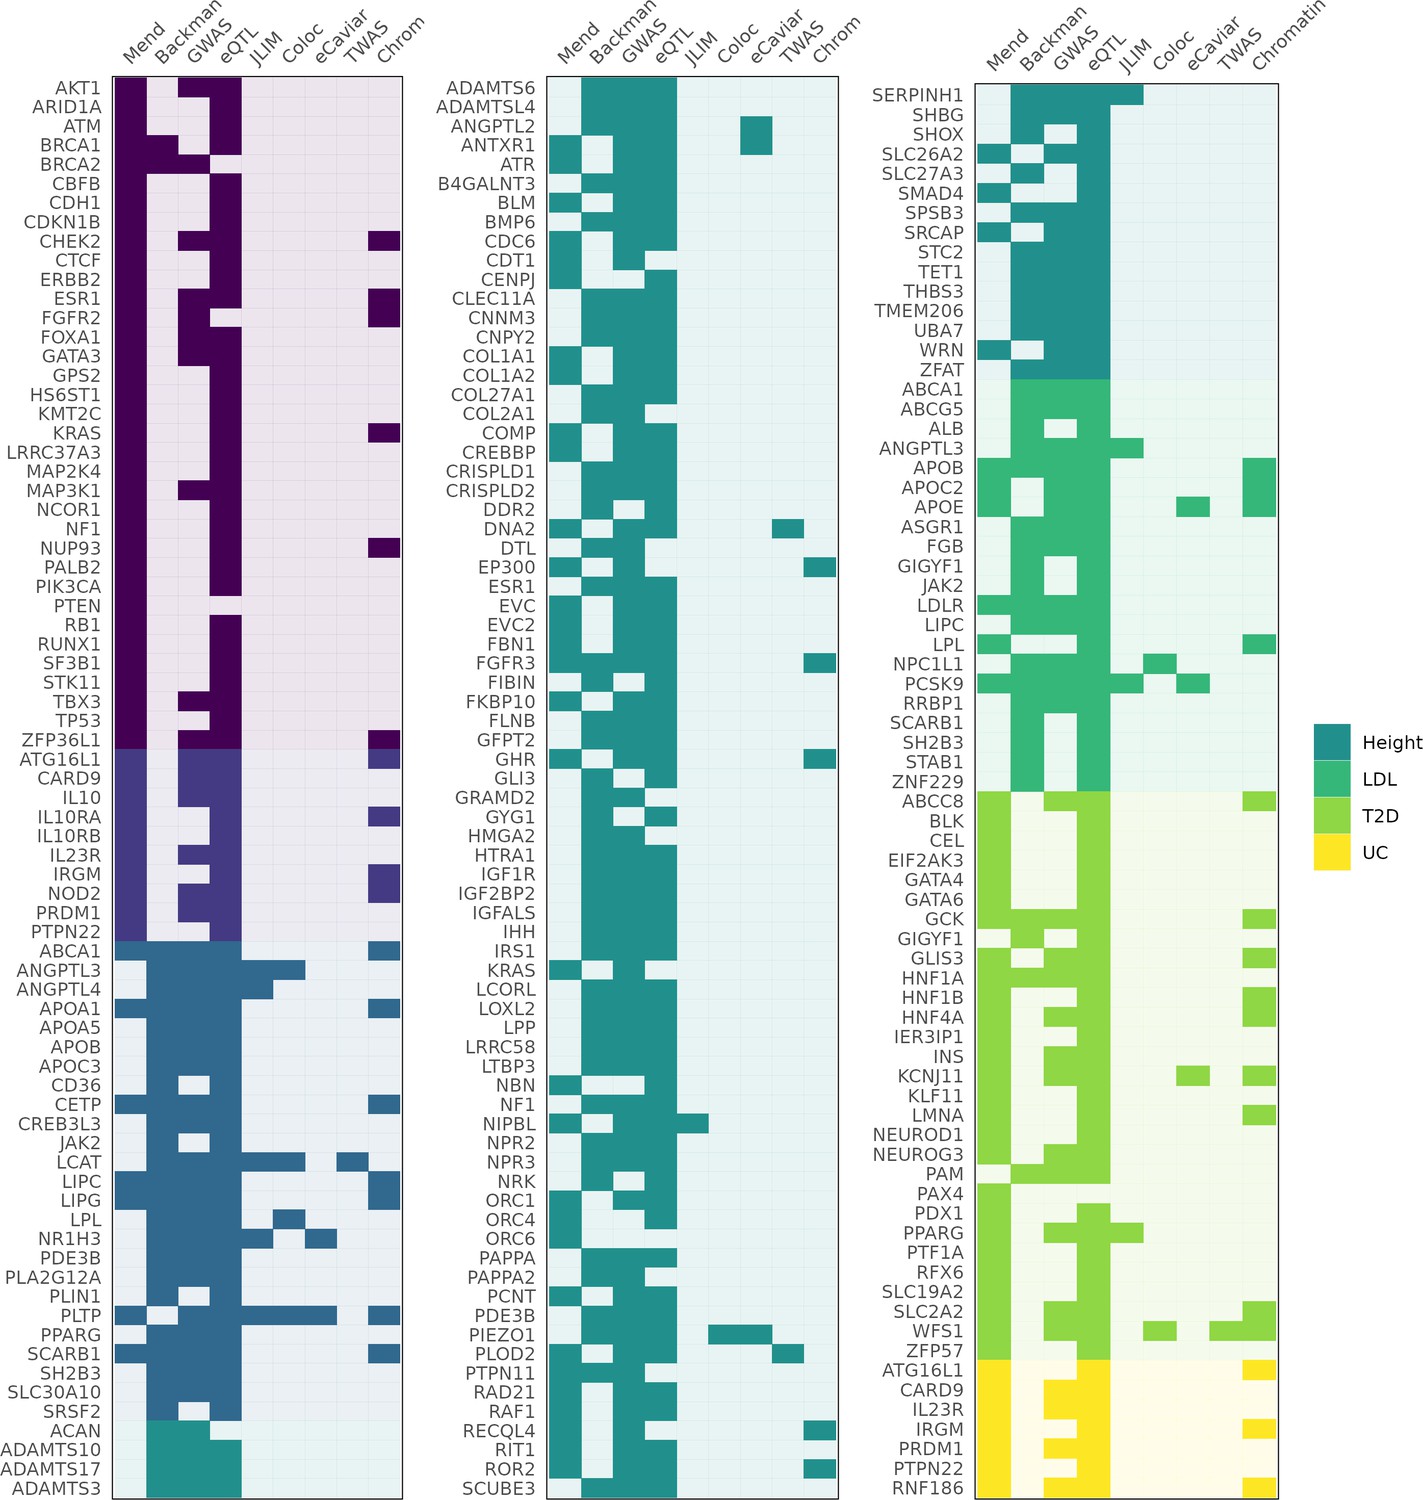
Genes identified as associated with a complex trait by each method.
Columns 'Mend' and 'Backman' indicate whether a gene is from the Mendelian set of putatively causative genes, the Backman et al. set, or both. Subsequent columns indicate whether a gene was identified as a hit using each of our methods: JLIM, coloc, eCaviar, transcriptome-wide association studies (TWAS), and chromatin analysis.
Figure 3
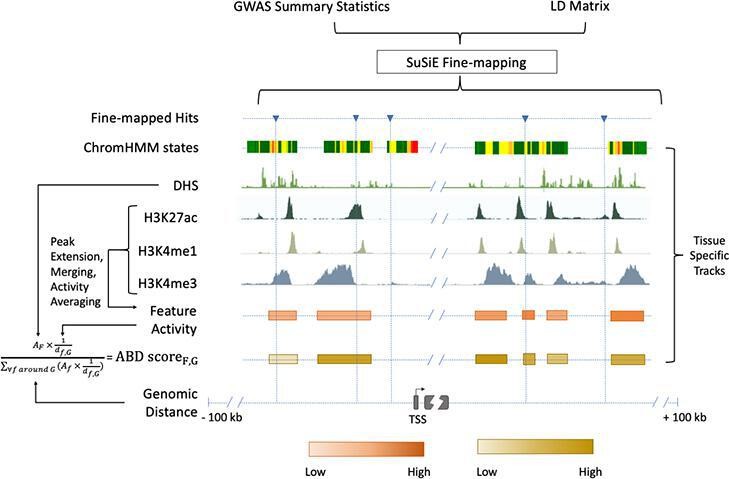
Chromatin-based causative gene identification.
Following the fine-mapping of GWAS variants, three parallel methods were used. The first identified fine-mapped variants falling within regions annotated as enhancers by ChromHMM. The second identified variants within histone modification features and evaluated their relevance using an activity-by-distance (ABD) score that combined the strength of the feature (i.e., the strength of the acetylation or methylation peak) with its genomic distance to the gene of interest ('Materials and methods'). The third repeated both of these—checking for fine-mapped variants within a region and calculating the ABD score—for DNase I hypersensitivity sites.
-
Figure 3—source data 1
Gene-level results for linked expression and traits.
- https://cdn.elifesciences.org/articles/74970/elife-74970-fig3-data1-v2.txt
Tables
Table 1
Putatively causative Mendelian genes.
Each gene includes reference(s) to the known biological role of its coding variants, as established in familial studies, in vitro experiments, and/or animal models. Genes from Backman et al., 2021 are not included here, but can be found in Figure 2.
Table 2
Tissue-trait pairs.
Tissues were selected for each trait based on a priori knowledge of disease biology.
| Mendelian trait | GWAS trait | Tissues examined |
|---|---|---|
| Breast cancer | Breast cancer | Breast mammary tissue |
| Crohn disease | Crohn disease | Small intestine terminal ileum Colon sigmoid Colon transverse |
| Ulcerative colitis | Ulcerative colitis | Small intestine terminal ileum Colon sigmoid Colon transverse |
| Dyslipidemia Hyperlipidemia Tangier’s disease | High-density lipoprotein | Liver Adipose (subcutaneous) Whole blood |
| Dyslipidemia Hyperlipidemia | Low-density lipoprotein | Liver Adipose (subcutaneous) Whole blood |
| Mendelian short stature | Height | Skeletal muscle |
| Monogenic diabetes | Type II diabetes | Pancreas Skeletal muscle Adipose (subcutaneous) Small intestine terminal ileum |
Table 3
Proposed explanations for negative results under the unembellished model.
Many explanations have been proposed for GWAS associations that are not explained by cis-QTLs. This table details the explanations inconsistent with our results, which are explained in the left column and addressed on the right. Explanations involving more detailed models of gene regulation can be found in Table 4. Two of the explanations addressed here involve violations of the assumptions of our and other expression-based complex trait studies. If coding and non-coding variants affect fundamentally different biological pathways, or if trait associations rarely depend on cis-eQTLs, our methods of mapping regulation to traits would have nothing to uncover. Even in the presence of eQTL-driven trait associations, insufficient power to detect trait associations, to detect eQTL associations, or to link the two would result in predominantly negative results.
| Violated assumptions | |
|---|---|
| Genes implicated via coding variants are irrelevant for non-coding associations |
|
| Regulatory mechanisms other than cis-eQTLs |
|
| Insufficient power | |
| Lack of GWAS power |
|
| Lack of eQTL mapping power |
|
| Lack of power for colocalization and TWAS methods |
|
-
eQTL = expression QTL; TWAS = transcriptome-wide association studies.
Table 4
Explaining negative results with more nuanced models of gene regulation.
To reconcile an expression-based model with our observations requires us to both explain the absence of trait-linked eQTLs as well as explaining away the inconsequence of eQTLs for trait-linked genes. The left-hand side lists additions or changes to the unembellished model, while the right-hand side contains explanations of the models and current relevant research.
| Extended models of gene regulation | |
|---|---|
| Context dependency: a context-specific eQTL, invisible in bulk tissues analyzed to date, replaces or supplements the bulk tissue homeostatic eQTL | Cell type Dobbyn et al., 2018; Zhang et al., 2018; Schmiedel et al., 2018; Glastonbury et al., 2019; Rai et al., 2020; Findley et al., 2021; Neavin et al., 2021; Ota et al., 2021; Patel et al., 2021; Bryois et al., 2021; Arvanitis et al., 2022; Oelen et al., 2022; Perez et al., 2022; Schmiedel et al., 2022; Yazar et al., 2022
|
Developmental timing Dobbyn et al., 2018; Strober et al., 2019; Cuomo et al., 2020; Bonder et al., 2021; Jerber et al., 2021; Aygün et al., 2022; Elorbany et al., 2022
| |
Cell state or environment Findley et al., 2021; Ota et al., 2021; Oelen et al., 2022; Schmiedel et al., 2022; Huh and Paulsson, 2011; Knowles et al., 2017; Kim-Hellmuth et al., 2017; Balliu et al., 2021; Mu et al., 2021; Ward et al., 2021; Nathan et al., 2022; Baca et al., 2022
| |
| Nonlinear or non-homeostatic: the relationship between eQTL and genotype is indirect | Nonlinearity Fu et al., 2009; Dori-Bachash et al., 2011; Ghazalpour et al., 2011; Pai et al., 2012; Vogel and Marcotte, 2012; Khan et al., 2013; Wu et al., 2013; McManus et al., 2014; Albert and Kruglyak, 2015; Bader et al., 2015; Battle et al., 2015; Cenik et al., 2015; McManus et al., 2015; Pai et al., 2015; Schafer et al., 2015; Chick et al., 2016; Liu et al., 2016; Schaefke et al., 2018; Buccitelli and Selbach, 2020; Wang et al., 2020a; Kusnadi et al., 2022
|
Steady-state expression may be a poor model Pedraza and Paulsson, 2008; Raj and van Oudenaarden, 2008; Shahrezaei and Swain, 2008; Larson et al., 2009; Raj and van Oudenaarden, 2009; Suter et al., 2011; Dar et al., 2012; Viñuelas et al., 2013; Kumar et al., 2015; Nicolas et al., 2017; Qiu et al., 2019; Wang et al., 2020c
| |
-
eQTL = expression QTL.
Additional files
-
Supplementary file 1
Roadmap epigenomics aliases of tissue types used for functional genomic analysis.
Tissue types from the Roadmap Epigenomics Consortium do not perfectly match those from GTEx. However, there is overlap, and as with GTEx, we analyzed trait-relevant tissues.
- https://cdn.elifesciences.org/articles/74970/elife-74970-supp1-v2.csv
-
Supplementary file 2
Tissue types and biosamples from the DNase I hypersensitive sites index used for functional genomic analysis.
Meuleman et al., 2020 assess DNase I hypersensitive sites across 438 cell and tissue types; we selected the above based on their relevance to our complex traits.
- https://cdn.elifesciences.org/articles/74970/elife-74970-supp2-v2.csv
-
Supplementary file 3
TOPMed URLs used.
- https://cdn.elifesciences.org/articles/74970/elife-74970-supp3-v2.zip
-
Transparent reporting form
- https://cdn.elifesciences.org/articles/74970/elife-74970-transrepform1-v2.docx
Download links
A two-part list of links to download the article, or parts of the article, in various formats.
Downloads (link to download the article as PDF)
Open citations (links to open the citations from this article in various online reference manager services)
Cite this article (links to download the citations from this article in formats compatible with various reference manager tools)
The missing link between genetic association and regulatory function
eLife 11:e74970.
https://doi.org/10.7554/eLife.74970


