Social-affective features drive human representations of observed actions
- Department of Cognitive Science, Johns Hopkins University, United States
- Department of Psychological and Brain Sciences, Johns Hopkins University, United States
Figures
Figure 1

Quantifying visual, social-affective, and action features in the two stimulus sets.
(a) Correlations between feature representational dissimilarity matrices (RDMs). Note the low correlations between visual features and action/social-affective features (white rectangle). (b) Behavioral rating distributions in the two stimulus sets. The z-scored ratings were visualized as raincloud plots showing the individual data points, as well as probability density estimates computed using MATLAB’s ksdensity function (Allen et al., 2019).
Figure 2
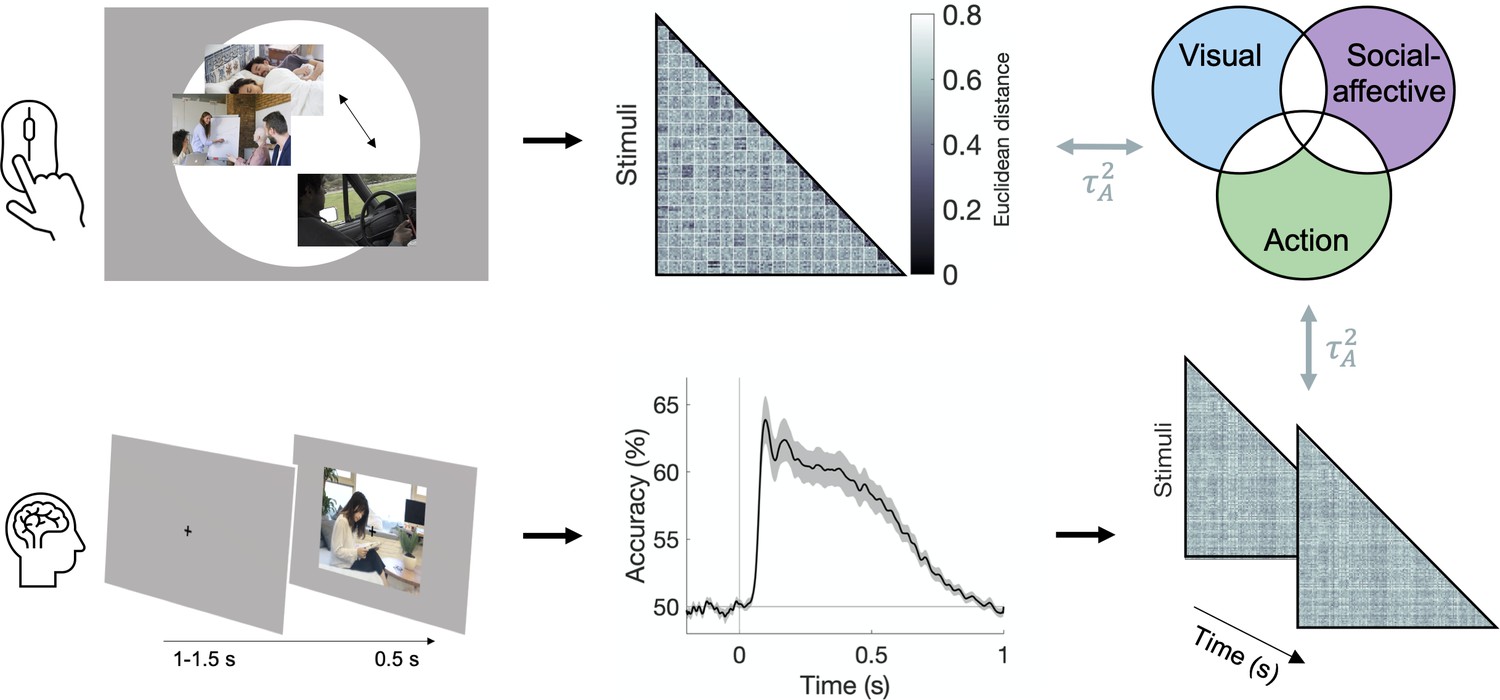
Experimental and analysis pipeline for evaluating the contribution of different features to action representations.
Above: a multiple arrangement task was used to generate behavioral representational dissimilarity matrices (RDMs) in the two behavioral experiments. Below: electroencephalography (EEG) data was recorded during a one-back task, and time-resolved neural RDMs were generated using pairwise decoding accuracies. Cross-validated variance partitioning was used to assess the unique contributions of visual, social-affective, and action features to the behavioral and neural RDMs, quantified as the predicted squared Kendall’s . The stimuli in this figure are public domain images similar to the types of videos used in the experiments.
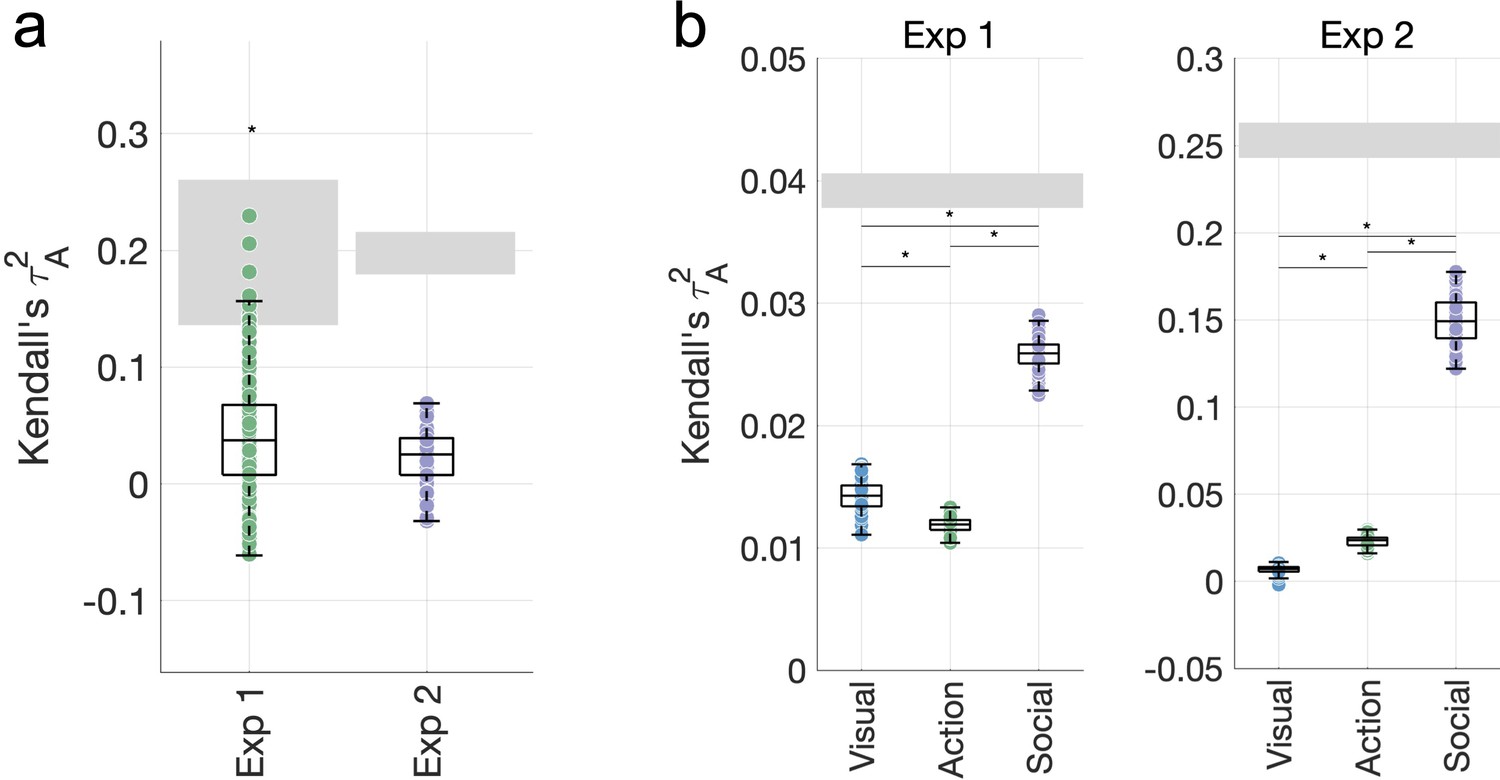
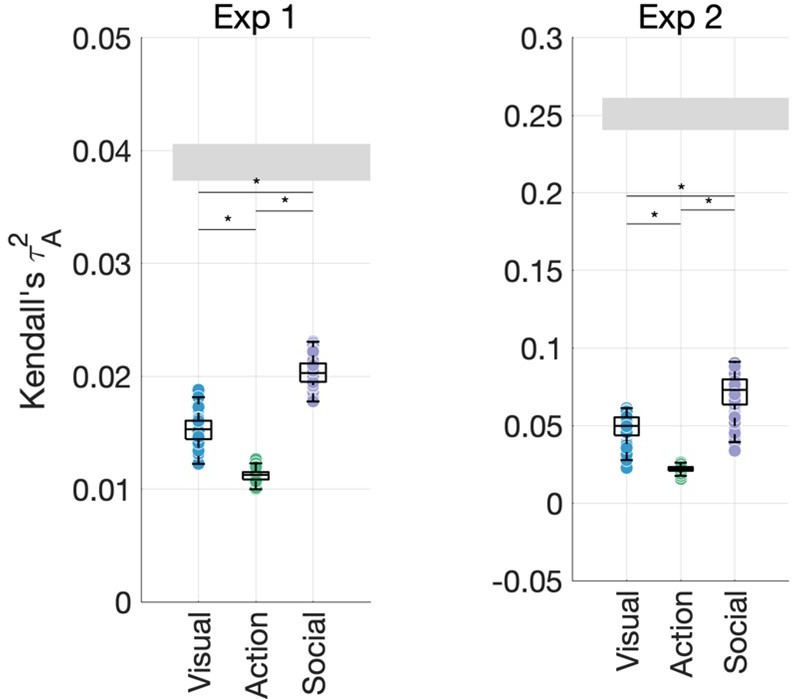
Figure 3 with 1 supplement
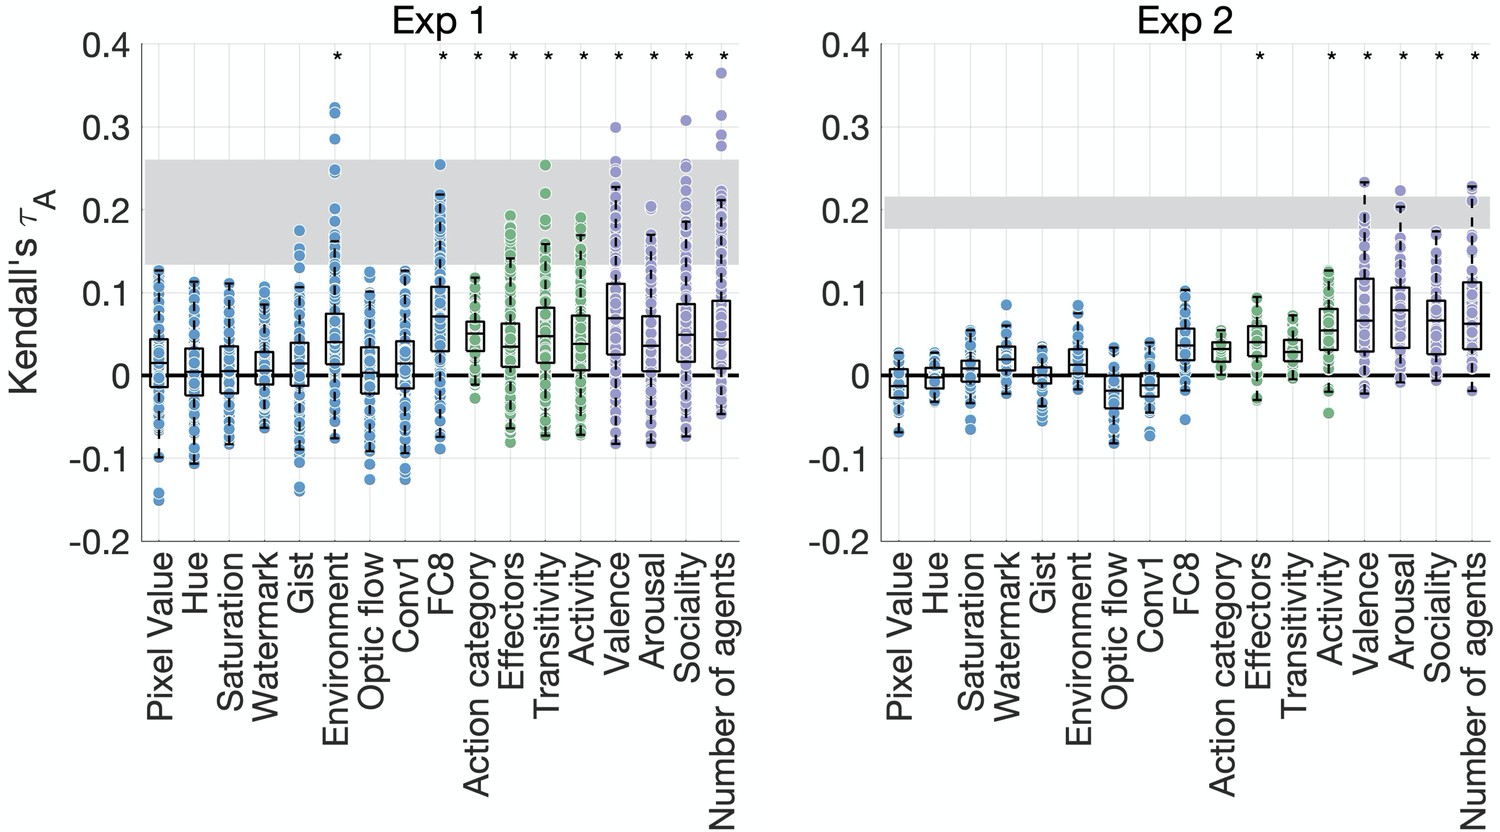
Feature contributions to behavioral similarity.
Feature-behavior correlations are plotted against the noise ceiling (gray). Each dot is the correlation between an individual participant’s behavioral representational dissimilarity matrix (RDM) and each feature RDM. Asterisks denote significance (p<0.005, sign permutation testing). The reliability of the data and feature ratings is presented in Figure 3—figure supplement 1.
Figure 3—figure supplement 1
Reliability of behavioral data.
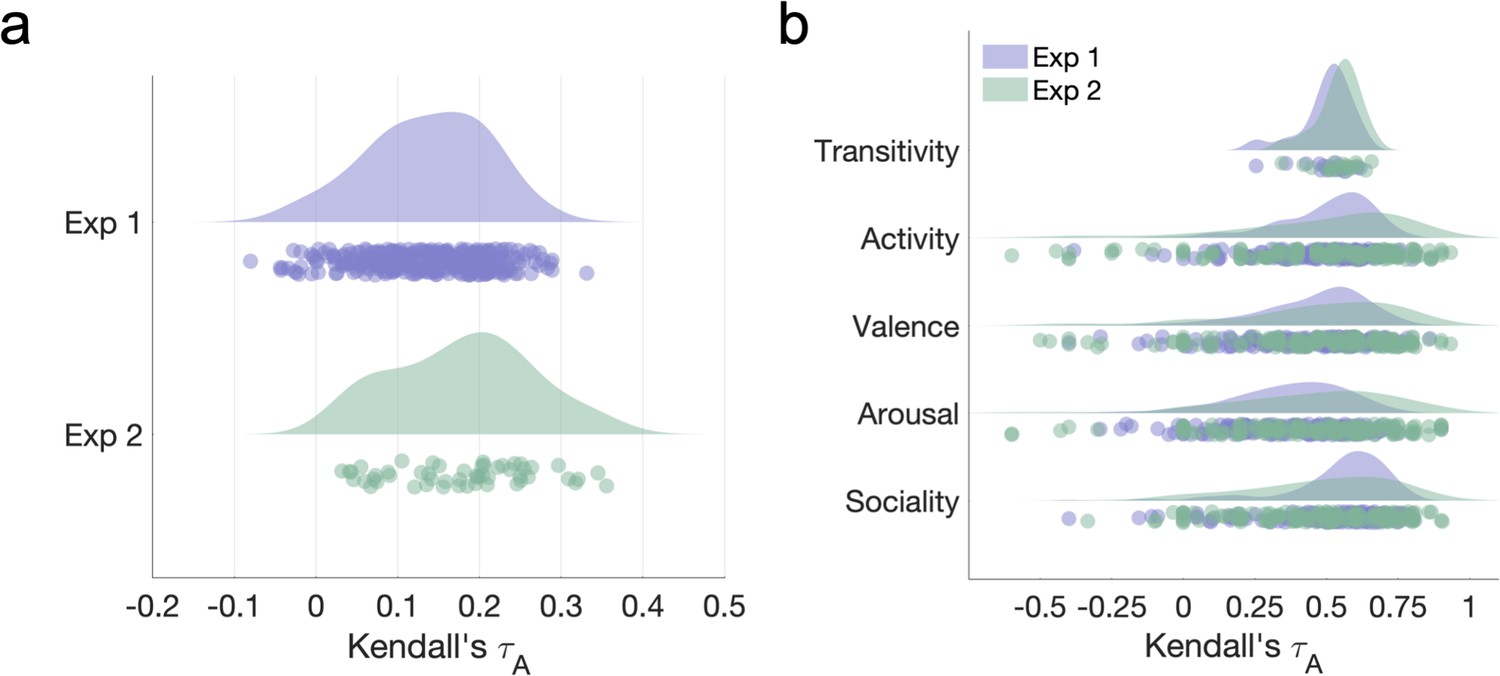
(a) Reliability of behavioral similarity estimates (leave-one-subject-out correlations) in the two datasets. (b) Reliability of features measured in behavioral experiments (leave-one-subject-out correlations). Since most ratings were collected using the larger video set, the video sets rated by each participant differed both in number and content. Only participants who rated at least five videos from each set were included in the analysis.
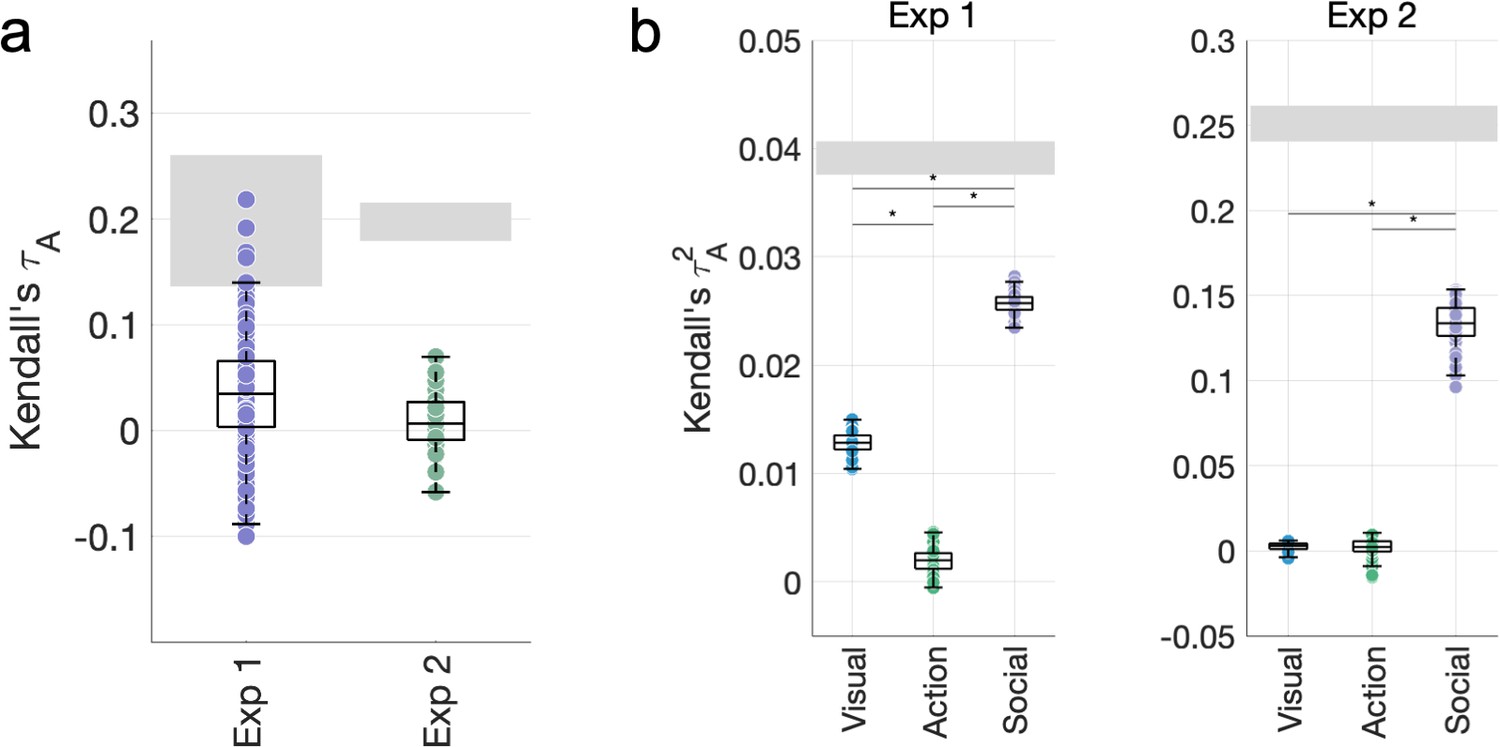
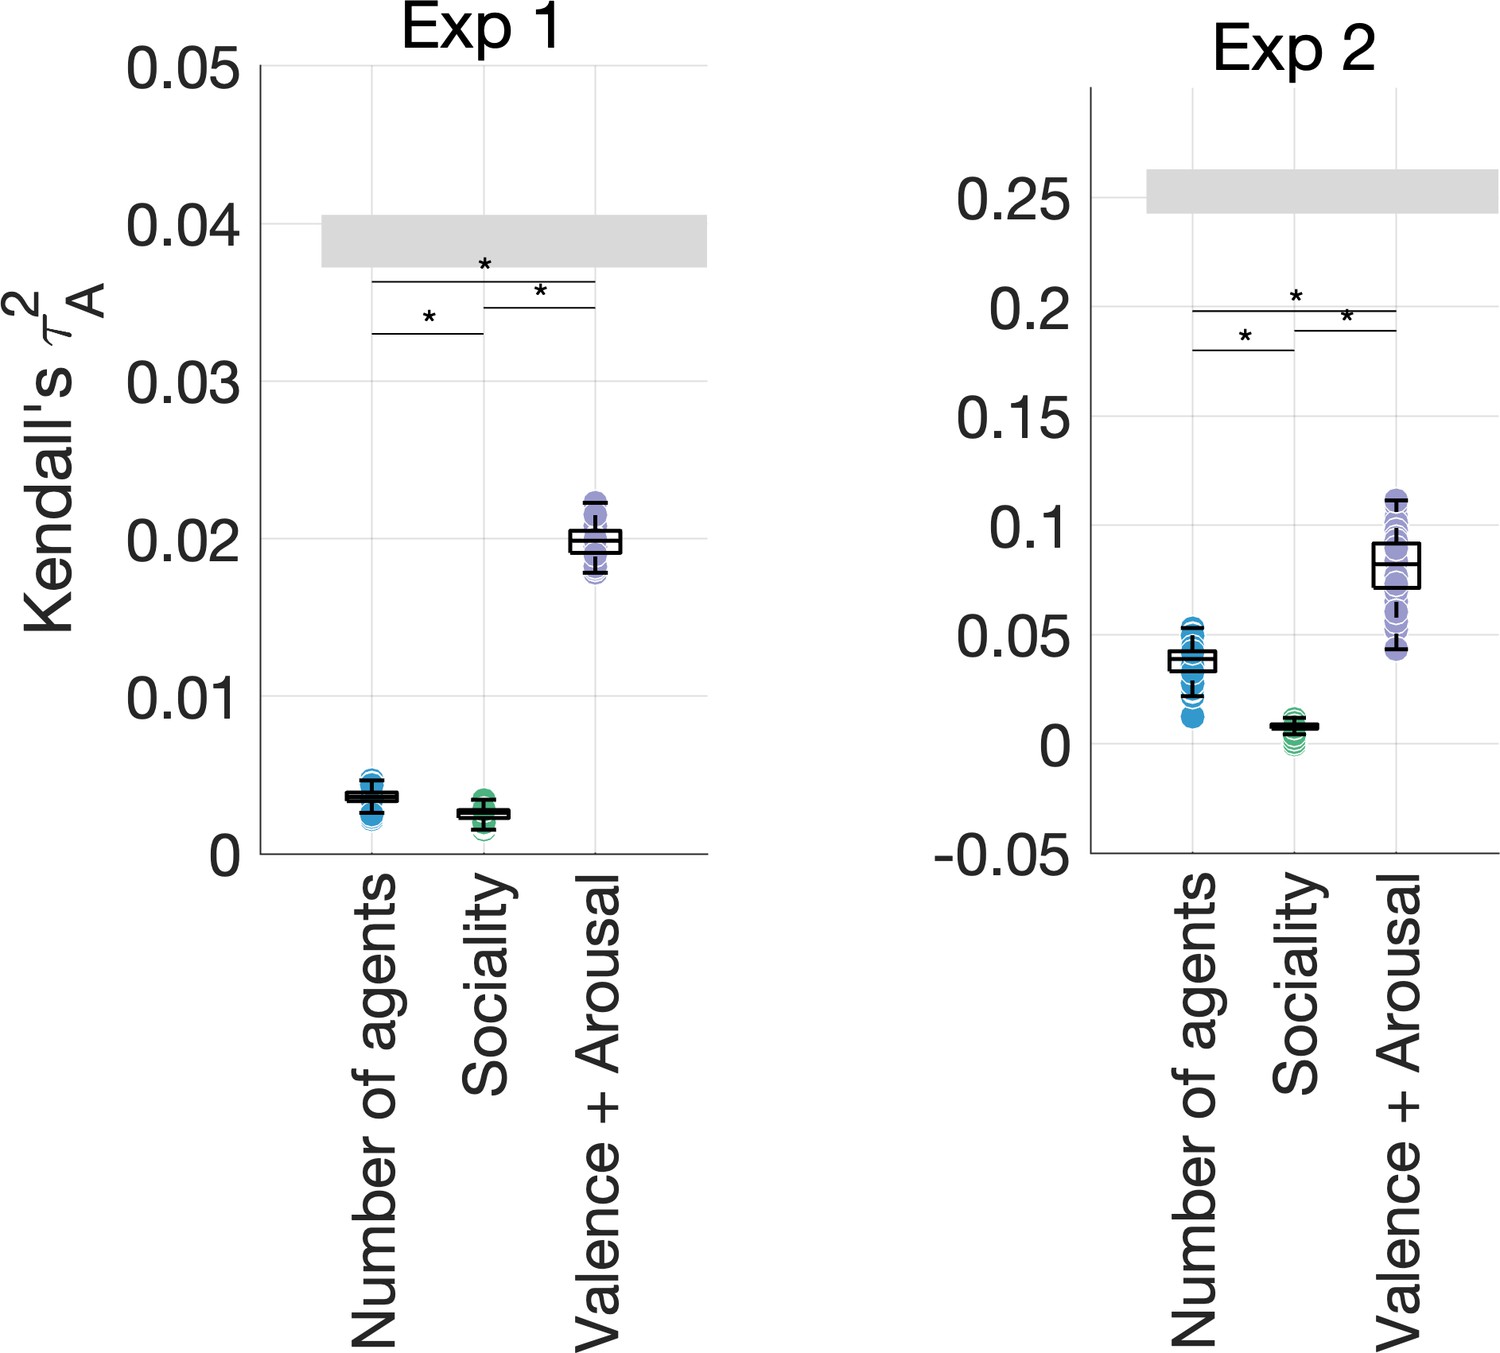
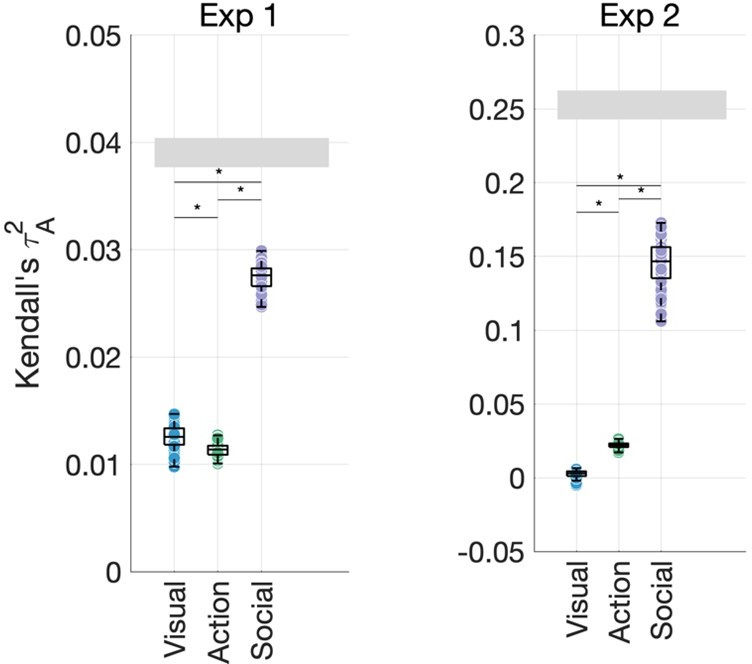
Figure 4 with 5 supplements
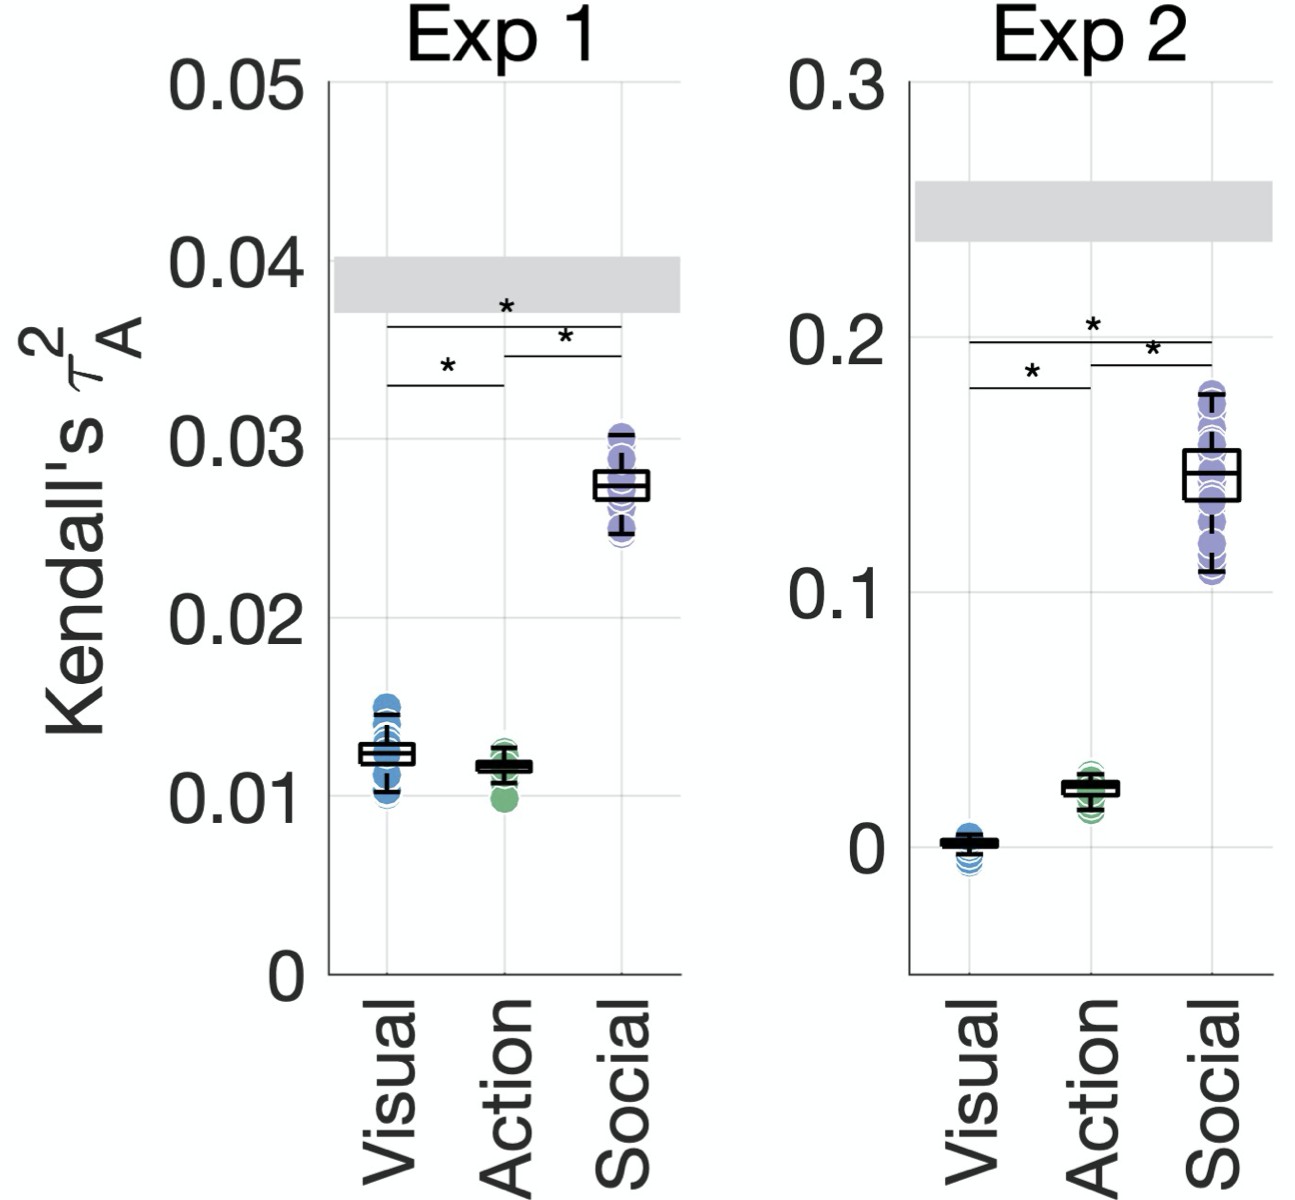
Social-affective features explain behavior better than visual and action features.
The unique variance explained by visual, action, and social-affective features is plotted against the split-half reliability of the data (gray). Significant differences are marked with asterisks (all p<0.001, Wilcoxon signed-rank tests). For control analyses on how individual features (e.g., action category and the number of agents) and their assignment to groups affect the results, see Figure 4—figure supplements 1–5.
Figure 4—figure supplement 1
Using a more detailed semantic model based on WordNet similarities between video labels does not increase the contribution of action features.
(a) Correlations between the WordNet representational dissimilarity matrix (RDM) and the behavioral RDMs. (b) Variance partitioning results obtained after replacing the action category RDM with the WordNet RDM.
Figure 4—figure supplement 2
Quantifying motion energy as a visual feature does not change the pattern of variance partitioning results.
(a) A motion energy model correlates with the behavioral similarity data in Experiment 1, but not in Experiment 2. (b) Adding the motion energy model to the group of visual features does not change the pattern of results in our variance partitioning analyses.
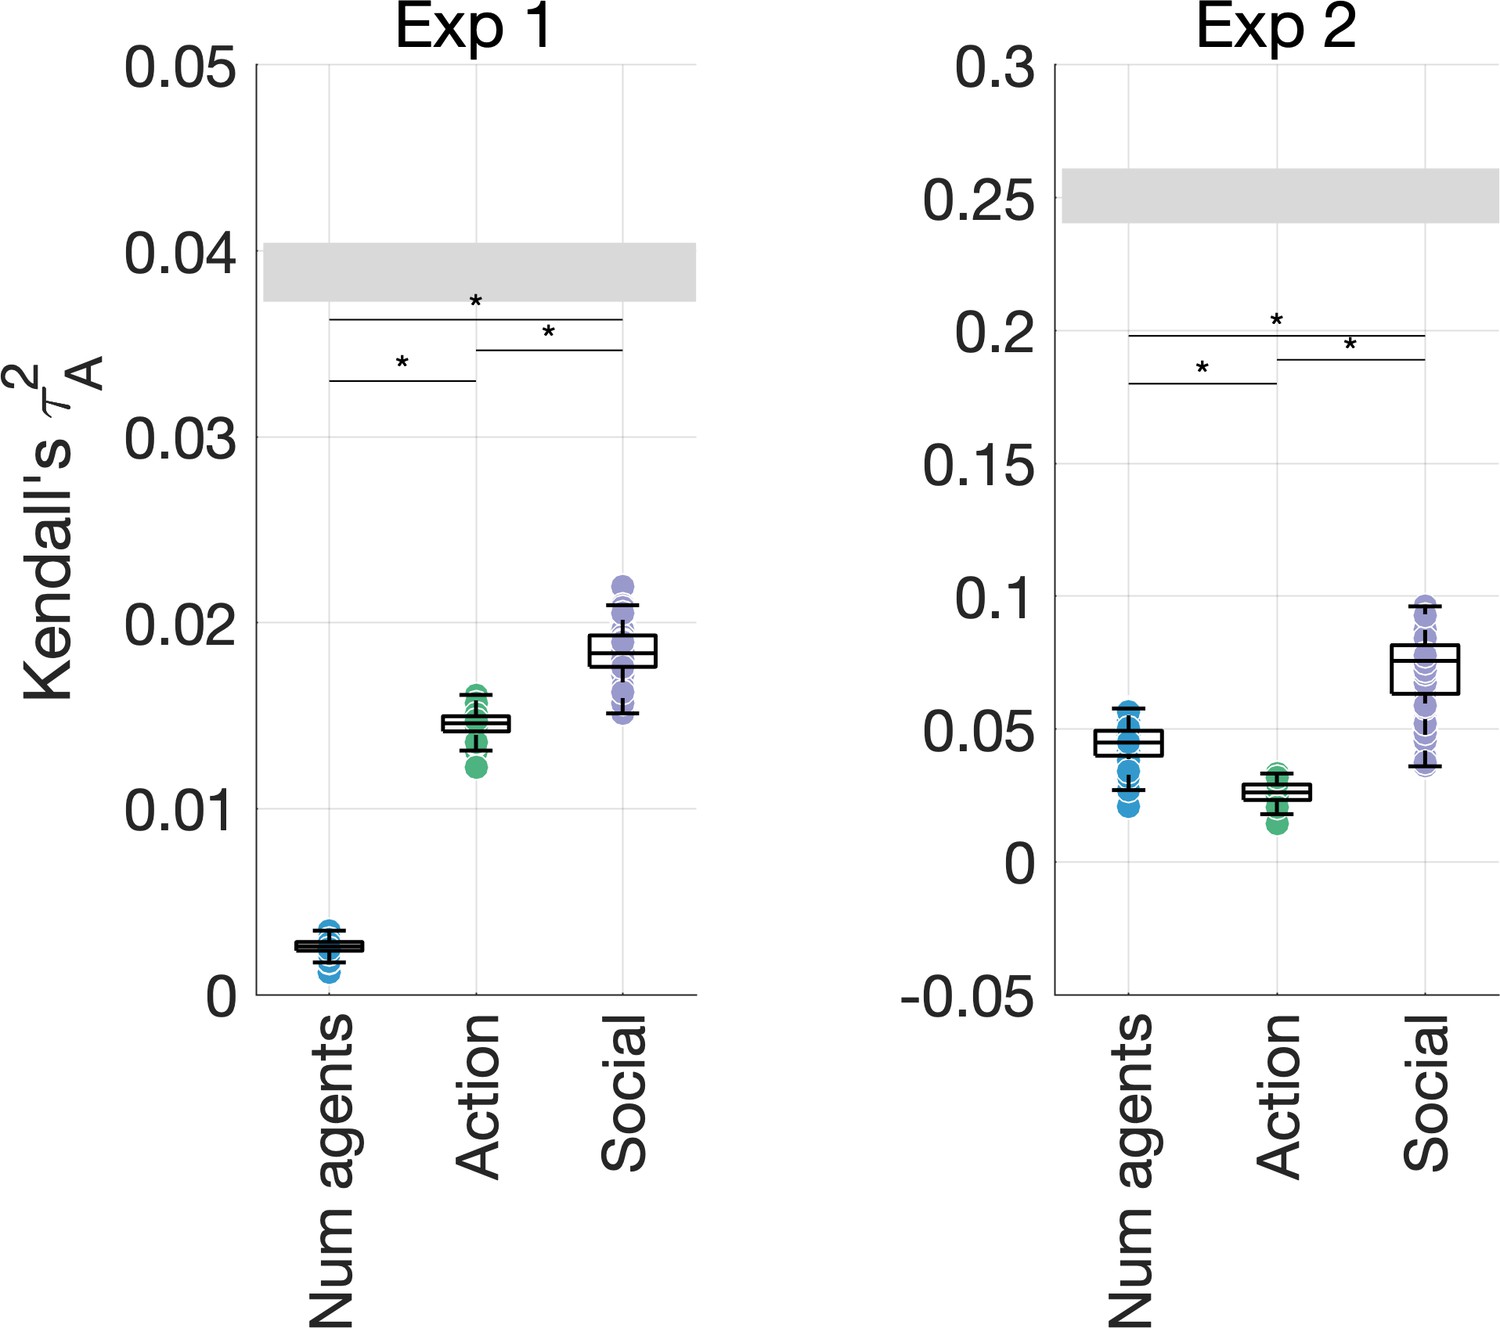
Figure 4—figure supplement 3
Unique variance explained by visual and action features (environment, FC8, activity, transitivity, effectors, action category) and social-affective features (number of agents, sociality, valence, arousal) in the behavioral data.
This shows a striking contribution from social-affective features even when pitted against all other features.
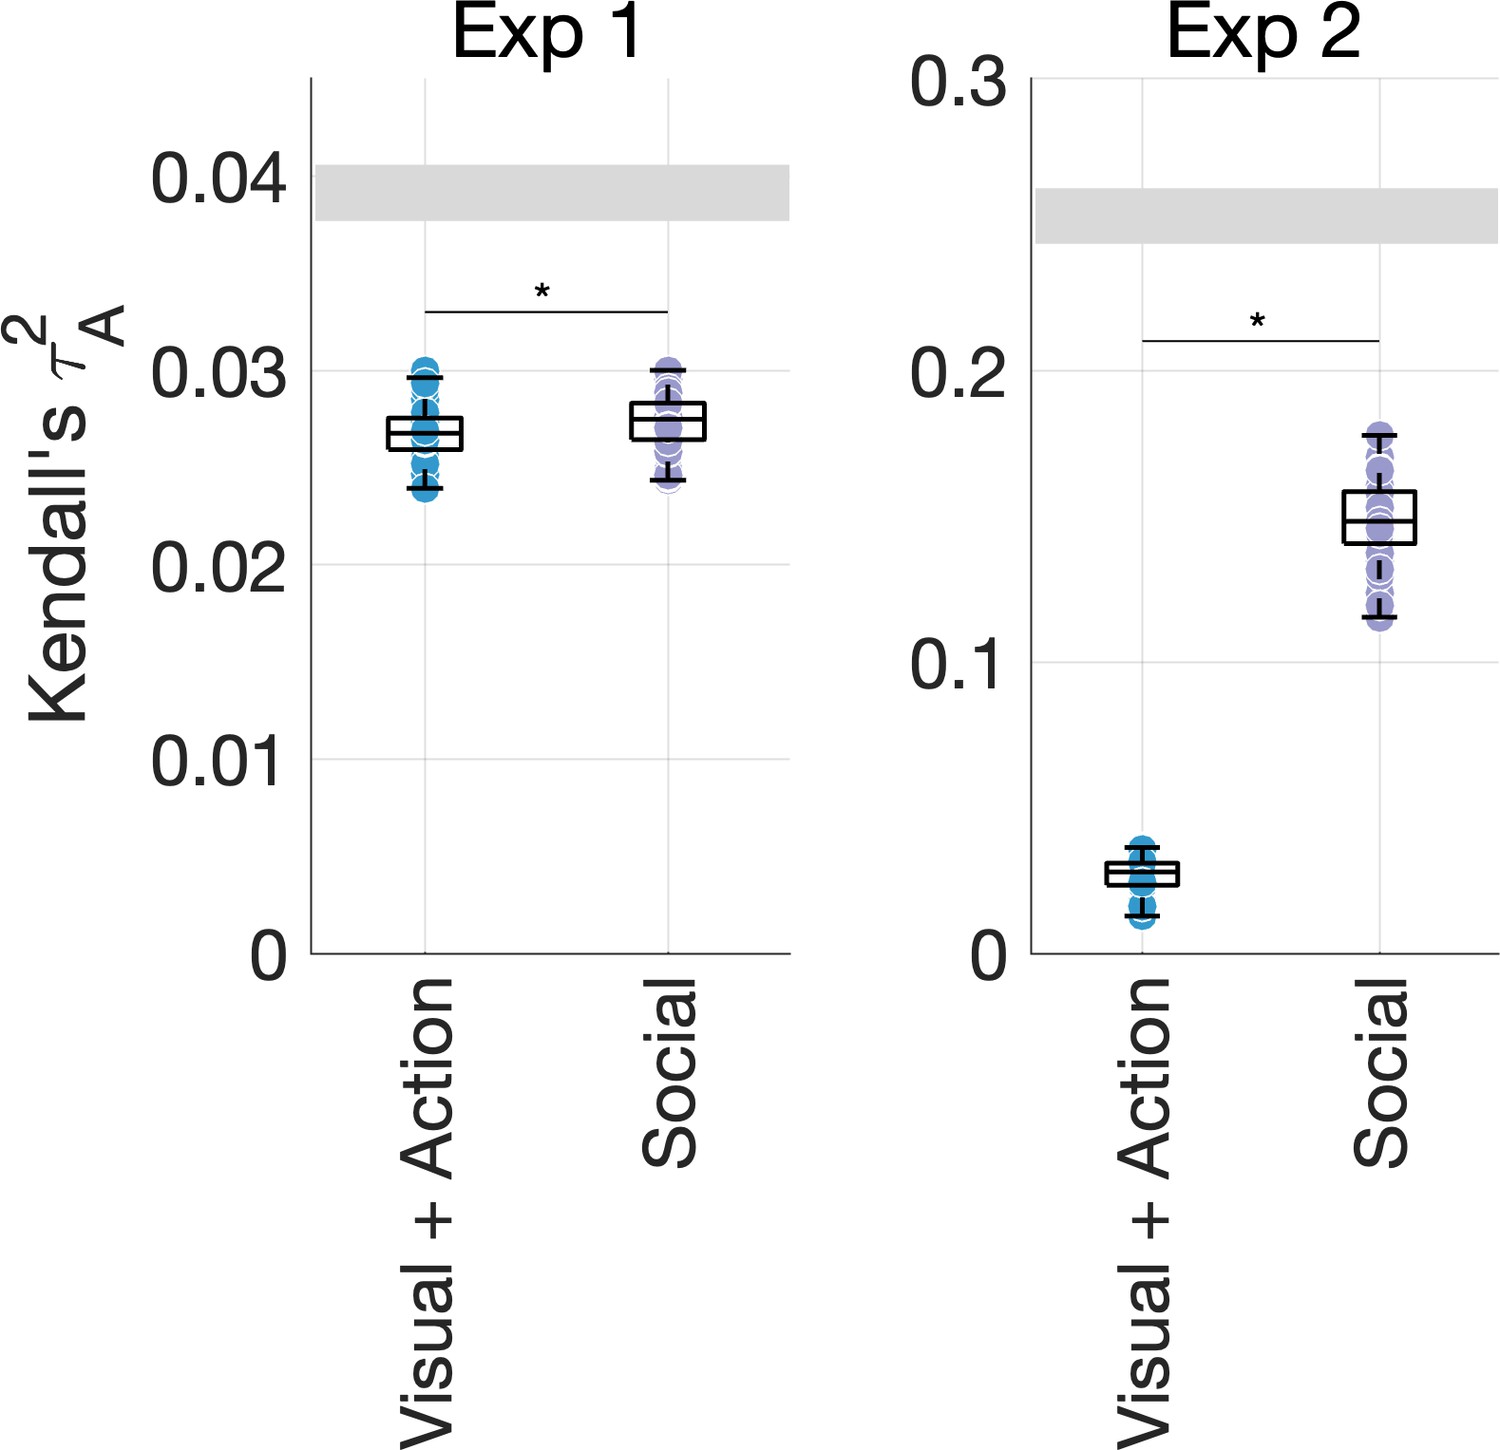
Figure 4—figure supplement 4
Unique variance explained by the number of agents, action features (action category, effectors, transitivity, activity), and other social-affective features (sociality, valence, and arousal) in the behavioral data.
This control analysis shows that higher-level social-affective features explain most of the unique variance in our data, above and beyond the number of agents.
Figure 4—figure supplement 5
Unique variance explained by the number of agents, sociality, and affective features (valence and arousal) in the behavioral data.
This control analysis suggests that affective features explain most of the variance in the data, alongside the number of agents (particularly in Experiment 2). However, this analysis does not account for the contributions of other visual and action features.
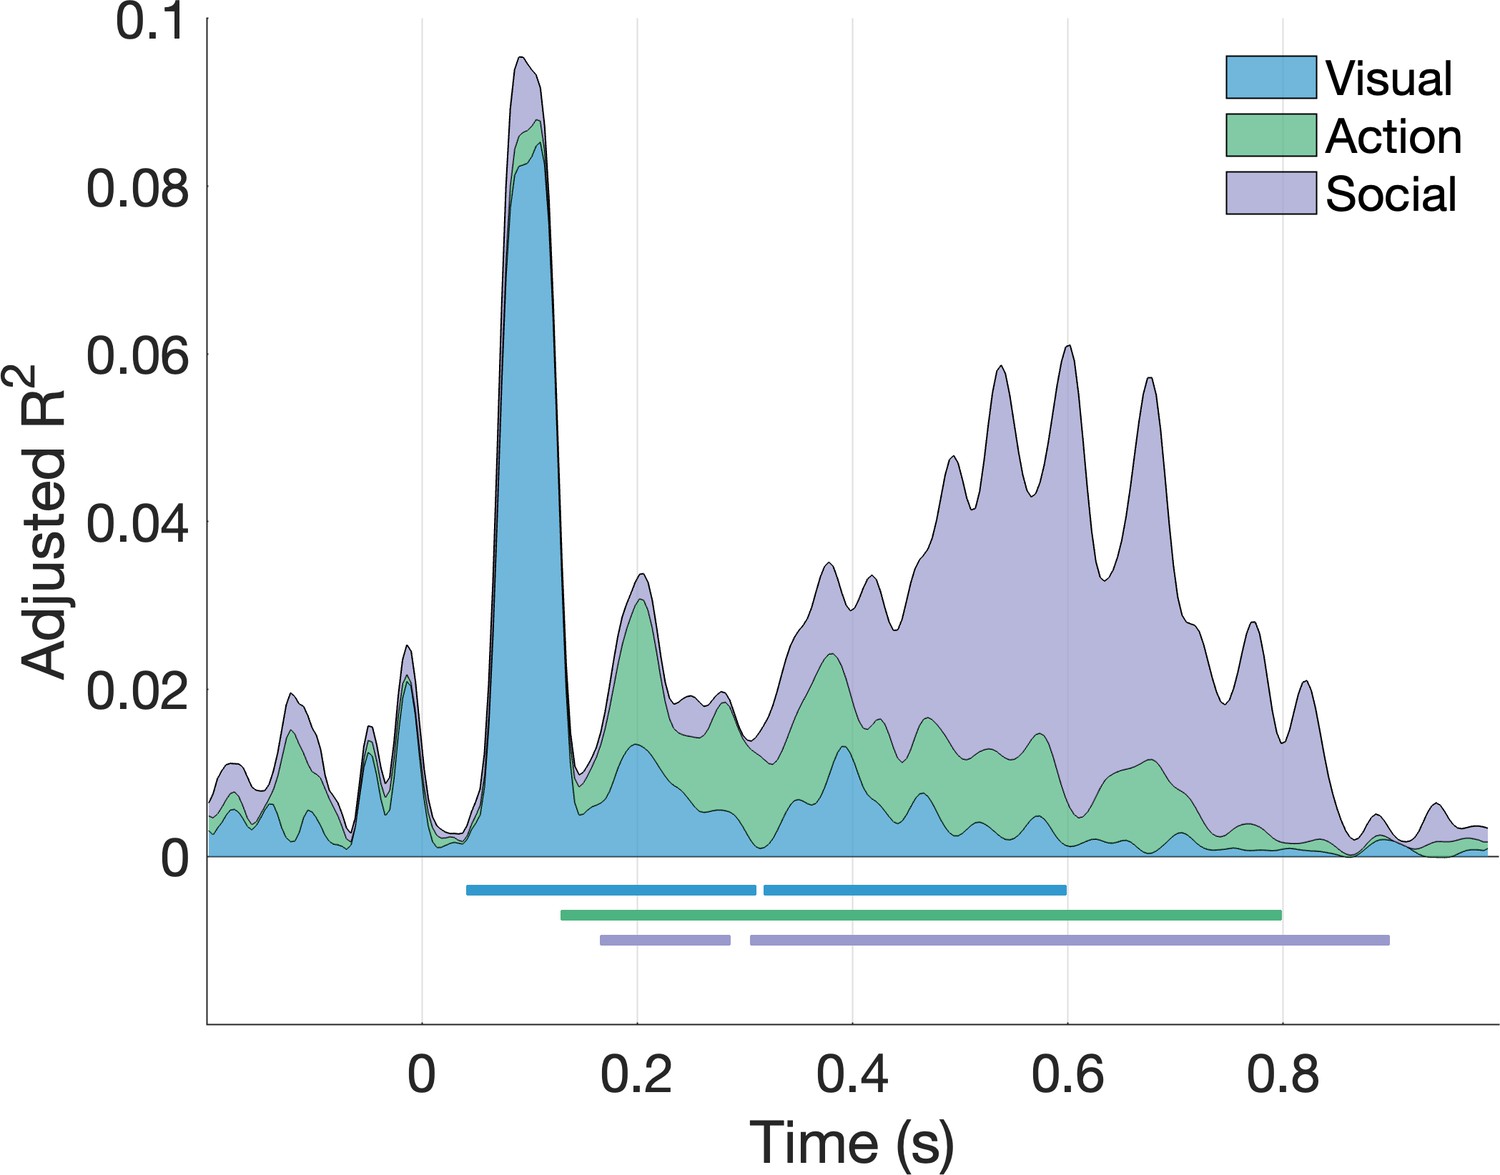
Figure 5 with 2 supplements
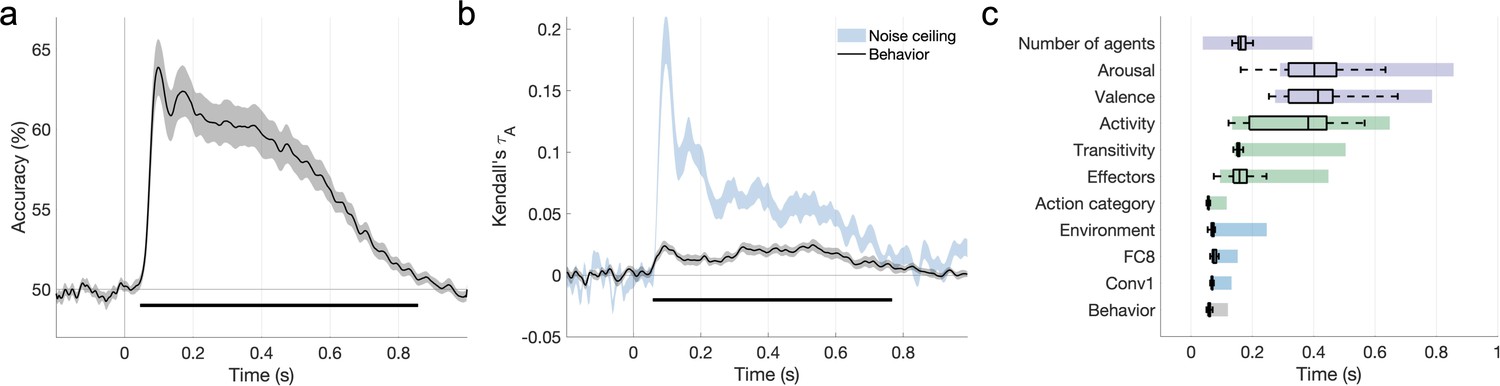
The features that explain behavioral action representations also contribute to neural representations.
(a) Time course of video decoding accuracy, averaged across all pairs of videos and participants (in gray: SEM across participants). The horizontal line marks above-chance performance (sign permutation testing, cluster-corrected p<0.05). (b) Behavioral similarity correlates with the neural representational dissimilarity matrices (RDMs). The noise ceiling is shown in light blue (leave-one-subject-out correlation, mean ± SEM). Horizontal lines mark significant time windows (sign permutation testing, cluster-corrected p<0.05). (c) The distribution of significant correlation onsets for each feature model across 1000 bootstrapping iterations (sign permutation testing, cluster-corrected p<0.05). Color rectangles show 90% confidence intervals. The time courses of all feature correlations are shown in Figure 5—figure supplement 1. The average electroencephalography (EEG) evoked response is visualized in Figure 5—figure supplement 2.
Figure 5—figure supplement 1
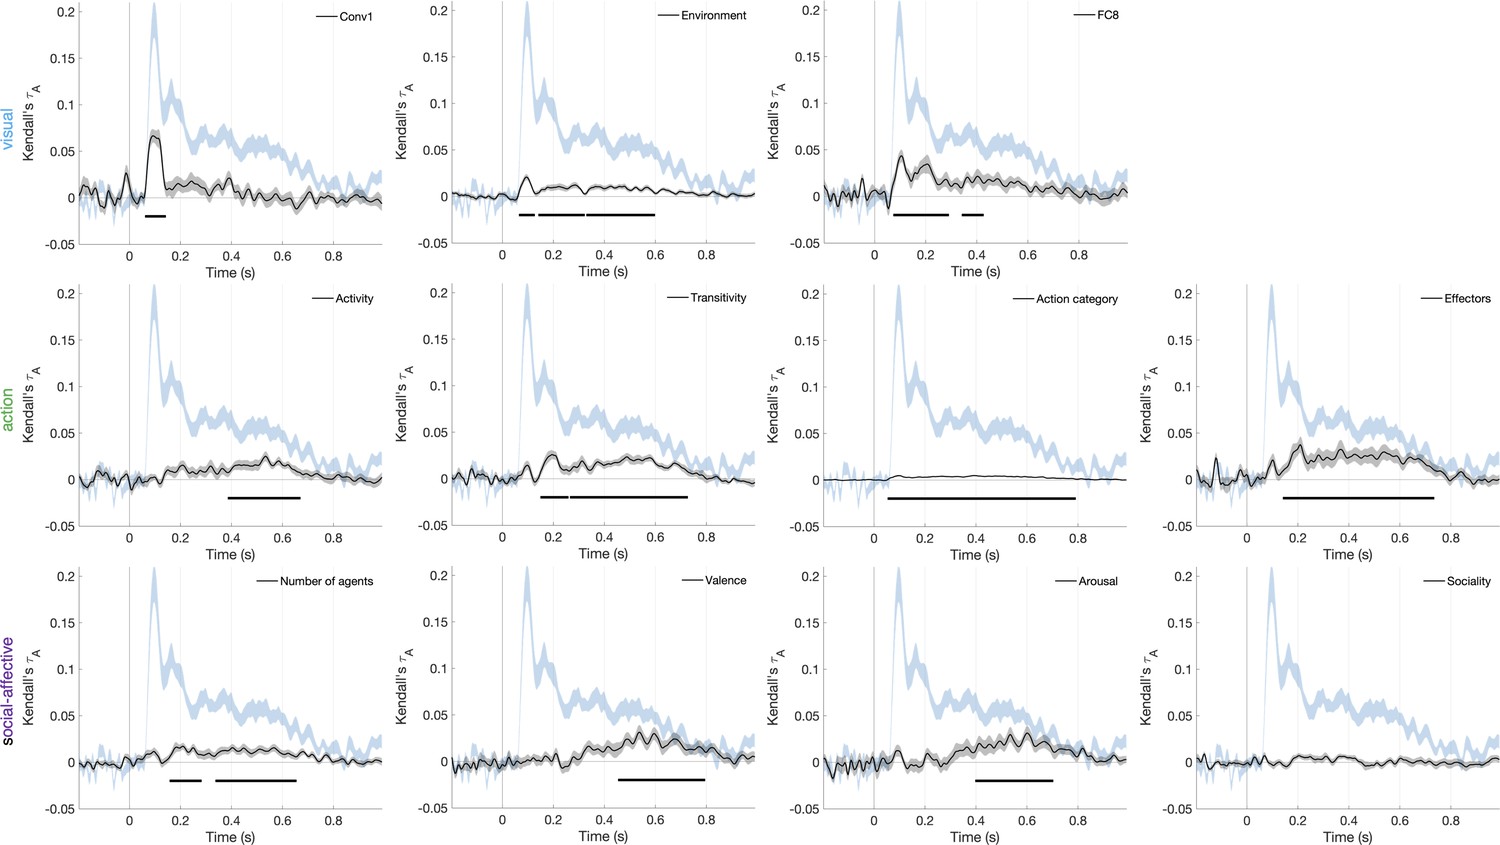
Correlations between features and the time-resolved neural representational dissimilarity matrices (RDMs).
The first layer of AlexNet (Conv1) was included since it is known to provide the best match to early visual neural responses.
Figure 5—figure supplement 2
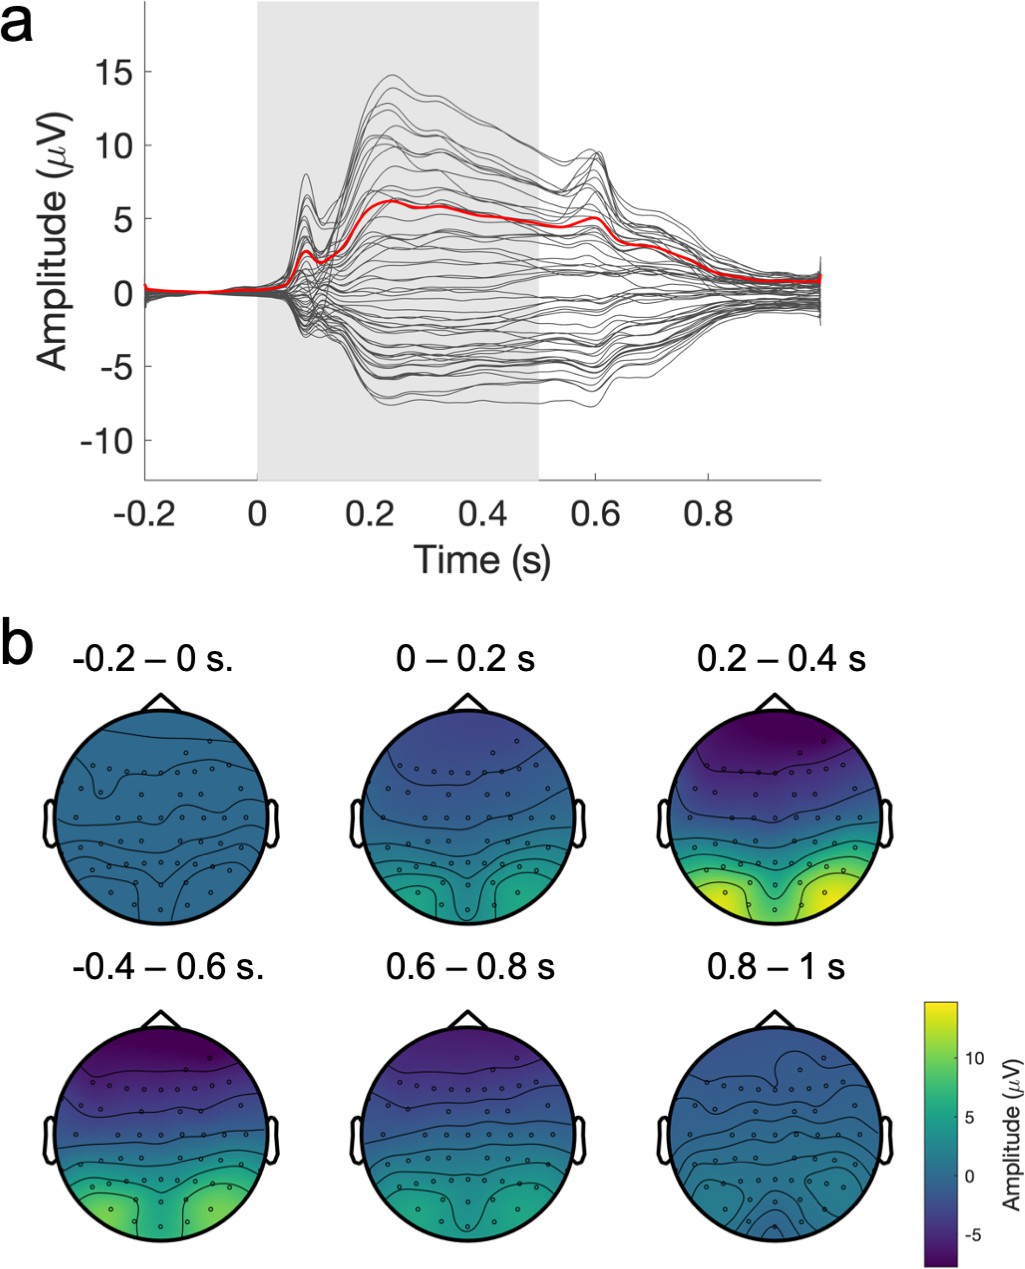
Average electroencephalography (EEG) evoked response.
(a) Grand average evoked response across participants. The average time course of the amplitude at each electrode is shown in black, with the global field power shown in red and the stimulus duration in light gray. (b) Average topography of the evoked response (re-referenced to the median), averaged across 0.2 s time windows.
Figure 6 with 3 supplements
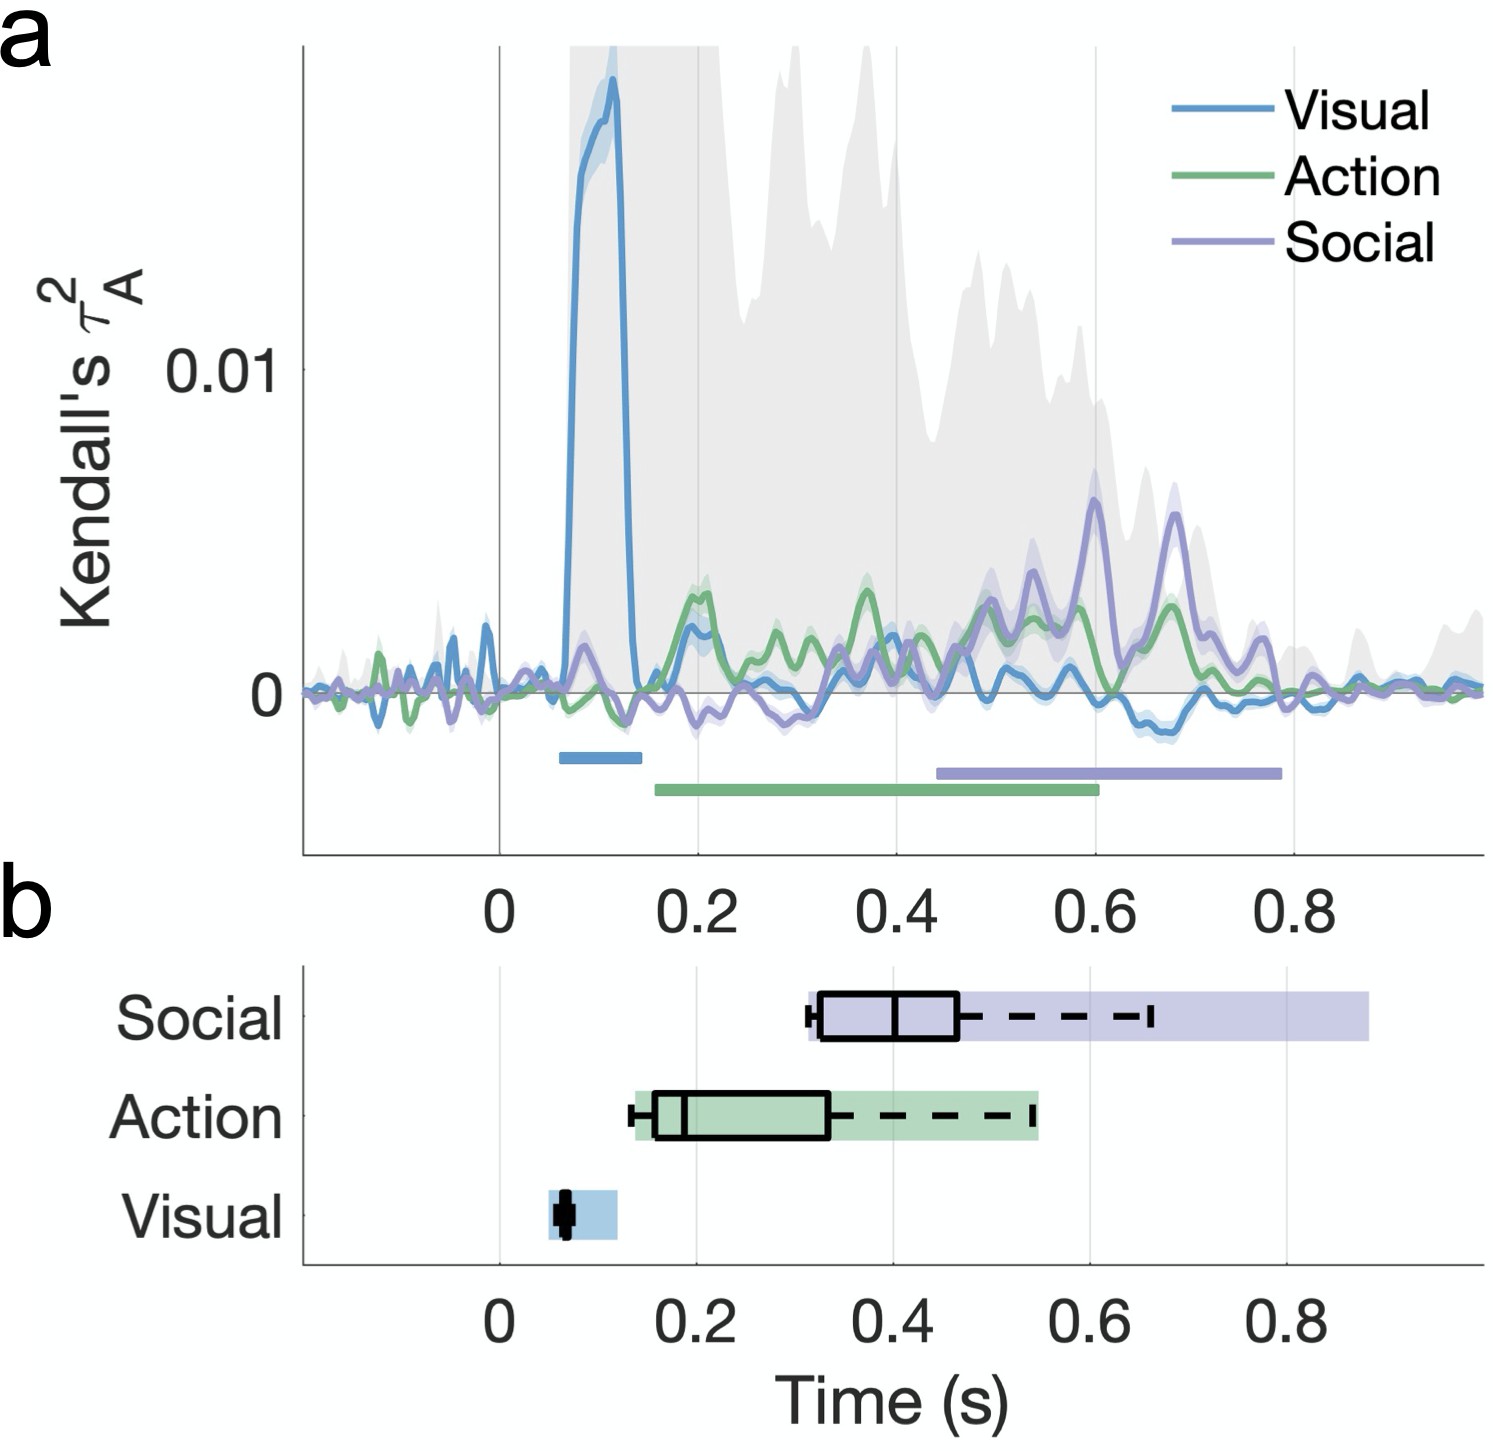
Hierarchical processing of visual, action, and social-affective features.
(a) Unique variance explained by each group of features over time. The split-half reliability of the data is shown in gray (shaded area; see also Figure 5b). Horizontal lines mark significant time windows (sign permutation testing, cluster-corrected p<0.05). The time course of shared variance is displayed in Figure 6—figure supplement 1. See Figure 6—figure supplement 2 for the results of a fixed-effects analysis. Figure 6—figure supplement 3 shows how the addition of a motion energy model affects these results. (b) The distribution of effect onsets across 100 split-half iterations (sign permutation testing, cluster-corrected p<0.05). Color rectangles show 90% confidence intervals.
Figure 6—figure supplement 1
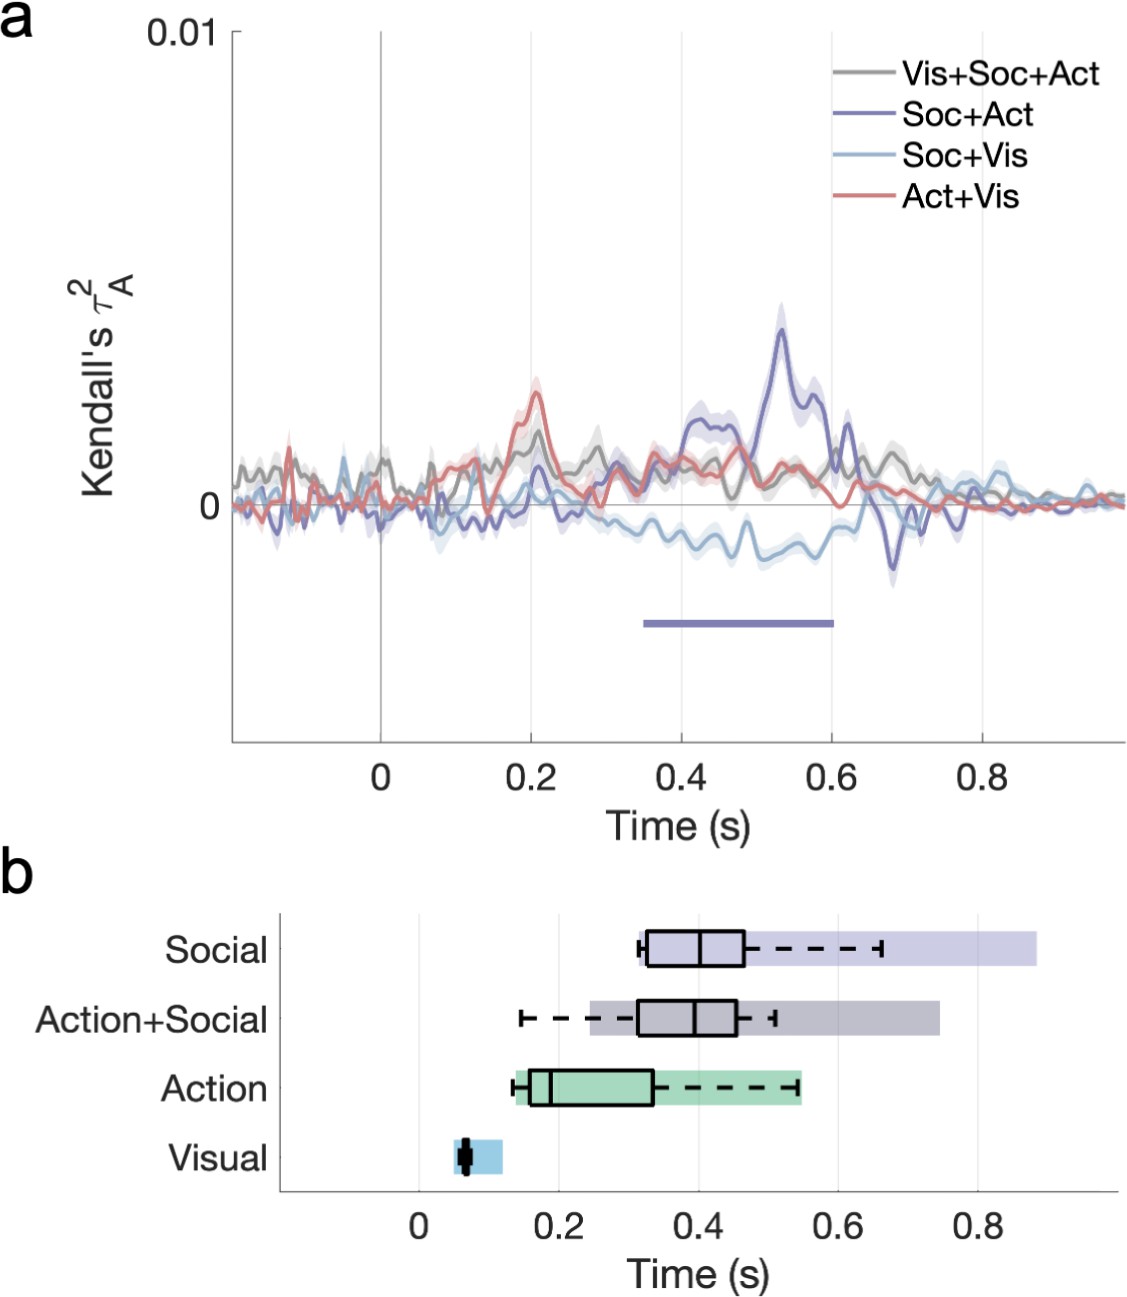
Shared variance among visual, action, and social predictors in the cross-validated variance partitioning analysis.
(a) Time course of shared variance. (b) Onsets (with bootstrapped 90% CIs) for all significant portions of unique and shared variance.
Figure 6—figure supplement 2
Fixed-effects variance partitioning results (stacked area plot).
A hierarchical regression was performed with the average time-resolved representational dissimilarity matrix (RDM) as a response variable. Only the unique contributions of the three predictor groups are shown. Horizontal lines mark significant time windows (cluster-corrected p<0.001, permutation testing).
Figure 6—figure supplement 3
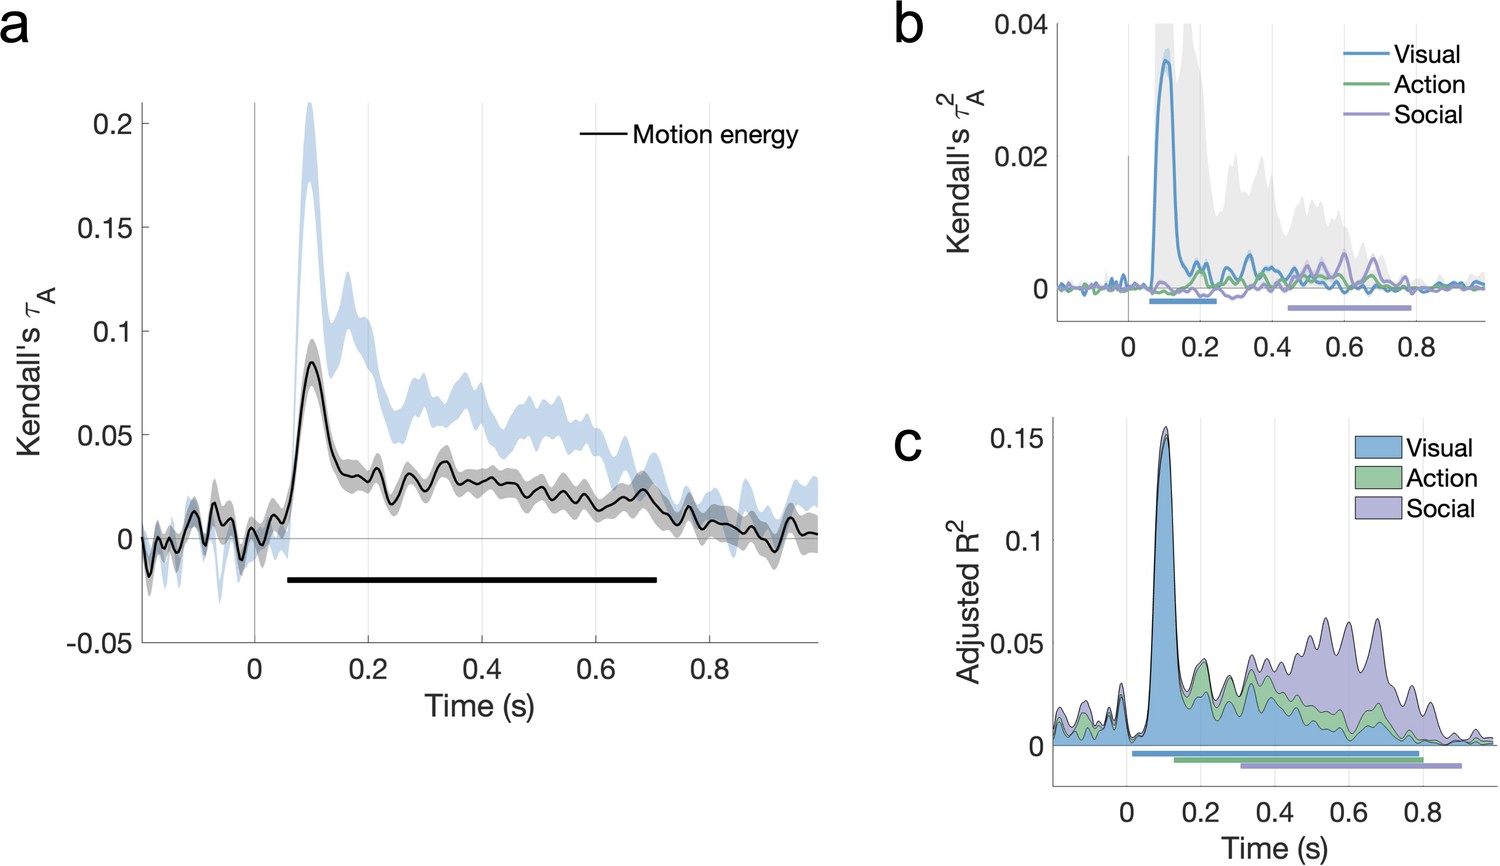
The contribution of motion energy to the neural data.
(a) The motion energy model correlates with neural responses. (b) Including the motion energy model among visual features reduces the unique contribution of action features, but not social features, in the cross-validated variance partitioning analysis. (c) The temporal hierarchy, however, remains the same in the fixed-effects analysis.
Author response image 1
Unique contributions of visual features (environment, FC8, activity), action features (action category, effectors, transitivity) and social-affective features (number of agents, sociality, valence and arousal).
Author response image 2
Social-affective features (sociality, valence, and arousal) still contribute more variance than visual features (environment, FC8, activity, and number of agents) and action features (action category, transitivity, and effectors).
Author response image 3
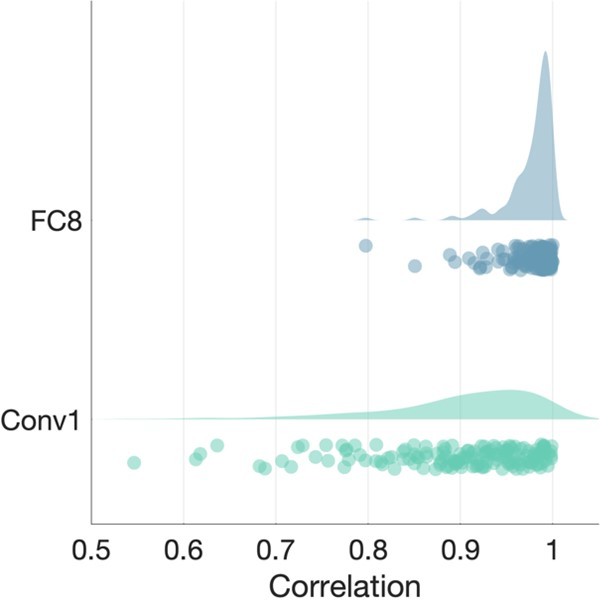
Average correlation of CNN features across frames.
Each dot in the scatterplots is a video, with the distribution of the correlations shown above.
Tables
Table 1
Activities from the American Time Use Survey (ATUS) included in each of the two stimulus sets, with the amount of daily hours spent performing each activity and the corresponding verb labels from the Moments in Time dataset.
Note that control videos were only included in the first dataset. Fighting and hiking were added for variation in valence and action setting.
| Activity | Hours | Verb labels (Moments in Time) |
|---|---|---|
| Childcare/taking care of children | 0.37 | Crying, cuddling, feeding, giggling, socializing |
| Driving | 1.17 | Driving, socializing |
| Eating | 1.06 | Chewing, eating |
| Fighting | Fighting | |
| Gardening | 0.17 | Gardening, mowing, planting, shoveling, weeding |
| Grooming | 0.68 | Bathing, brushing, combing, trimming, washing |
| Hiking | Hiking | |
| Housework | 0.53 | Cleaning, dusting, repairing, scrubbing, vacuuming |
| Instructing and attending class | 0.22 | Instructing, teaching |
| Playing games | 0.26 | Gambling, playing+fun, playing+videogames, socializing |
| Preparing food | 0.60 | Barbecuing, boiling, chopping, cooking, frying, grilling, rinsing, stirring |
| Reading | 0.46 | Reading |
| Religious activities | 0.14 | Praying, preaching |
| Sleeping | 8.84 | Resting, sleeping |
| Socializing and social events | 0.64 | Celebrating, dancing, marrying, singing, socializing, talking |
| Sports | 0.34 | Exercising, playing+sports, swimming, throwing |
| Telephoning | 0.16 | Calling, telephoning |
| Working | 3.26 | Working |
| Control videos | Blowing, floating, raining, shaking |
Additional files
-
Supplementary file 1
Additional information about the stimulus sets and features used in analysis.
(a) Breakdown of scene setting and number of agents across the two final stimulus sets. (b) Features quantified in both stimulus sets and used to generate feature representational dissimilarity matrices (RDMs) in the representational similarity analysis.
- https://cdn.elifesciences.org/articles/75027/elife-75027-supp1-v2.docx
-
Transparent reporting form
- https://cdn.elifesciences.org/articles/75027/elife-75027-transrepform1-v2.docx
Download links
A two-part list of links to download the article, or parts of the article, in various formats.
Downloads (link to download the article as PDF)
Open citations (links to open the citations from this article in various online reference manager services)
Cite this article (links to download the citations from this article in formats compatible with various reference manager tools)
Social-affective features drive human representations of observed actions
eLife 11:e75027.
https://doi.org/10.7554/eLife.75027


