Protection of nascent DNA at stalled replication forks is mediated by phosphorylation of RIF1 intrinsically disordered region
- Laboratory of Genome Diversification & Integrity, Max Delbrück Center for Molecular Medicine in the Helmholtz Association, Germany
- Freie Universität Berlin, Germany
- Institute of Medical Sciences, University of Aberdeen, Foresterhill, United Kingdom
- Laboratory of Mass Spectrometry and Gaseous Ion Chemistry, The Rockefeller University, United States
- Proteomics Platform, Max Delbrück Center for Molecular Medicine in the Helmholtz Association and Berlin Institute of Health, Germany
- Laboratory of Molecular Immunology, The Rockefeller University, United States
- Charité-Universitätsmedizin Berlin, Germany
Figures
Figure 1
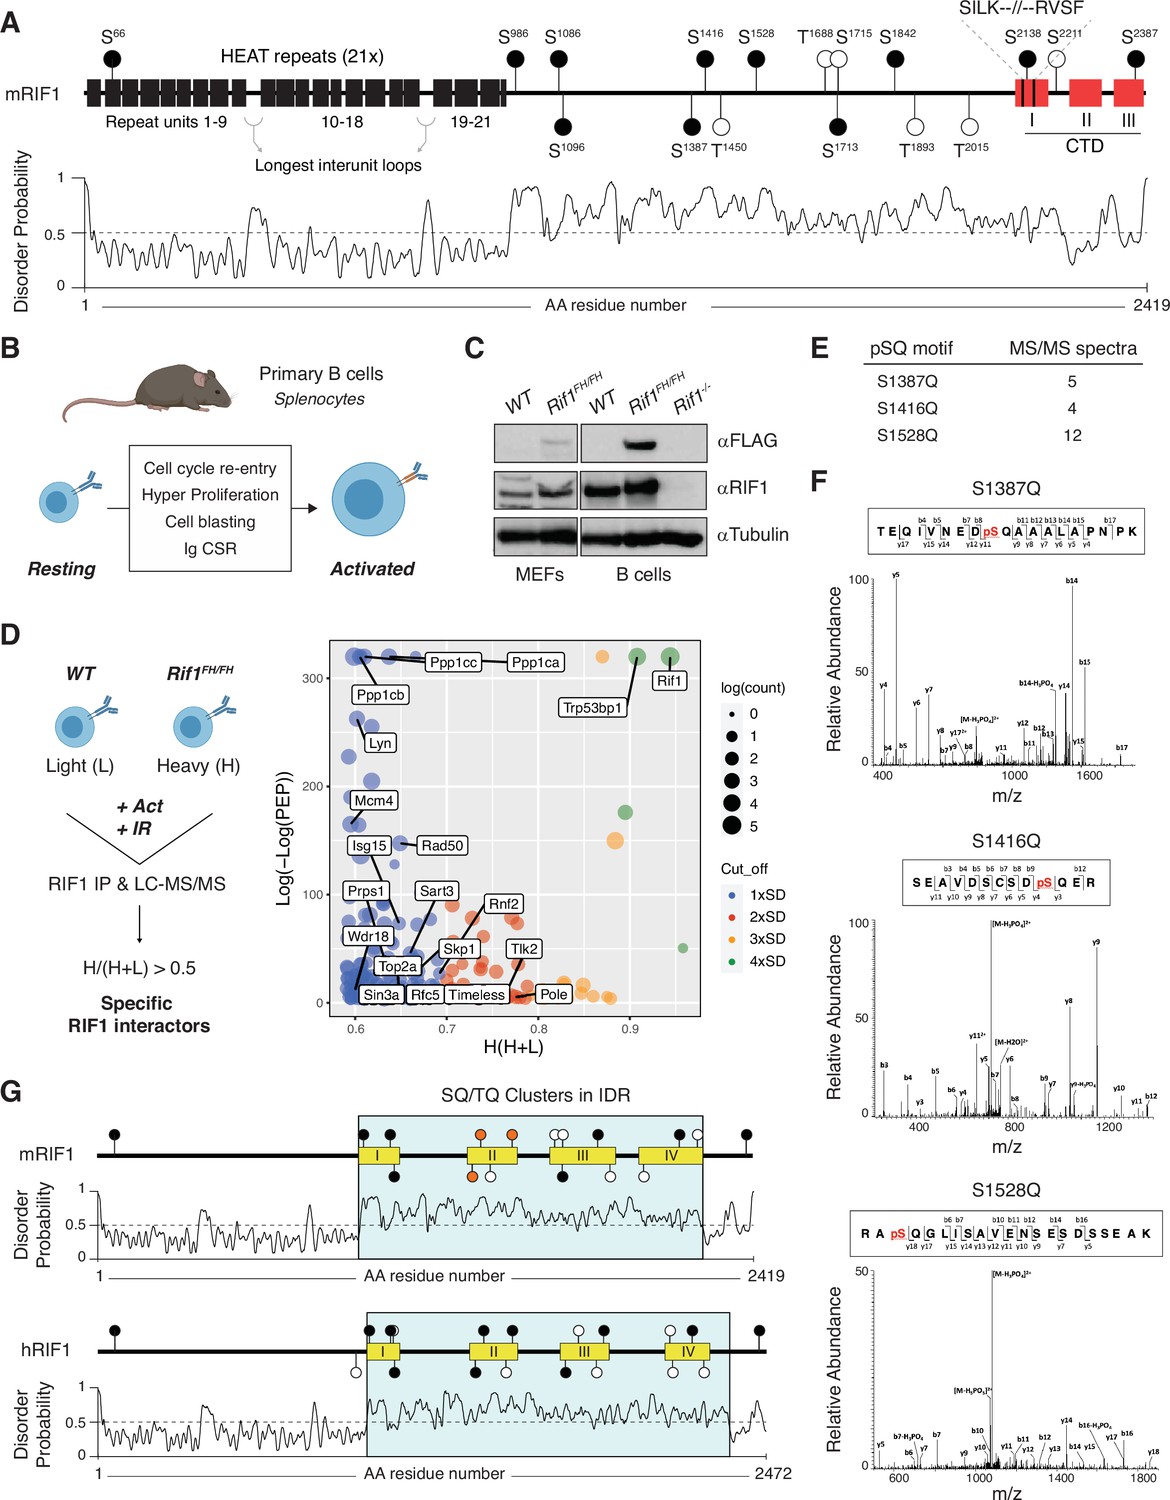
A conserved cluster of serine-glutamine (SQ) motifs within RIF1 intrinsically disordered region (IDR) is phosphorylated in activated B lymphocytes.
(A) Top: schematic representation of mammalian RIF1 domains and motifs. The scheme refers to the canonical sequence for mouse RIF1 (mRIF1, isoform 1, 2419 amino acids, UniProt entry Q6PR54-1). Filled and empty circle symbols represent conserved and nonconserved SQ/threonine-glutamine (TQ) motifs, respectively, between mRIF1 and human RIF1 (hRIF1, isoform 1, 2472 amino acids, UniProt entry Q5UIP0-1) (see also Figure 1—source data 1 and Figure 1—source data 2). CTD: carboxyl-terminal domain. Bottom: disorder profile plot of mRIF1 as determined by Protein DisOrder prediction System (PrDOS). (B) Schematic representation of key cellular changes and processes induced by the activation of mature B lymphocytes. Ig CSR: immunoglobulin class switch recombination. (C) Western blot analysis of whole-cell extracts from mouse embryonic fibroblasts (MEFs) and primary B cells derived from mice of the indicated genotypes. For each depicted antibody staining, the left and right blots represent noncontiguous portions of the same gel and film exposure. Rif1-/-: Rif1F/FCd19Cre/+. (D) Left: schematic representation of RIF1 Isotopic Differentiation of Interactions as Random or Targeted (I-DIRT) in primary cultures of B cells. Light (L): light media; heavy (H): heavy media; Act: activation; IR: ionizing radiation; LC-MS/MS: liquid chromatography-tandem mass spectrometry. Right: graph depicting the distribution of identified RIF1 I-DIRT proteins as a function of their H/(H+L) ratio and posterior error probability (PEP) (data from Delgado-Benito et al., 2018). Only proteins with PEP ≤ 10–4 were included in the graph. SD: standard deviation units (0.10) from the mean of the distribution (0.49); Count: number of peptides identified per protein. (E) Number of MS/MS spectra identified for the indicated phosphorylated SQ (pSQ) motif-containing peptides in different RIF1 I-DIRT preparations. (F) Representative MS/MS spectra of the RIF1 peptides encompassing phosphorylated residues S1387, S1416, and S1528. (G) Schematic representation of SQ/TQ motif clusters in the IDRs of mouse and human RIF1, which were defined by the PrDOS disorder profile plots (Ishida and Kinoshita, 2007). Orange filled symbols represent the conserved S1387, S1416, and S1528 residues identified as phosphorylated SQ motifs in mRIF1.
-
Figure 1—source data 1
List of RIF1 protein homologs across representative species from the Animalia and Fungi kingdoms.
- https://cdn.elifesciences.org/articles/75047/elife-75047-fig1-data1-v1.docx
-
Figure 1—source data 2
Alignment of peptides containing SQ/TQ motifs conserved between mouse and human RIF1 proteins across representative species from the Animalia and Fungi kingdoms.
- https://cdn.elifesciences.org/articles/75047/elife-75047-fig1-data2-v1.docx
-
Figure 1—source data 3
Original file for the Western blot analysis in Figure 1C (anti-FLAG, anti-RIF1, and anti-tubulin).
- https://cdn.elifesciences.org/articles/75047/elife-75047-fig1-data3-v1.zip
-
Figure 1—source data 4
PDF containing Figure 1C and original scans of the relevant Western blot analysis (anti-FLAG, anti-RIF1, and anti-tubulin) with highlighted bands and sample labels.
- https://cdn.elifesciences.org/articles/75047/elife-75047-fig1-data4-v1.zip
-
Figure 1—source data 5
Excel file containing output results of MaxQuant analysis for the potential RIF1 interactors for the graph in Figure 1D.
Protein H/(H+L) ratios were derived using peptides’ H/L intensity values in MaxQuant output.
- https://cdn.elifesciences.org/articles/75047/elife-75047-fig1-data5-v1.xlsx
Figure 2 with 2 supplements

Phosphorylation of RIF1 at the conserved IDR-CII serine-glutamine (SQ) motifs is dispensable for its roles in double-strand break (DSB) end protection.
(A) Schematic representation of BRCA1-deficient CH12 model system’s versatility to investigate both pathological and physiological consequences of RIF1-mediated DSB end protection. CIT: αCD40, IL-4, and TGFβ B cell activation cocktail. (B) Left: representative images of chromosomal aberrations typically associated with homologous recombination (HR) deficiency (chromatid breaks and radial chromosomes). Right: graph summarizing the average number of chromosomal aberrations in the parental CH12 cell line (WT sample) and selected Brca1mut clonal derivatives following 1 μM PARPi treatment for 24 hr from two independent experiments (n = 50 metaphases analyzed per genotype). Breakdown of the same data into actual number of aberrations per cell is shown for one experimental repeat in Figure 2—figure supplement 1C. (C) Residual viability of Brca1mut CH12 cell lines after treatment with 1 μM of PARPi versus DMSO (mock treatment control) for 72 hr. Residual viability was calculated as percentage of cell viability of PARPi- over DMSO-treated cultures. Graph summarizes four independent experiments per Brca1mut clonal derivative. The control (Ctrl) samples comprise parental WT CH12 cells and clonal cell lines generated by targeting CH12 cells with gRNAs against random sequences not present in the mouse genome (validated Random clones, Brca1mutR). (D) Residual viability of Brca1mut-1 CH12 cells nucleofected with random gRNAs (Random), or 53bp1, Rif1, and Rev7, and treated for 72 hr with 1 μM of PARPi versus DMSO. Graph summarizes four independent experiments. (E) Left: representative flow cytometry plots measuring class switch recombination (CSR) to IgA in activated cell lines of the indicated genotype. Right: summary graph for at least three independent experiments per Brca1mut cell line, with CSR% levels within each experiment normalized to the average of controls (parental WT CH12 and one Random clone), which was set to 100. (F) Top: amino acid sequence in the IDR-CII SQ region of WT and S→A-mutated RIF1 protein. Bottom: Western blot analysis of whole-cell extracts from independent cells lines of the indicated genotypes (Rif1-/-, control Random R, and Rif1S→A, all generated on the parental [P] Brca1mut-1 cell line background, henceforth indicated as Brca1mut). (G) Graph summarizing the average number of chromosomal aberrations in cells of the indicated genotypes following 1 μM PARPi treatment for 24 hr with each Brca1mutRif1S→A cell line tested twice over three independent experiments (n = 50 metaphases analyzed per genotype). Control samples include the parental Brca1mut-1 cell line (P) and a derivative Brca1mutR clone. (H) Residual viability of Brca1mutRif1S→A cell lines after treatment with 1 μM of PARPi versus DMSO for 72 hr. Graph summarizes four independent experiments per Brca1mutRif1S→A clonal derivative. The control (Ctrl) samples comprise parental Brca1mut-1 cells and Brca1mutR clones. (I) Left: representative flow cytometry plots measuring CSR to IgA in activated cell lines of the indicated genotype. Right: summary graph for four independent experiments, with CSR% levels within each experiment normalized to the average of controls (parental Brca1mut-1 and one Random clone), which was set to 100. Significance in panels (C), (D), (H), and (I) was calculated with the Mann–Whitney U-test, and error bars represent SD. *p≤0.05; **p≤0.01; ***p≤0.001.
-
Figure 2—source data 1
Original file for the Western blot analysis in Figure 2F (anti-RIF1).
- https://cdn.elifesciences.org/articles/75047/elife-75047-fig2-data1-v1.zip
-
Figure 2—source data 2
Original file for the Western blot analysis in Figure 2F (anti-β-actin).
- https://cdn.elifesciences.org/articles/75047/elife-75047-fig2-data2-v1.zip
-
Figure 2—source data 3
PDF containing Figure 2F and original scans of the relevant Western blot analysis (anti-RIF1 and anti-β-actin) with highlighted bands and sample labels.
- https://cdn.elifesciences.org/articles/75047/elife-75047-fig2-data3-v1.zip
Figure 2—figure supplement 1
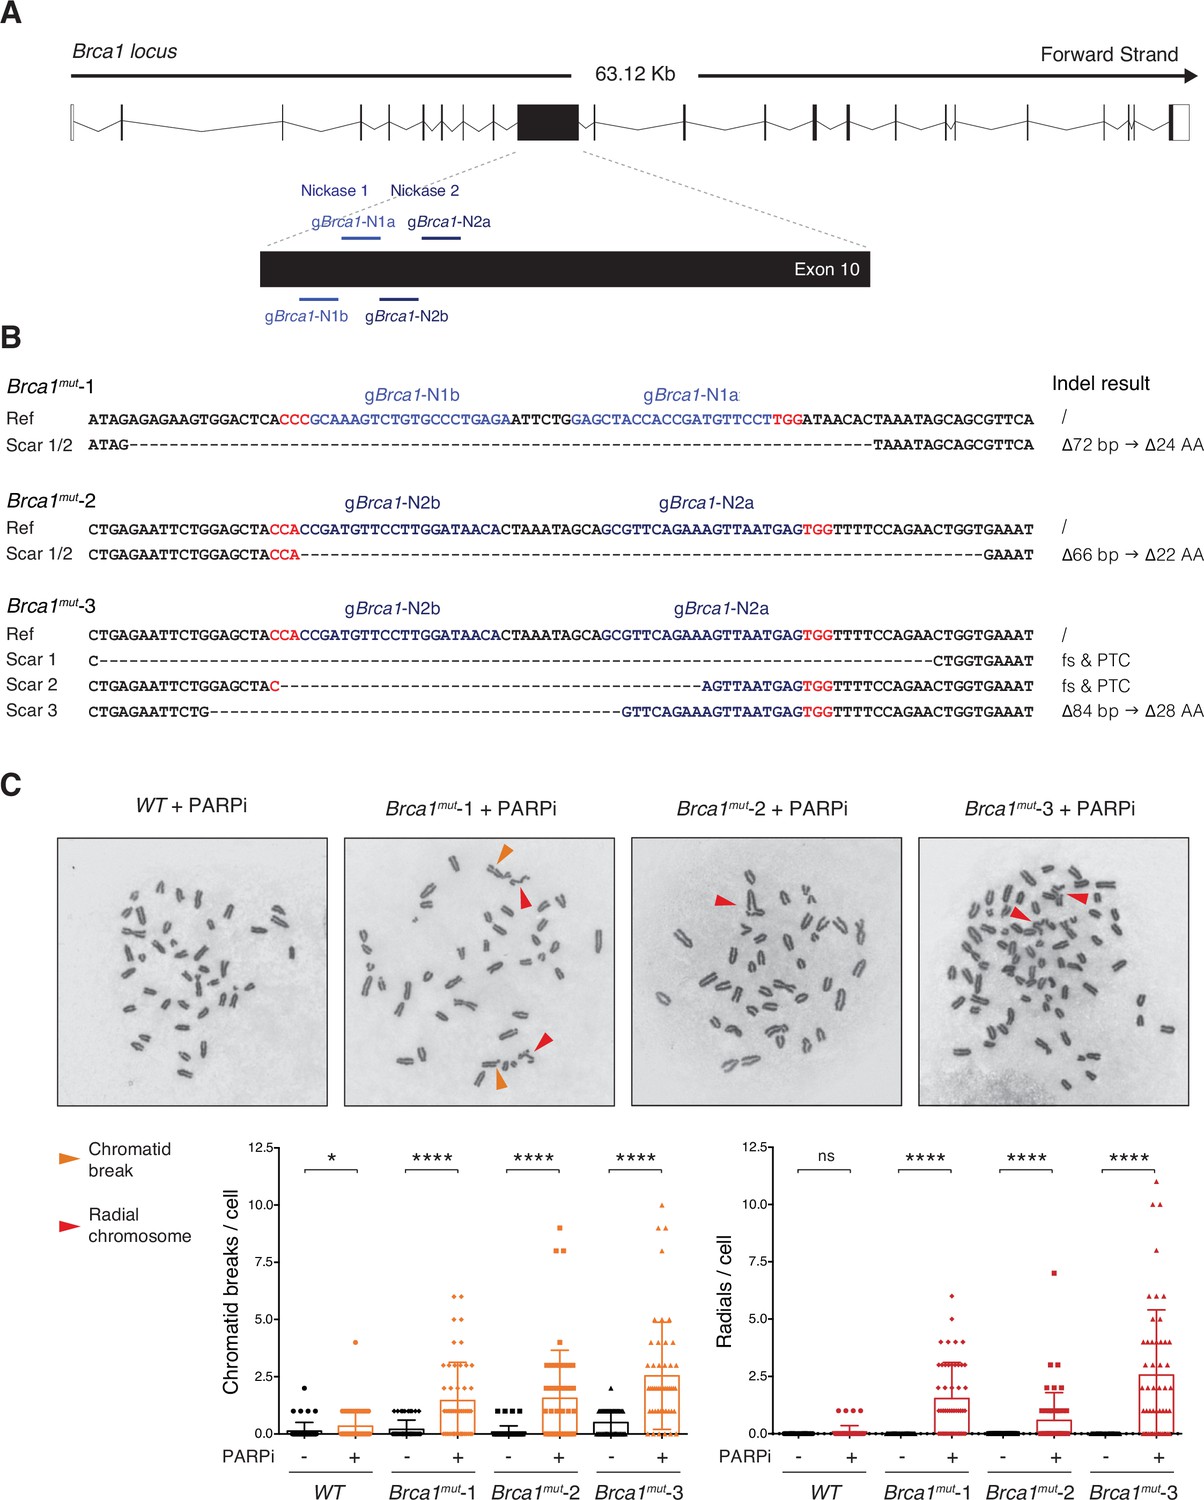
BRCA1-mutated CH12 cell lines recapitulate the genomic instability of BRCA1 deficiency.
(A) Scheme of mouse Brca1 genomic locus (scheme adapted from Ensembl ENSMUST00000017290.10) and location of gRNAs used in this study. The nickase gRNA pairs are gBrca1-N1a and gBrca1-N1b for Nickase 1, and gBrca1-N2a and gBrca1-N2b for Nickase 2. Please note that the targeted exon, which is the 10th exon in the official Ensembl Brca1-201 transcript, is commonly referred to in literature (and in the text of this paper) as exon 11 because of a historical misannotation of one additional exon (Evers and Jonkers, 2006; Miki et al., 1994). (B) Genomic scar of the selected Brca1mut clonal derivatives (Brca1mut-1, Brca1mut-2, and Brca1mut-3). The expected/potential consequences at the protein level are indicated for each scar. The gRNAs employed to generate each cell line are highlighted in shades of blue with the PAM sequence in red. Note that Brca1mut-1 and Brca1mut-2 bear the same CRISPR scar on both alleles, whereas the Brca1mut-3 cell line has three genomic scars since it possesses a near-tetraploid chromosome set (see also panel C). Ref: reference sequence; Indel: insertion and/or deletion; Δ: base pairs (bp)/amino acid (AA) deletion; fs: amino acid frameshift; PTC: premature termination codon. (C) Analysis of genomic instability in Brca1mut CH12 cell lines. Top: representative metaphase spreads from parental CH12 cell line (WT sample) and selected Brca1mut clonal derivatives following PARPi treatment (1 μM for 72 hr). Orange and red arrows indicate examples of chromatid breaks and radial chromosomes, respectively. Bottom: summary graphs for the number of chromatid breaks and radial chromosomes per metaphase/cell (n = 50 metaphases analyzed per genotype). Significance in panel (C) was calculated with the Mann–Whitney U-test, and error bars represent SD. ns, not significant; *p≤0.05; ****p<0.0001.
-
Figure 2—figure supplement 1—source data 1
Original image of WT metaphase spreads in Figure 2—figure supplement 1C.
- https://cdn.elifesciences.org/articles/75047/elife-75047-fig2-figsupp1-data1-v1.zip
-
Figure 2—figure supplement 1—source data 2
Original image of Brca1mut-1 metaphase spreads in Figure 2—figure supplement 1C.
- https://cdn.elifesciences.org/articles/75047/elife-75047-fig2-figsupp1-data2-v1.zip
-
Figure 2—figure supplement 1—source data 3
Original image of Brca1mut-2 metaphase spreads in Figure 2—figure supplement 1C.
- https://cdn.elifesciences.org/articles/75047/elife-75047-fig2-figsupp1-data3-v1.zip
-
Figure 2—figure supplement 1—source data 4
Original image of Brca1mut-3 metaphase spreads in Figure 2—figure supplement 1C.
- https://cdn.elifesciences.org/articles/75047/elife-75047-fig2-figsupp1-data4-v1.zip
Figure 2—figure supplement 2
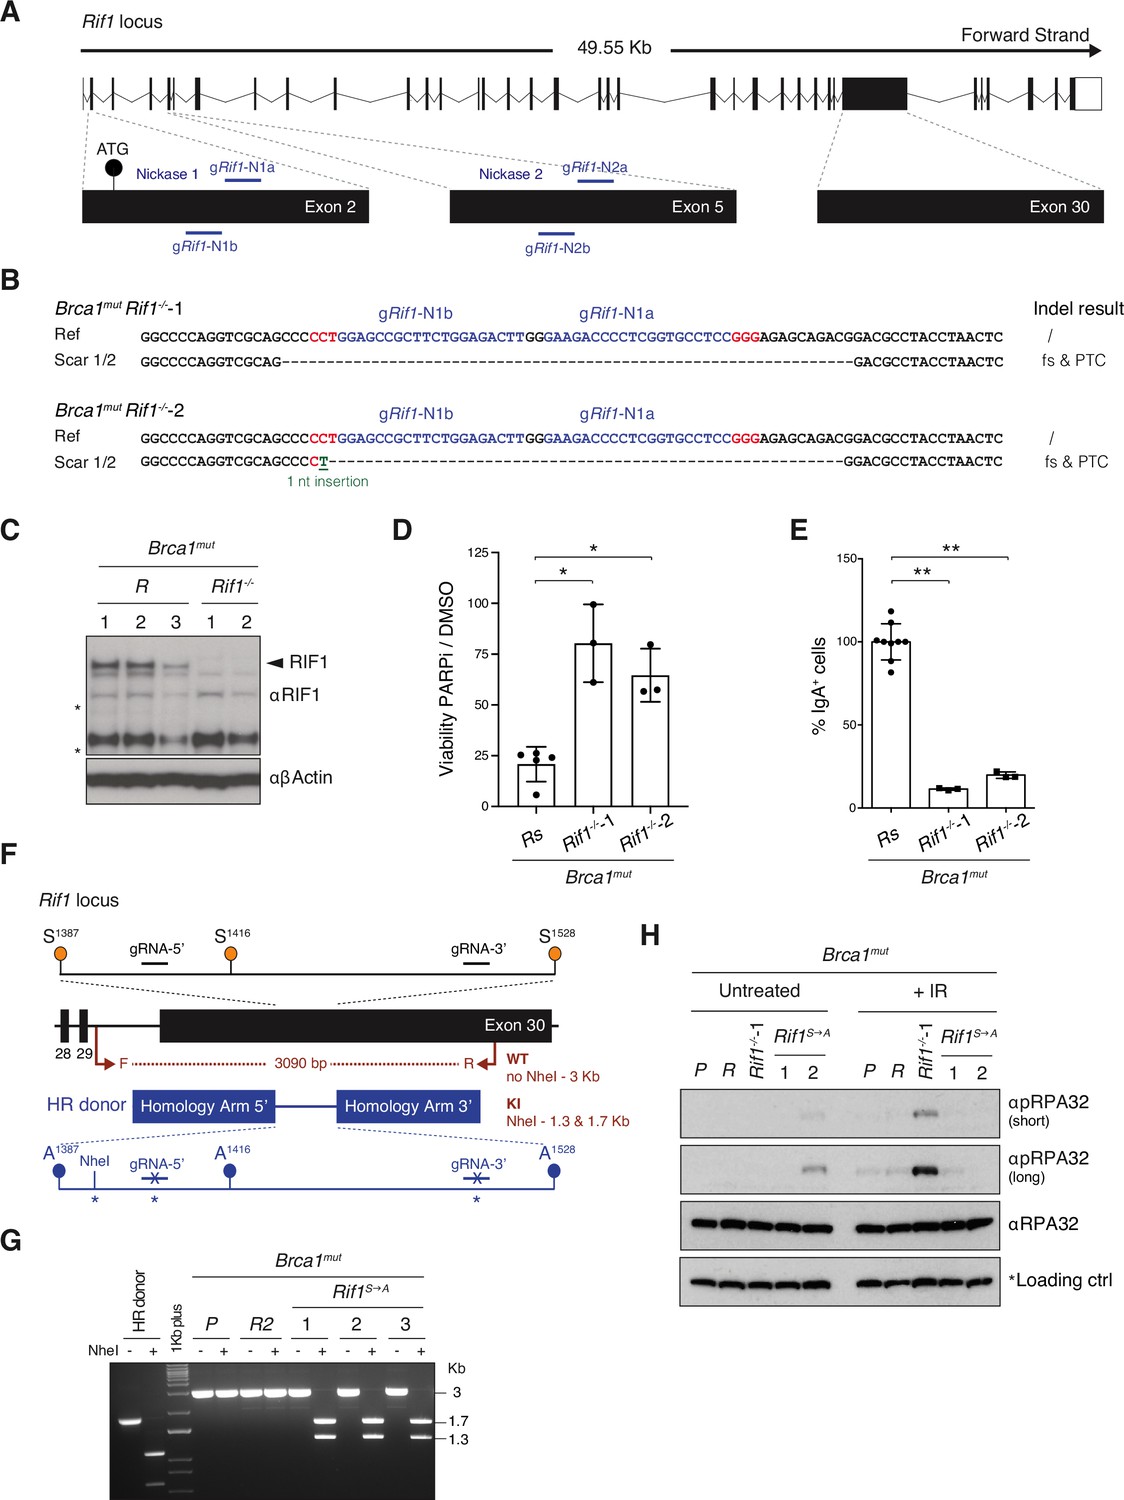
Generation of RIF1-mutant CH12 cell lines on a BRCA1-mutant background.
(A) Scheme of mouse Rif1 genomic locus (scheme adapted from Ensembl Rif1-201 ENSMUST00000112693.9) and location of gRNAs used in this study. The nickase gRNA pairs are gRif1-N1a and gRif1-N1b for Nickase 1, and gRif1-N2a and gRif1-N2b for Nickase 2. (B) Genomic scar of two selected/representative Brca1mutRif1-/- clonal derivatives (Brca1mutRif1-/-–1 and Brca1mutRif1-/-–2). The expected consequences at the protein level are indicated for each scar. The gRNAs employed to generate each cell line are highlighted in shades of blue with the PAM sequence in red. Ref: reference sequence; Indel: insertion and/or deletion; fs: amino acid frameshift; PTC: premature termination codon. (C) Western blot analysis of whole-cell extracts from control Brca1mutR and Brca1mutRif1-/- cell lines. The arrowhead indicates RIF1 band, whereas the asterisk symbol denotes aspecific bands that can be used as additional internal loading controls. (D) Residual viability of control Brca1mutRs and Brca1mutRif1-/- cell lines after treatment with 1 μM of PARPi versus DMSO (mock treatment control) for 72 hr. Residual viability was calculated as percentage of cell viability of PARPi- over DMSO-treated cultures. Graph summarizes three independent experiments per Brca1mutRif1-/- clone. (E) Dot plot depicting class switch recombination (CSR) to IgA in activated control (Brca1mutR) and two selected Brca1mutRif1-/- cell lines. The graph summarizes three independent experiments per Brca1mut Rif1-/- cell line with CSR efficiencies within each experiment normalized to either one, or the average CSR value of two, control Brca1mutR, which was set to 100%. (F) Schematic representation of the knock-in strategy employed for the Ser to Ala mutagenesis at the conserved serine-glutamine (SQ) motifs in the IDR-CII cluster. Location of primers (F, forward; R, reverse) and expected PCR digestion products employed for initial assessment of targeting results are indicated in dark red. KI: knock-in. Asterisk symbol indicates silent mutations introduced to create the NheI diagnostic restriction site and to render the knocked-in sequences resistant to CRISPR-Cas9 digestion. (G) Characterization of selected Brca1mut Rif1S→A CH12 cell lines by diagnostic digestion. The bands refer to the NheI-undigested and -digested products of the PCR analysis performed with the primers indicated in panel (G). Note that the undigested and digested products of the donor DNA PCR fragment (digestion control) are of smaller size compared to the cell line sample fragments because they are amplified with primers inside the homology arms of the donor plasmid. The control cell line samples comprise the parental Brca1mut-1 cell line (P) and a Brca1mutR clonal derivative. (H) Western blot analysis of whole-cell extracts from cells lines of the indicated genotypes. The asterisk symbol denotes an aspecific band that was included as an additional internal loading control. The analysis is representative of two independently performed experiments. IR: ionizing radiation. Significance in panels (D) and (E) was calculated with the Mann–Whitney U-test, and error bars represent SD. *p≤0.05; **p≤0.01.
-
Figure 2—figure supplement 2—source data 1
Original file for the Western blot analysis in Figure 2—figure supplement 2C (anti-RIF1 and anti-β-actin).
- https://cdn.elifesciences.org/articles/75047/elife-75047-fig2-figsupp2-data1-v1.zip
-
Figure 2—figure supplement 2—source data 2
PDF containing Figure 2—figure supplement 2C and original scans of the relevant Western blot analysis (anti-RIF1 and anti-β-actin) with highlighted bands and sample labels.
- https://cdn.elifesciences.org/articles/75047/elife-75047-fig2-figsupp2-data2-v1.zip
-
Figure 2—figure supplement 2—source data 3
Original file for the diagnostic digestion in Figure 2—figure supplement 2G.
- https://cdn.elifesciences.org/articles/75047/elife-75047-fig2-figsupp2-data3-v1.zip
-
Figure 2—figure supplement 2—source data 4
PDF containing Figure 2—figure supplement 2G and original files of the relevant diagnostic digestion with highlighted bands and sample labels.
- https://cdn.elifesciences.org/articles/75047/elife-75047-fig2-figsupp2-data4-v1.zip
-
Figure 2—figure supplement 2—source data 5
Original file for the Western blot analysis in Figure 2—figure supplement 2H (anti-pRPA long).
- https://cdn.elifesciences.org/articles/75047/elife-75047-fig2-figsupp2-data5-v1.zip
-
Figure 2—figure supplement 2—source data 6
Original file for the Western blot analysis in Figure 2—figure supplement 2H (anti-pRPA short).
- https://cdn.elifesciences.org/articles/75047/elife-75047-fig2-figsupp2-data6-v1.zip
-
Figure 2—figure supplement 2—source data 7
Original file for the Western blot analysis in Figure 2—figure supplement 2H (anti-RPA).
- https://cdn.elifesciences.org/articles/75047/elife-75047-fig2-figsupp2-data7-v1.zip
-
Figure 2—figure supplement 2—source data 8
PDF containing Figure 2—figure supplement 2H and original scans of the relevant Western blot analysis (anti-pRPA and anti-RPA) with highlighted bands and sample labels.
- https://cdn.elifesciences.org/articles/75047/elife-75047-fig2-figsupp2-data8-v1.zip
Figure 3 with 1 supplement
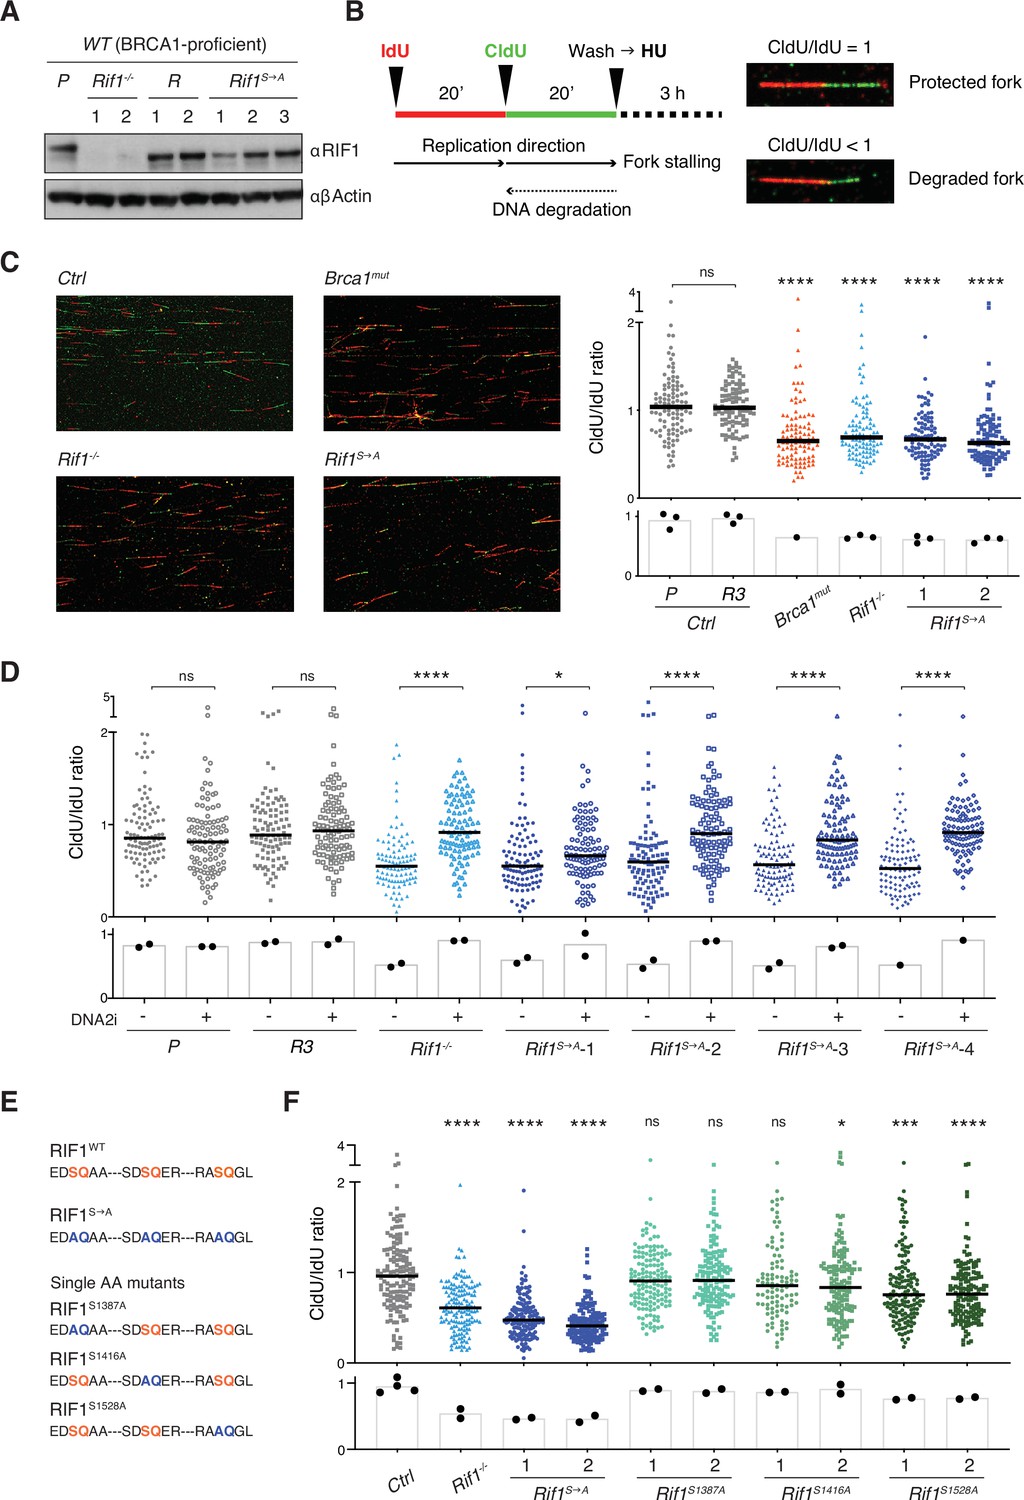
Phosphorylation of the conserved IDR-CII serine-glutamine (SQ) cluster enables RIF1-dependent protection of nascent DNA at stalled replication forks.
(A) Western blot analysis of whole-cell extracts from independent cells lines of the indicated genotypes (Rif1-/-, control Random clones R, and Rif1S→A, all generated on the parental – P – WT CH12 background). (B) Left: schematic representation of the DNA fiber assay employed to assess protection of nascent DNA at stalled replication forks. Right: representative images of protected and degraded DNA fibers. (C) Left: representative fields for the analysis of nascent DNA degradation following 3 hr treatment with 4 mM HU in CH12 cells of the indicated genotypes. Right: graph summarizing the quantification of CldU/IdU ratio for n = 100 DNA fibers analyzed per genotype (1 and 2 indicate two different Rif1S→A clonal derivatives). The graph is representative of three independently performed experiments. (D). Graph summarizing the quantification of CldU/IdU ratio for n ≥ 100 DNA fibers analyzed per genotype in HU-treated cells in the absence/presence of 0.3 μM DNA2i (four different Rif1S→A clonal derivatives were employed). The graph is representative of two independently performed experiments. (E) Amino acid sequence in the IDR-CII SQ region of WT, S→A- and single SQ-mutated RIF1 proteins. (F) Graph summarizing the quantification of CldU/IdU ratio for n = 100–150 DNA fibers analyzed per genotype (1 and 2 indicate two different clonal derivatives). The control (Ctrl) samples comprise the parental CH12 cell line and the R clone employed also for the analyses in panels (C) and (D). The graph is representative of two independently performed experiments. Significance in panels (C), (D), and (F) was calculated with the Mann–Whitney U-test, and the median is indicated. Significance for each cell line in the graph in panel (C) was calculated in reference to the parental CH12 (P) sample. ns, not significant; *p≤0.05; ***p≤0.001; ****p<0.0001. The bar charts underneath the main graphs in panels (C), (D), and (F) display the samples’ median for each independently performed experiment.
-
Figure 3—source data 1
Original file for the Western blot analysis in Figure 3A (anti-RIF1 and anti-β-actin).
- https://cdn.elifesciences.org/articles/75047/elife-75047-fig3-data1-v1.zip
-
Figure 3—source data 2
PDF containing Figure 3A and original scans of the relevant Western blot analysis (anti-RIF1 and anti-β-actin) with highlighted bands and sample labels.
- https://cdn.elifesciences.org/articles/75047/elife-75047-fig3-data2-v1.zip
-
Figure 3—source data 3
Original image of control DNA fibers in Figure 3C.
- https://cdn.elifesciences.org/articles/75047/elife-75047-fig3-data3-v1.zip
-
Figure 3—source data 4
Original image of Brca1mut DNA fibers in Figure 3C.
- https://cdn.elifesciences.org/articles/75047/elife-75047-fig3-data4-v1.zip
-
Figure 3—source data 5
Original image of Rif1-/- DNA fibers in Figure 3C.
- https://cdn.elifesciences.org/articles/75047/elife-75047-fig3-data5-v1.zip
-
Figure 3—source data 6
Original image of Rif1S→A DNA fibers in Figure 3C.
- https://cdn.elifesciences.org/articles/75047/elife-75047-fig3-data6-v1.zip
Figure 3—figure supplement 1

Generation of RIF1-mutant CH12 cell lines on a WT background.
(A) Genomic scar of two selected Rif1-/- clonal derivatives (Rif1-/-–1 and Rif1-/-–2). The expected consequences at the protein level are indicated for each scar. The gRNAs employed to generate each cell line are highlighted in shades of blue with the PAM sequence in red. Ref: reference sequence; Indel: insertion and/or deletion; fs: amino acid frameshift; PTC: premature termination codon. (B) Western blot analysis of whole-cell extracts from controls and two different Rif1 knockout cell lines (Rif1-/-–1 and Rif1-/-–2). Controls: WT parental CH12 culture (P) and clonal cell lines derived from targeting CH12 cells with gRNAs against random (R) sequences not present in the mouse genome (validated Random clones on the WT background, R1, R2, and R3). (C) Characterization of selected Rif1S→A CH12 cell lines by diagnostic digestion, which followed the same scheme as for Brca1mut Rif1S→A clonal derivatives in Figure 2—figure supplement 2G and H. (D) Top: representative flow cytometry plots measuring class switch recombination (CSR) to IgA in activated cell lines of the indicated genotype (Rif1S→A-1, Rif1S→A-2, and Rif1S→A-3 are independent clonal derivatives). Bottom: summary graph for four independent experiments. (E) Western blot analysis of whole-cell extracts from cells lines of the indicated genotypes. The asterisk symbol denotes an aspecific band that was included as an additional internal loading control. The analysis is representative of two independently performed experiments. IR: ionizing radiation. (F) Top: schematic representation of the strategy employed for the initial assessment of targeting results of the single serine-glutamine (SQ) RIF1 CH12 mutant cell lines. Location of primers (F, forward; R, reverse) and expected PCR digestion products is indicated in dark red. KI: knock-in. Bottom: characterization of selected clonal derivatives by diagnostic digestion. White lines separate noncontiguous portions of the same agarose gel and exposure. (G) Western blot analysis of whole-cell extracts from independent cells lines of the indicated genotypes. White lines separate noncontiguous portions of the same SDS-PAGE gel and film exposure.
-
Figure 3—figure supplement 1—source data 1
Original file for the Western blot analysis in Figure 3—figure supplement 1B (anti-RIF1 and anti-β-actin).
- https://cdn.elifesciences.org/articles/75047/elife-75047-fig3-figsupp1-data1-v1.zip
-
Figure 3—figure supplement 1—source data 2
PDF containing Figure 3—figure supplement 1B and original scans of the relevant Western blot analysis (anti-RIF1 and anti-β-actin) with highlighted bands and sample labels.
- https://cdn.elifesciences.org/articles/75047/elife-75047-fig3-figsupp1-data2-v1.zip
-
Figure 3—figure supplement 1—source data 3
Original file for the diagnostic digestion of Ctrl samples in Figure 3—figure supplement 1C.
- https://cdn.elifesciences.org/articles/75047/elife-75047-fig3-figsupp1-data3-v1.zip
-
Figure 3—figure supplement 1—source data 4
Original file for the diagnostic digestion of Rif1S→A in Figure 3—figure supplement 1C.
- https://cdn.elifesciences.org/articles/75047/elife-75047-fig3-figsupp1-data4-v1.zip
-
Figure 3—figure supplement 1—source data 5
PDF containing Figure 3—figure supplement 1C and original images of the relevant diagnostic digestion with highlighted bands and sample labels.
- https://cdn.elifesciences.org/articles/75047/elife-75047-fig3-figsupp1-data5-v1.zip
-
Figure 3—figure supplement 1—source data 6
Original file for the Western blot analysis in Figure 3—figure supplement 1E (anti-pRPA and loading control).
- https://cdn.elifesciences.org/articles/75047/elife-75047-fig3-figsupp1-data6-v1.zip
-
Figure 3—figure supplement 1—source data 7
Original file for the Western blot analysis in Figure 3—figure supplement 1E (anti-RPA).
- https://cdn.elifesciences.org/articles/75047/elife-75047-fig3-figsupp1-data7-v1.zip
-
Figure 3—figure supplement 1—source data 8
PDF containing Figure 3—figure supplement 1E and original scans of the relevant Western blot analysis (anti-pRPA and anti-RPA) with highlighted bands and sample labels.
- https://cdn.elifesciences.org/articles/75047/elife-75047-fig3-figsupp1-data8-v1.zip
-
Figure 3—figure supplement 1—source data 9
Original file for the diagnostic digestion of Rif1S1387A clonal cell lines in Figure 3—figure supplement 1F.
- https://cdn.elifesciences.org/articles/75047/elife-75047-fig3-figsupp1-data9-v1.zip
-
Figure 3—figure supplement 1—source data 10
Original file for the diagnostic digestion of Rif1S1416A clonal cell lines in Figure 3—figure supplement 1F.
- https://cdn.elifesciences.org/articles/75047/elife-75047-fig3-figsupp1-data10-v1.zip
-
Figure 3—figure supplement 1—source data 11
Original file for the diagnostic digestion of Rif1S1528A clonal cell lines in Figure 3—figure supplement 1F.
- https://cdn.elifesciences.org/articles/75047/elife-75047-fig3-figsupp1-data11-v1.zip
-
Figure 3—figure supplement 1—source data 12
PDF containing Figure 3—figure supplement 1F and original images of the relevant diagnostic digestion with highlighted bands and sample labels.
- https://cdn.elifesciences.org/articles/75047/elife-75047-fig3-figsupp1-data12-v1.zip
-
Figure 3—figure supplement 1—source data 13
Original file for the Western blot analysis of Rif1S1387A clonal cell lines in Figure 3—figure supplement 1G (anti-RIF1 and anti-β-actin).
- https://cdn.elifesciences.org/articles/75047/elife-75047-fig3-figsupp1-data13-v1.zip
-
Figure 3—figure supplement 1—source data 14
Original file for the Western blot analysis of Rif1S1416A clonal cell lines in Figure 3—figure supplement 1G (anti-RIF1 and anti-β-actin).
- https://cdn.elifesciences.org/articles/75047/elife-75047-fig3-figsupp1-data14-v1.zip
-
Figure 3—figure supplement 1—source data 15
Original file for the Western blot analysis of Rif1S1528A-1 clonal cell line in Figure 3—figure supplement 1G (anti-RIF1 and anti-β-actin).
- https://cdn.elifesciences.org/articles/75047/elife-75047-fig3-figsupp1-data15-v1.zip
-
Figure 3—figure supplement 1—source data 16
Original file for the Western blot analysis of Rif1S1528A-2 clonal cell line in Figure 3—figure supplement 1G (anti-RIF1).
- https://cdn.elifesciences.org/articles/75047/elife-75047-fig3-figsupp1-data16-v1.zip
-
Figure 3—figure supplement 1—source data 17
Original file for the Western blot analysis of Rif1S1528A-2 clonal cell line in Figure 3—figure supplement 1G (anti-β-actin).
- https://cdn.elifesciences.org/articles/75047/elife-75047-fig3-figsupp1-data17-v1.zip
-
Figure 3—figure supplement 1—source data 18
PDF containing Figure 3—figure supplement 1G and original scans of the relevant Western blot analysis (anti-RIF1 and anti-β-actin) with highlighted bands and sample labels.
- https://cdn.elifesciences.org/articles/75047/elife-75047-fig3-figsupp1-data18-v1.zip
Figure 4
Phosphorylation of the IDR-CII serine-glutamine (SQ) cluster promotes hydroxyurea (HU)-induced recruitment of RIF1 to replication forks.
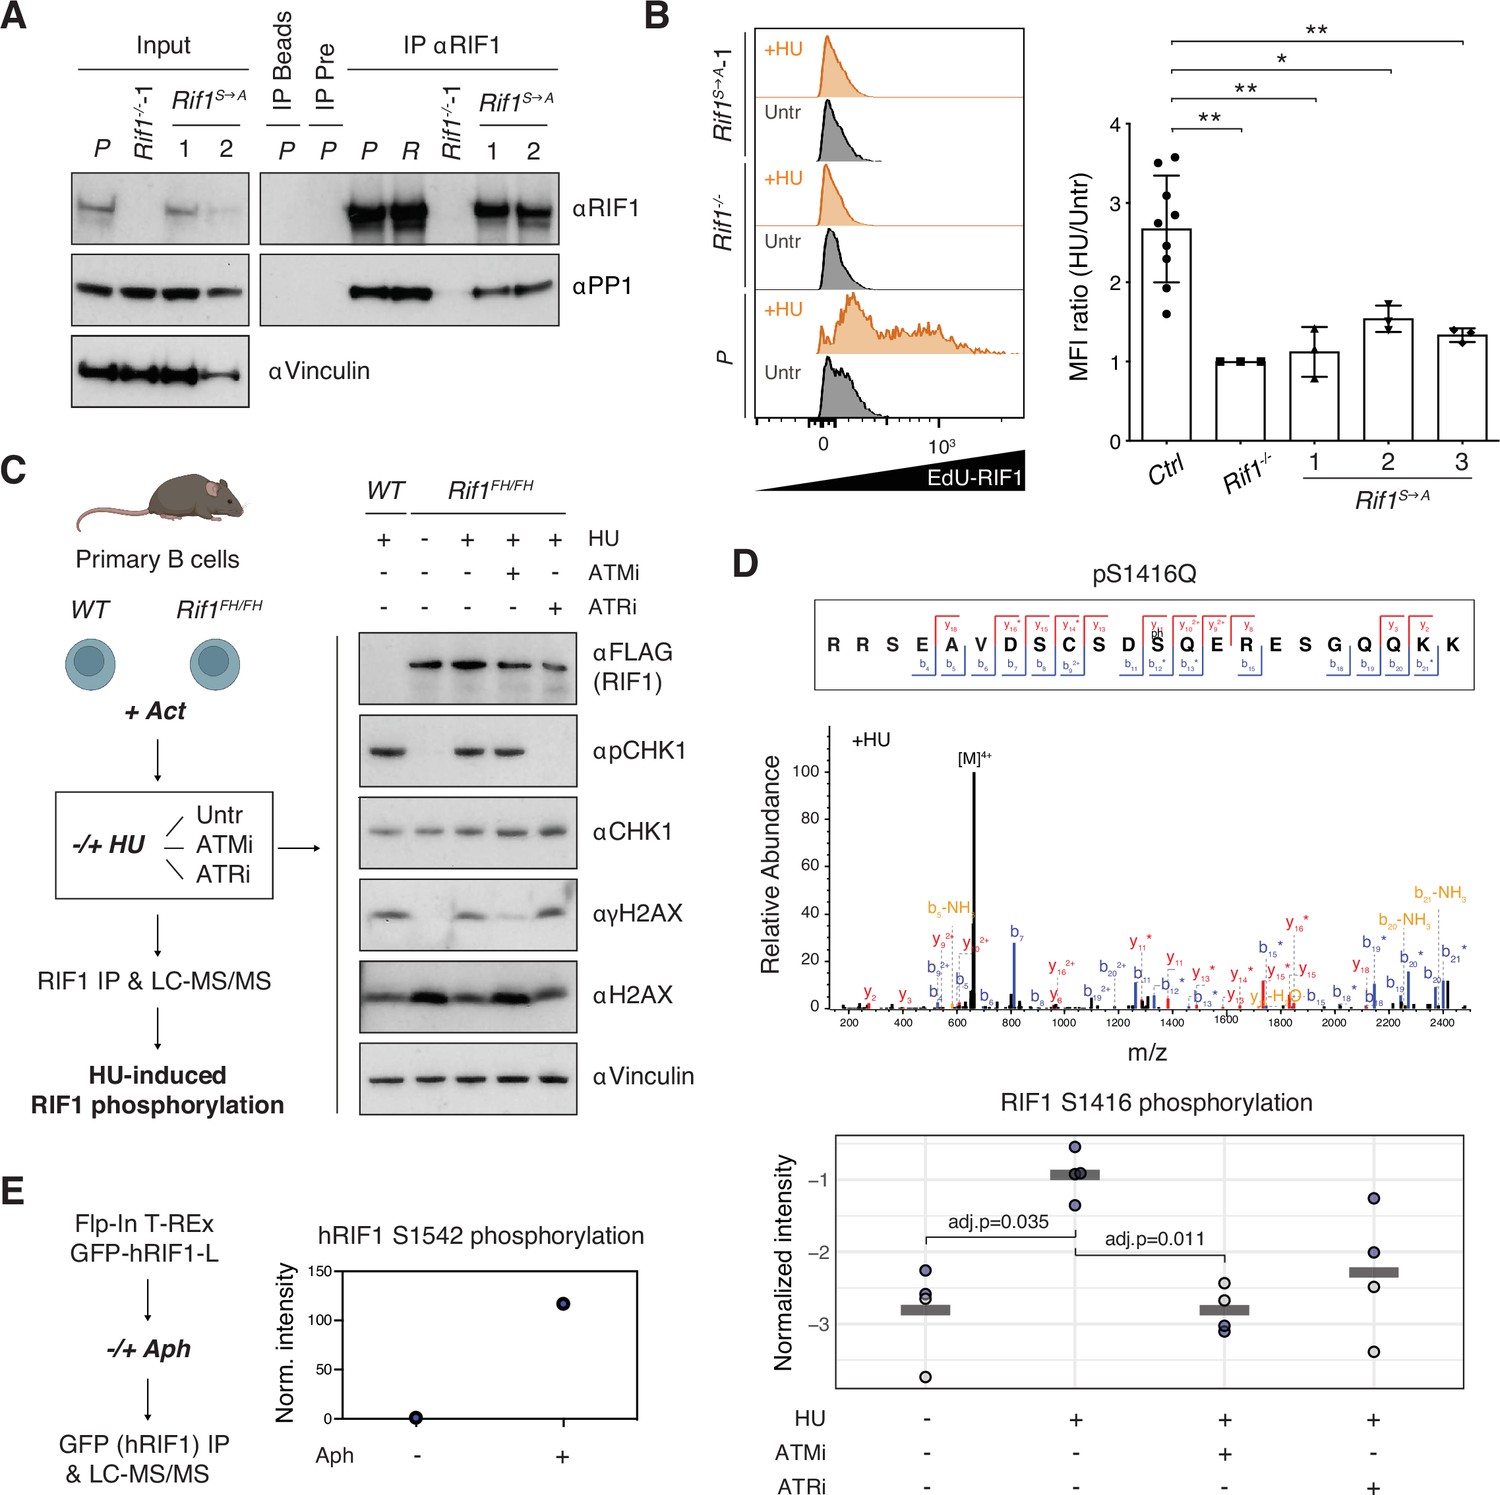
(A) Western blot analysis of anti-RIF1 immunoprecipitates (IP) from cell lines of the indicated genotypes (WT parental CH12 cells [P], a validated Random clone [R], Rif1-/-, and two different Rif1S→A clonal derivatives). The analysis is representative of two independently performed experiments. Pre: pre-immune serum control for αRIF1 IP. (B) Left: representative histograms displaying EdU-RIF1 proximity signal in untreated (Untr) and HU-treated (+HU) samples of the indicated genotypes. Right: summary graph showing quantification of the proximity signal data for three independent experiments. For each sample, values were expressed as fold mean fluorescent intensity (MFI) of HU-treated over untreated conditions, and normalized within each experiment to Rif1-/-, which was set to 1. Samples include parental CH12 cells and two validated Random clones as positive (Ctrl), and Rif1-/- cells as negative, experimental controls, and three different Rif1S→A clonal derivatives. (C) Left: schematic representation of the strategy for the identification of HU-induced RIF1 phosphosites in primary B cells. Act: activation; Untr: untreated (no ATMi/ATRi); LC-MS/MS: liquid chromatography-tandem mass spectrometry. Right: representative Western blot analysis of whole-cell extracts employed for the RIF1 pull-downs. The analysis is representative of the four mice pairs (WT and Rif1FH/FH) included in the mass spec experiment. (D) Top: representative annotated MS/MS spectra of a RIF1 peptide encompassing phosphorylated S1416 residue from one HU-treated Rif1FH/FH sample. Bottom: graph summarizing S1416 phosphosite intensities in the different conditions shown in panel (C). Values were normalized to bait protein (RIF1) levels for each sample followed by replicate-wise median normalization. The horizontal line indicates the mean of the four data points. Adjusted p-values shown were calculated using a Benjamini–Hochberg correction after a global two-sample moderated t-test. Values for t-test were imputed using a Gaussian distribution with downshift by column after filtering for at least 60% valid values per row across all samples (without WT). Original values are shown in blue, imputed values in gray. (E) Left: schematic representation of the strategy for the identification of aphidicolin-induced hRIF1 phosphosites. GFP-hRIF1-L: human RIF1 long isoform fused to GFP; Aph: aphidicolin. Right: hRIF1 S1542 phosphosite intensity values were normalized to bait protein (hRIF1) levels and shown as fold increase of Aph- versus DMSO-treated sample, which was set to 1. Norm: normalized. Significance in panel (B) was calculated with the Mann–Whitney U-test, and error bars represent SD. *p≤0.05; **p≤0.01.
-
Figure 4—source data 1
Original file for the Western blot analysis of input and immunoprecipitate (IP) in Figure 4A (anti-RIF1).
- https://cdn.elifesciences.org/articles/75047/elife-75047-fig4-data1-v1.zip
-
Figure 4—source data 2
Original file for the Western blot analysis of input in Figure 4A (anti-PP1).
- https://cdn.elifesciences.org/articles/75047/elife-75047-fig4-data2-v1.zip
-
Figure 4—source data 3
Original file for the western blot analysis of IP in Figure 4A (anti-PP1).
- https://cdn.elifesciences.org/articles/75047/elife-75047-fig4-data3-v1.zip
-
Figure 4—source data 4
Original file for the Western blot analysis of input in Figure 4A (anti-vinculin).
- https://cdn.elifesciences.org/articles/75047/elife-75047-fig4-data4-v1.zip
-
Figure 4—source data 5
PDF containing Figure 4A and original scans of the relevant Western blot analysis (anti-RIF1, anti-PP1, and anti-vinculin) with highlighted bands and sample labels.
- https://cdn.elifesciences.org/articles/75047/elife-75047-fig4-data5-v1.zip
-
Figure 4—source data 6
Original file for the Western blot analysis in Figure 4C (anti-FLAG).
- https://cdn.elifesciences.org/articles/75047/elife-75047-fig4-data6-v1.zip
-
Figure 4—source data 7
Original file for the Western blot analysis in Figure 4C (anti-pCHK1).
- https://cdn.elifesciences.org/articles/75047/elife-75047-fig4-data7-v1.zip
-
Figure 4—source data 8
Original file for the western blot analysis in Figure 4C (anti-CHK1 and anti-H2AX).
- https://cdn.elifesciences.org/articles/75047/elife-75047-fig4-data8-v1.zip
-
Figure 4—source data 9
Original file for the Western blot analysis in Figure 4C (anti-vinculin and anti-γH2AX).
- https://cdn.elifesciences.org/articles/75047/elife-75047-fig4-data9-v1.zip
-
Figure 4—source data 10
PDF containing Figure 4C and original scans of the relevant Western blot analysis (anti-FLAG, anti-pCHK1, anti-CHK1, anti-H2AX, anti-vinculin, and anti-γH2AX) with highlighted bands and sample labels.
- https://cdn.elifesciences.org/articles/75047/elife-75047-fig4-data10-v1.zip
Tables
Table 1
List of oligonucleotides used in this study.
| CRISPR-Cas9 gene targeting for clonal derivative generation | gRNAs | Sequence (5′→3′) | References |
| gRandom-1a | GCGAGGTATTCGGCTCCGCG | Delgado-Benito et al., 2018 | |
| gRandom-1b | ATGTTGCAGTTCGGCTCGAT | Delgado-Benito et al., 2018 | |
| gBrca1-N1a | GAGCTACCACCGATGTTCCT | This paper | |
| gBrca1-N1b | TCTCAGGGCACAGACTTTGC | This paper | |
| gBrca1-N2a | GCGTTCAGAAAGTTAATGAG | This paper | |
| gBrca1-N2b | TGTTATCCAAGGAACATCGG | This paper | |
| gRif1-N1a | GAAGACCCCTCGGTGCCTCC | Delgado-Benito et al., 2018 | |
| gRif1-N1b | AAGTCTCCAGAAGCGGCTCC | Delgado-Benito et al., 2018 | |
| gRif1-N2a | TGTGTGTACCAGGGCACTGT | This paper | |
| gRif1-N2b | ACTCTTAATGATACCATTCA | This paper | |
| gRNA-5′ | AAACACTCCGACGGTCTTCG | This paper | |
| gRNA-3′ | CGACTTGTCTAGATTGTCCA | This paper | |
| CRISPR-Cas9 gene targeting in in-bulk cultures | gRNAs | ||
| gRandom-1a (as above) | GCGAGGTATTCGGCTCCGCG | Delgado-Benito et al., 2018 | |
| gRandom-1b (as above) | ATGTTGCAGTTCGGCTCGAT | Delgado-Benito et al., 2018 | |
| gRandom-1c | GCTTTCACGGAGGTTCGACG | This paper | |
| g53bp1-1 | CAGATGTTTATTATGTGGAT | Delgado-Benito et al., 2018 | |
| g53bp1-2 | GAGTGTACGGACTTCTCGAA | Delgado-Benito et al., 2018 | |
| gRif1- N2a (as above) | TGTGTGTACCAGGGCACTGT | This paper | |
| gRif1- N2b (as above) | ACTCTTAATGATACCATTCA | This paper | |
| gRev7-1 | CCTGATTCTCTATGTGCGCG | This paper | |
| gRev7-2 | GTGCGCGAGGTCTACCCGGT | This paper | |
| gRev7-3 | CTATGTGCGCGAGGTCTACC | This paper | |
| Site-directed mutagenesis of knock-in template | PCR primers | ||
| A1387 → S1387 | |||
| Primer 1 | CAAATAGTAAATGAAGATAGTCAGGCTGCTGCGCTAGCCCC | This paper | |
| Primer 2 | GGGGCTAGGGCAGCAGCCTGACTATCTTCATTTACTATTTG | This paper | |
| A1416 → S1416 | |||
| Primer 1 | GATTCTTGCAGTGACAGCCAAGAGAGAGAGAGTGGTCAGC | This paper | |
| Primer 2 | GCTGACCACTCTCTCTCTCTTGGCTGTCACTGCAAGAATC | This paper | |
| A1528 → S1528 | |||
| Primer 1 | CGTTATCAAACAAGAAGAGCTTCGCAGGGTTTGATTTCTGC | This paper | |
| Primer 2 | GCAGAAATCAAACCCTGCGAAGCTCTTCTTGTTTGATAACG | This paper | |
| Analysis of genomic scars and knock-ins | PCR primers | ||
| Brca1 – Nickase 1 and 2 clones | |||
| Fw | AAATGTGTGTGTGGAGCCATG | This paper | |
| Rev | CTTCTCCAAACCAGTAGAGG | This paper | |
| Rif1 – Nickase 1 clones | |||
| Fw | GAGTAAATAAGCGCGAGCCG | Delgado-Benito et al., 2018 | |
| Rev | CGATCCGGAGTTAGTGGGTT | Delgado-Benito et al., 2018 | |
| Rif1 – Nickase 2 clones | |||
| Fw | TTCCTTCCCTCAGTAGAG | This paper | |
| Rev | GCAACAGGGCTGGCATTT | This paper | |
| Rif1S→A – Rif1 locus | |||
| Fw | GCGGTGCTTGAACTTCAGGG | This paper | |
| Rev | GCTGCGTGCTCAGTCTCAAC | This paper | |
| Rif1S→A – HR donor | |||
| Fw | TGTGGTGGCTCTGTTGCTGA | This paper | |
| Rev | GCATGGTCACGAGCTTCACG | This paper | |
| Rif1S1387A, Rif1S1416A, and Rif1S1528A – Rif1 locus | |||
| Fw | ACTCTGAACCATACACTAGCAG | This paper | |
| Rev | TTGGGTGGAGCTTGCAGTGA | This paper | |
-
Fw: forward; Rev: reverse.
Appendix 1—key resources table
| Reagent type (species) or resource | Designation | Source or reference | Identifiers | Additional information |
|---|---|---|---|---|
| Genetic reagent(Mus musculus) | Rif1FH/FH and Rif1F/FCd19Cre/+ mice | Cornacchia et al., 2012; Di Virgilio et al., 2013 | ||
| Biological sample (M. musculus) | Primary mouse embryonic fibroblasts | This paper | Isolated from WT and Rif1FH/FH mice | |
| Biological sample (M. musculus) | Primary splenocytes | This paper | Isolated from WT, Rif1FH/FH and Rif1F/FCd19Cre/+ mice | |
| Gene (M. musculus) | RIF1 | UniProt | Q6PR54-1 | |
| Strain, strain background(Escherichia coli) | Stbl3 (HB101) | Thermo Fisher | C737303 | Chemically competent cells |
| Cell line (M. musculus) | CH12 | Nakamura et al., 1996 | ||
| Cell line (M. musculus) | Brca1mut CH12 | This paper | See Figure 2—figure supplement 1 and Materials and methods | |
| Cell line (M. musculus) | Brca1mutRif1-/- CH12 | This paper | See Figure 2—figure supplement 2 and Materials and methods | |
| Cell line (M. musculus) | Brca1mut Rif1S→A CH12 | This paper | See Figure 2—figure supplement 2 and Materials and methods | |
| Cell line (M. musculus) | Rif1S→A CH12 | This paper | See Figure 2—figure supplement 2, Figure 3—figure supplement 1, and Materials and methods | |
| Cell line (M. musculus) | Rif1S1387A CH12 | This paper | See Figure 3—figure supplement 1 and Materials and methods | |
| Cell line (M. musculus) | Rif1S1416A CH12 | This paper | See Figure 3—figure supplement 1 and Materials and methods | |
| Cell line (M. musculus) | Rif1S1528A CH12 | This paper | See Figure 3—figure supplement 1 and Materials and methods | |
| Transfected construct (M. musculus) | pMA-Rif1S→A(pMA is a GeneArtCloning Vector from Life Technologies) | This paper | HR donor plasmid for introducing Ser→Ala mutations at S1387, S1416, and S1528 of mouse RIF1 | |
| Transfected construct (M. musculus) | pMA-Rif1S1387A | This paper | HR donor for introducing Ser→Ala mutations at S1387 of mouse RIF1 | |
| Transfected construct (M. musculus) | pMA-Rif1S1416A | This paper | HR donor for introducing Ser→Ala mutations at S1416 of mouse RIF1 | |
| Transfected construct (M. musculus) | pMA-Rif1S1528A | This paper | HR donor for introducingSer→Ala mutations at S1528 of mouse RIF1 | |
| Chemical compound, drug | αCD40 | BioLegend | 102902 | |
| Chemical compound, drug | IL-4 | Sigma-Aldrich | I1020-5UG | |
| Chemical compound, drug | TGFβ | R&D Systems | 7666MB-005/CF | |
| Chemical compound, drug | Olaparib (PARPi) | Selleckchem.com | S1060 SEL- S1060-10MM | |
| Chemical compound, drug | Idoxuridine (IdU) | Sigma-Aldrich | I0050000 | |
| Chemical compound, drug | 5-Chloro-2′-deoxyuridine thymidine (CldU) | Abcam | ab213715 | |
| Chemical compound, drug | Hydroxyurea (HU) | Sigma-Aldrich | H8627-5G | |
| Chemical compound, drug | 5-Ethynyl-2′-deoxyuridine (EdU) | Merck | 900584–50MG | |
| Chemical compound, drug | Dynabeads Protein A | Thermo Fisher | 10001D | |
| Antibody | FLAG-M2(mouse monoclonal) | Sigma-Aldrich | F3165 | WB (1:1000) |
| Antibody | FLAG-M2 peroxidase (HRP) (mouse monoclonal) | Sigma-Aldrich | A8592-.2MG | WB (1:1000) |
| Antibody | RIF1(rabbit polyclonal) | Di Virgilio et al., 2013 | WB (1:2500)PLA (1:1000) | |
| Antibody | PP1(rabbit polyclonal) | Abcam | ab137512 | WB (1:1000) |
| Antibody | Vinculin(mouse monoclonal) | Sigma-Aldrich | V9131 | WB (1:10,000) |
| Antibody | β-Actin(mouse monoclonal) | Sigma-Aldrich | A5441 | WB (1:10,000) |
| Antibody | Tubulin(rabbit polyclonal) | Abcam | ab4074 | WB (1:10,000) |
| Antibody | RPA32(mouse monoclonal) | Millipore | NA19L | WB (1:1000) |
| Antibody | pRPA32 (S4/S8)(rabbit polyclonal) | Bethyl Laboratories | A300-245A-M | WB (1:1000) |
| Antibody | pCHK1 (S345)(rabbit monoclonal) | Cell Signaling | 2348S | WB (1:1000) |
| Antibody | CHK1(mouse monoclonal) | Cell Signaling | 2360S | WB (1:1000) |
| Antibody | Phospho-Histone H2A.X (S139)(mouse monoclonal) | Millipore | 05-636 | WB (1:1000) |
| Antibody | H2AX(rabbit polyclonal) | Novus Biologicals | NB100-383 | WB (1:1000) |
| Antibody | HRP-goat anti-rabbit heavy chain(goat polyclonal) | Jackson ImmunoResearch | 111-035-008 | WB (1:10,000) |
| Antibody | HRP-goat anti-mouse heavy chain(goat polyclonal) | Jackson ImmunoResearch | 115-035-008 | WB (1:10,000) |
| Antibody | HRP-mouse anti-rabbit light chain(mouse monoclonal) | Jackson ImmunoResearch | 211-032-171 | WB (1:10,000) |
| Peptide, recombinant protein | Biotin-azide | Thermo Fisher | B10184 | 25 µM |
| Commercial assay or kit | Click-iT Cell Reaction Buffer Kit | Thermo Fisher | C10269 | 500 µl |
| Commercial assay or kit | Duolink flowPLA Mouse/Rabbit Starter Kit - Far Red | Sigma-Aldrich/Duolink | DUO94104 | |
| Software | MacVector | https://macvector.com/ | RRID:SCR_015700 | |
| Software | FlowJo | https://www.flowjo.com/ | RRID:SCR_008520 | |
| Software | ImageJ | https://imagej.nih.gov/ij/ | RRID:SCR_003070 | |
| Software | GPM software | Beavis, 2006 |
Additional files
Download links
A two-part list of links to download the article, or parts of the article, in various formats.
Downloads (link to download the article as PDF)
Open citations (links to open the citations from this article in various online reference manager services)
Cite this article (links to download the citations from this article in formats compatible with various reference manager tools)
Protection of nascent DNA at stalled replication forks is mediated by phosphorylation of RIF1 intrinsically disordered region
eLife 11:e75047.
https://doi.org/10.7554/eLife.75047


