Mechanisms governing target search and binding dynamics of hypoxia-inducible factors
- Department of Molecular and Cell Biology, University of California, Berkeley, United States
- Howard Hughes Medical Institute, University of California, Berkeley, United States
- Li Ka Shing Center for Biomedical & Health Sciences, University of California, Berkeley, United States
Figures
Figure 1 with 3 supplements
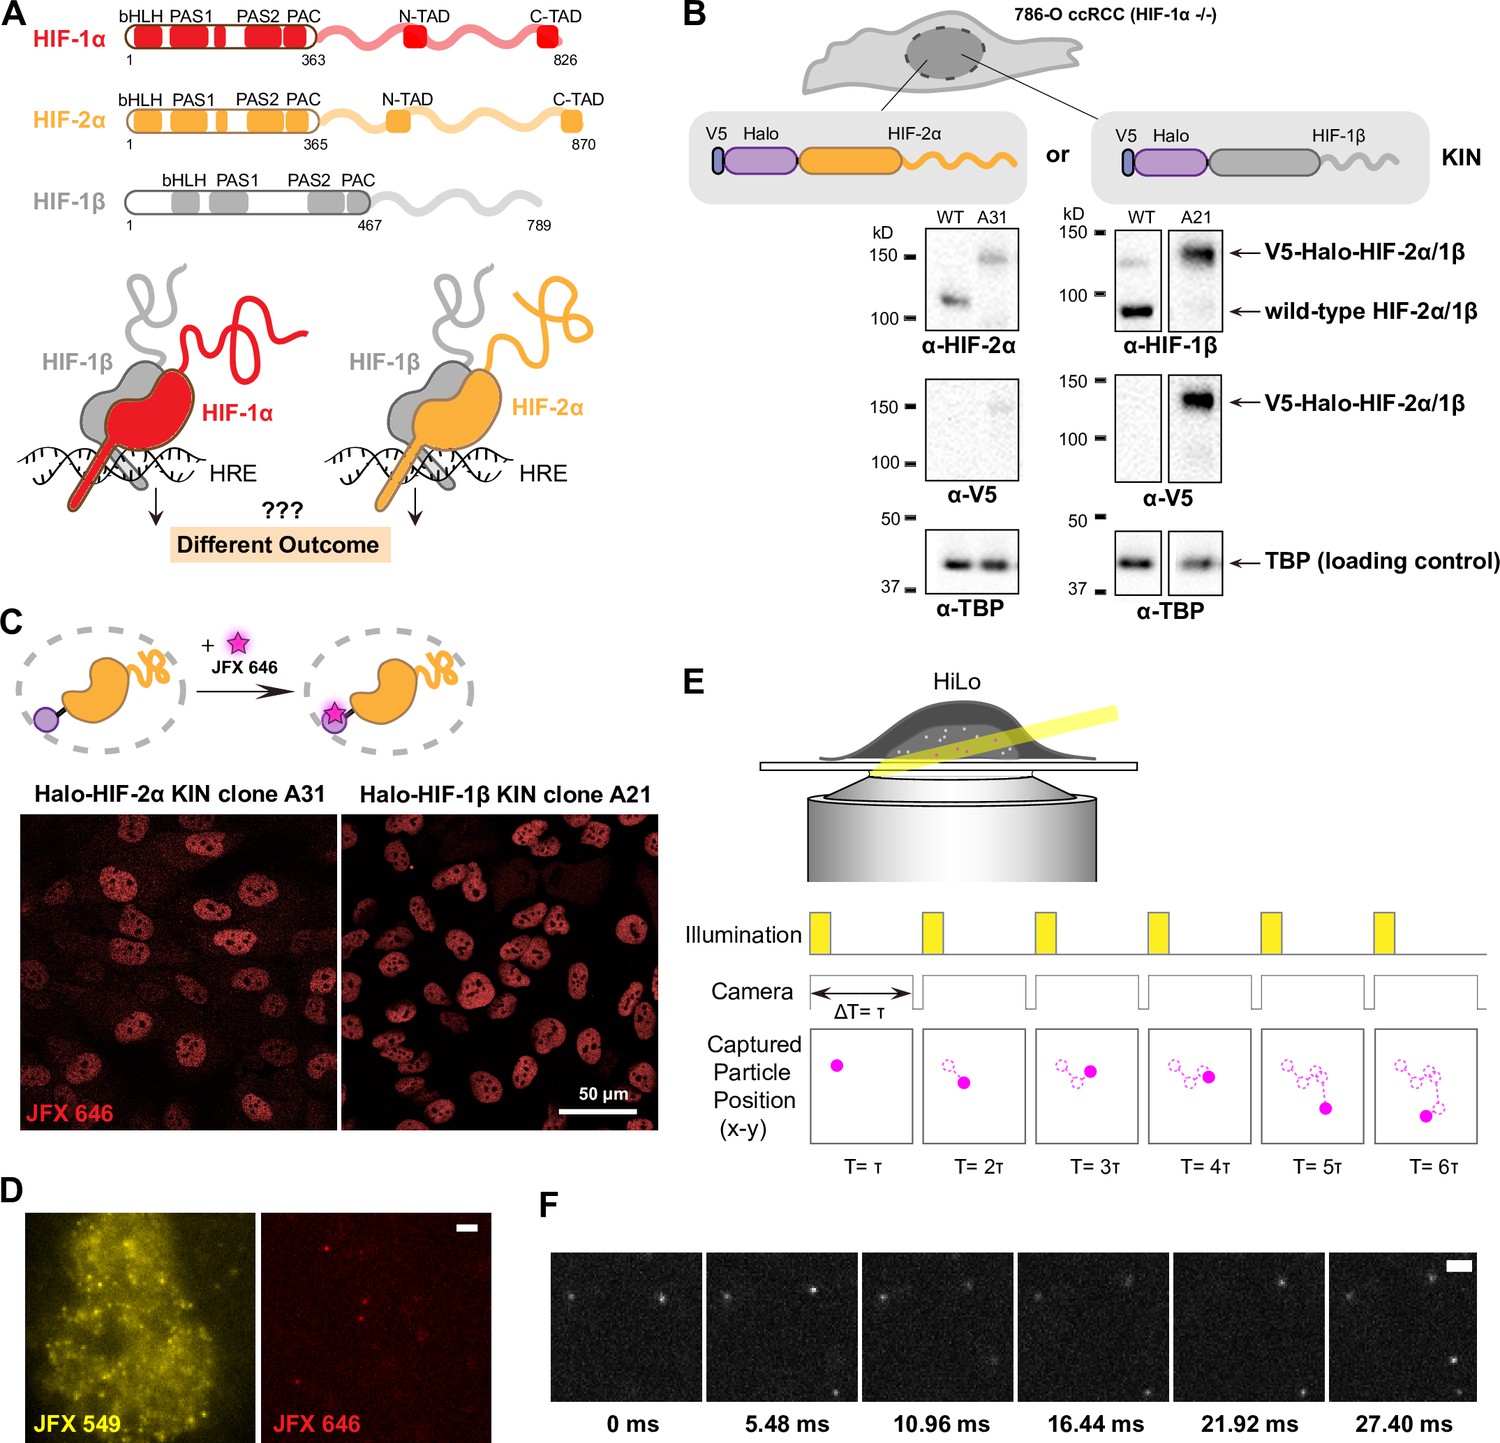
Endogenous tagging of hypoxia-inducible factors (HIFs) in 786-O clear cell renal cell carcinoma (ccRCC) cells for fast single particle tracking (fSPT).
(A) Schematic showing the similar domain organizations of HIFs (top) and the HRE-bound HIF α/β dimers (bottom). Disordered regions are represented as wavy lines. (B) Generation of Halo KIN clones in the HIF-1α negative 786-O ccRCC line. Top: Halo-tagging scheme of HIF-2α (left) and HIF-1β (right). Bottom: Western blot of wild-type (WT) 786-O cells and homozygously tagged knock-in clones (A31 and A21). Panels derive from the same blots shown in full in Figure 1—figure supplement 2. See Figure 1—source data 1 for images of the raw blots. (C) Halo-tagged HIF-2α and HIF-1β show predominant nuclear localization. Top: Schematic of labeling Halo-tagged proteins in live cells with cell-permeable Halo-binding JFX646 dye. Bottom: Representative images of Halo-HIF-2α (left) and Halo-HIF-1β (right) clones labeled with 500 nM JFX646 (D) representative images showing the same cell labeled with a high concentration of JFX549 dye for localizing the nucleus in one channel (left) and labeled sparsely with JFX646 dye for tracking individual molecules in another channel (right). Scale bar = 2 μm. (E) Graphical illustration of fSPT capturing trajectories of moving particles. Top: Highly inclined and laminated optical sheet illumination (HiLo). Bottom: Illumination and camera sequence with corresponding particle position at each frame (solid magenta dots). Particle’s past positions (dashed magenta circles) are connected with dotted magenta lines to show the particle’s trajectory. (F) Actual data showing detection of Halo-HIF-2α protein molecules at 5.48 ms frame rate. Scale bar = 2 μm.
-
Figure 1—source data 1
Source data for both Figure 1 and Figure 1—figure supplement 2, including six raw images (tif files) for western blots and one figure (pdf) explaining each of the raw images.
- https://cdn.elifesciences.org/articles/75064/elife-75064-fig1-data1-v2.zip
Figure 1—figure supplement 1
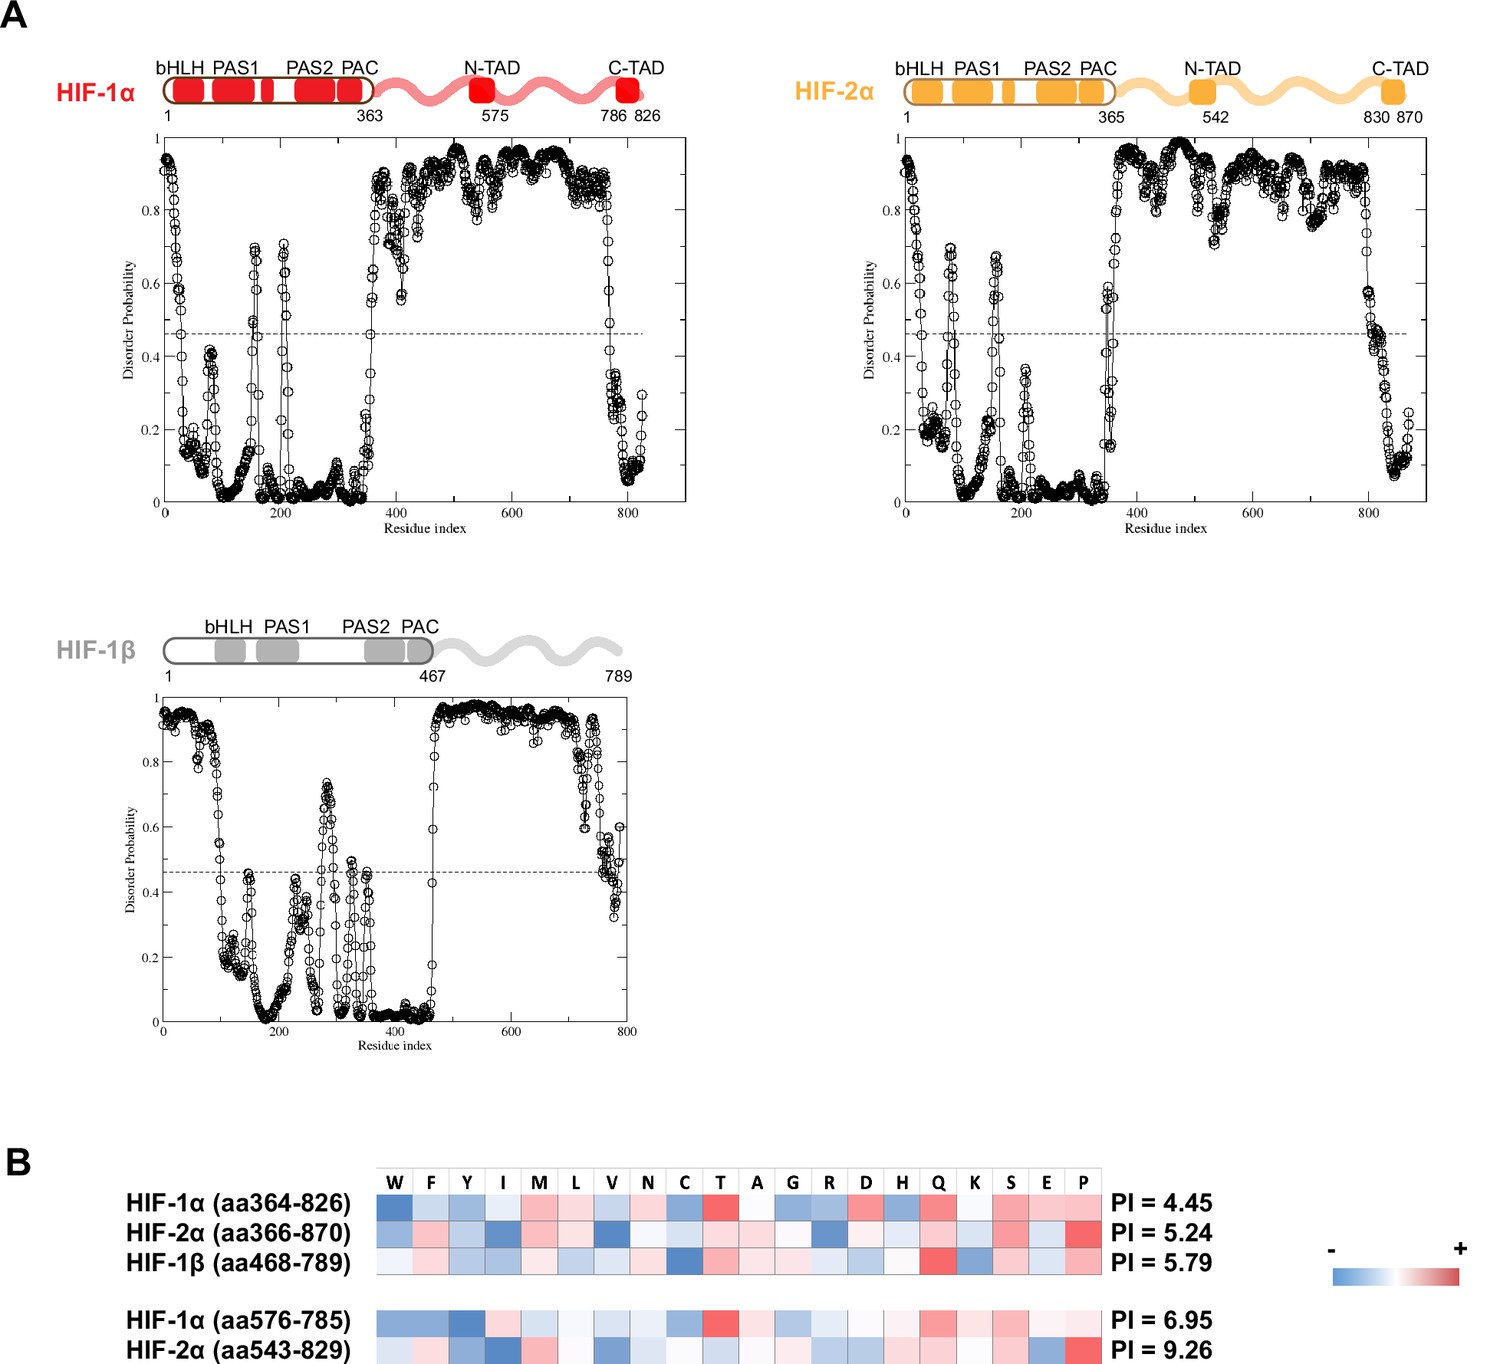
Domain analysis of hypoxia-inducible factors (HIFs).
(A) Disorder propensity of HIF-1α, -2α, and -1β, predicted by SPOT-Disorder (Hanson et al., 2017). High values indicate higher disorder propensity. (B) HIF-1α and HIF-2α intrinsically disordered regions (IDRs) have different amino acid composition biases. The relative enrichment for each amino acid is calculated by comparison with the average amino acid composition of non-membrane proteins in vertebrates (Gaur, 2014), and color coded, with red indicating relative high enrichment and blue indicating relative depletion. The IDR segments between the N-TAD and C-TAD are especially different between HIF-1α and HIF-2α in terms of acidity (bottom).
Figure 1—figure supplement 2
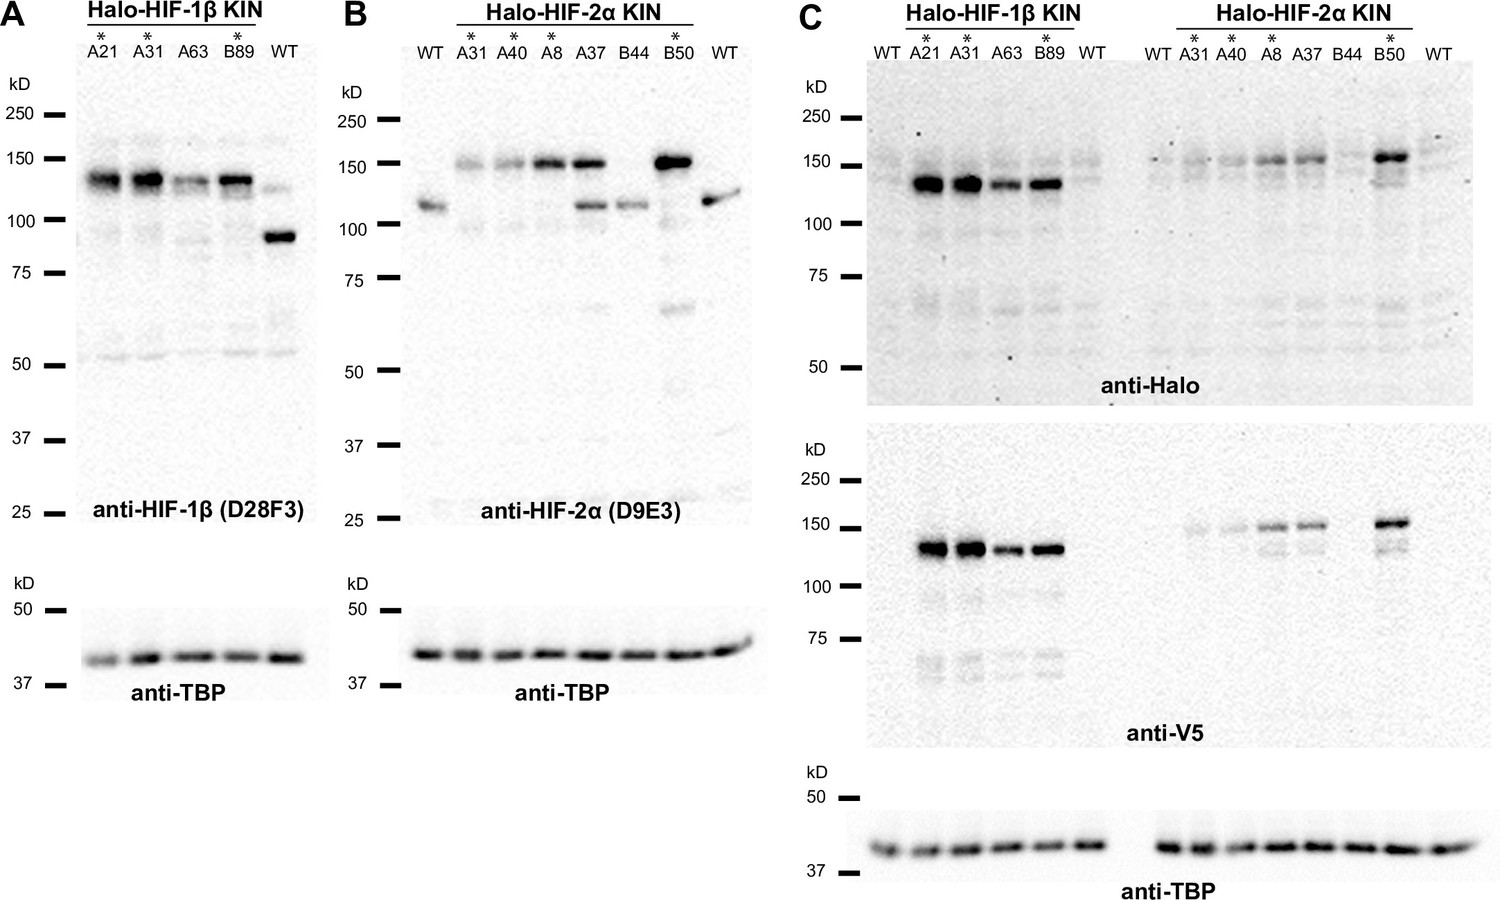
Verification of endogenous tagging of hypoxia-inducible factors (HIFs) in 786-O clear cell renal cell carcinoma (ccRCC) cells.
(A), (B), (C) Uncropped images of western blot of wild-type (WT) 786-O cells and homozygously tagged knock-in (KIN) clones (*). See Figure 1—source data 1 for images of the raw blots. (A) HIF-2α protein is detected in WT and various KIN clones with a rabbit monoclonal antibody against HIF-2α (Cell Signaling, D9E3), membranes were stripped and reblotted for TBP for loading control. (B) HIF-1β protein is detected in WT and various KIN clones with a rabbit monoclonal antibody against HIF-1β (Cell Signaling, D28F3), membranes were stripped and reblotted for TBP for loading control. (C) Various HIF-2α and HIF-1β KIN clones are loaded on the same gel and probed for tagged protein levels using an anti-Halo antibody (top); the membrane was stripped and reblotted for TBP for loading control, then stripped again and reblotted for V5 tag. Halo-HIF-1β is generally expressed at a much higher level than Halo-HIF-2α, as shown by the detected Halo or V5 level.
Figure 1—figure supplement 3
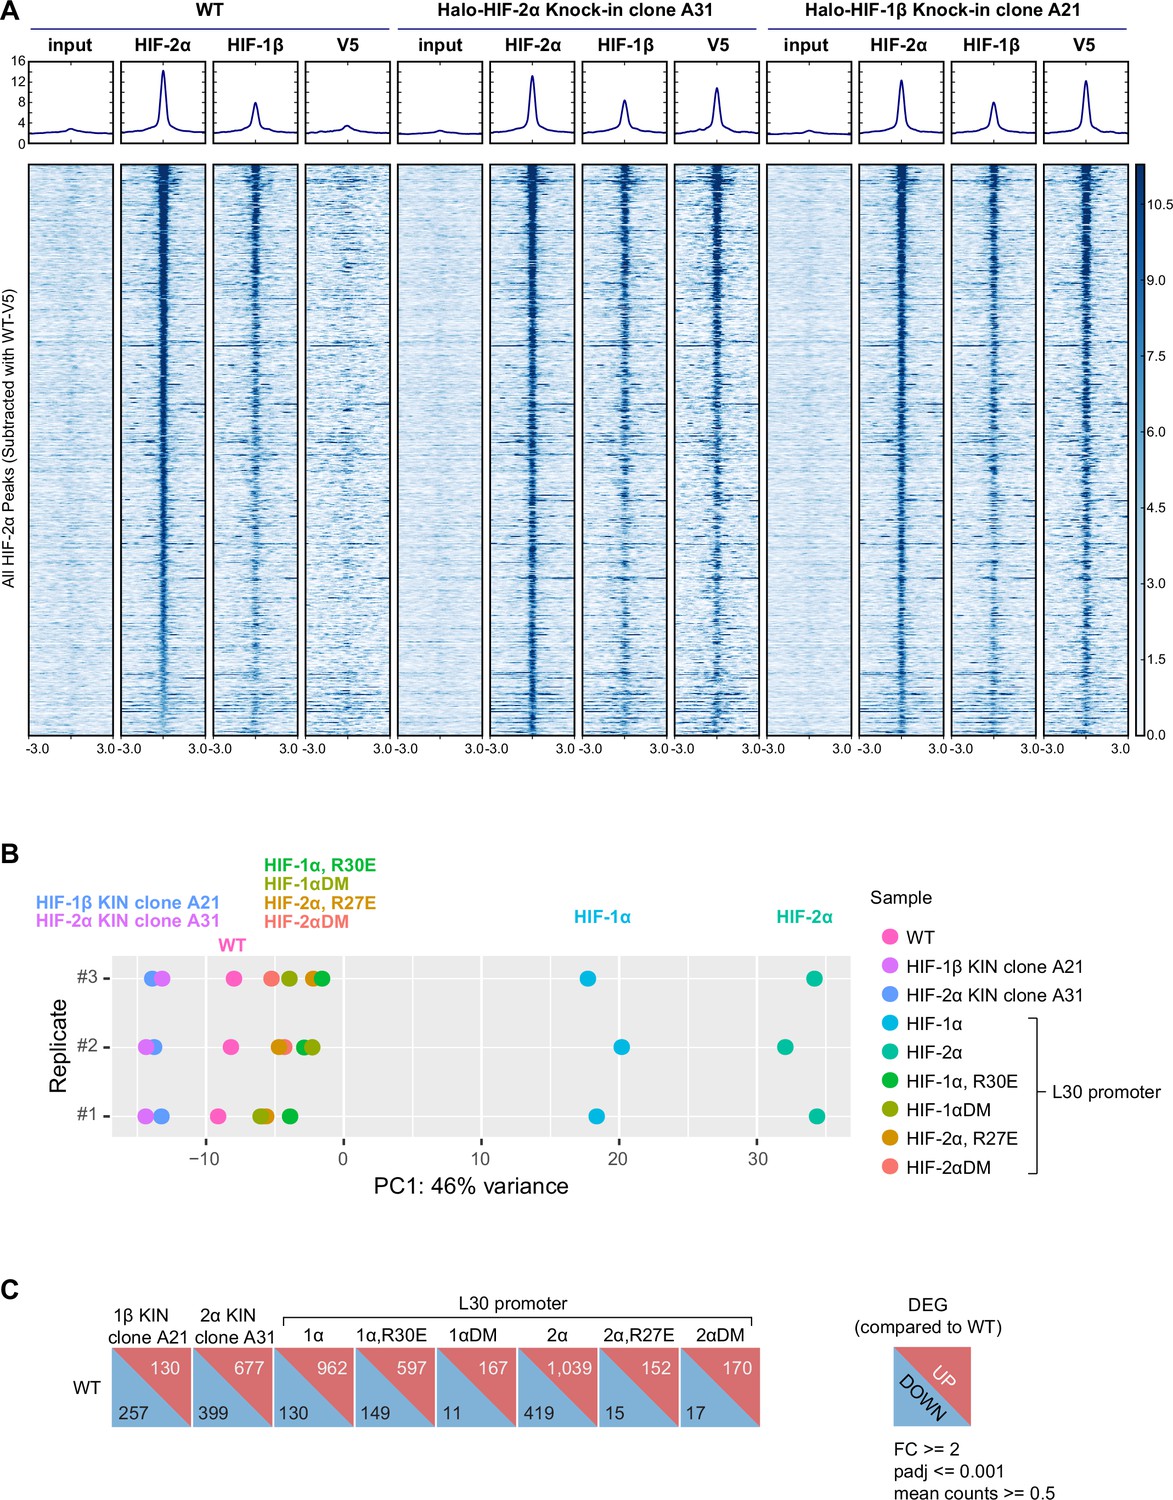
Hypoxia-inducible factor (HIF) genome-wide binding and RNA expression profiles after gene-editing and genetic modification.
(A) Heatmap of the ChIP-seq experiments comparing binding profiles of HIF-2α and HIF-1β in wild-type (WT) or knock-in (KIN) clones. ChIP-seq read counts (reads per genomic content) are plotted at MAC2-called HIF-2α peak regions (across all cell lines and subtracted of V5 peaks called in WT 786-O cells) centered around the peak. (B) Principle component analysis (PCA) on RNA-seq data from WT, Halo-HIF-2α, and Halo-HIF-1β KIN clones, and WT cells overexpressing various HIF-α forms driven by an L30 promoter. Only the first principle component (largest variance) is shown for three biological replicates. Both KIN cells (HIF-1β KIN and HIF-2α KIN) and cells overexpressing inactive HIF-α mutants (HIF-1α R30E, HIF-1αDM, HIF-2α R27E, HIF-2αDM) are close to WT cells. In contrast, cells overexpressing functional HIF-α (HIF-1α and HIF-2α) show farther deviations from WT cells. (C) DESeq2 output summarizing the number of differentially expressed genes (DEG) in KIN cell lines and cells overexpressing various HIF-α forms, compared to WT cells.
Figure 2 with 3 supplements
Fast single particle tracking (fSPT) sensitively detects molecules in a range of states.
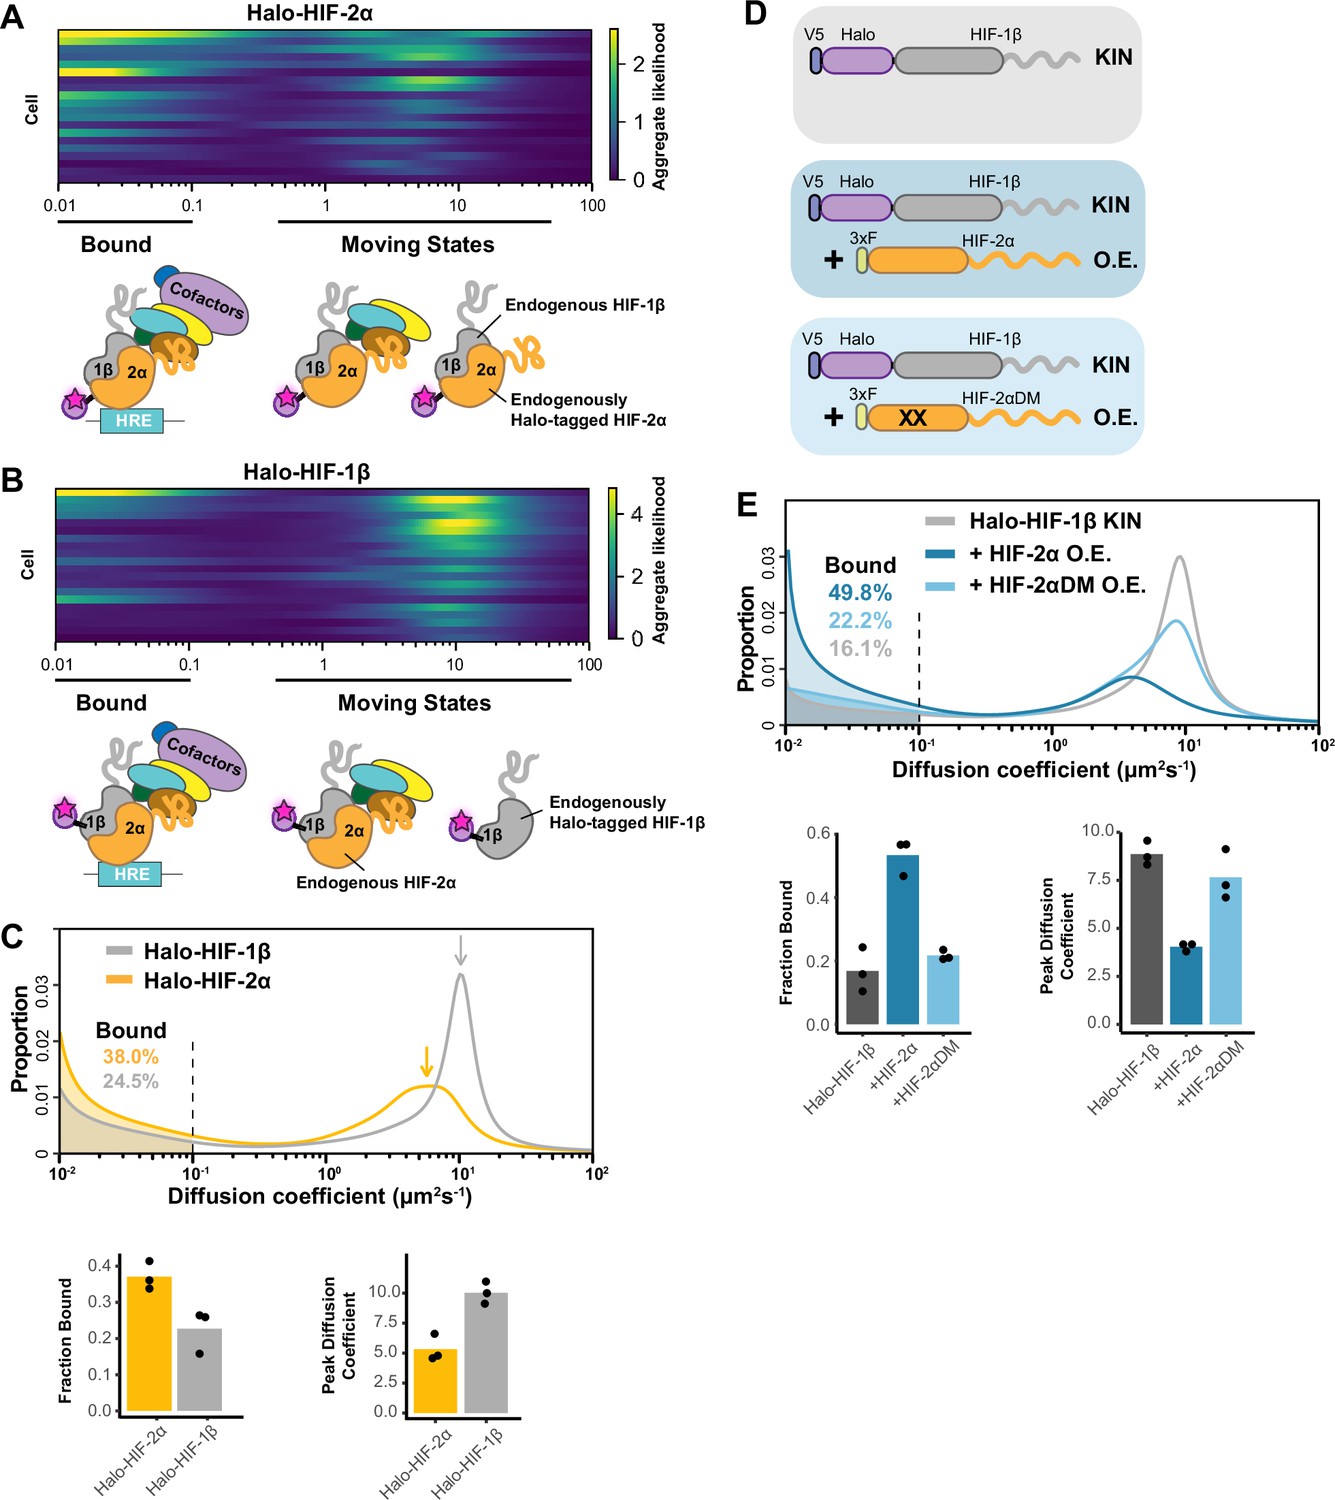
(A–B) Likelihood of diffusion coefficients based on a model of regular Brownian motion with normally distributed localization error (RBME) (Heckert et al., 2022), for (A) Halo-HIF-2α, clone A31 and (B) Halo-HIF-1β, clone A21, with drawing illustrating bound and different hypothetical moving states: complexes, dimer and monomer. Each row represents data collected from one cell. 0.1 μm2/s is used as the cut-off for bound versus free. (C) Top: Proportion of molecules as a function of their diffusion coefficients (posterior mean occupations for a state array; Heckert et al., 2022) evaluated on trajectories across all cells measured for each knock-in(KIN) line (Halo-HIF-2α, clone A31 and Halo-HIF-1β, clone A21). Compared to HIF-2α, HIF-1β has less bound fraction (gray versus yellow shaded areas) and faster diffusion coefficient (gray versus yellow arrows). Bottom: Summary of the bound fraction (left) and peak diffusion coefficient (right) for the two clones. Each bar represents the averaged value from three independent measurements on different days (black dots). Supplementary file 1 reports cell and trajectory numbers for this and all the following figures. (D–E) Overexpressing HIF-2α, but not a dimerization mutant form, in the Halo-HIF-1β knock-in (KIN) line increases HIF-1β binding and decreases its diffusion coefficient. (D) schematic illustrating the parental Halo-HIF-1β KIN cells (gray background) and cells stably overexpressing (O.E.) either the wild-type (darker blue background) or a dimerization mutant (DM, black crosses, lighter blue background) form of HIF-2α. (E) Top: Proportion of molecules as a function of diffusion coefficient measured for HIF-1β in Halo-HIF-1β KIN cells (gray) and in Halo-HIF-1β KIN cells overexpressing HIF-2α (WT, dark blue background, or dimerization mutant (HIF-2αDM), light blue). Shaded areas indicate bound fraction. Bottom: Bar plot of the average value (bar height) of the bound fraction (left) and peak diffusion coefficient (right) calculated from three independent measurements (black dots) for each condition.
Figure 2—figure supplement 1
State array (SA) analysis on fast single particle tracking (fSPT) data.
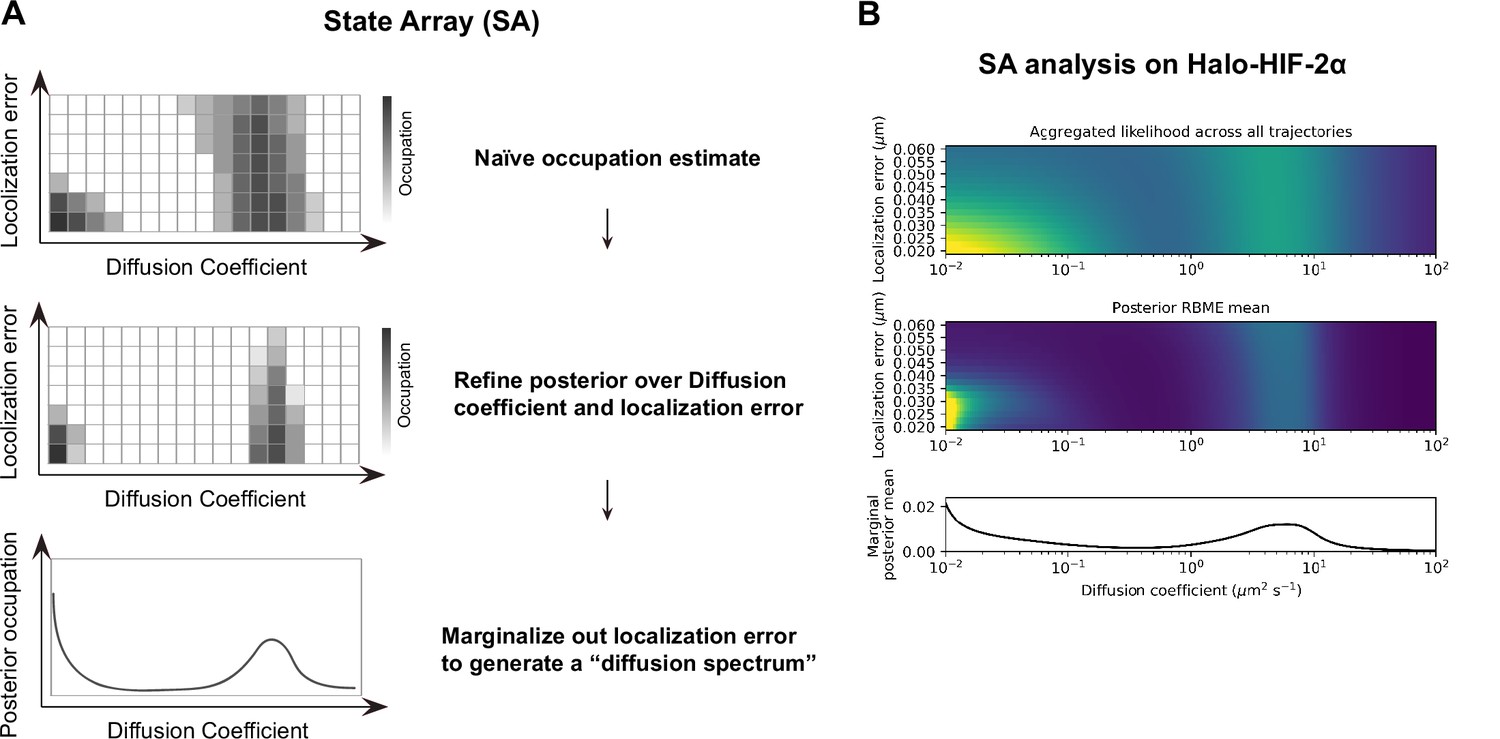
(A) Schematic of the SA workflow. Top: Step 1, naïve occupation is estimated for each state in an array of states spanning different localization errors (y-axis) and diffusion coefficients (x-axis), by simply applying the regular Brownian motion with normally distributed localization error (RBME) likelihood estimation on trajectory data. Middle: Step 2, refining posterior over diffusion coefficient and localization error. Bottom: Step 3, marginalizing out localization error to generate the posterior occupation (i.e. proportion of molecules, y-axis) as a function of diffusion coefficients (x-axis) to get the final ‘diffusion spectrum’. (B) Real example of SA analysis results from each of the three steps. Trajectory data are collected from Halo-HIF-2α knock-in (KIN) clone A31, the same data presented in Figure 2C.
Figure 2—figure supplement 2
HIF-1β behavior is distinct from HIF-2α and changes as 1β-to-2α stoichiometry changes.
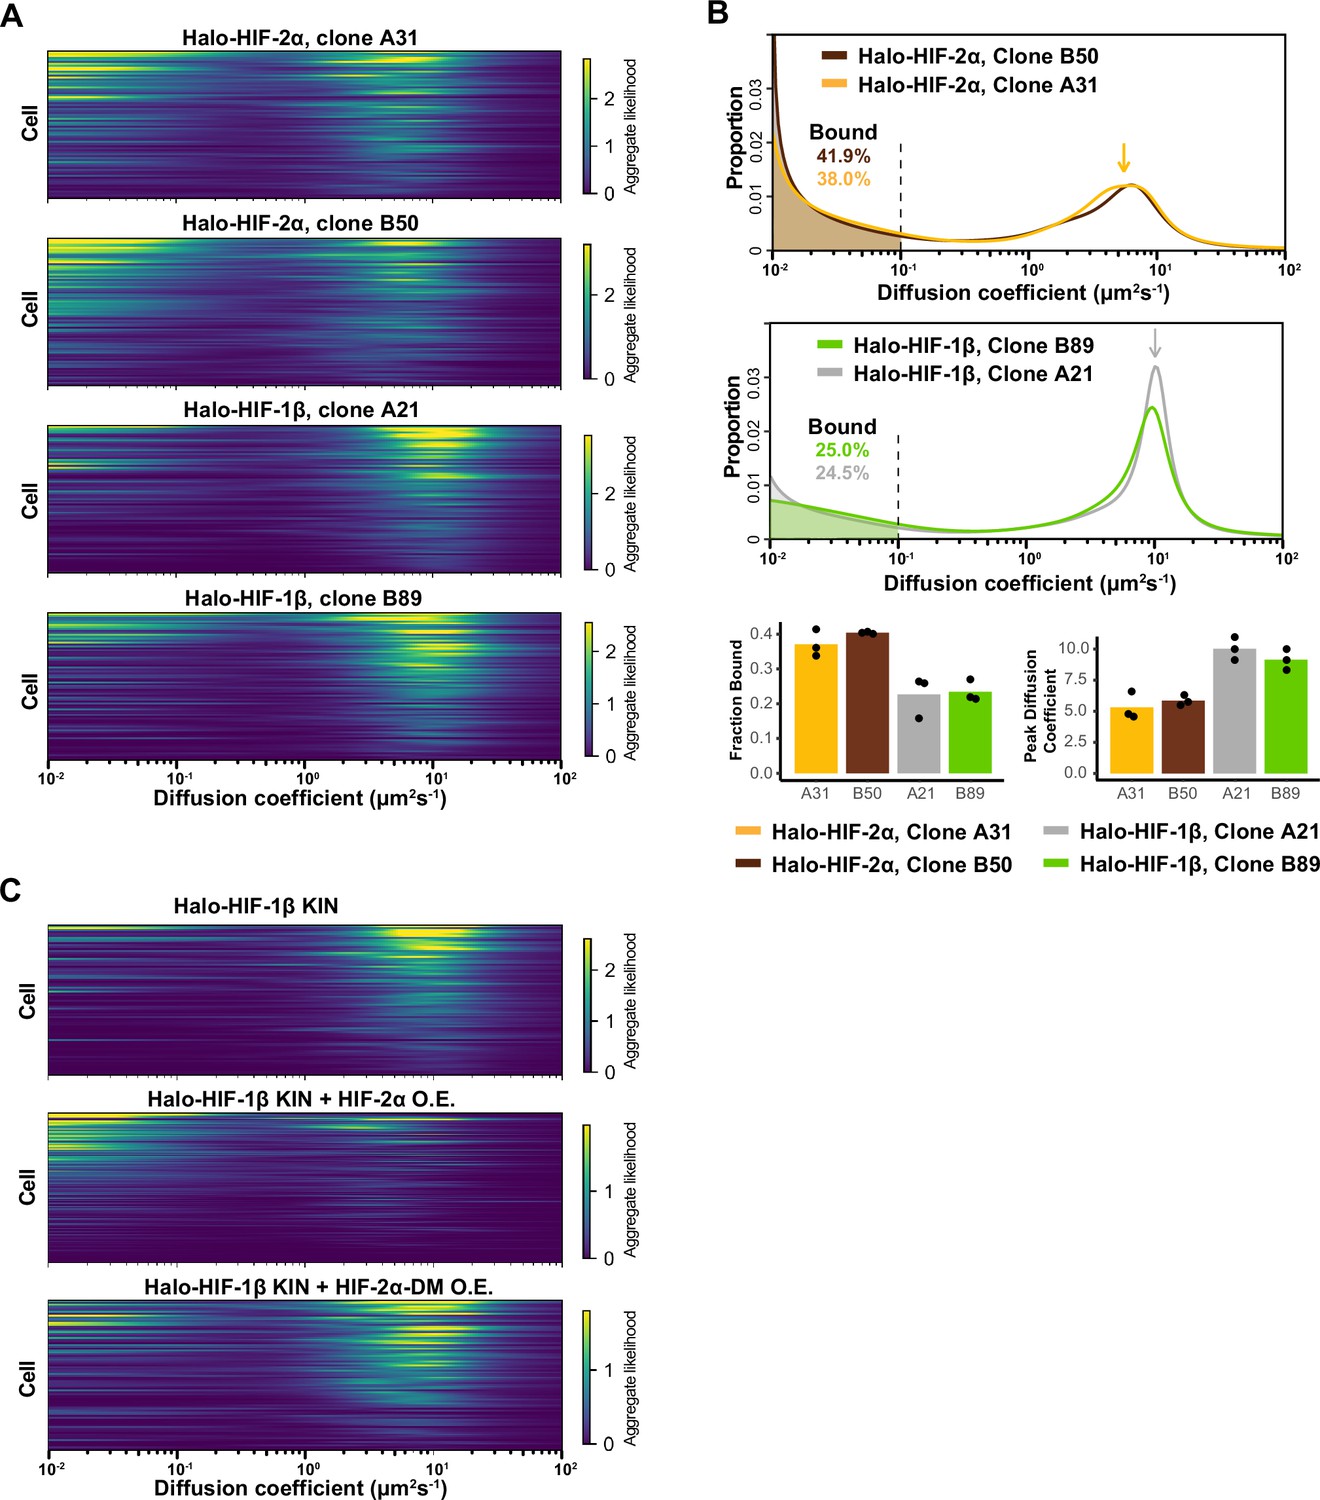
(A) Regular Brownian motion with normally distributed localization error (RBME) likelihood of diffusion coefficient in individual cells for four Halo-HIF-2α or Halo-HIF-1β knock-in (KIN) clonal lines. (B) Top and middle: Proportion of molecules as a function of their diffusion coefficients (posterior mean occupations for a state array) evaluated on trajectories across all cells measured for additional Halo-HIF KIN line showing reproducible results in different KIN clones (top, clone A31 and B50 for Halo-HIF-2α KIN and middle, clone A21 and B89 for Halo-HIF-1β KIN). Data for clone A21 and A31 are replotted from Figure 2. Bottom: Summary of the bound fraction (left) and peak diffusion coefficient (right) for all four cell lines. Each bar represents the average of three independent measurements on different days (black dots). (C) RBME likelihood of diffusion coefficient obtained for individual cells in either Halo-HIF-1β KIN cells (top) or Halo-HIF-1β KIN cells overexpressing HIF-2α (wild-type [WT], middle or dimerization mutant [DM], bottom).
Figure 2—figure supplement 3
Analysis of source of variation by bootstrapping.
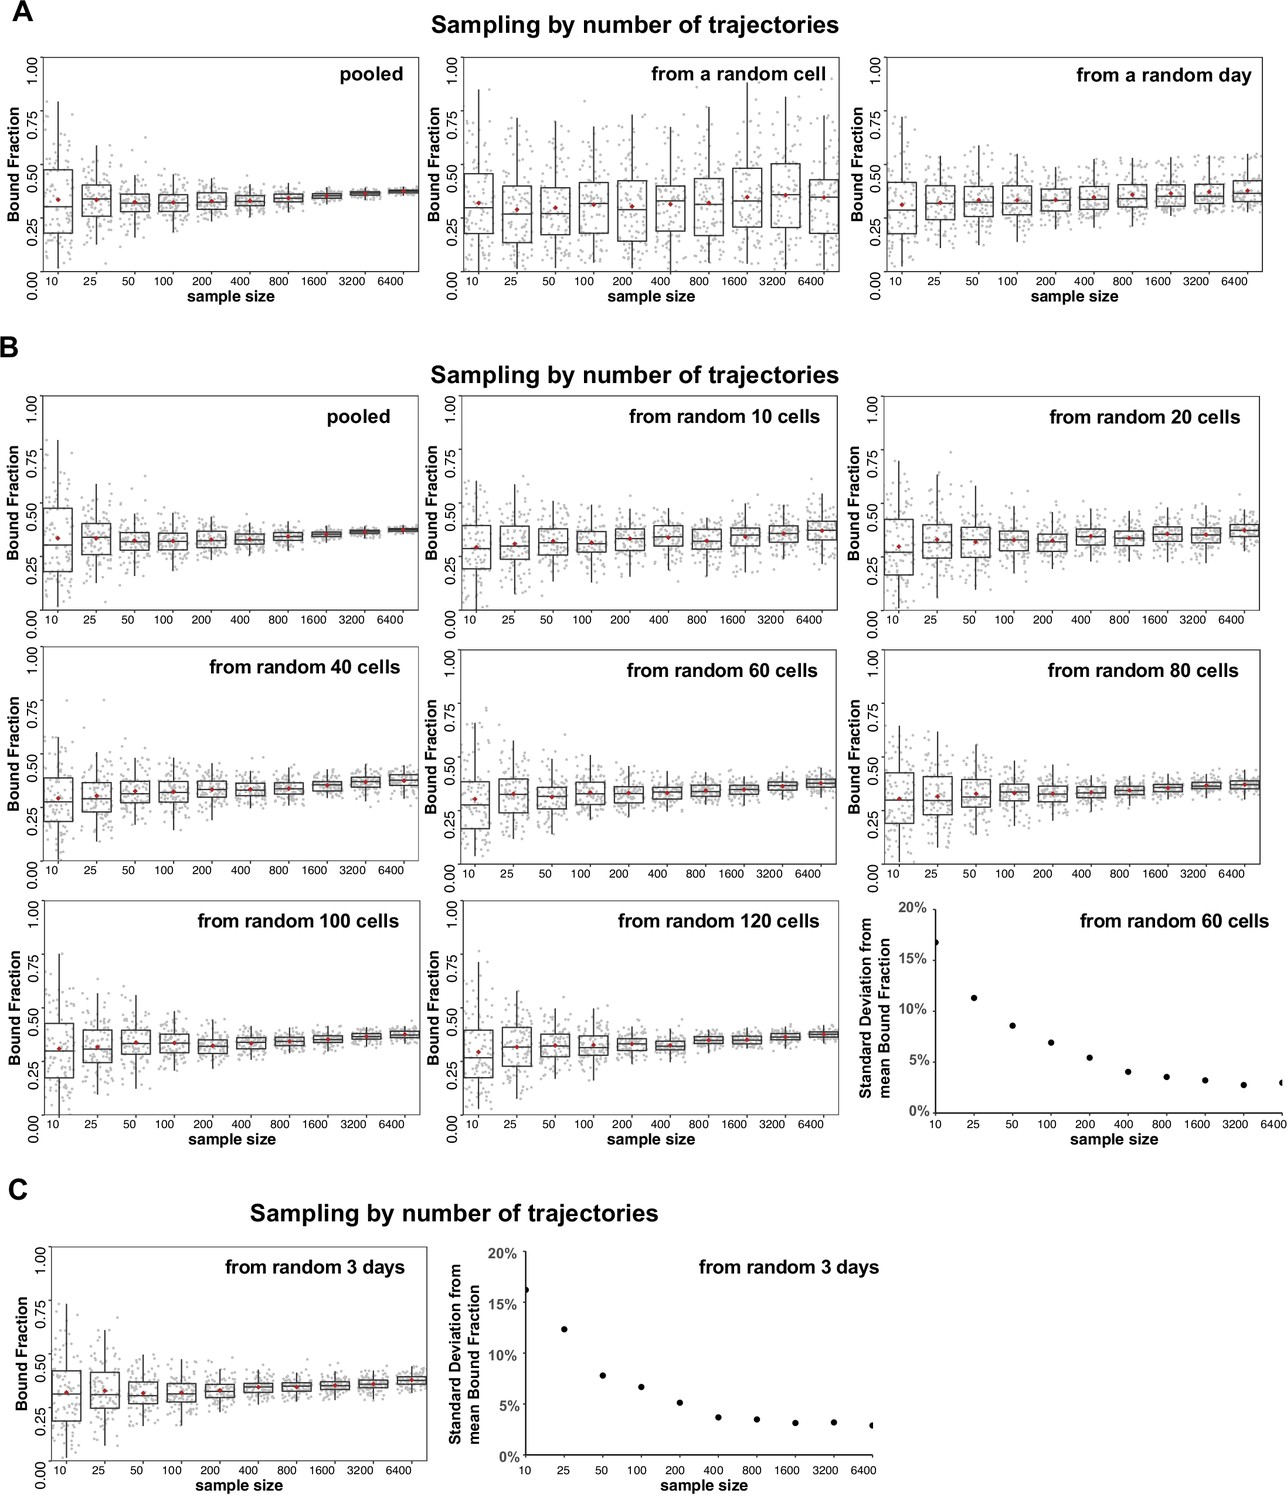
(A–C) Halo-HIF-2α trajectories imaged from knock-in (KIN) clone A31 are used for subsampling and state array (SA) analysis. Sampling (with replacement) was done by the number of trajectories (sample size = 10, 25, 50, 100, 200, 400, 800, 1600, 3200, and 6400), then analyzed with SA and the estimated bound fraction was plotted as a dot. For each sample size, 100 replicates were performed and plotted as 100 dots with box plot on top showing variation and the brown diamond indicating the mean. (A) The main source of variation is cell-to-cell variability, followed by day-to-day (i.e. replicate-to-replicate) variability. Left: Each sampling was drawn from pooled trajectories of 243 movies (cells) taken on 11 different days. As the trajectory size increases, the results converge. Middle: Each sample was drawn from a single cell that was randomly selected from 243 cells. Increasing the number of trajectories does not improve the variance. Right: Each sample was drawn from all the trajectories collected on a single day that was randomly selected from the 11 different days. Increasing the number of trajectories improves the variance but some variation remains. (B) Different number of cells are used for sampling to evaluate variation. For each graph, each sample was drawn from N unique cells as indicated (N=a pooled of 243 cells; or 10, 20, 40, 60, 80, 100, 120 randomly selected from the pool of 243 cells). Replicates done with more than 60 random cells can achieve a standard deviation less than 5% when the total trajectory number is over 800. (C) A random pool of trajectories from 3 different days are used for each draw, showing that an estimation with data randomly collected from three independent replicates (i.e. days) can achieve a standard deviation less than 5% when the total trajectory number is over 800.
Figure 3 with 2 supplements

HIF-α increases HIF-1β binding and decreases HIF-1β diffusion coefficient through dimerization, in an intrinsically disordered region (IDR)-dependent manner.
(A) Schematic of evaluating Halo-HIF-1β behavior with genetic and small-molecule perturbation. Parental Halo-HIF-1β knock-in (KIN) cells (gray background) and cells stably overexpressing (O.E.) either a certain form of HIF-α (wild-type [WT] or domain swap, HIF-1α, red, HIF-2α, orange. Disordered regions are represented as wavy lines.) (various colored background), or a 3xFLAG tag only control (blue background) are used, with and without 0.2 μM Belzutifan (HIF-2α/1β dimerization inhibitor) treatment. (B) Proportion of Halo-HIF-1β molecules as a function of diffusion coefficient measured in various conditions outlined in (A) Top row: DMSO only, showing overexpressing α subunit can change HIF-1β behavior. Cells overexpressing the α subunit variants containing HIF-2α disordered region (orange curly line) have a stronger effect (middle, HIF-2α and HIF-1α/2α,) compared to those containing HIF-1α disordered region (right, HIF-1α and HIF-2α/1α). Middle and bottom rows: Proportions of HIF-1β as a function of diffusion coefficient, measured in each of the six cell lines with Belzutifan treatment are compared to the DMSO control. Changes caused by overexpressing an α subunit can be specifically reverted by Belzutifan treatment for cell lines expressing an α subunit variant that contains the HIF-2α structured domain (orange globule). (C) Summary of the average bound fractions (top) and peak diffusion coefficient (bottom) for all 12 conditions, with black dots indicating values from each of the three individual measurements.
Figure 3—figure supplement 1
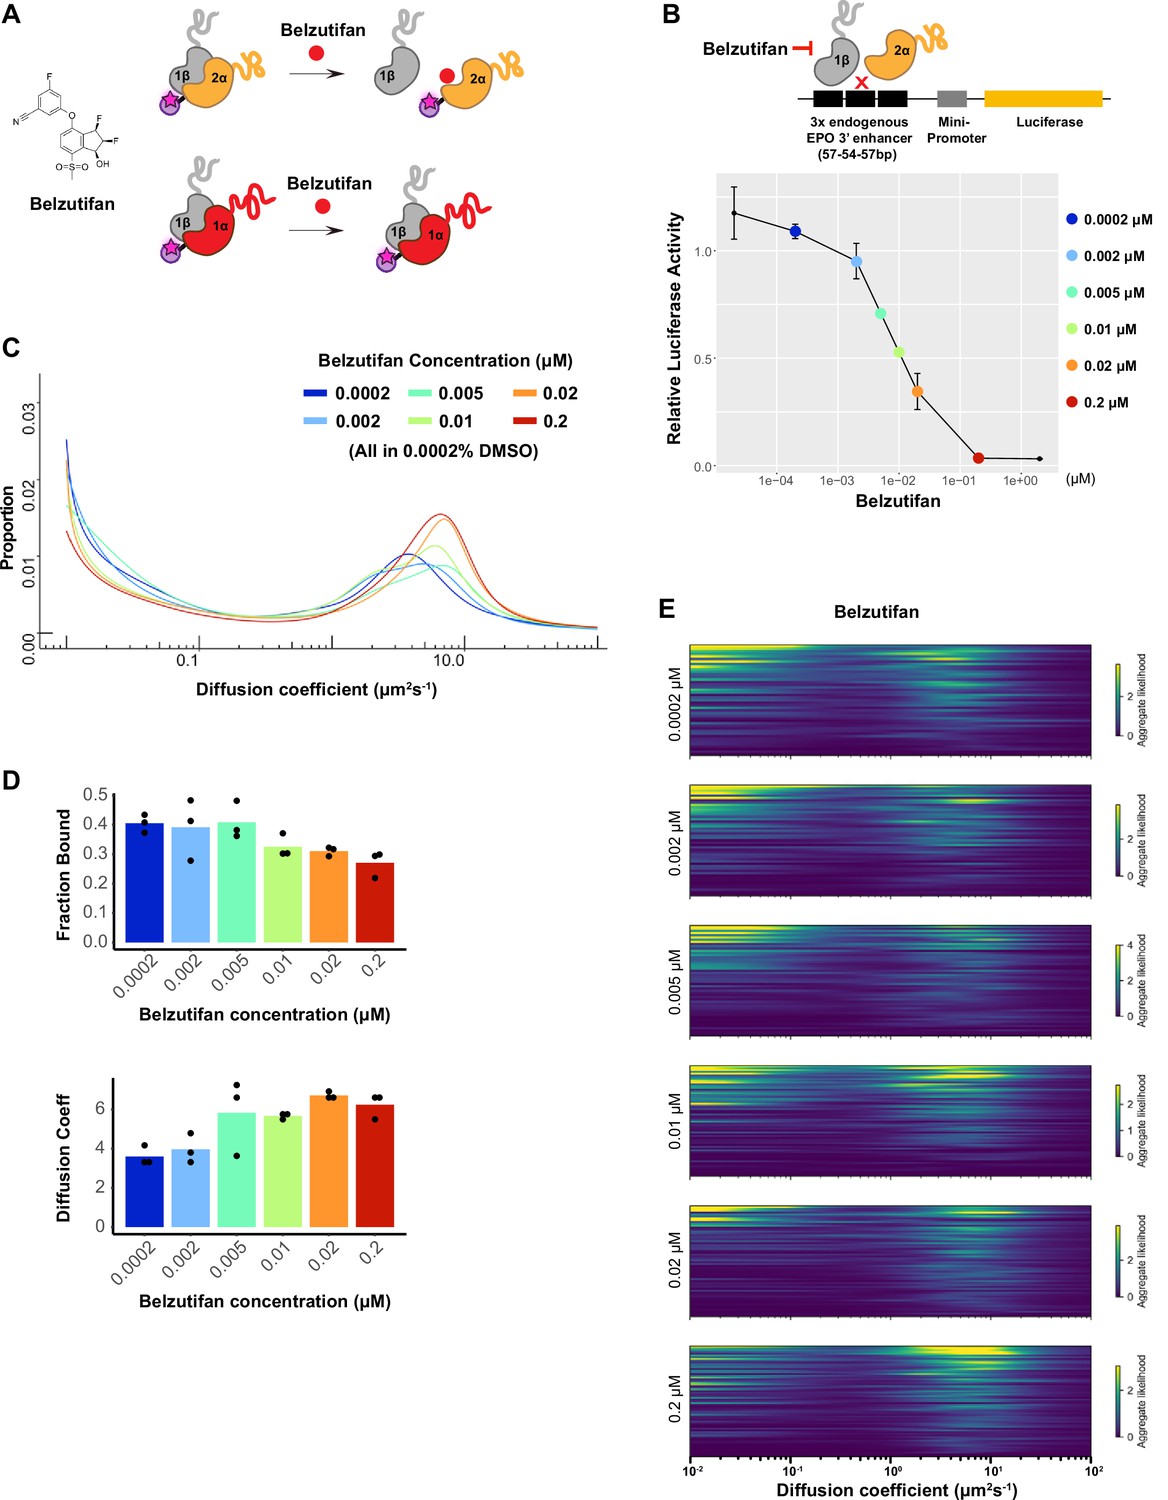
Dosage-dependent inhibition of HIF-2α binding and activity by Belzutifan.
(A) Molecular structure of Belzutifan (PT-2977) and schematic illustration of its function to specifically block dimerization between HIF-2α/1β but not HIF-1α/1β. (B) Luciferase assay using a hypoxia response element (HRE)-containing reporter confirms Belzutifan dosage-dependent inhibition of HIF-2α activity in wild-type (WT) 786-O cells. Error bars represent SE. (C) Proportion of molecules as a function of diffusion coefficient for HIF-2α measured in Halo-HIF-2α knock-in (KIN) line clone A31 treated with different concentrations of Belzutifan. DMSO levels are kept the same for all conditions at 0.0002%. (D) The average bound fraction decreases (top) and the average peak diffusion coefficient increases (bottom) at increasing doses of Belzutifan. Individual measurements are indicated as black dots. (E) Regular Brownian motion with normally distributed localization error (RBME) likelihood of diffusion coefficient in individual cells for all six drug dosages.
Figure 3—figure supplement 2
Additional data for Figure 3 showing HIF-α without the intrinsically disordered region (IDR) is not able to increase HIF-1β binding or decrease its diffusion coefficient.
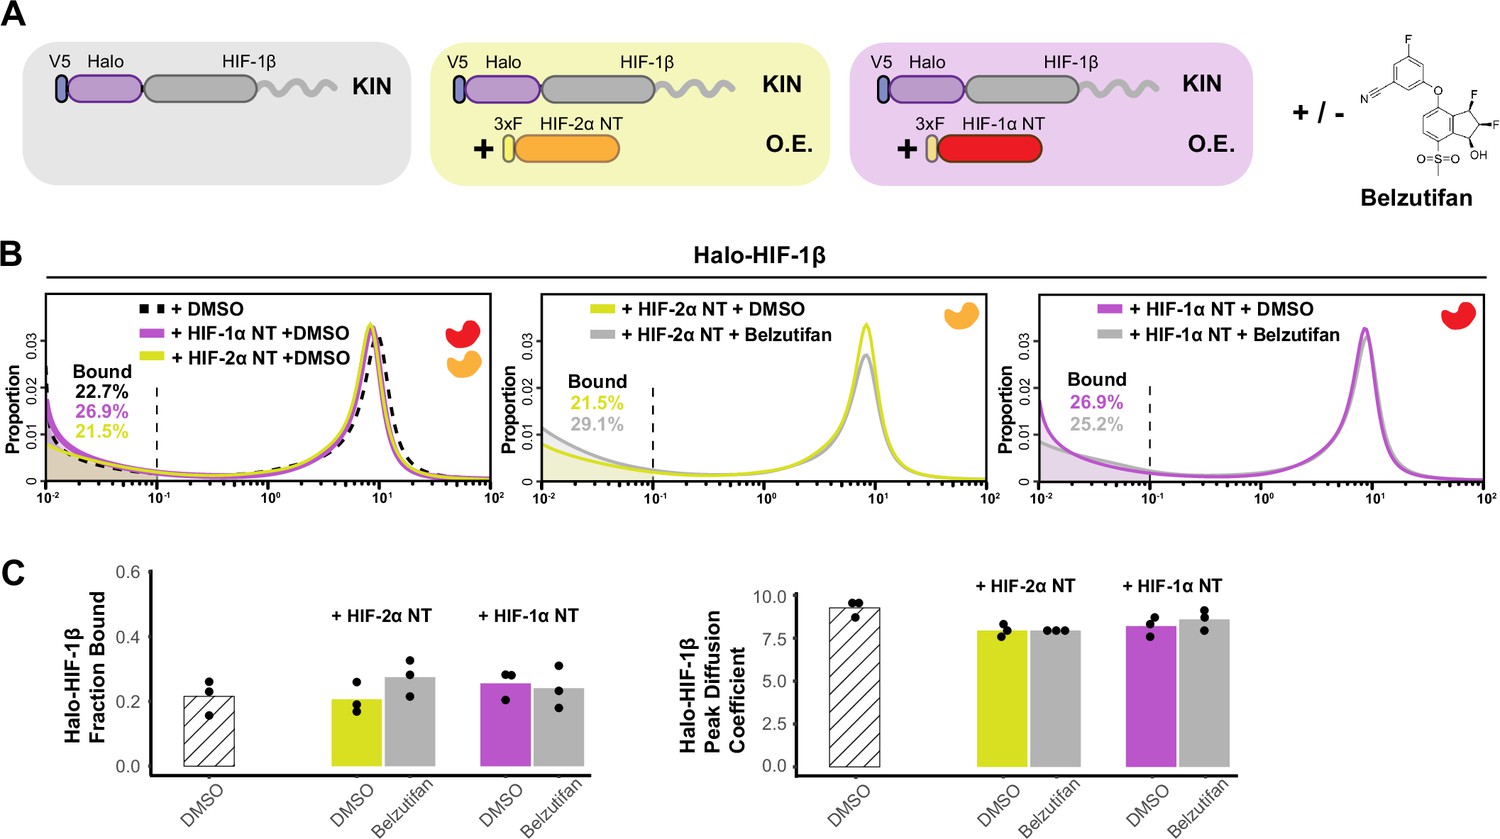
(A) Schematic of evaluating Halo-HIF-1β behavior while overexpressing only the N-terminal structured region (NT) of HIF-α in combination with small-molecule perturbation. Parental Halo-HIF-1β knock-in (KIN) cells (gray background, same as in Figure 3) and cells stably overexpressing (O.E.) either HIF-2α NT (orange in yellow background) or HIF-1α NT (red in purple background) are used, with and without treatment with 0.2 μM Belzutifan. (B) Proportion of HIF-1β molecules as a function of diffusion coefficient measured in various cells outlined in (A). Left: Treated with DMSO only, comparing HIF-1β behavior in the parental cells (black dashed curve, same as in Figure 3) and in cells expressing either HIF-1α NT (purple curve) or HIF-2α NT (yellow curve). Middle and right: Proportions of HIF-1β as a function of diffusion coefficient, measured in cells expressing either HIF-1α NT (right) or HIF-2α NT (middle) with Belzutifan treatment (gray curves), compared to the DMSO control (purple or yellow curves). (C) Summary of the average bound fractions (left) and peak diffusion coefficient (right) for conditions in (B), with black dots indicating values from each of the three individual measurements.
Figure 4 with 2 supplements
The intrinsically disordered region (IDR) governs HIF-α molecular dynamics and binding characteristics.
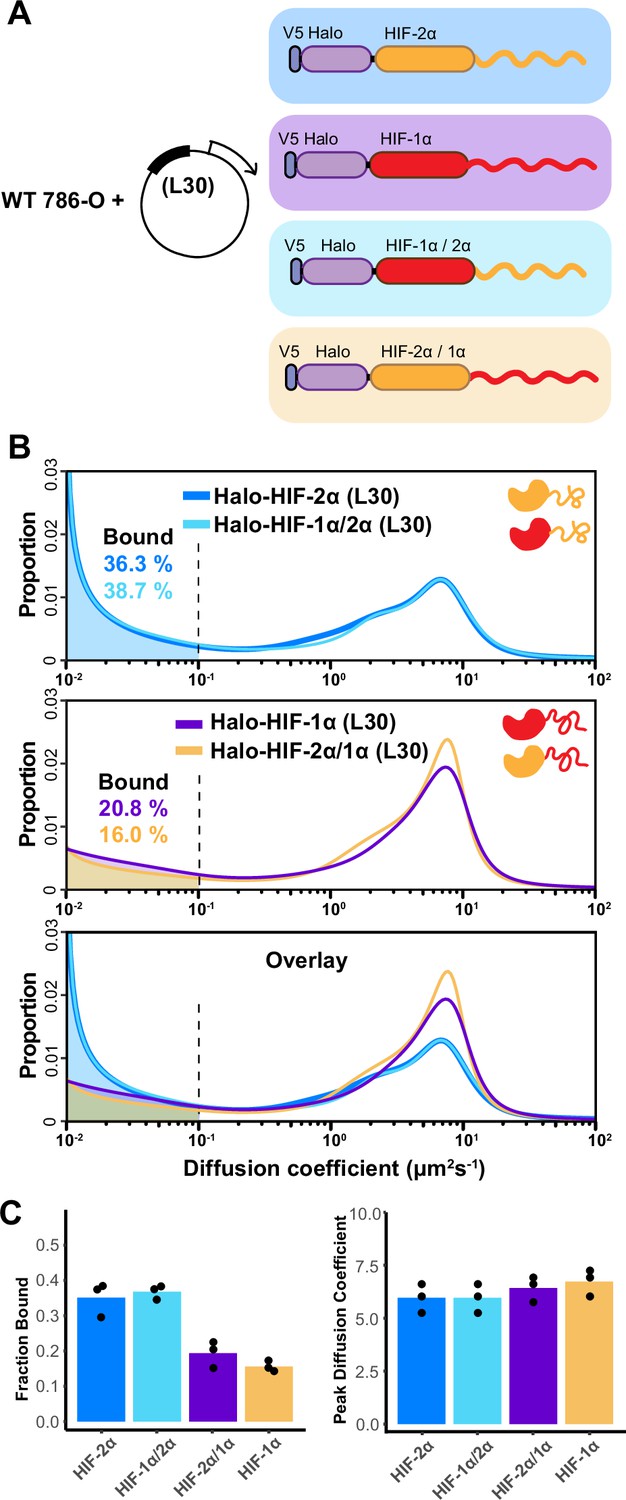
(A) Schematic representation of different hypoxia-inducible factor (HIF) (wild-type [WT] and domain-swapped) being weakly and stably overexpressed with an L30 promoter and tracked in WT 786-O cells. (B) Proportion of molecules as a function of diffusion coefficient for every tracked protein in (A). Top: Overlapping distribution curves shows almost identical behavior between Halo-HIF-2α (dark blue curve) and Halo-HIF-1α/2α (light blue curve). Middle: Similar behavior between Halo-HIF-1α (purple curve) and Halo-HIF-2α/1α (yellow curve). Bottom: Overlay of all four curves shows very different behavior between proteins containing 1α versus 2α IDR. (C) Bar plot comparing the average bound fraction (left) and peak diffusion coefficient (right) for cells in (B), with black dots indicating values from three independent measurements.
Figure 4—figure supplement 1
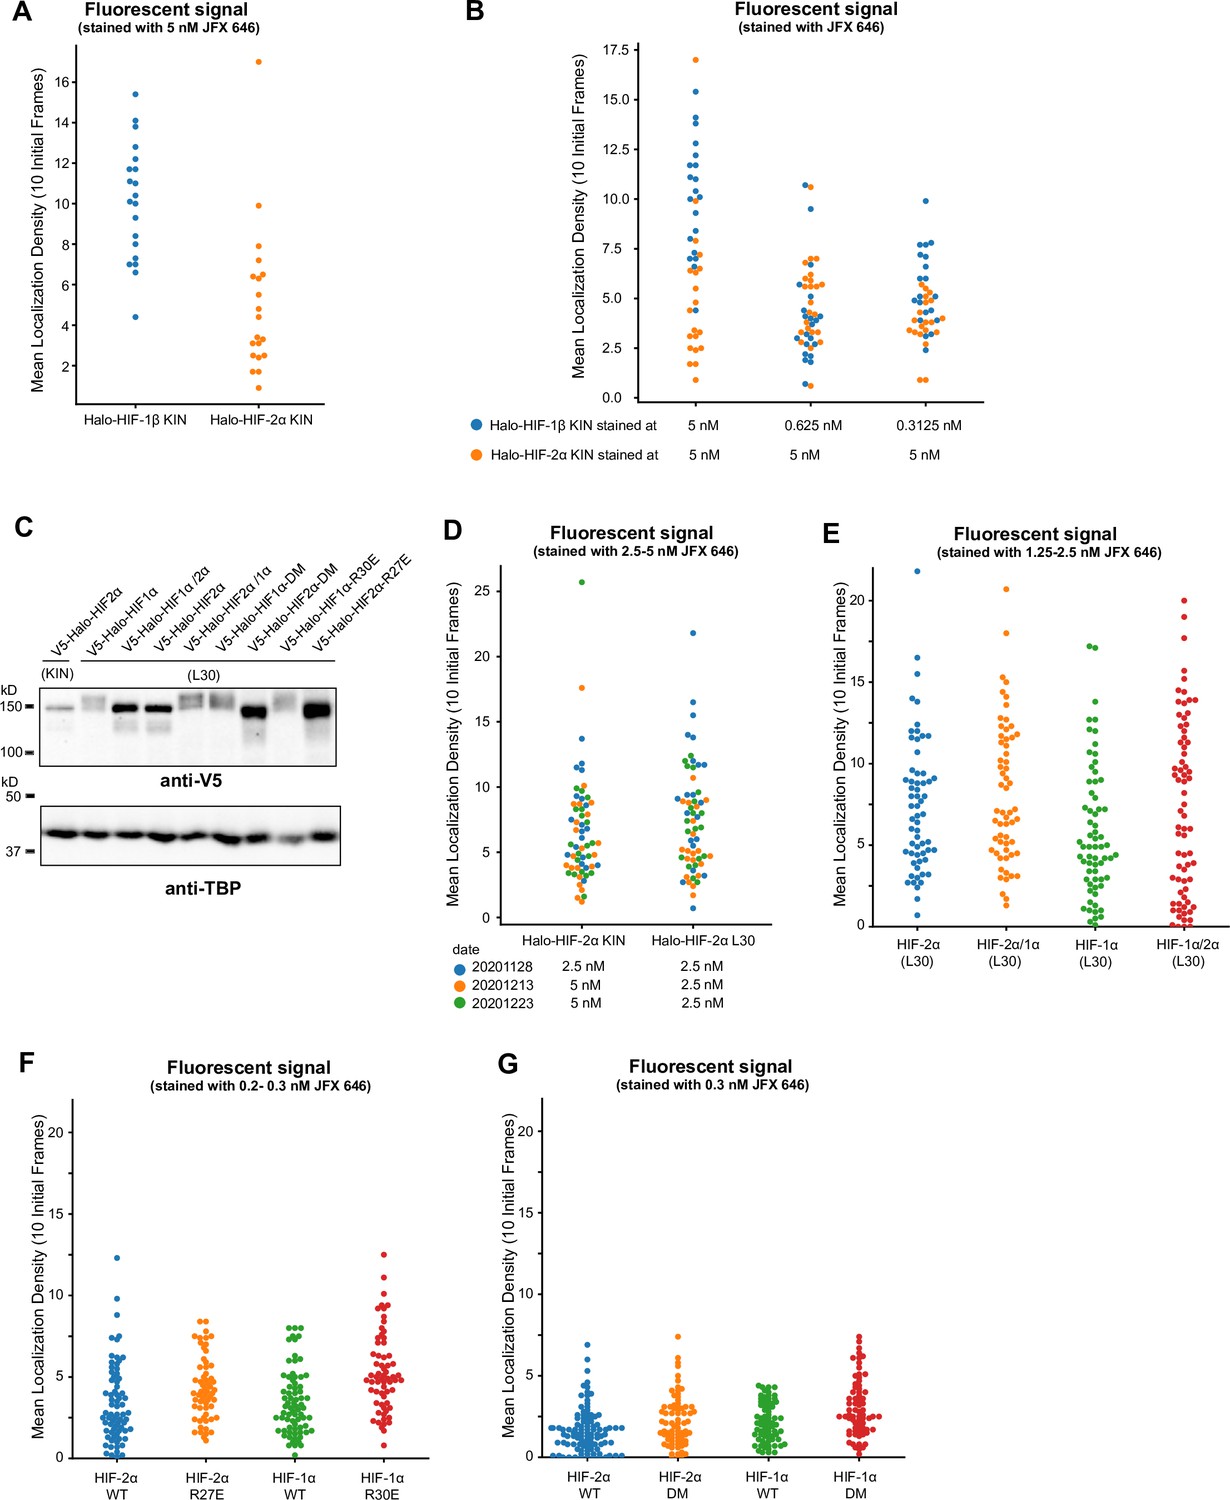
Quantification of initial localization density showing we imaged cells with similar expression levels of Halo-tagged proteins.
(A) When cells were stained with the same dye concentration, a much higher mean density of fluorescence spots at the first 10 frames (i.e. initial localization density) was observed for proteins with higher expression levels. (B) In order to achieve a similar initial localization density, a much lower dye concentration has to be used (~1/10 of concentration used for Halo-HIF-2α is needed for Halo-HIF-1β). When using dye concentrations varying of a factor of 2 (0.625 and 0.3125 nM), the initial localization density for the same protein (Halo-HIF-1β) looks similar. (C) Western blot analysis of expression level of various Halo-tagged proteins in knock-in (KIN) cells and in cells with L30 expression system. Bulk results are mixed-population average and do not reflect expression levels from individual cells. (D–G) Analysis of initial localization density for data used in Figure 4—figure supplement 2 (D), Figure 4 (E), and Figure 5 (F and G) showing initial localization density for all cells imaged. For each set of experiments, the overall localization density across cell lines varies ~2 folds, verifying comparable expression levels across the samples.
-
Figure 4—figure supplement 1—source data 1
Source data for Figure 4—figure supplement 1, including two raw images (tif files) for western blots and one figure (pdf) explaining each of the raw images.
- https://cdn.elifesciences.org/articles/75064/elife-75064-fig4-figsupp1-data1-v2.zip
Figure 4—figure supplement 2
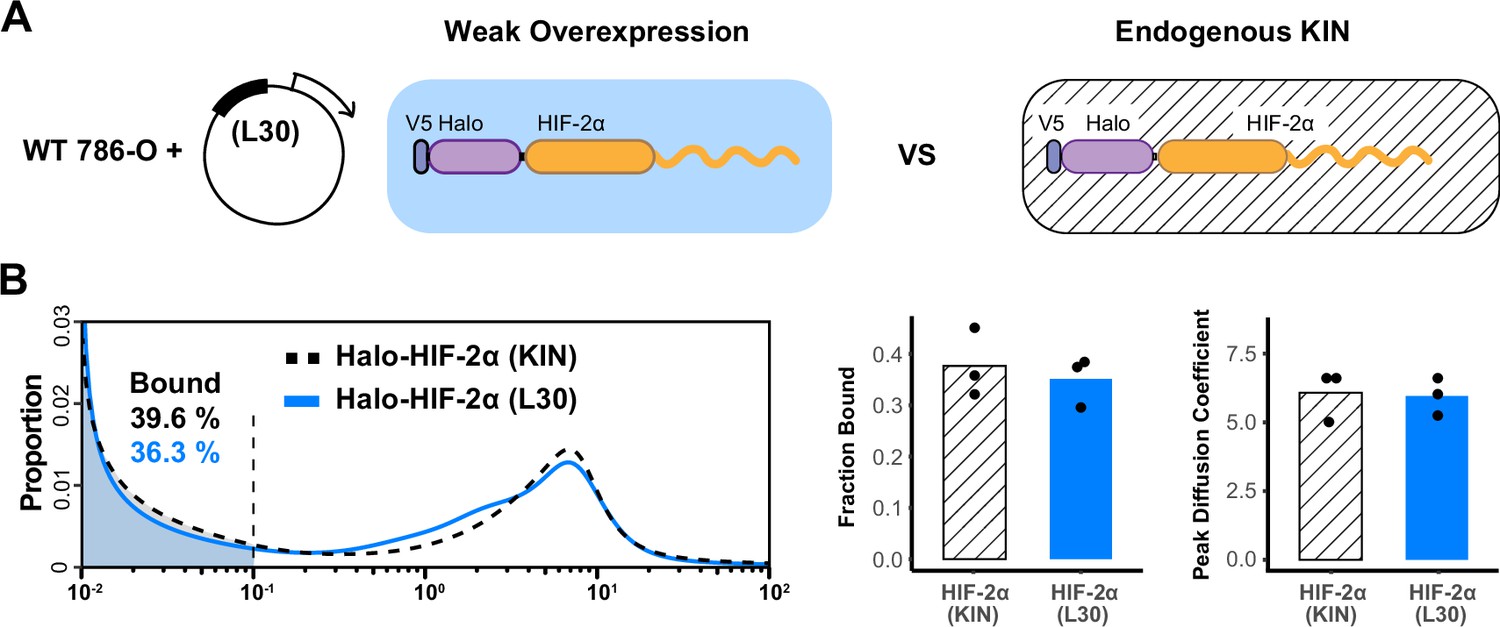
L30 weak expression system is able to recapitulate the endogenous protein behavior.
(A) Schematic of the L30 overexpression system where Halo-HIF-2α is weakly expressed with an L30 promoter in wild-type 786-O cells (left) and knock-in (KIN) cells where HIF-2α is endogenously tagged and expressed (right). (B) Comparison between endogenous Halo-HIF-2α (KIN) and Halo-HIF-2α over-expressed with L30 promoter (L30), showing very similar behavior. Left: Proportion of Halo-HIF-2α as a function of diffusion coefficient and the corresponding bound fraction (shaded area). Right: Bar plot summarizes the average bound fraction (left) and peak diffusion coefficient (right) with three independent measurements (black dots).
Figure 5
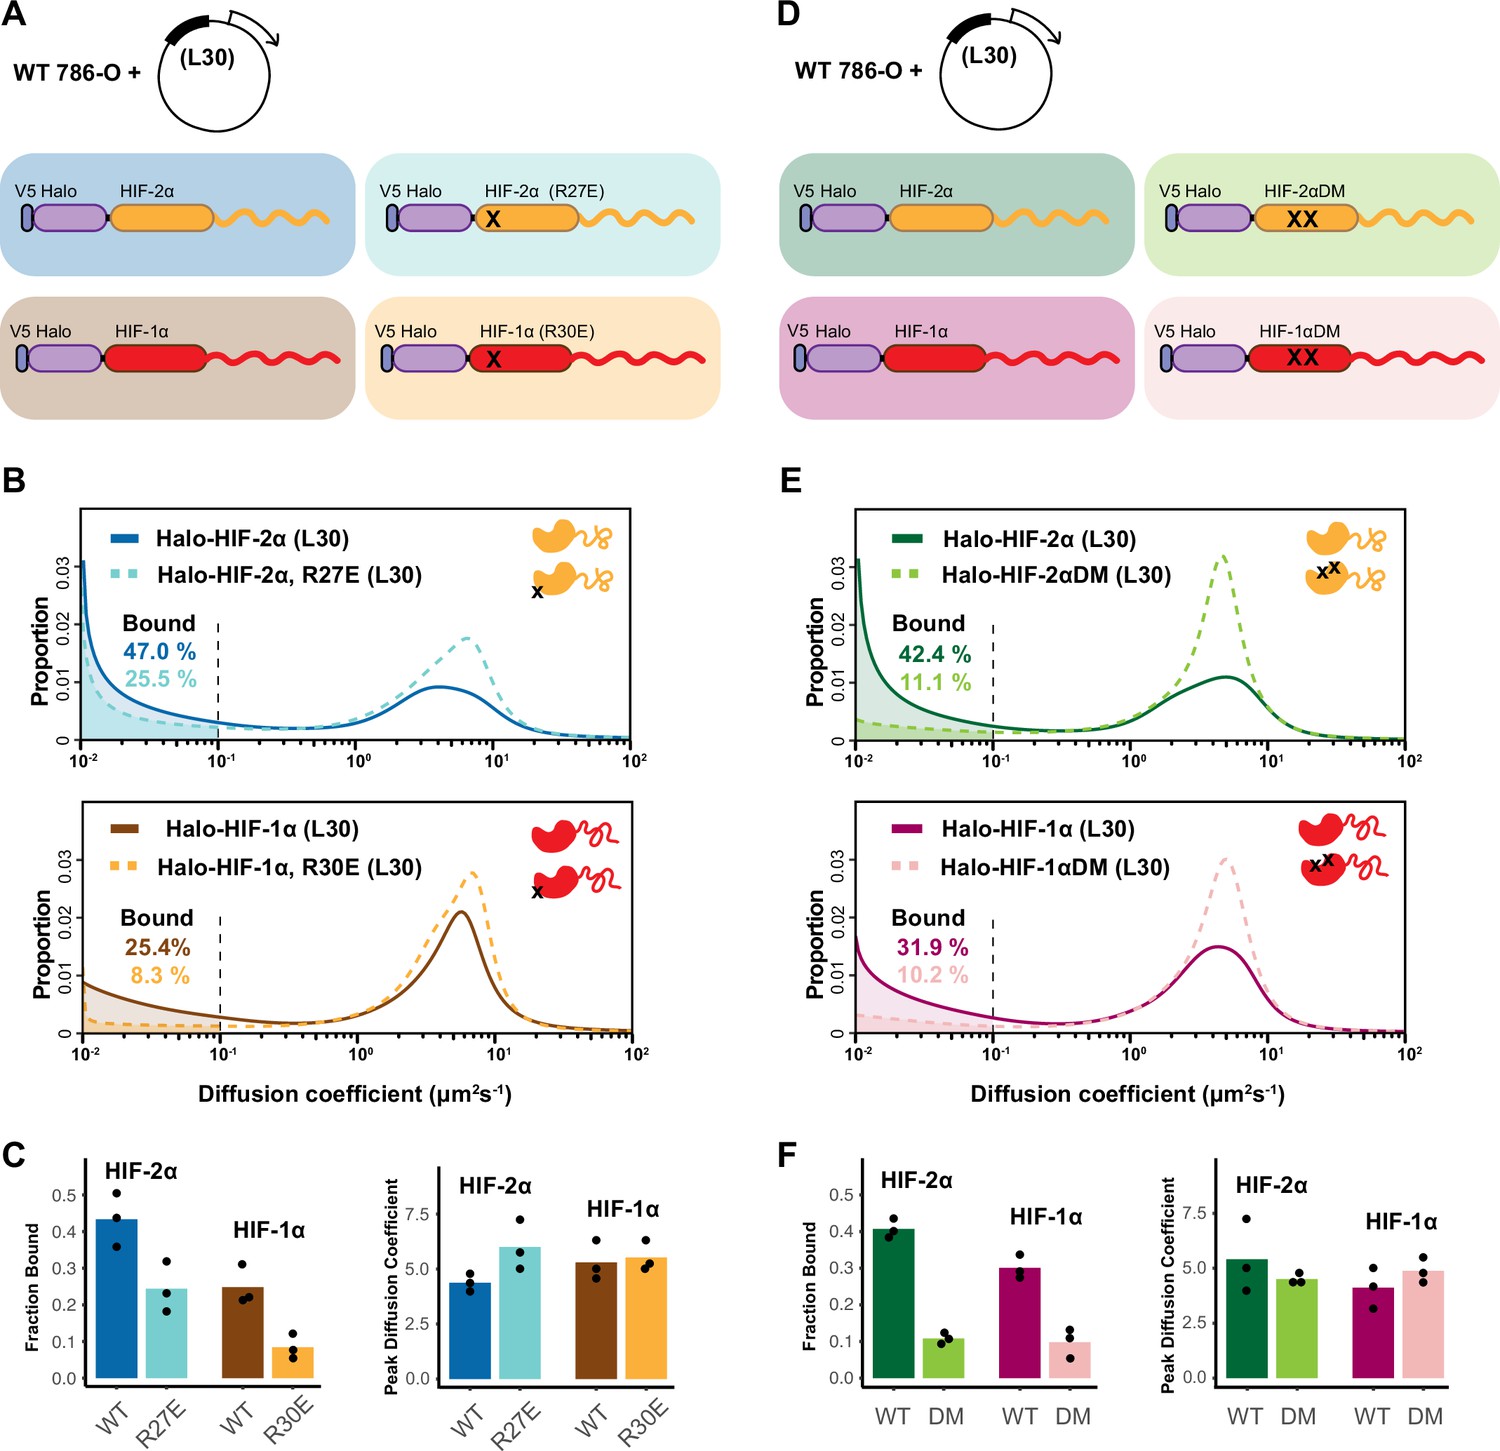
HIF-α intrinsically disordered region (IDR) alone is not sufficient for binding.
(A–C) Mutation in DNA-binding domain (DBD) reduces the bound fraction for both HIF-α isoforms. (A) Schematic representation of weakly overexpressing and tracking wild-type and DBD mutant (R27E or R30E, black cross) forms of HIF-1α or -2α, using the same L30 expression system as in Figure 4. (B) Proportion of molecules as a function of diffusion coefficient for tracked protein listed in (A). (C) Bar plot summarizes the average value (bar height) of the bound fraction (left) and peak diffusion coefficient (right) of three independent measurements (black dots). (D–F) Mutations in the dimerization domain reduce the bound fraction for both HIF-α isoforms but do not change their diffusion coefficient. (D) Schematic representation of weakly overexpressing and tracking wild-type and dimerization mutant (DM, two black crosses) forms of Halo-HIF-1α or -2α, using the L30 expression system. (E) Proportion of molecules as a function of diffusion coefficient for tracked protein in (D). (F) Summary of the average value (bar height) of the bound fraction (left) and peak diffusion coefficient (right) for all four proteins with black dots indicating values from three independent measurements.
Figure 6 with 3 supplements
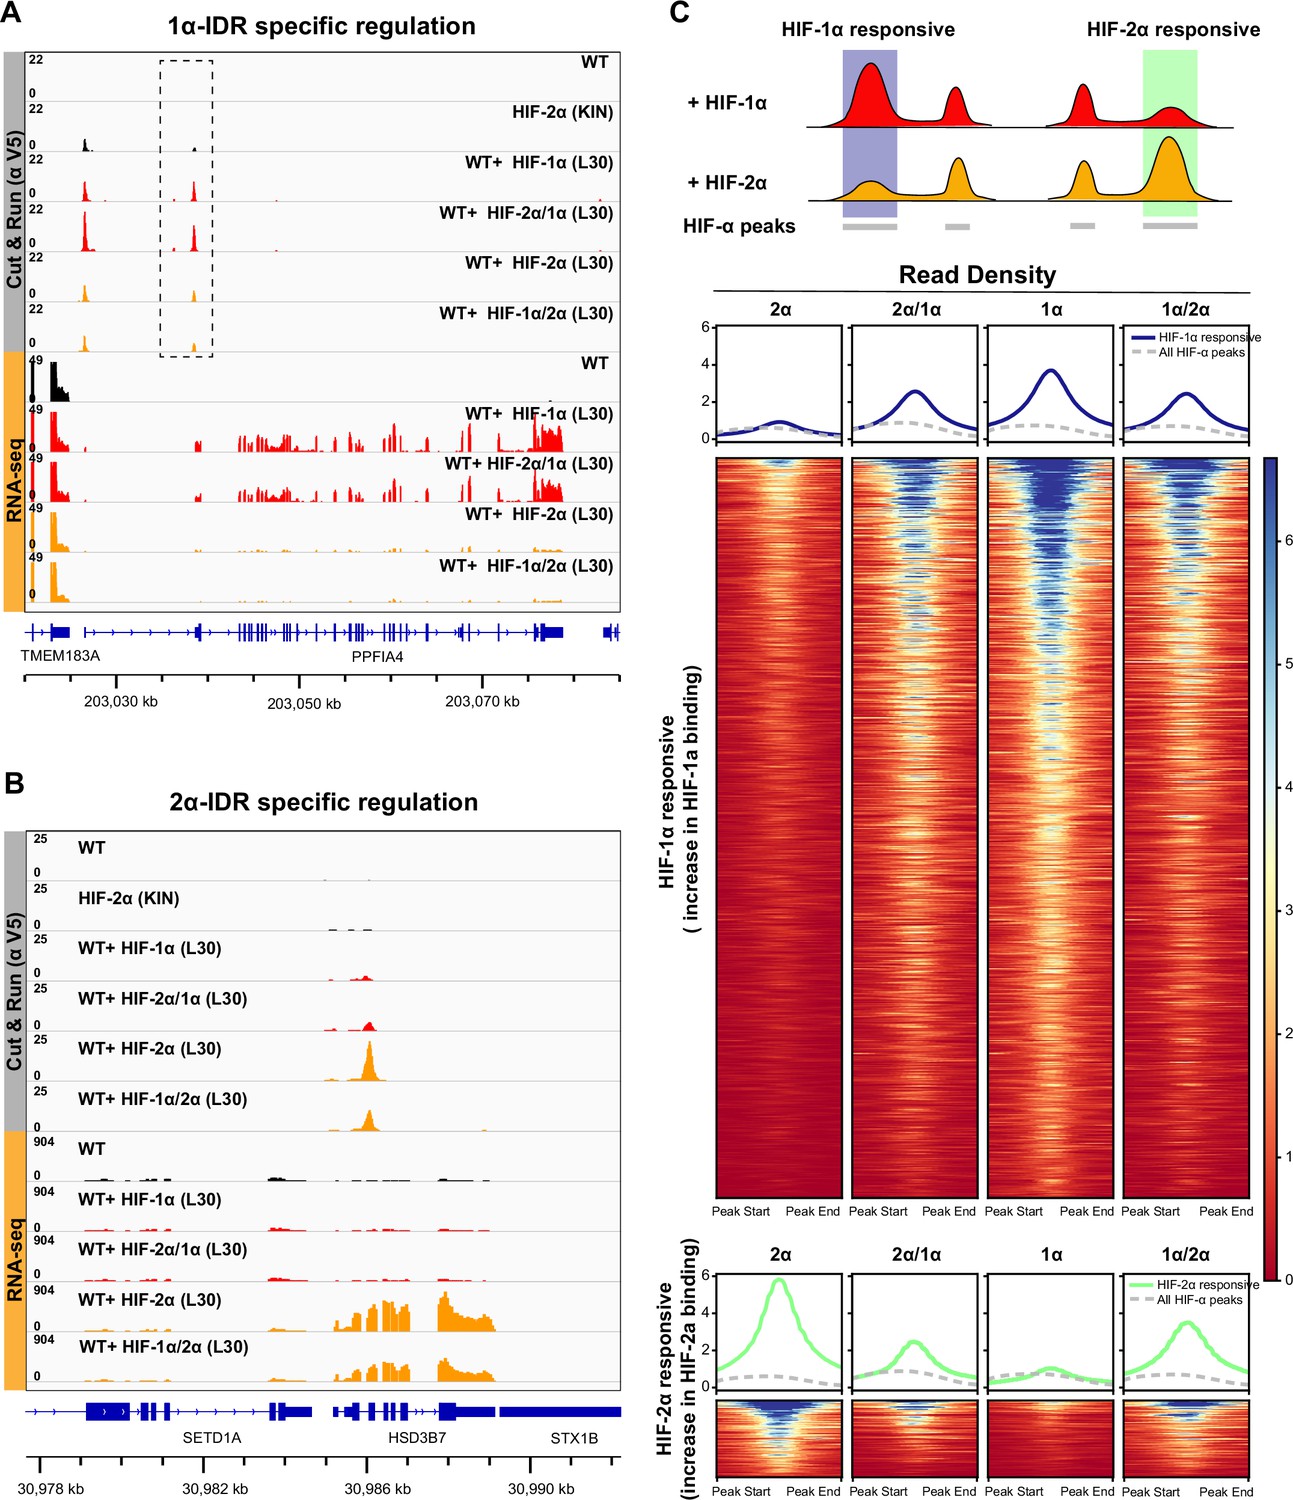
HIF-α intrinsically disordered region (IDR) contributes to isoform-specific chromatin binding preferences and activation of isoform-specific hypoxia-inducible factor (HIF) target genes.
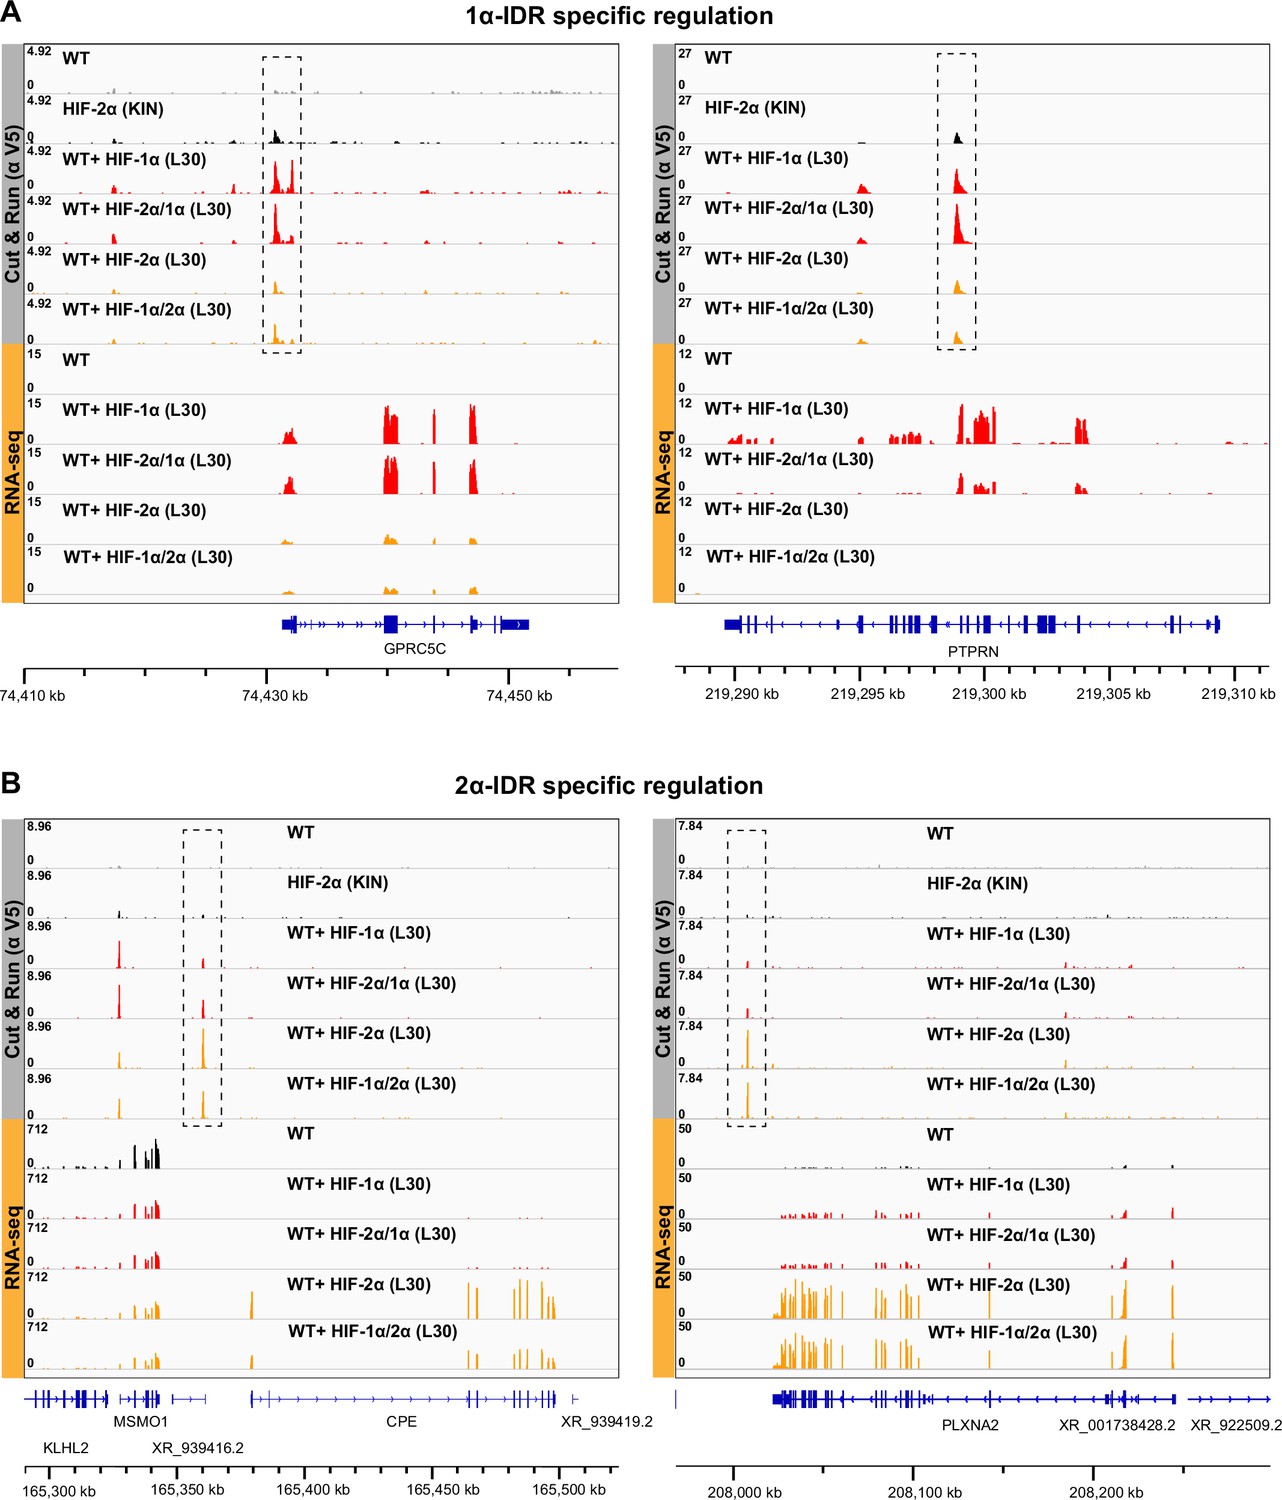
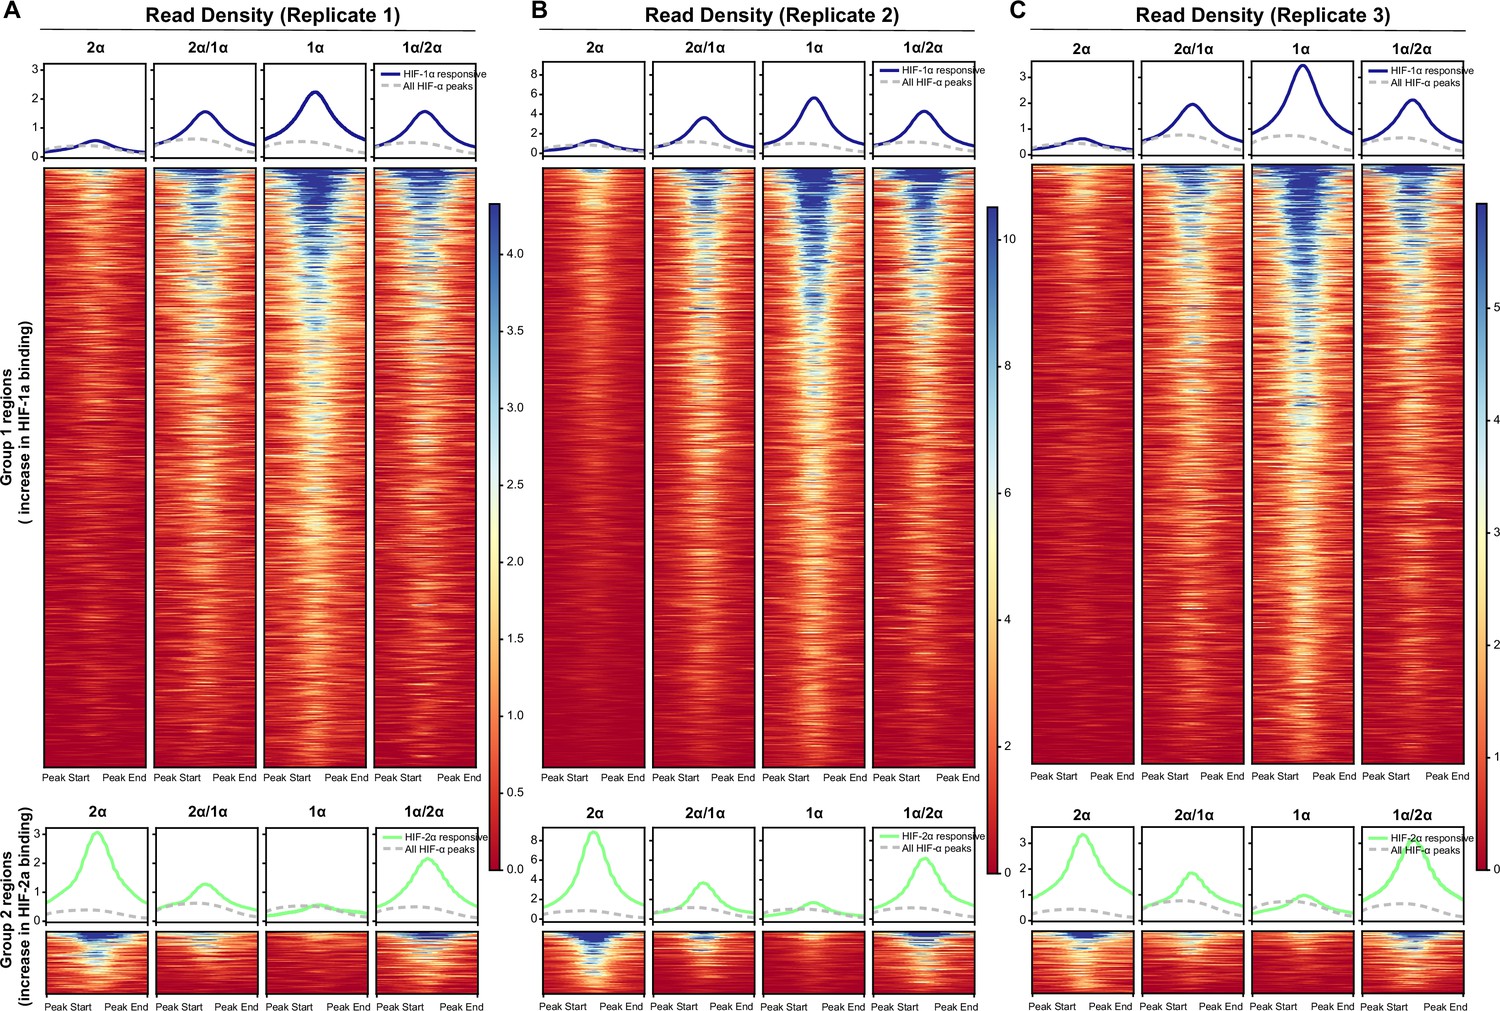
(A–B) Genome browser view of anti-V5 Cut&Run and RNA-seq results on wild-type (WT) cells, Halo-HIF-2α knock-in (KIN) cells and cells expressing different Halo-tagged HIF-α variants driven by an L30 promoter, showing IDR-specific regulation. (A) An example of genes that are preferentially bound (dashed box) and specifically activated by HIF-1α, as well as by HIF-2α/1α. (B) An example of genes that are preferentially bound and specifically activated by HIF-2α, as well as by HIF-1α/2α. (C) Genome-wide analysis of contribution of DNA-binding domain (DBD) or IDR on isoform-specific binding with Cut&Run data. Top: Schematic showing definition of HIF-1α and HIF-2α responsive regions. Regions that show increased binding when overexpressing Halo-tagged HIF-1α compared to when overexpressing Halo-tagged HIF-2α are defined as HIF-1α responsive regions (purple highlight). Regions that show increased binding when overexpressing Halo-tagged HIF-2α compared to when overexpressing HIF-1α are defined as HIF-2α responsive regions (green highlight). Bottom: Heatmap and pile-up results (blue curves for HIF-1α responsive regions and green curves for HIF-2α responsive regions) on binding strength at all HIF-1α responsive regions or HIF-2α responsive regions when cells overexpressing either Halo-tagged HIF-2α, -2α/1α, -1α, or -1α/2α. Pile-up enrichment results at all HIF binding sites (dashed gray curves) are used as control.
Figure 6—figure supplement 1
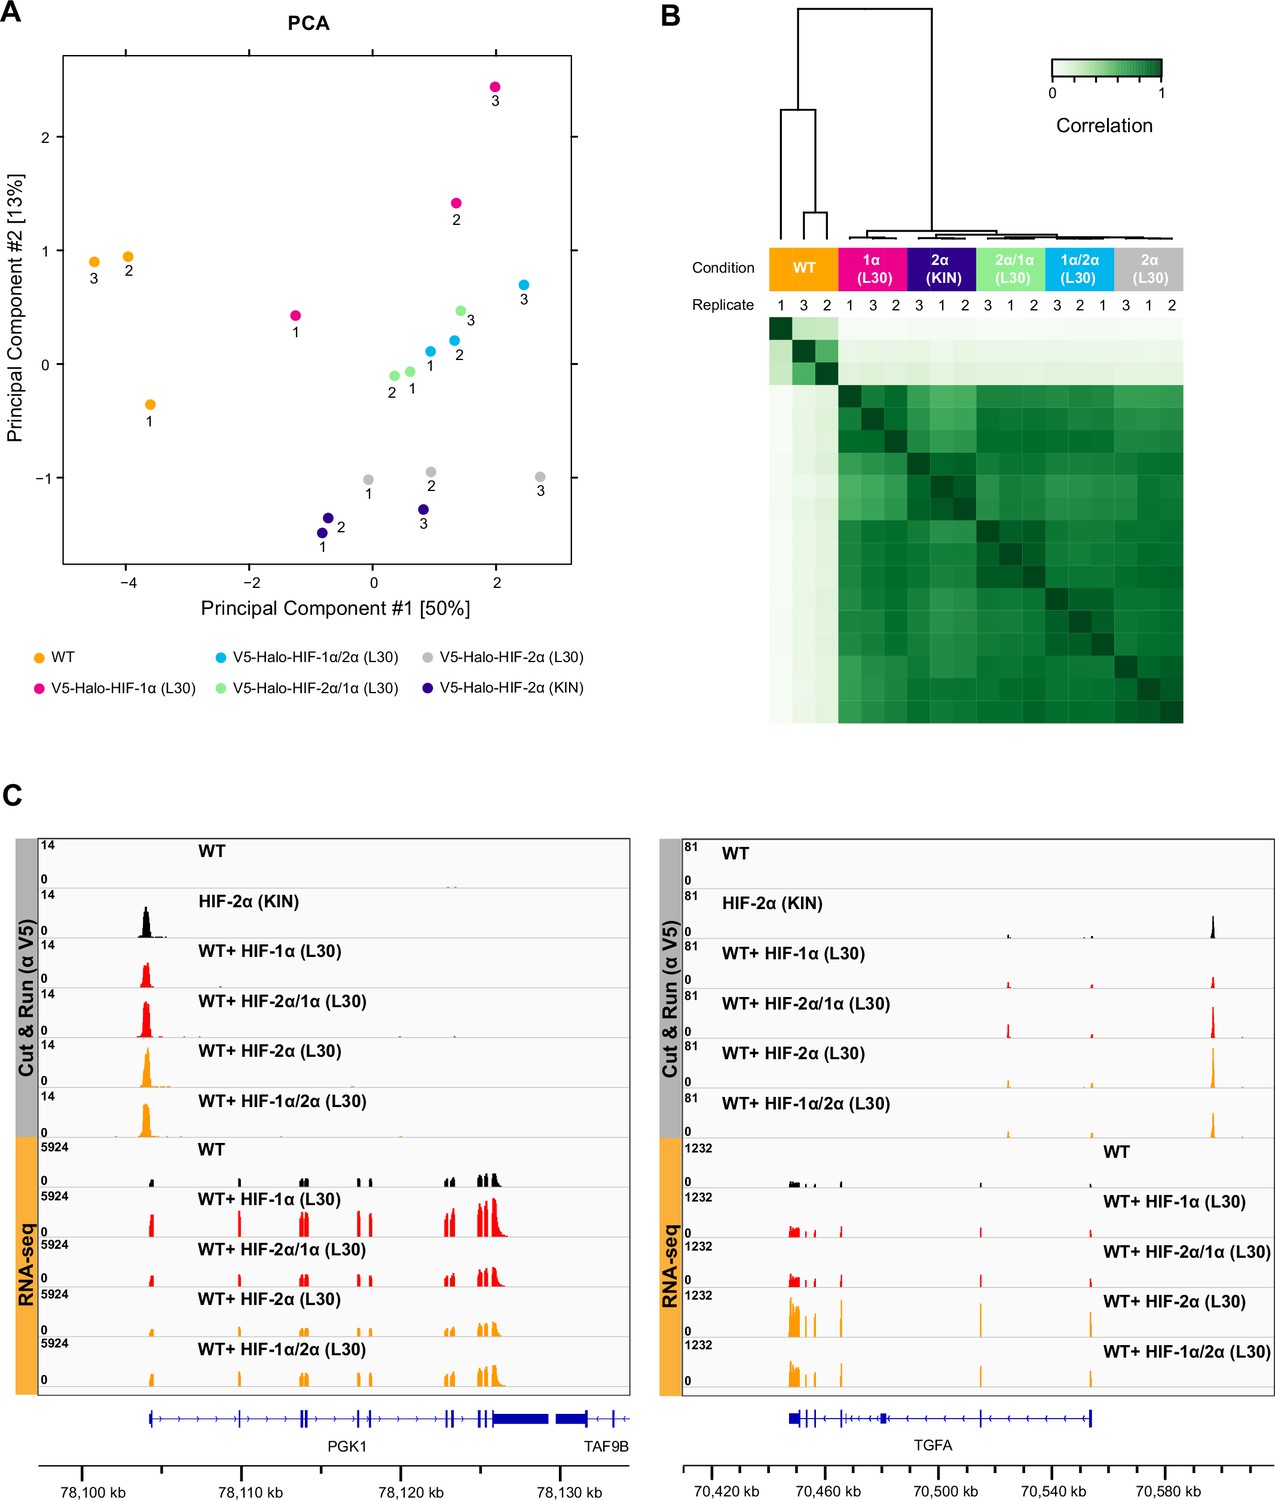
Cut&Run results show no difference in overall binding profiles between different HIF-α variants.
(A–B) Principal component analysis (PCA) (A) and clustering analysis (B) of anti-V5 Cut&Run results performed on wild-type (WT) 786-O cells, Halo-HIF-1α knock-in (KIN) clone A31, and WT cells expressing Halo-tagged HIF-α variant (-1α, -2α, -2α/1α, or -1α/2α) with L30 promoter. Except for WT control, all L30-driven HIF-α variants have very similar and close to endogenous HIF-2α binding profile. (C) Two examples of genome browser views of Cut&Run results showing all four HIF-α variants bind to the same sites with similar strength, even when the target genes are only upregulated by overexpression HIF-α (left, PGK-1) or HIF-2α (right, TGFA).
Figure 6—figure supplement 2
Additional examples showing that HIF-α intrinsically disordered region (IDR) contributes to isoform-specific chromatin binding preferences.
(A) Two additional examples of genes that are activated by HIF-1α and -2α/1α overexpression, and also have elevated binding by HIF-1α and -2α/1α at regulatory sites (dashed boxes). (B) Two additional examples of genes that are activated by HIF-2α and -1α/2α overexpression, and also have elevated binding by HIF-2α and -1α/2α at regulatory sites (dashed boxes).
Figure 6—figure supplement 3
Results from analyzing Cut&Run individual replicates showing reproducibility.
(A–C) Same analyses as for the combined replicates in Figure 6C were performed for Cut&Run individual replicates.
Figure 7

RNA-seq analysis shows HIF-α isoform-specific gene regulation is intrinsically disordered region (IDR)-dependent.
(A–B) Principle component analysis (PCA) (A) and clustering (B) of RNA-seq results performed on wild-type (WT) 786-O cells, and cells expressing Halo-tagged HIF-α variants driven by an L30 promoter. HIF-α variants sharing the same IDR (-1α and -2α/1α or -2α and -1α/2α) have similar gene expression profiles. (C) DESeq2 output summarizing pair-wise comparison of the number of differentially expressed genes (DEG) in WT cells and cells overexpressing various HIF-α forms.
Figure 8
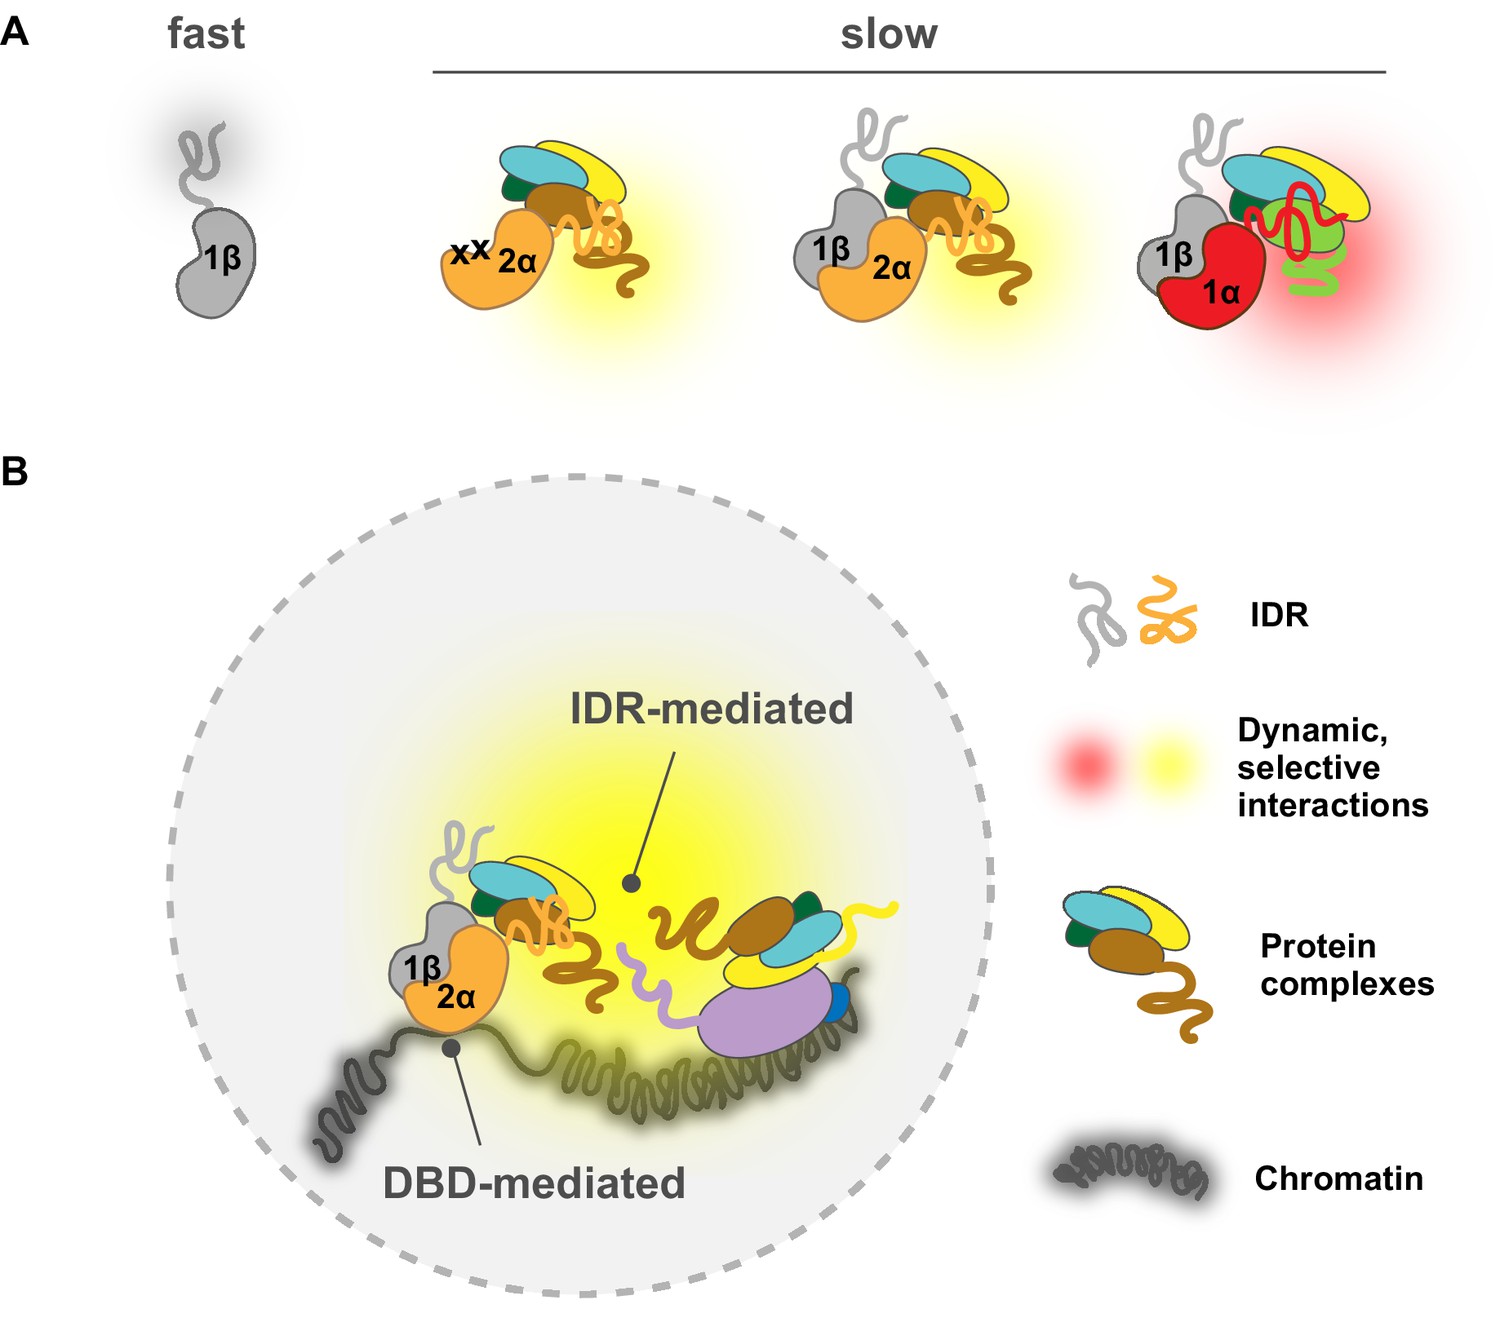
A model for intrinsically disordered region (IDR)-mediated nuclear search and chromatin binding.
(A) The HIF-α IDR determines its slow motion of both the HIF-α monomer and HIF-α/β dimer, likely by HIF-α IDR-mediated interactions with nuclear macromolecules. For HIF-α, the IDR thus determines its slow motion regardless of its dimerization status. For HIF-1β, dimerization slows it down due to extra interactions (yellow and red clouds) brought by HIF-α IDR. (Β) HIF-chromatin engagement comprises two components: DNA-binding domain (DBD)- and IDR-mediated interactions. As an obligated dimer, the DBD and the dimerization domain are both necessary for HIF binding, but the IDR determines the bound fraction, possibly via its interaction with nearby macromolecules, including other proteins and/or nucleic acids (DNA and/or RNA).
Tables
Table 1
Constructs used to generate stable cell lines.
| Name | Promoter | Gene product | Short name in the paper | Appeared in |
|---|---|---|---|---|
| PB EF1a 3XF EX-MCS IRES Puro | EF1a | 3xFLAG tag | 3xF | Figure 3 |
| PB EF1a 3XF-GDGAGLIN-hEPAS1 IRES Puro | EF1a | HIF-2α N-terminally fused with 3xFLAG tag through a short peptide linker sequence (GDGAGLIN) | HIF-2α | Figure 2 Figure 3 Figure 2—figure supplement 2 |
| PB EF1a 3XF-GDGAGLIN-hEPAS1_R171A-V192D IRES Puro | EF1a | HIF-2α dimerization mutant (R171A-V192D) N-terminally fused with 3xFLAG tag through a short peptide linker sequence (GDGAGLIN) | HIF-2α DM | Figure 2 Figure 2—figure supplement 2 |
| PB EF1a 3XF-EPAS1_365 IRES Puro | EF1a | The N terminal region of HIF-2α (aa 1–365)N-terminally fused with 3xFLAG tag | HIF-2α NT | Figure 3—figure supplement 2 |
| PB EF1a 3XF-EPAS1_365–364_HIF1a IRES Puro | EF1a | HIF-2α/1α chimera protein (aa 1–365 of HIF-2α and aa 364–826 of HIF-1α) N-terminally fused with 3xFLAG tag | HIF-2α/1α | Figure 3 |
| PB EF1a 3XF-GDGAGLIN-hHIF1a IRES Puro | EF1a | HIF-1α N-terminally fused with 3xFLAG tag through a short peptide linker sequence (GDGAGLIN) | HIF-1α | Figure 3 |
| PB EF1a 3XF-HIF1a_363 IRES Puro | EF1a | The N terminal region of HIF-1α (aa 1–363) N-terminally fused with 3xFLAG tag | HIF-1α NT | Figure 3—figure supplement 2 |
| PB EF1a 3XF-HIF1a_363–366_EPAS1 IRES Puro | EF1a | HIF-1α/2α chimera protein (aa 1–363 of HIF-1α and aa 366–870 of HIF-2α) N-terminally fused with 3xFLAG tag | HIF-1α/2α | Figure 3 |
| PB L30prom V5-Halo-GDGAGLIN-hEPAS1 IRES Puro | L30 | HIF-2α N-terminally fused with V5-HaloTag through a short peptide linker sequence (GDGAGLIN) | Halo-HIF-2α (L30) | Figure 4 Figure 4—figure supplement 2 |
| PB L30prom V5-Halo-GDGAGLIN-hEPAS1_365–364_HIF1a IRES Puro | L30 | HIF-2α/1α chimera protein (aa 1–365 of HIF-2α and aa 364–826 of HIF-1α) N-terminally fused with V5-HaloTag through a short peptide linker sequence (GDGAGLIN) | Halo-HIF-2α/1α (L30) | Figure 4 |
| PB L30prom V5-Halo-GDGAGLIN-hHIF1a IRES Puro | L30 | HIF-1α N-terminally fused with V5-HaloTag through a short peptide linker sequence (GDGAGLIN) | Halo-HIF-1α (L30) | Figure 4 |
| I_PB L30prom V5-Halo-GDGAGLIN-HIF1A_363–366_EPAS1 IRES Puro | L30 | HIF-1α/2α chimera protein (aa 1–363 of HIF-1α and aa 366–870 of HIF-2α) N-terminally fused with V5-HaloTag through a short peptide linker sequence (GDGAGLIN) | Halo-HIF-1α/2α (L30) | Figure 4 |
| PB L30prom V5-Halo-GDGAGLIN-hEPAS1 IRES Puro_R27E | L30 | HIF-2α DBD mutant (R27E) N-terminally fused with V5-HaloTag through a short peptide linker sequence (GDGAGLIN) | Halo-HIF-2α, R27E (L30) | Figure 5 |
| PB L30prom V5-Halo-GDGAGLIN-hHIF1a IRES Puro_R30E | L30 | HIF-1α DBD mutant (R30E) N-terminally fused with V5-HaloTag through a short peptide linker sequence (GDGAGLIN) | Halo-HIF-1α, R30E (L30) | Figure 5 |
| PB L30prom V5-Halo-GDGAGLIN-hEPAS1_R171A-V192D IRES Puro | L30 | HIF-2α dimerization mutant (R171A-V192D) N-terminally fused with V5-HaloTag through a short peptide linker sequence (GDGAGLIN) | Halo-HIF-2α DM (L30) | Figure 5 |
| PB L30prom V5-Halo-GDGAGLIN-hHIF1a_R170A-V191D IRES Puro | L30 | HIF-1α dimerization mutant (R170A-V191D) N-terminally fused with V5-HaloTag through a short peptide linker sequence (GDGAGLIN) | Halo-HIF-1α DM (L30) | Figure 5 |
Additional files
-
Supplementary file 1
Summary of sample sizes and estimated key parameter values for all fSPT experiments.
- https://cdn.elifesciences.org/articles/75064/elife-75064-supp1-v2.xlsx
-
Supplementary file 2
Coordinates of HIF-1α responsive sites.
- https://cdn.elifesciences.org/articles/75064/elife-75064-supp2-v2.xlsx
-
Supplementary file 3
Coordinates of HIF-2α responsive sites.
- https://cdn.elifesciences.org/articles/75064/elife-75064-supp3-v2.xlsx
-
Transparent reporting form
- https://cdn.elifesciences.org/articles/75064/elife-75064-transrepform1-v2.pdf
Download links
A two-part list of links to download the article, or parts of the article, in various formats.
Downloads (link to download the article as PDF)
Open citations (links to open the citations from this article in various online reference manager services)
Cite this article (links to download the citations from this article in formats compatible with various reference manager tools)
Mechanisms governing target search and binding dynamics of hypoxia-inducible factors
eLife 11:e75064.
https://doi.org/10.7554/eLife.75064


