Chinese natural compound decreases pacemaking of rabbit cardiac sinoatrial cells by targeting second messenger regulation of f-channels
- Department of Biosciences, The Cell Physiology Lab and “Centro Interuniversitario di Medicina Molecolare e Biofisica Applicata”, Università degli Studi di Milano, Italy
- Department of Physiology and Pathophysiology, School of Basic Medical Science, Tianjin Medical University, China
- School of Integrative Medicine, Tianjin University of Traditional Chinese Medicine, China
- College of Pharmaceutical Sciences, Zhejiang University, China
- Institute of Traditional Chinese Medicine Tianjin University of Traditional Chinese Medicine, China
Figures
Figure 1
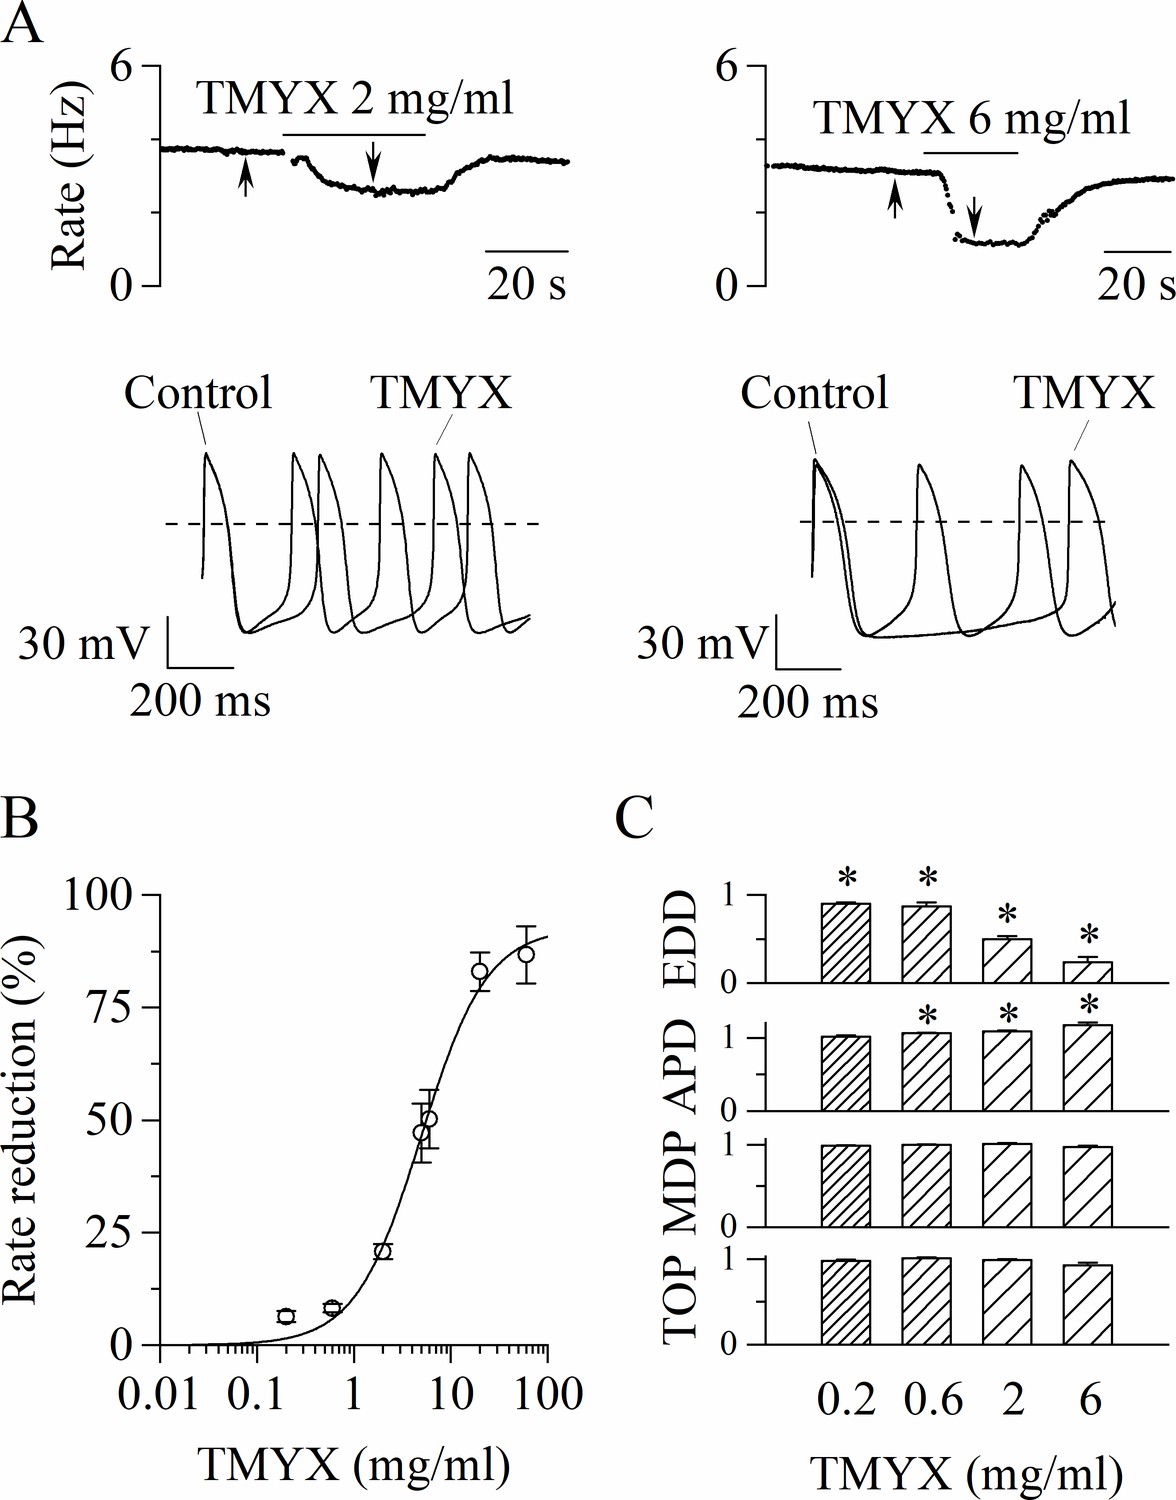
Tongmai Yangxin (TMYX) reduces the spontaneous rate of rabbit sinoatrial node (SAN) myocytes.
(A) Representative time-courses (top) and sample traces (bottom) of spontaneous action potentials (APs) recorded from rabbit SAN cells in control conditions and in the presence of TMYX (2 and 6 mg/ml). Here and in other figures the arrows indicate the time of recording of the sample traces. (B) Dose-response relationship of the AP rate reduction induced by TMYX; each point represents the mean ± SEM% value obtained at the following doses: 0.2, 0.6, 2, 5, 6, 20, 60 mg/ml (n = 68). The Hill fitting (full line, y = ymax/(1+(k/x)h)) yielded the following values: ymax = 92.7%, k = 4.9 mg/ml, and h = 1.3. (C) Summary of the effects of TMYX on the AP parameters (n = 7–12, details in the Materials and methods) normalized to the corresponding control values. Statistical analysis was carried out prior to normalization, *p < 0.01 vs. control (Student’s paired t-test). Data related to this figure are available in Figure 1—source data 1.
-
Figure 1—source data 1
Quantification and statistics of TMYX effect on spontaneous activity (APs) recorded from single sinoatrial node cells.
- https://cdn.elifesciences.org/articles/75119/elife-75119-fig1-data1-v1.xlsx
Figure 2 with 2 supplements
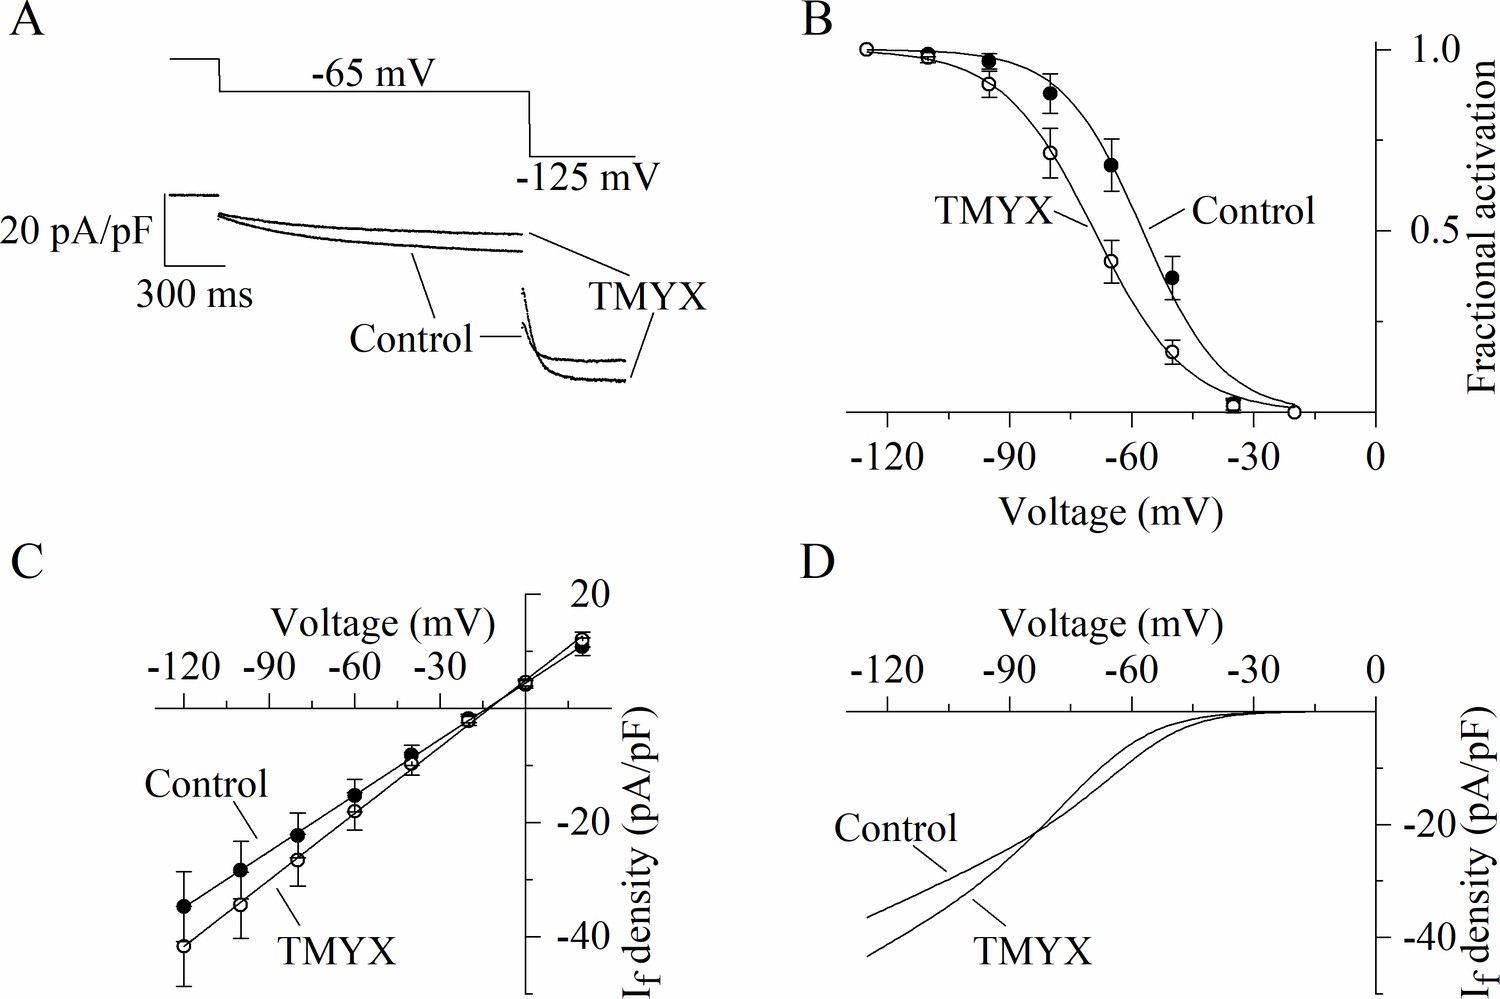
Dual action of Tongmai Yangxin (TMYX) on the voltage dependence and maximal conductance of the If current.
(A) Representative whole-cell currents elicited by a double-step protocol (–65 mV/1.5 s and –125 mV/0.5 s; holding potential –35 mV) before (control) and during drug (TMYX 6 mg/ml) perfusion. (B) Voltage-dependent activation curves obtained in control conditions (filled circles) and during TMYX perfusion (empty circles). Boltzmann fitting (full lines, y = 1/(1 + exp((V−V½)/s))) of mean fractional activation values (n = 7 cells) yielded the following half-activation (V½) and inverse-slope factors (s) parameters: –57.3 and 9.8 mV (control) and –69.2 and 11.3 mV (TMYX); the shift caused by TMYX is statistically significant (p < 0.01, extra sum-of-squares F test). (C) Mean fully activated current/voltage (I/V) relations measured before (filled circles) and during drug perfusion (empty circles, n = 5 cells). Linear fitting yielded reversal potentials of –13.6 and –12.7 mV and slopes of 0.328 and 0.389 (pA/pF)/mV in control and in the presence of TMYX, respectively; the slopes are significantly different (p < 0.01, linear regression analysis test). (D) Steady-state I/V fitting curves obtained by multiplying the activation curves (Boltzmann fitting, panel B) and fully activated I/V relation (linear fitting, panel C) in control condition and in the presence of the drug. Data related to this figure are available in Figure 2—source data 1.
-
Figure 2—source data 1
Quantification and statistics of TMYX (6 mg/ml) effect on the voltage-dependence and fully-activated I/V properties of the funny current.
- https://cdn.elifesciences.org/articles/75119/elife-75119-fig2-data1-v1.xlsx
Figure 2—figure supplement 1
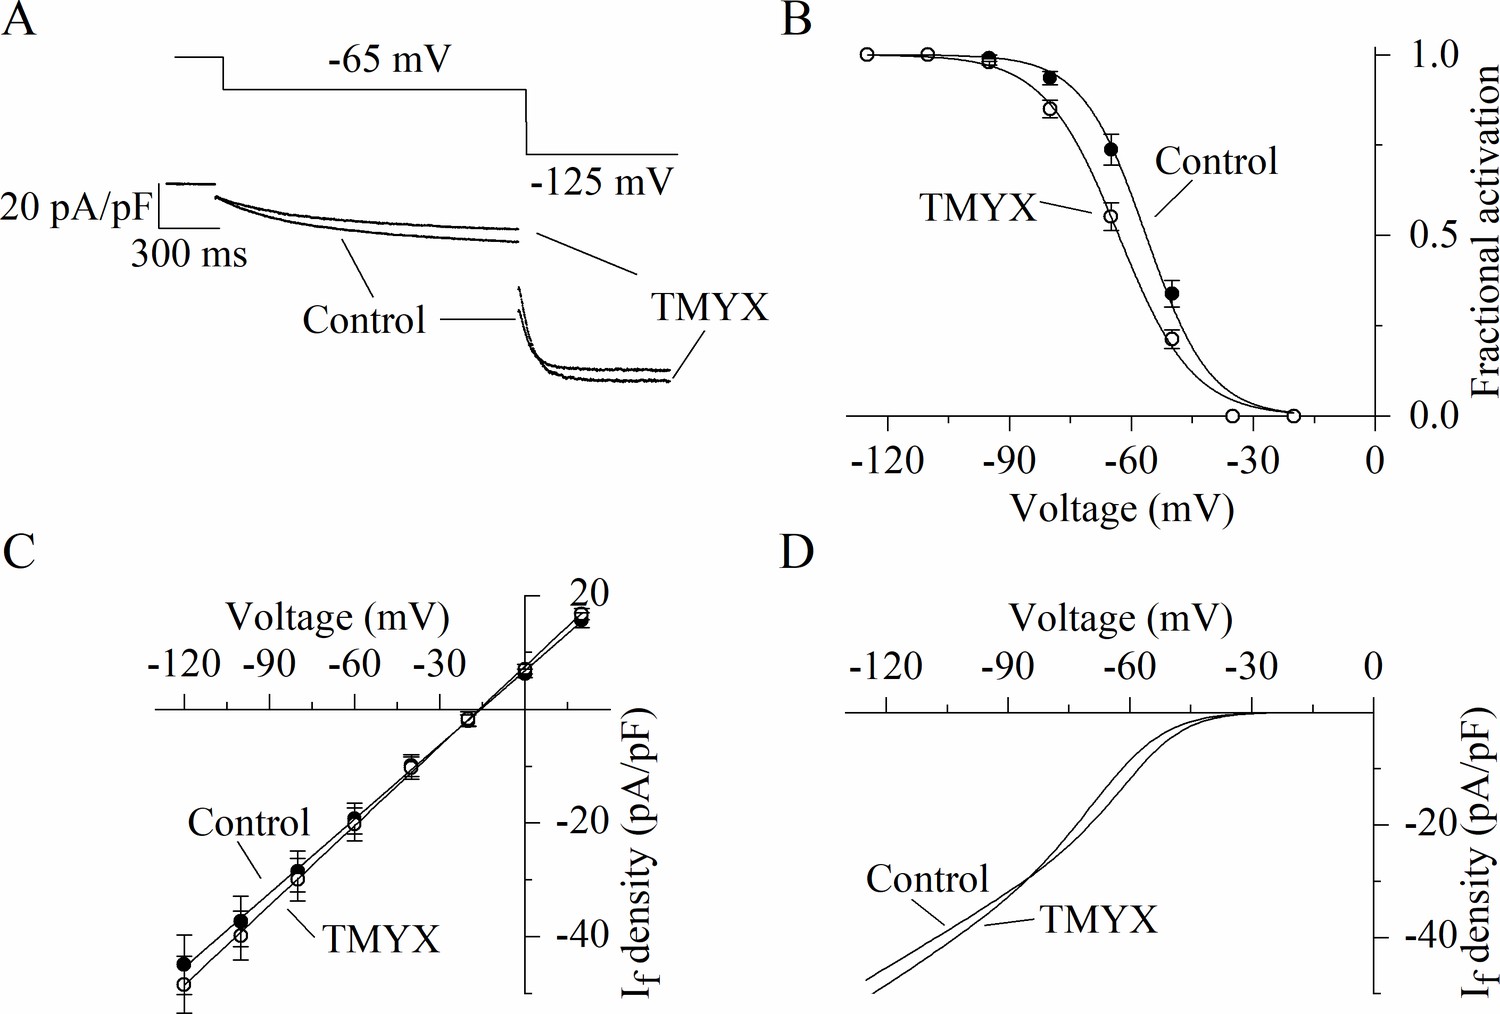
Dual action of Tongmai Yangxin (TMYX) (2 mg/ml) on the voltage dependence and maximal conductance of the If current.
(A) Representative whole-cell currents (bottom) elicited by a double-step protocol (top, –65 mV/1.5 s and –125 mV/0.5 s from a holding potential of –35 mV) in control condition and during TMYX (2 mg/ml) perfusion. (B) Voltage-dependent activation curves obtained in control condition and during TMYX perfusion; each data point represents the mean ± SEM fractional activation value at the voltages indicated (n = 6 cells). Fitting of data by the Boltzmann equation (continuous lines) yielded half-activation values (V½) and inverse-slope factors (s) of –56.4 and 7.9 mV in control and –63.1 and 9.2 mV in the presence of TMYX; curves are significantly shifted (p < 0.01, extra sum-of-squares F test). (C) Mean fully activated current/voltage (I/V) relations measured before and during drug perfusion (n = 6 cells). The slope of the linear regression fitting in the presence of TMYX was significantly increased (+7.5%, p < 0.01, linear regression analysis test). (D) Steady-state fitting currents obtained by multiplying the continuous lines shown in panels B (activation curves: Boltzmann fitting) and C (fully activated I/V relation: linear fitting) in control condition and in the presence of the drug. At potentials more positive than the cross-over point (–85 mV), the contribution of the negative shift induced by TMYX (2 mg/ml) is greater than the increment in conductance, while the opposite occurs at more negative potentials. In the pacemaker range of potentials TMYX has the net effect of reducing the contribution of the If current to the diastolic depolarization. Data related to this figure are available in Figure 2—figure supplement 1—source data 1.
-
Figure 2—figure supplement 1—source data 1
Quantification and statistics of TMYX (2 mg/ml) effect on the voltage-dependence and fully-activated I/V properties of the funny current.
- https://cdn.elifesciences.org/articles/75119/elife-75119-fig2-figsupp1-data1-v1.xlsx
Figure 2—figure supplement 2
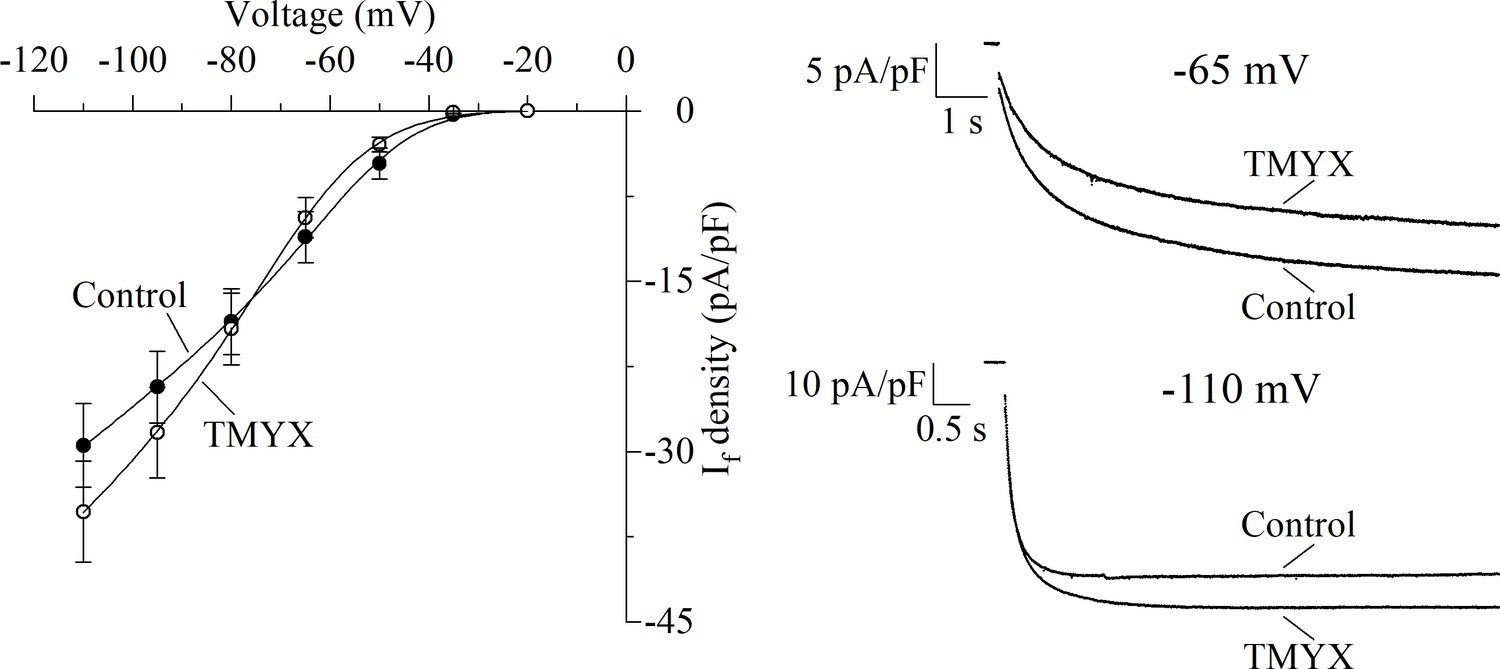
Effects of Tongmai Yangxin (TMYX) (6 mg/ml) on the voltage dependence of the steady-state If current measured at different voltages.
Left: Mean ± SEM steady-state current/voltage relation obtained from n = 7 cells in control (filled circles) and during TMYX perfusion (empty circles). Currents were elicited by a train of eight hyperpolarizing steps encompassing the voltage range −20/–110 mV (ΔV between steps, –15 mV); step durations were longer at more depolarized potentials to ensure attainment of complete steady-state. Continuous lines through data points represent the best fitting procedures (obtained using the following equation: Idensity=(a*V + b)*(1/ (1+ exp((V−V½)/s)))) which describes the product of a Boltzmann relation times the fully activated I/V relation. Best fitting yielded the following values: a, 0.339 and 0.394 (pA/pF)/mV; b, 7.663 and 7.296 mV; V½, –51.4 and –64.3 mV; s, 10.2 and 11.5 mV, respectively for control and TMYX conditions. Right: Representative sample traces recorded in control condition and in the presence of TMYX (6 mg/ml) at two different potentials (–65 and –110 mV). In the diastolic depolarization voltage range the net effect of TMYX is a reduction of the If current. Data related to this figure are available in Figure 2—figure supplement 2—source data 1.
-
Figure 2—figure supplement 2—source data 1
Quantification of TMYX (6 mg/ml) effect on the voltage-dependence of the steady-state funny current.
- https://cdn.elifesciences.org/articles/75119/elife-75119-fig2-figsupp2-data1-v1.xlsx
Figure 3 with 2 supplements
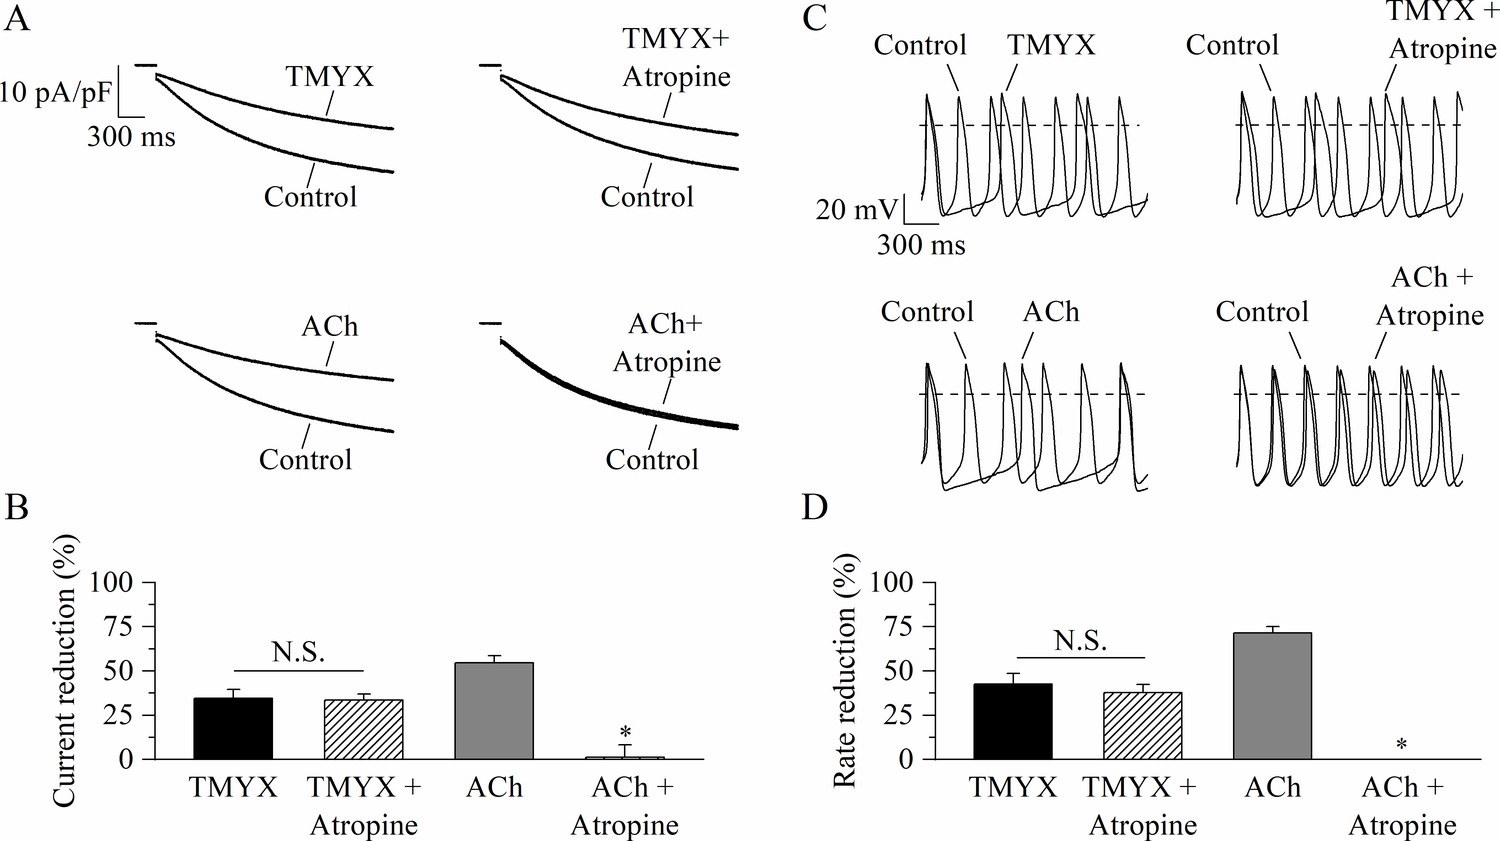
Tongmai Yangxin (TMYX) action does not involve muscarinic receptor activation.
(A) Representative sample current traces recorded during steps to –65 mV in the presence and in the absence of TMYX (6 mg/ml, top) and acetylcholine (ACh) (1 µM, bottom) delivered alone (left) or in combination with atropine (10 µM, right). (B) Mean ± SEM steady-state current reduction. Atropine did not modify the action of TMYX (TMYX, –34.6 ± 4.9%; TMYX + atropine, –33.5 ± 3.4%, n = 6) but abolished the effect of ACh (ACh, –54.7 ± 4.0%; ACh+ atropine, 1.2% ± 6.9%, n = 6). N.S. Not significant, p = 0.594; *p < 0.01 vs. ACh (Student’s paired t-test). (C) Representative action potentials (APs) recorded in the same condition as in panel A. (D) Mean ± SEM rate reduction. Atropine did not reduce the ability of TMYX to induce cell bradycardia (TMYX, –42.6 ± 5.8%; TMYX + atropine, –37.6 ± 4.8%, n = 6), but abolished the action of ACh (71.5 ± 3.6%) (n = 7). N.S. Not significant, p = 0.807; *p < 0.01 vs. ACh (Student’s paired t-test). Data related to this figure are available in Figure 3—source data 1.
-
Figure 3—source data 1
Quantification and statistics of TMYX (6 mg/ml) effect on rate and on the funny current amplitude in the presence and in the absence of muscarinic block.
- https://cdn.elifesciences.org/articles/75119/elife-75119-fig3-data1-v1.xlsx
Figure 3—figure supplement 1
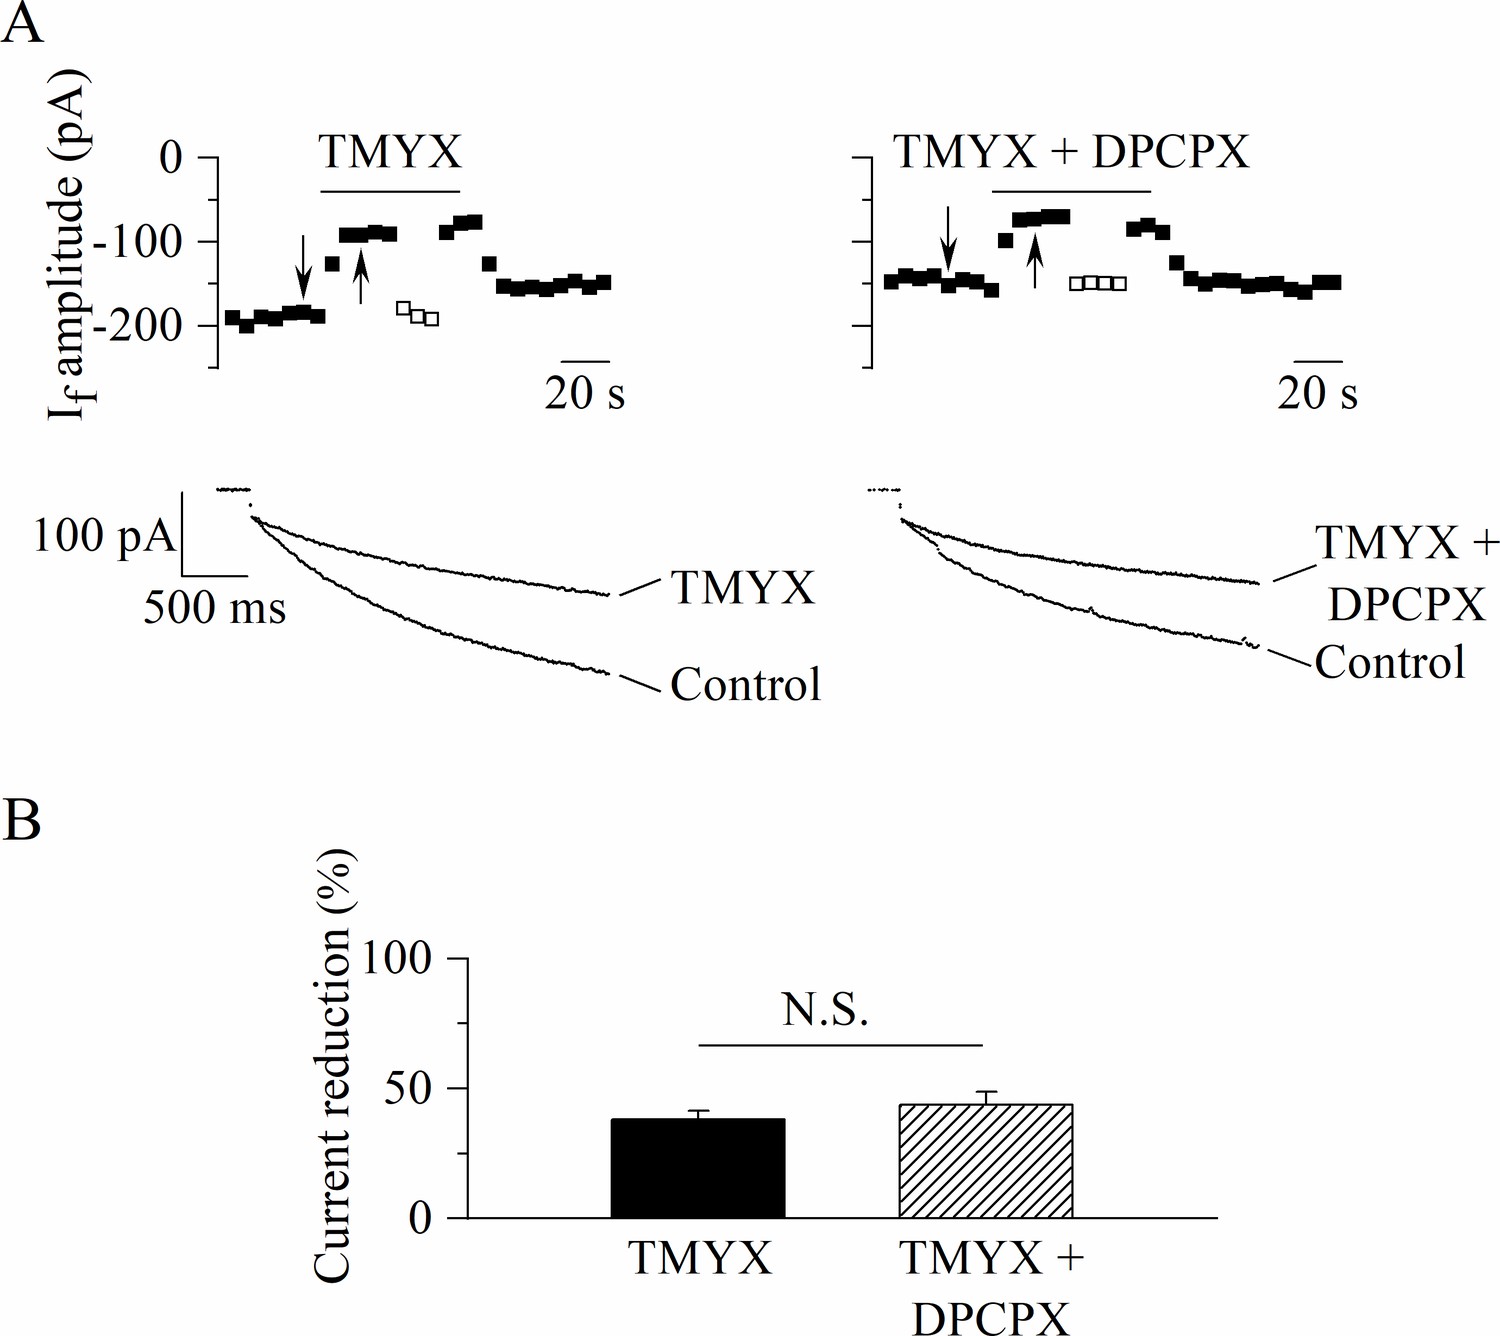
The action of Tongmai Yangxin (TMYX) is not mediated by the activation of the adenosine receptor.
(A) Representative steady-state time-courses (top) and sample current traces (bottom) recorded at –65 mV for 2.75 s (holding potential, –35 mV) in control condition and in the presence of TMYX (6 mg/ml, left) delivered alone or in combination with the adenosine A1-receptor blocker 1,3-dipropyl-8-cyclopentylxanthine (DPCPX) (1 µM, right). Empty squares represent steady-state current amplitudes recorded during manual adjustment (hyperpolarization) of the holding potential to compensate for the effect of the drugs. (B) Bar-graph of the steady-state current reduction (mean ± SEM %, n = 6): TMYX, –38.1 ± 3.5%; TMYX + DPCPX, –43.6 ± 5.2%. N.S. Not significant, p = 0.111 (Student’s paired t-test). Data related to this figure are available in Figure 3—figure supplement 1—source data 1.
-
Figure 3—figure supplement 1—source data 1
Quantification and statistics of TMYX (6 mg/ml) effect on the funny current in the presence and in the absence of the adenosine receptor block.
- https://cdn.elifesciences.org/articles/75119/elife-75119-fig3-figsupp1-data1-v1.xlsx
Figure 3—figure supplement 2
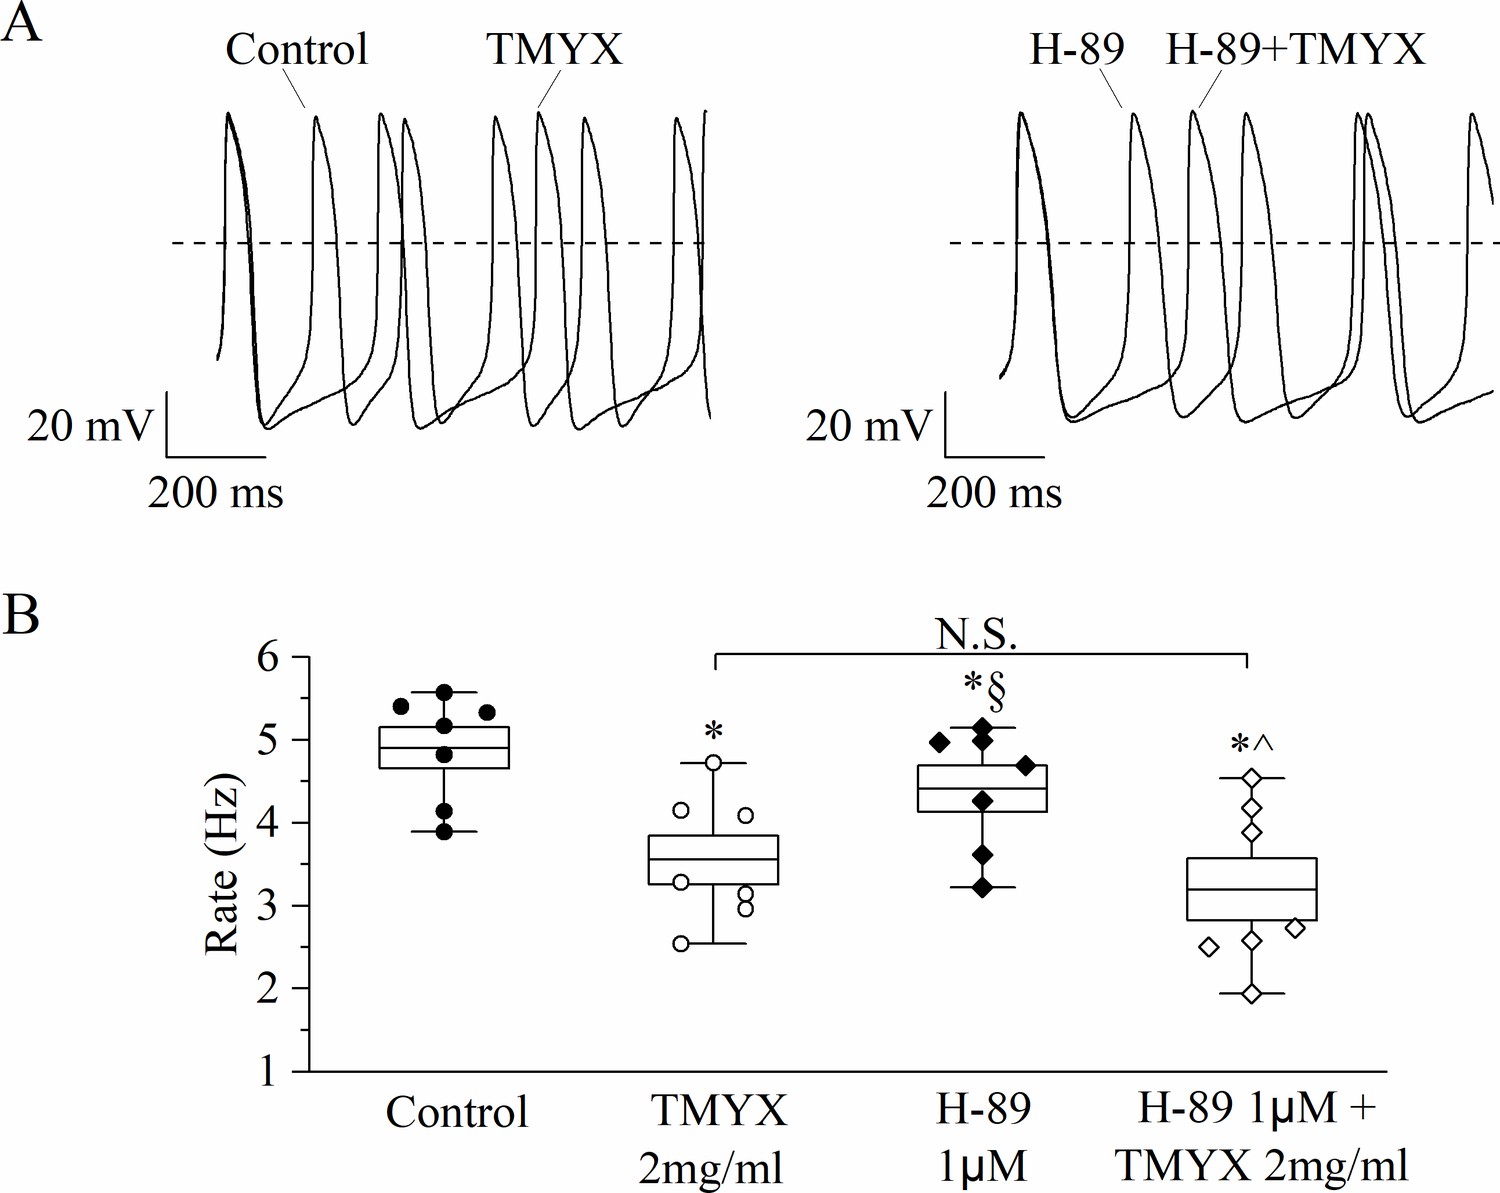
The action of Tongmai Yangxin (TMYX) is not mediated by PKA activation.
(A) Representative sample traces of spontaneous action potentials (APs) showing the effect of TMYX (2 mg/ml) in control condition (left) and in the presence of the PKA blocker H-89 (1 µM, right). (B) The box chart plot shows the spontaneous rate of APs (Hz) recorded in the conditions shown in panel A (n = 7 cells; control, 4.9 ± 0.2; TMYX, 3.6 ± 0.3; H-89, 4.4 ± 0.3; H-89+ TMYX, 3.2 ± 0.4. *,§,^ indicate p < 0.05, * vs. control; § vs. TMYX; ^ vs. H89). In the box, the middle line represents the mean value, the extremities indicate the SEM, and the whiskers are the maximum and minimum values. Statistical analysis was carried out using one-way ANOVA followed by Fisher’s LSD post hoc test for repeated measurements. Data related to this figure are available in Figure 3—figure supplement 2—source data 1.
-
Figure 3—figure supplement 2—source data 1
Quantification and statistics of TMYX (2 mg/ml) effect on APs in the presence of the PKA blocker H-89.
- https://cdn.elifesciences.org/articles/75119/elife-75119-fig3-figsupp2-data1-v1.xlsx
Figure 4 with 1 supplement

The Tongmai Yangxin (TMYX)-induced reduction of the whole-cell If is counteracted by increasing concentrations of intracellular cAMP.
(A) Representative time-courses (left) of the steady-state amplitudes of the current recorded at –65 mV/2.75 s (sample traces, right) in control conditions and in the presence of TMYX (6 mg/ml). Experiments were carried out in the absence (top, n = 15), and in the presence of 10 µM (middle, n = 6) and 100 µM (bottom, n = 6) cAMP in the pipette intracellular solution. Empty squares in top and middle panels indicate steady-state currents recorded after manual adjustment of the holding level (ΔV) to compensate for the inhibitory effect induced by TMYX. (B) Bar-graph of the TMYX-induced current reductions (mean ± SEM%) obtained in the three different conditions: TMYX/basal cAMP, –49.1 ± 3.0%, n = 15; TMYX + cAMP 10 µM, –37.9 ± 5.1%, n = 6; TMYX + cAMP 100 µM, –2.3 ± 3.3%, n = 6. *p = 0.049 cAMP 10 µM vs. basal cAMP; *p < 0.01 cAMP 100 µM vs. basal cAMP; ^p < 0.01 cAMP 100 µM vs. cAMP 10 µM (one-way ANOVA followed by Fisher’s LSD post hoc test multiple comparisons). Data related to this figure are available in Figure 4—source data 1.
-
Figure 4—source data 1
Quantification and statistics of TMYX (6 mg/ml) effects on the funny current in the presence of different cAMP concentrations.
- https://cdn.elifesciences.org/articles/75119/elife-75119-fig4-data1-v1.xlsx
Figure 4—figure supplement 1
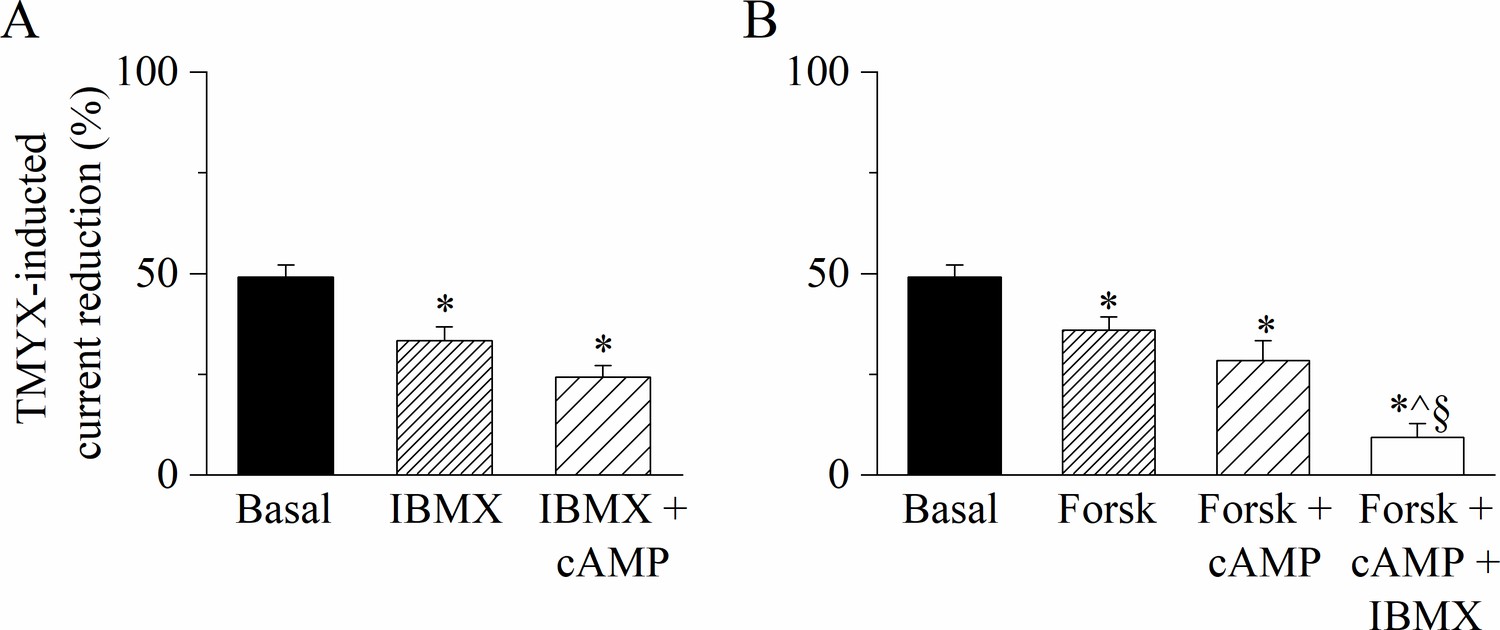
Increasing concentrations of intracellular cAMP reduce the If inhibitory action of Tongmai Yangxin (TMYX).
(A) The bar-graph illustrates the effects of TMYX (6 mg/ml) on the whole-cell If current (elicited at –65 mV) assessed in basal condition, in the presence of the phosphodiesterase inhibitor 3-isobutyl-1-methylxanthine (IBMX), and of IBMX + cAMP. IBMX and cAMP (100 and 10 µM, respectively) were added to the pipette/intracellular solution, while TMYX was externally delivered. Mean ± SEM TMYX-induced current reduction (%) values were: basal, 49.1 ± 3.0%, n = 15; IBMX, 33.4 ± 3.4%, n = 10; IBMX + cAMP, 24.3 ± 2.8%, n = 4. *p < 0.01, IBMX vs. basal; *p < 0.01, IBMX+ cAMP vs. basal. (B) The bar-graph illustrates the effects of TMYX (6 mg/ml) on the whole-cell If current (elicited at –65 mV) measured in basal condition, in the presence of a stimulator of adenylyl cyclase delivered alone (Forskolin) or in combination with cAMP and cAMP + IBMX. Forskolin, cAMP, and IBMX (100, 10, and 100 µM, respectively) were added to the pipette/intracellular solution, while TMYX was externally delivered. Mean ± SEM TMYX-induced current reduction (%) values were: basal, 49.1 ± 3.0%, n = 15; Forsk, 35.9 ± 3.3%, n = 5; Forsk + cAMP, 28.5 ± 4.9%, n = 5; Forsk + cAMP + IBMX, 9.4 ± 3.4%, n = 5. *p = 0.022, Forsk vs. basal; *p < 0.01, Forsk + cAMP vs. basal; *p < 0.01, Forsk + cAMP + IBMX vs. Basal; ^p < 0.01 Forsk + cAMP + IBMX vs. Forsk; §p < 0.01, Forsk+ cAMP + IBMX vs. Forsk + cAMP. Statistical analysis was carried out using one-way ANOVA followed by Fisher’s LSD post hoc test for multiple comparisons. Data related to this figure are available in Figure 4—figure supplement 1—source data 1.
-
Figure 4—figure supplement 1—source data 1
Quantification and statistics of TMYX (2 mg/ml) effects on the funny current in the presence of increasing cAMP concentrations.
- https://cdn.elifesciences.org/articles/75119/elife-75119-fig4-figsupp1-data1-v1.xlsx
Figure 5 with 1 supplement
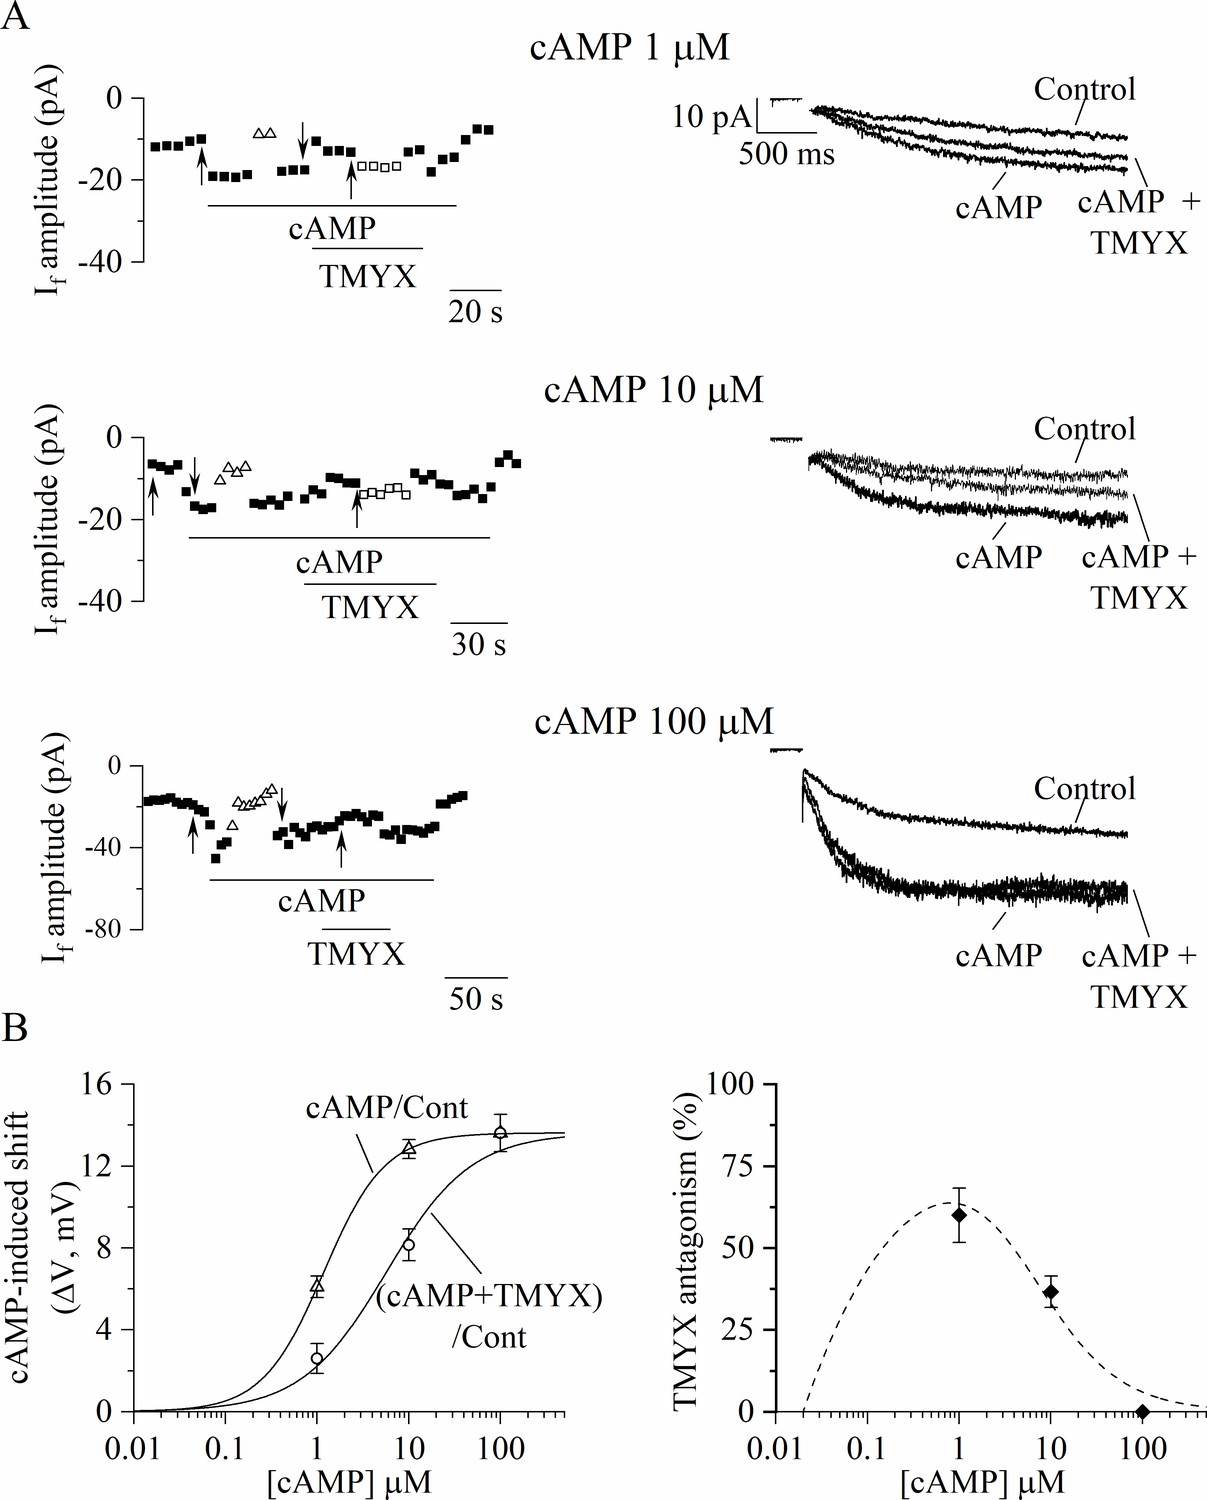
Tongmai Yangxin (TMYX) reduces the If current by antagonizing its cAMP-induced modulation.
(A) Sample time-courses (left) and current traces (right) of If amplitudes recorded in inside-out macropatches during hyperpolarizing steps (–105 mV); cAMP (1, 10, 100 µM, n = 4–6) was perfused alone (cAMP) or in combination with a fixed dose of TMYX (6 mg/ml, cAMP + TMYX). Empty triangles and squares represent current amplitudes observed after correcting the applied voltage (ΔV) to compensate for (and evaluate) both the effect of cAMP (triangles) and the ability of TMYX to reduce cAMP modulation (squares). (B) Left: cAMP-induced shifts of the If activation curve obtained in the presence of cAMP alone (cAMP/Cont, empty triangles) and of cAMP+ TMYX ((cAMP+ TMYX)/Cont, empty circles). The continuous lines represent dose-response Hill fittings of experimental data points (cAMP/Cont: k = 1.17 µM and h = 1.30; (cAMP+ TMYX)/Cont: k = 5.66 µM and h = 0.94; 13.6 mV was the maximal shift experimentally measured and was therefore taken as ymax for both conditions). (B) Right: The antagonism exerted by TMYX on cAMP action was calculated as the fractional inhibition of the If current as derived from the Hill fittings (HillcAMP/Cont−Hill(cAMP+TMYX)/Cont)/HillcAMP/Cont and from experimental points (diamond symbols, see text for details). Data related to this figure are available in Figure 5—source data 1.
-
Figure 5—source data 1
Quantification of the TMYX (6 mg/ml) ability to antagonize the cAMP-induced (dose-response) modulation of the funny current.
- https://cdn.elifesciences.org/articles/75119/elife-75119-fig5-data1-v1.xlsx
Figure 5—figure supplement 1
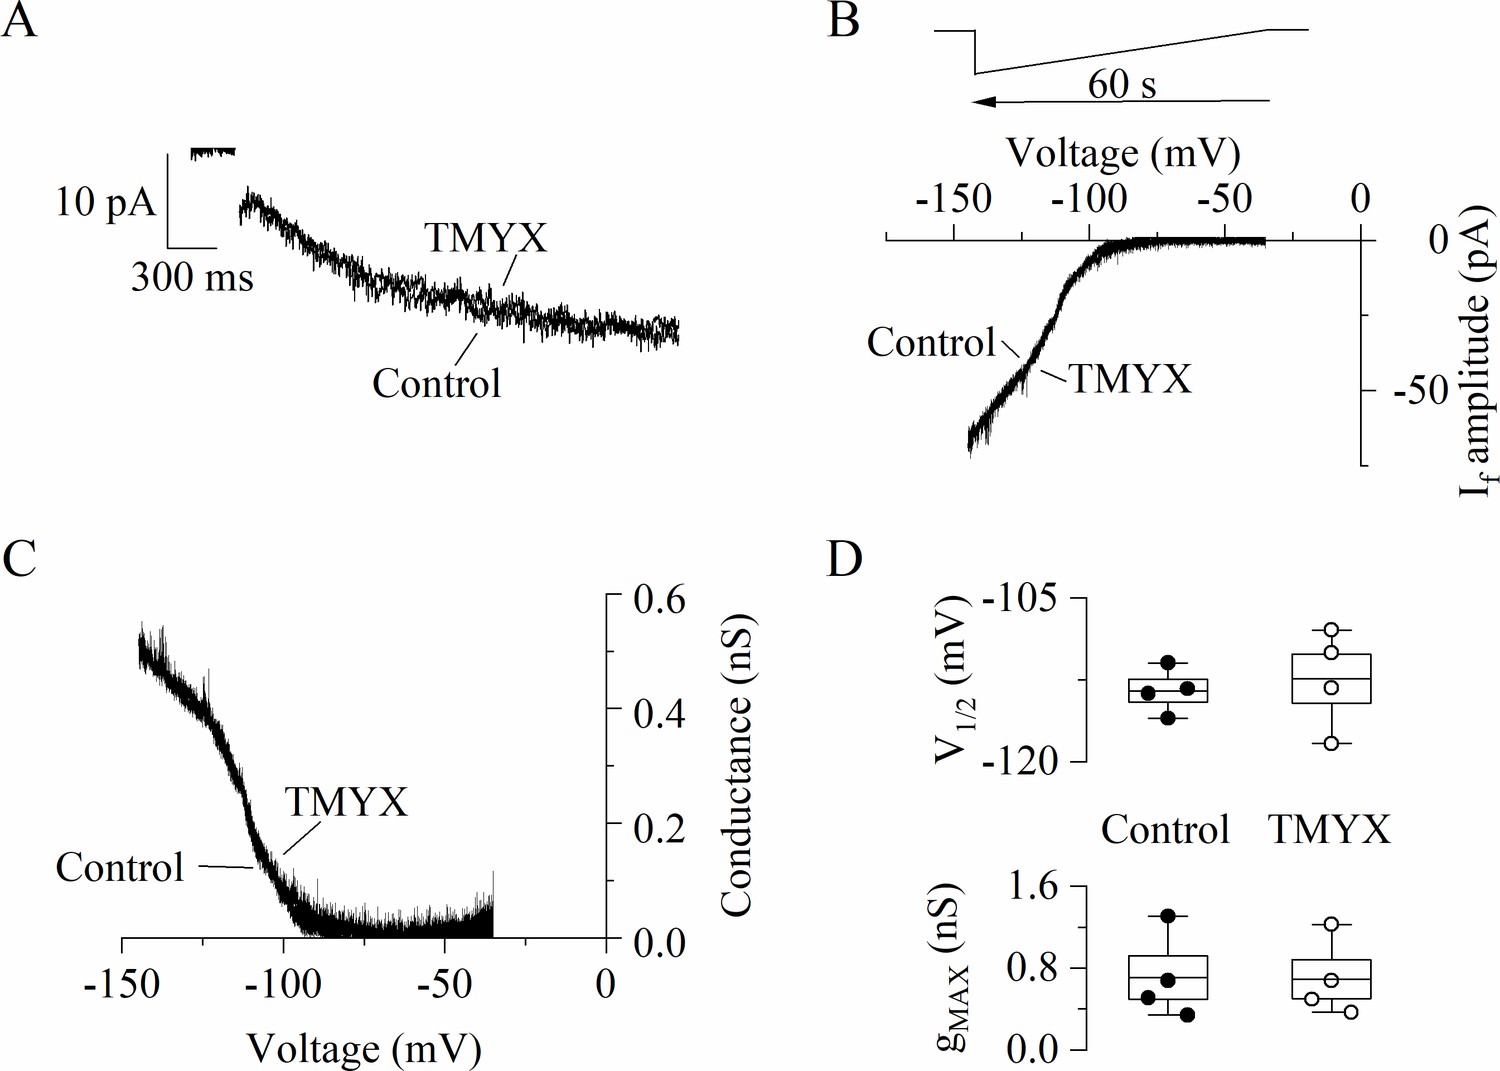
Tongmai Yangxin (TMYX) does not directly influence the intrinsic properties of f-channels.
(A) Representative If current traces recorded from an inside-out macropatch at a voltage of –105 mV (holding potential, –35 mV) in control condition and in the presence of TMYX (6 mg/ml). The same experiment was repeated in three additional patches and no significant difference in steady-state current amplitude was observed, n = 4; p = 0.12. (B,C) Representative steady-state I/V and g/V curves obtained in an inside-out macropatch sample by applying a slowly hyperpolarizing ramp (from –35 to –145 mV, rate –110 mV/min, B, top) in the absence (control) and in the presence of the drug (TMYX). (D) Box plot showing V½ (top) and gmax (bottom) values obtained from Boltzmann fitting of the g/V curves shown in panel C (n = 4 patches). In the box, the middle line represents the mean value, the extremities stand for SEM, and the whiskers are the maximum and minimum values. Statistical comparison of experimental data revealed that TMYX does not exert any modulatory action on these parameters (V½: control, –113.5 ± 1.0 mV; TMYX, –112.4 ± 2.3 mV, p = 0.451; gmax: control, 0.71 ± 0.21 nS; TMYX, 0.69 ± 0.19 nS, p = 0.528; Student’s paired t-test). Data related to this figure are available in Figure 5—figure supplement 1—source data 1.
-
Figure 5—figure supplement 1—source data 1
Quantification and statistics of TMYX (6 mg/ml) effects on the intrinsic voltage dependence and maximal conductance of the funny current.
- https://cdn.elifesciences.org/articles/75119/elife-75119-fig5-figsupp1-data1-v1.xlsx
Tables
Key resources table
| Reagent type (species) or resource | Designation | Source or reference | Identifiers | Additional information |
|---|---|---|---|---|
| Strain, strain background (Oryctolagus cuniculus) | New Zealand rabbit | Charles River | Female, 35–41 days | |
| Chemical compound, drug | Acetylcholine chloride (ACh) | Sigma-Aldrich (Merck) | A6625 | |
| Chemical compound, drug | Adenosine 3′,5′-cyclic monophosphate sodium salt monohydrate (cAMP) | Sigma-Aldrich (Merck) | A6885 | |
| Chemical compound, drug | Forskolin | Sigma-Aldrich (Merck) | F6886 | |
| Chemical compound, drug | 1,3-Dipropyl-8-cyclopentylxanthine (DPCPX) | Sigma-Aldrich (Merck) | C101 | |
| Chemical compound, drug | 3-Isobutyl-1-methylxanthine (IBMX) | Sigma-Aldrich (Merck) | I5879 | |
| Chemical compound, drug | H-89 dihydrochloride hydrate (H-89) | Sigma-Aldrich (Merck) | B1427 | |
| Software, algorithm | pClamp – Clampfit | Molecular Devices | RRID:SCR_011323 | |
| Software, algorithm | pClamp – Clampex | Molecular Devices | RRID:SCR_011323 | Version 10.7 |
| Software, algorithm | Origin | Origin Lab | RRID:SCR_014212 | OriginPro 2020 |
| Software, algorithm | Prism | GraphPad Software | RRID:SCR_002798 | Version 5 |
| Other | Tongmai Yangxin | Le Ren Tang Pharmaceutical Factory |
Additional files
Download links
A two-part list of links to download the article, or parts of the article, in various formats.
Downloads (link to download the article as PDF)
Open citations (links to open the citations from this article in various online reference manager services)
Cite this article (links to download the citations from this article in formats compatible with various reference manager tools)
Chinese natural compound decreases pacemaking of rabbit cardiac sinoatrial cells by targeting second messenger regulation of f-channels
eLife 11:e75119.
https://doi.org/10.7554/eLife.75119


