P2Y1 purinergic receptor identified as a diabetes target in a small-molecule screen to reverse circadian β-cell failure
- Department of Medicine, Division of Endocrinology, Metabolism and Molecular Medicine, Northwestern University Feinberg School of Medicine, United States
- Division of Endocrinology, Metabolism, Hematological Science and Therapeutics, Department of Bio-Signal Analysis, Yamaguchi University, Graduate School of Medicine, 1-1-1, Japan
- Ionis Pharmaceuticals, Inc, United States
- Department of Pharmacology, Alberta Diabetes Institute, University of Alberta, Canada
Figures
Figure 1
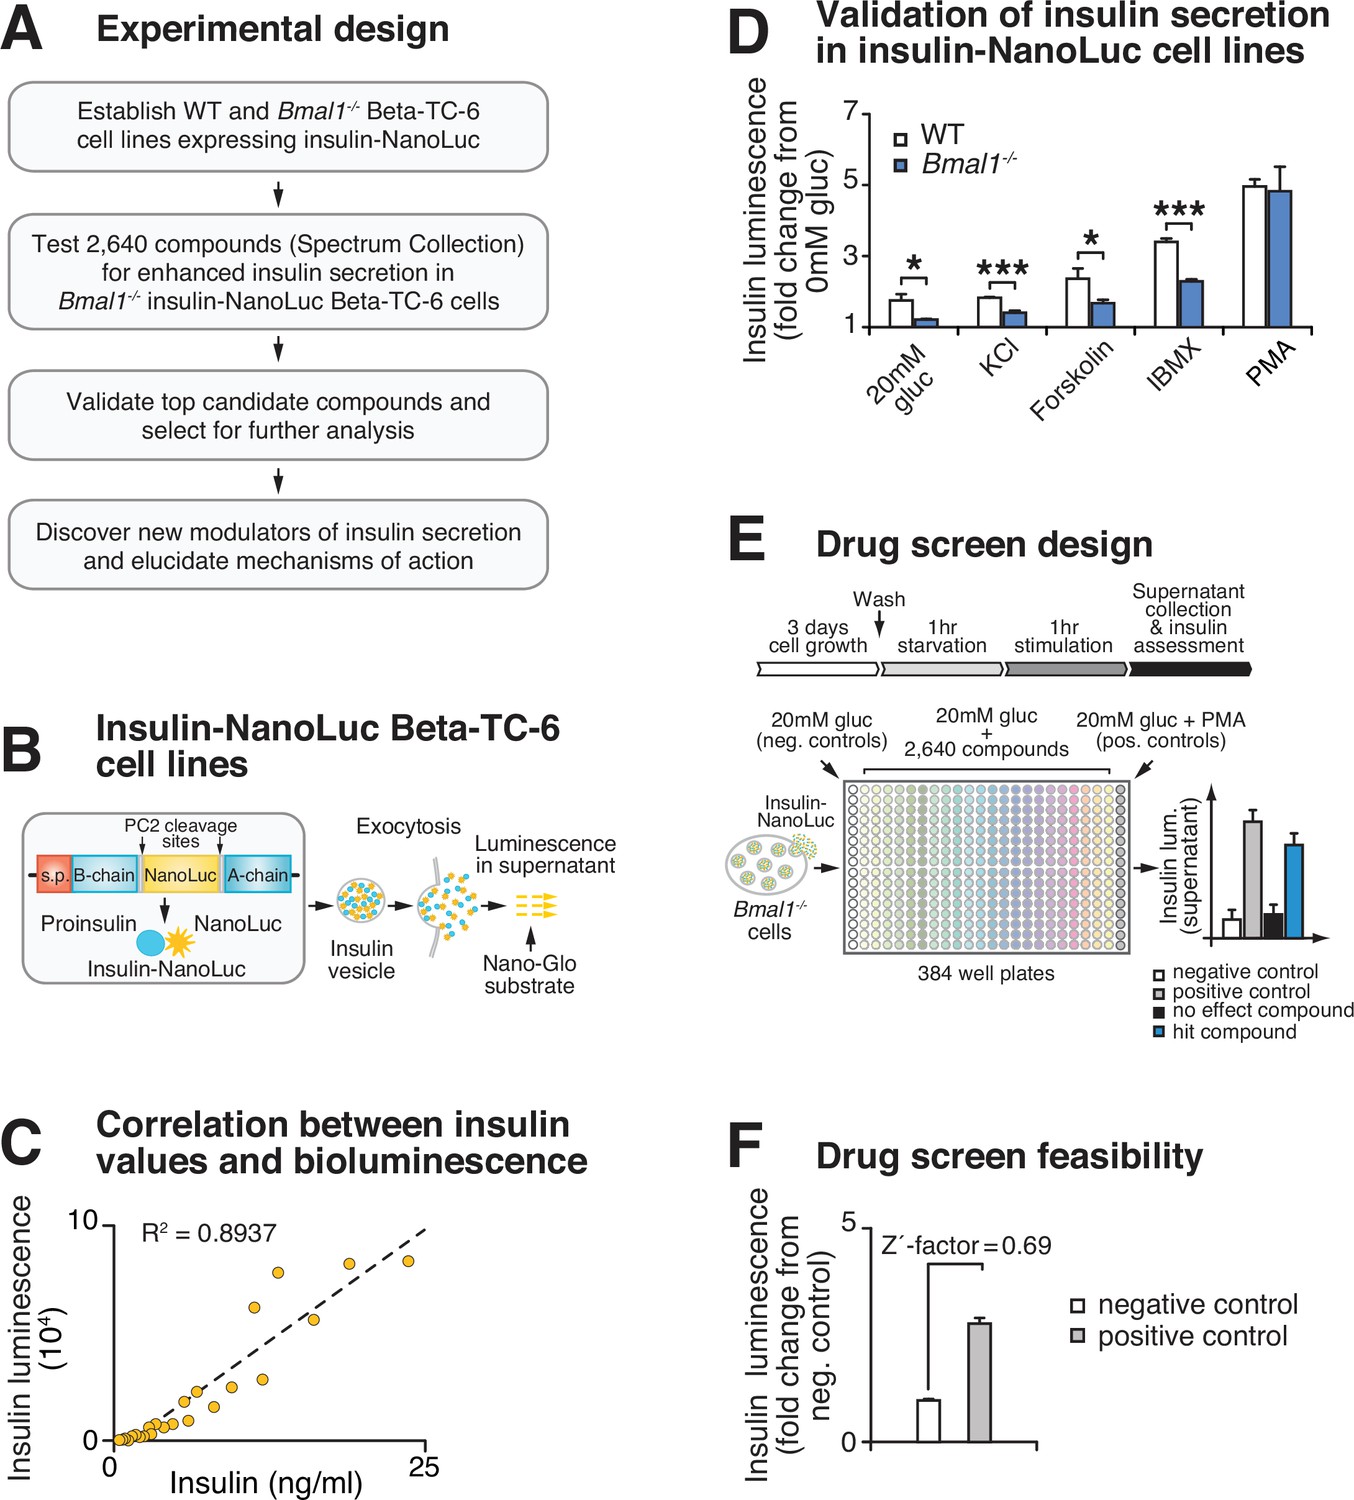
High-throughput screen for chemical modulators of insulin secretion in circadian mutant β-cells.
(A) Flow chart of ‘phenotype’-driven cell-based genetic screening platform to identify molecules and pathways that enhance insulin secretion during circadian β-cell failure. (B) Schematic of insulin-NanoLuciferase (NanoLuc) fusion construct, with bioluminescence detected in the supernatant as a proxy for insulin secretion. (C) Correlation between insulin-NanoLuc bioluminescence and insulin values measured by ELISA in response to a range of glucose concentrations (2–20 mM; R2 = 0.8937). (D) Insulin-NanoLuc bioluminescence following 1 hr exposure to 20 mM glucose, 30 mM KCl, and 20 mM glucose plus 2.5 µM forskolin, 500 µM 3-isobutyl-1-methylxanthine (IBMX), or 10 µM phorbol 12-myristate 13-acetate (PMA) in WT and Bmal1-/- insulin-NanoLuc Beta-TC-6 cells (n = 3–10 experimental repeats/condition). (E) Drug screen design. Insulin-NanoLuc-expressing Beta-TC-6 Bmal1-/- cells were plated in nine 384-well plates prior to exposure to 10 µM of each of the 2640 compounds from the Spectrum Collection in combination with 20 mM glucose. Negative (20 mM glucose alone) and positive (20 mM glucose plus 10 µM PMA) controls were included on each plate. (F) Drug screen feasibility test comparing negative (20 mM glucose only) and positive (20 mM glucose plus PMA) controls (n = 3 experimental repeats) (Z'-factor = 0.69). All values represent mean ± SEM. *p<0.05, ***p<0.001.
Figure 2 with 1 supplement
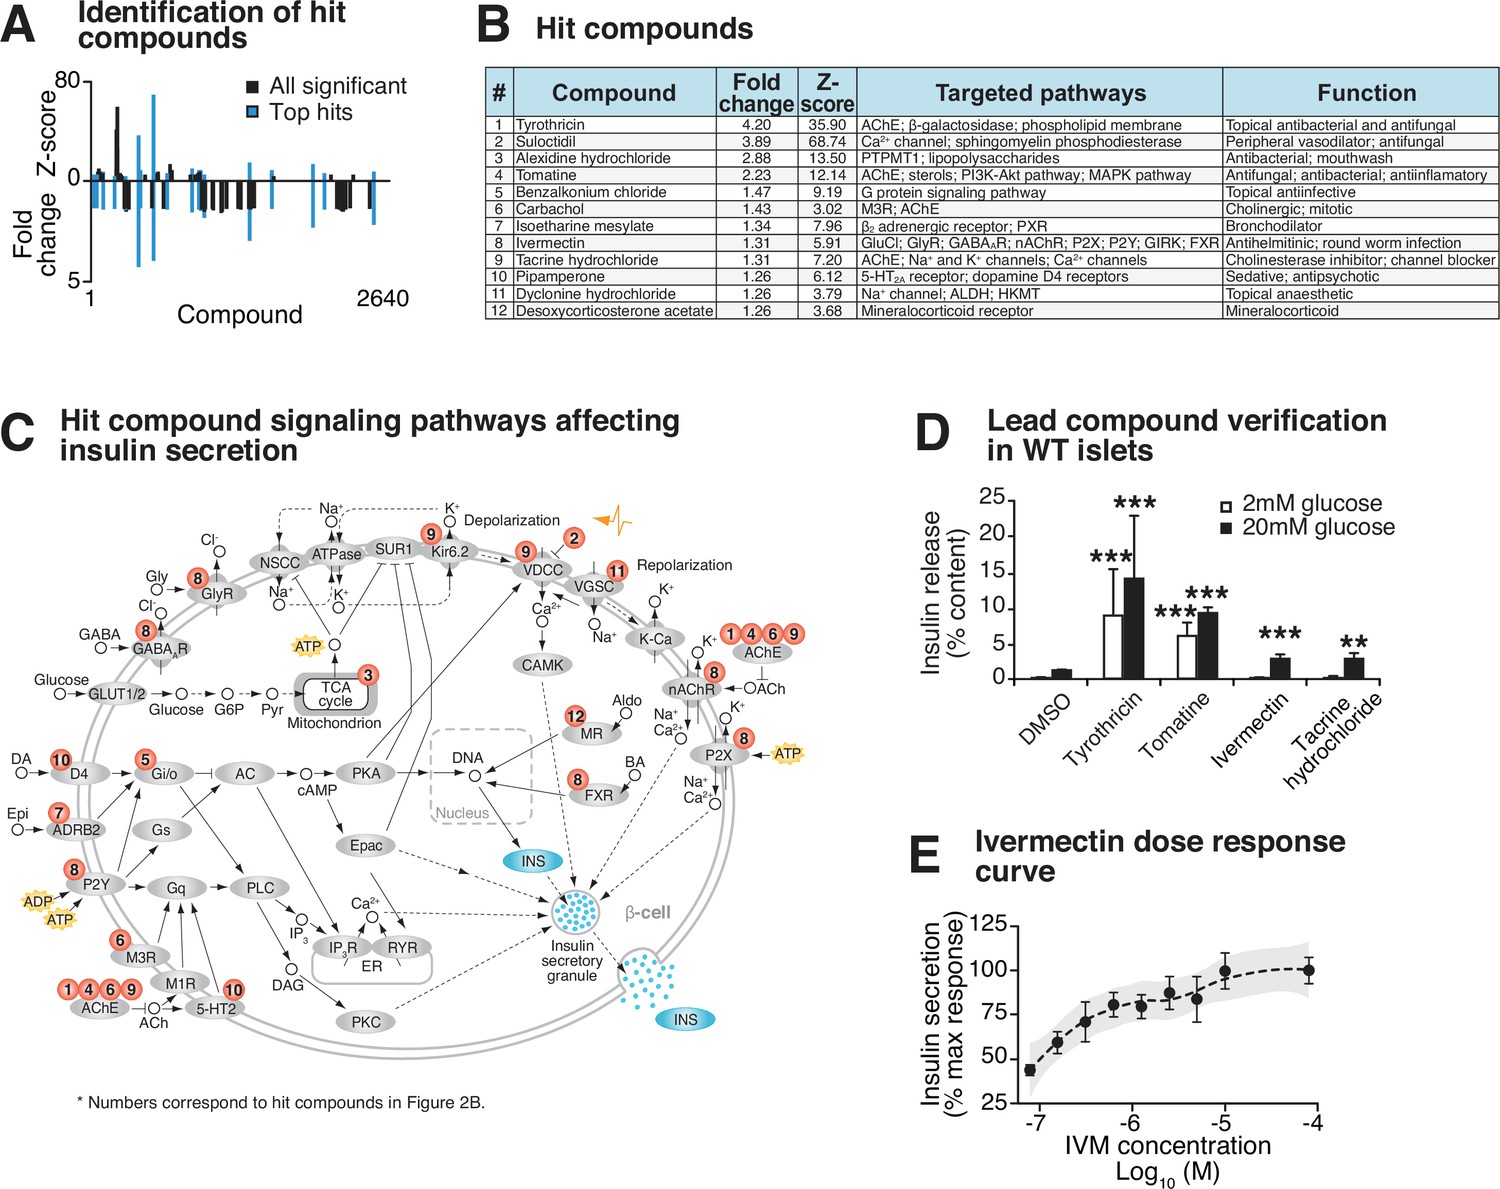
Identification and validation of high-throughput screen lead compounds in murine islets at high and low glucose concentrations.
(A) Significant Z-scores (>3 standard deviations) and fold changes (>1.25-fold increase) for all 2640 screened compounds, with hit compounds indicated in blue. (B) Top 12 hit compounds identified from screen with a fold increase > 1.25 and a Z-score > 3, which were selected for further analysis. Known functions and published molecular pathways targeted by these compounds are indicated. (C) Model of potential mechanisms of action of the top 12 hit compounds to affect insulin secretion in the β-cell. (D) Glucose-responsive insulin secretion by ELISA at 2 mM and 20 mM glucose in WT mouse islets following exposure to four lead candidate compounds (n = 3–11 mice/compound). (E) Ivermectin (IVM) dose-response curve (n = 6–8 experimental repeats/dose), ranging from 0.078 µM to 80 µM IVM, in insulin-NanoLuciferase-expressing Beta-TC-6 cells. Shaded area represents 95% confidence intervals for the LOESS curve. All values represent mean ± SEM. **p<0.01, ***p<0.001.
Figure 2—figure supplement 1
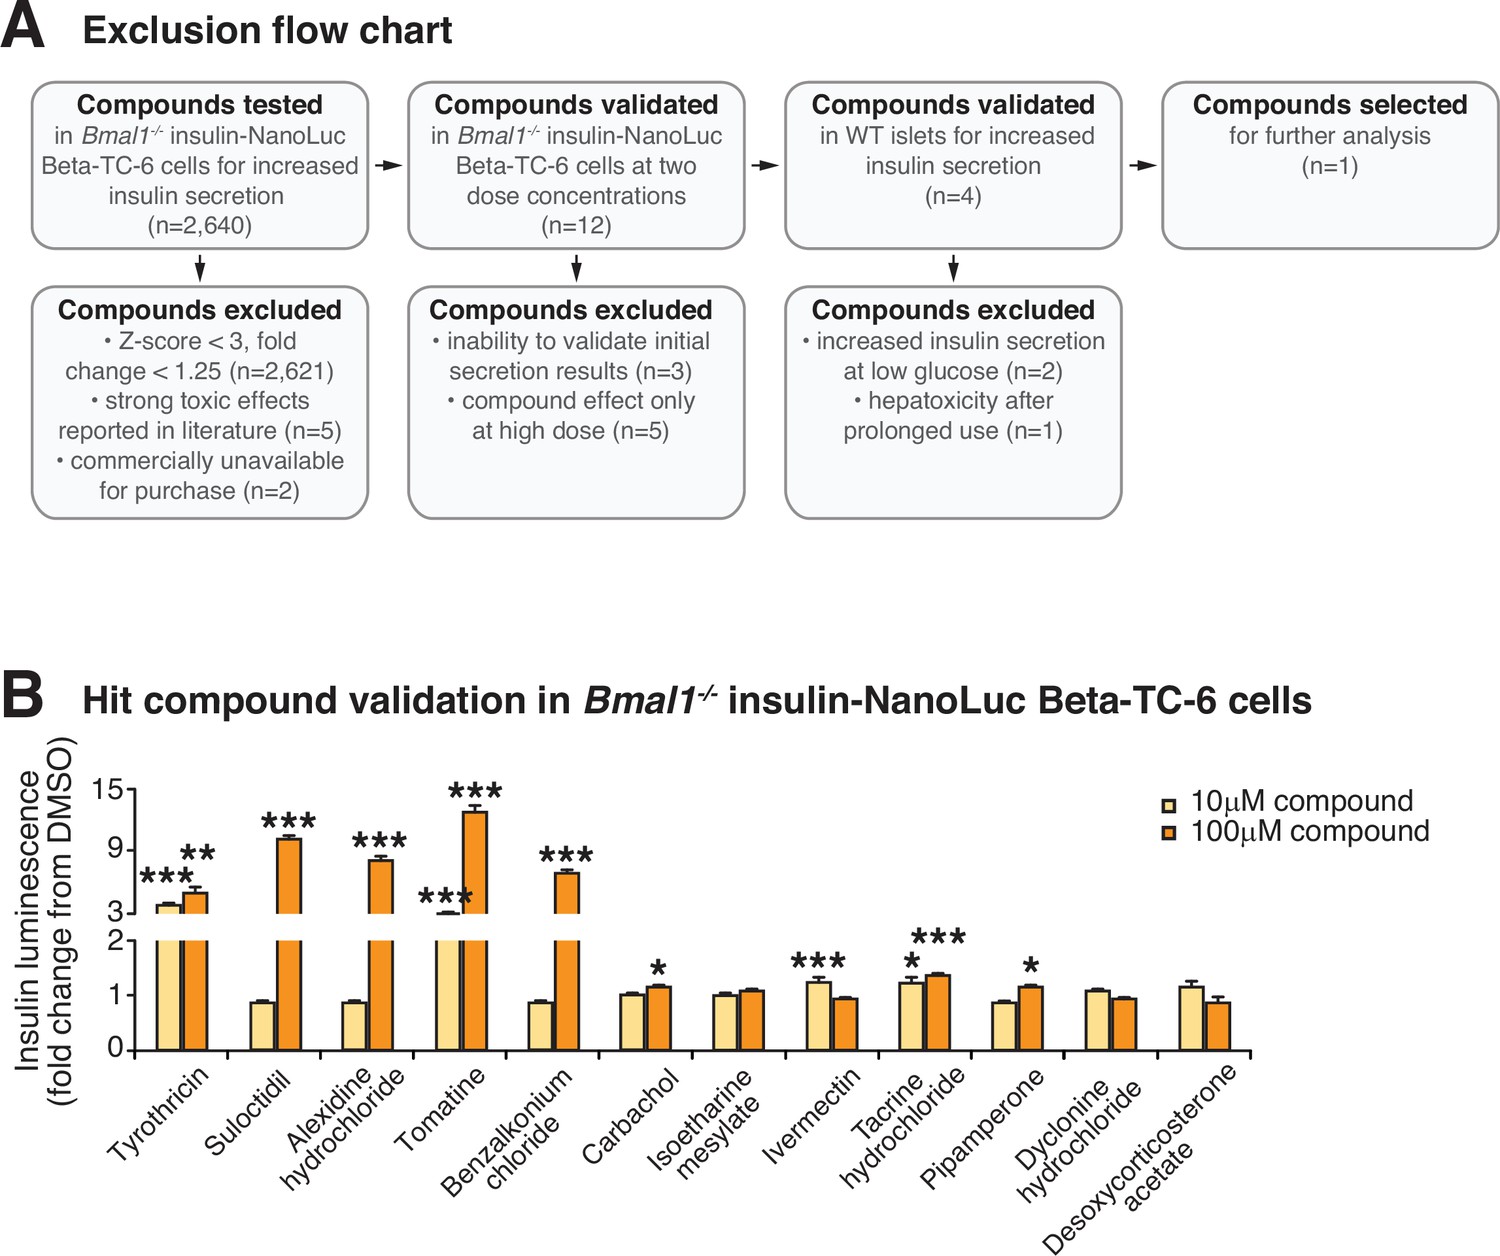
High-throughput screen for modulators of insulin secretion in circadian mutant β-cells and validation of lead compounds.
(A) Compound exclusion flow chart delineating exclusion criteria and numbers of compounds excluded at each validation step. (B) Hit compound validation at concentrations of 10 and 100 µM in Bmal1-/- insulin-NanoLuciferase cells (n = 3/compound). All values represent mean ± SEM. *p<0.05, **p<0.01, ***p<0.001.
Figure 3 with 1 supplement
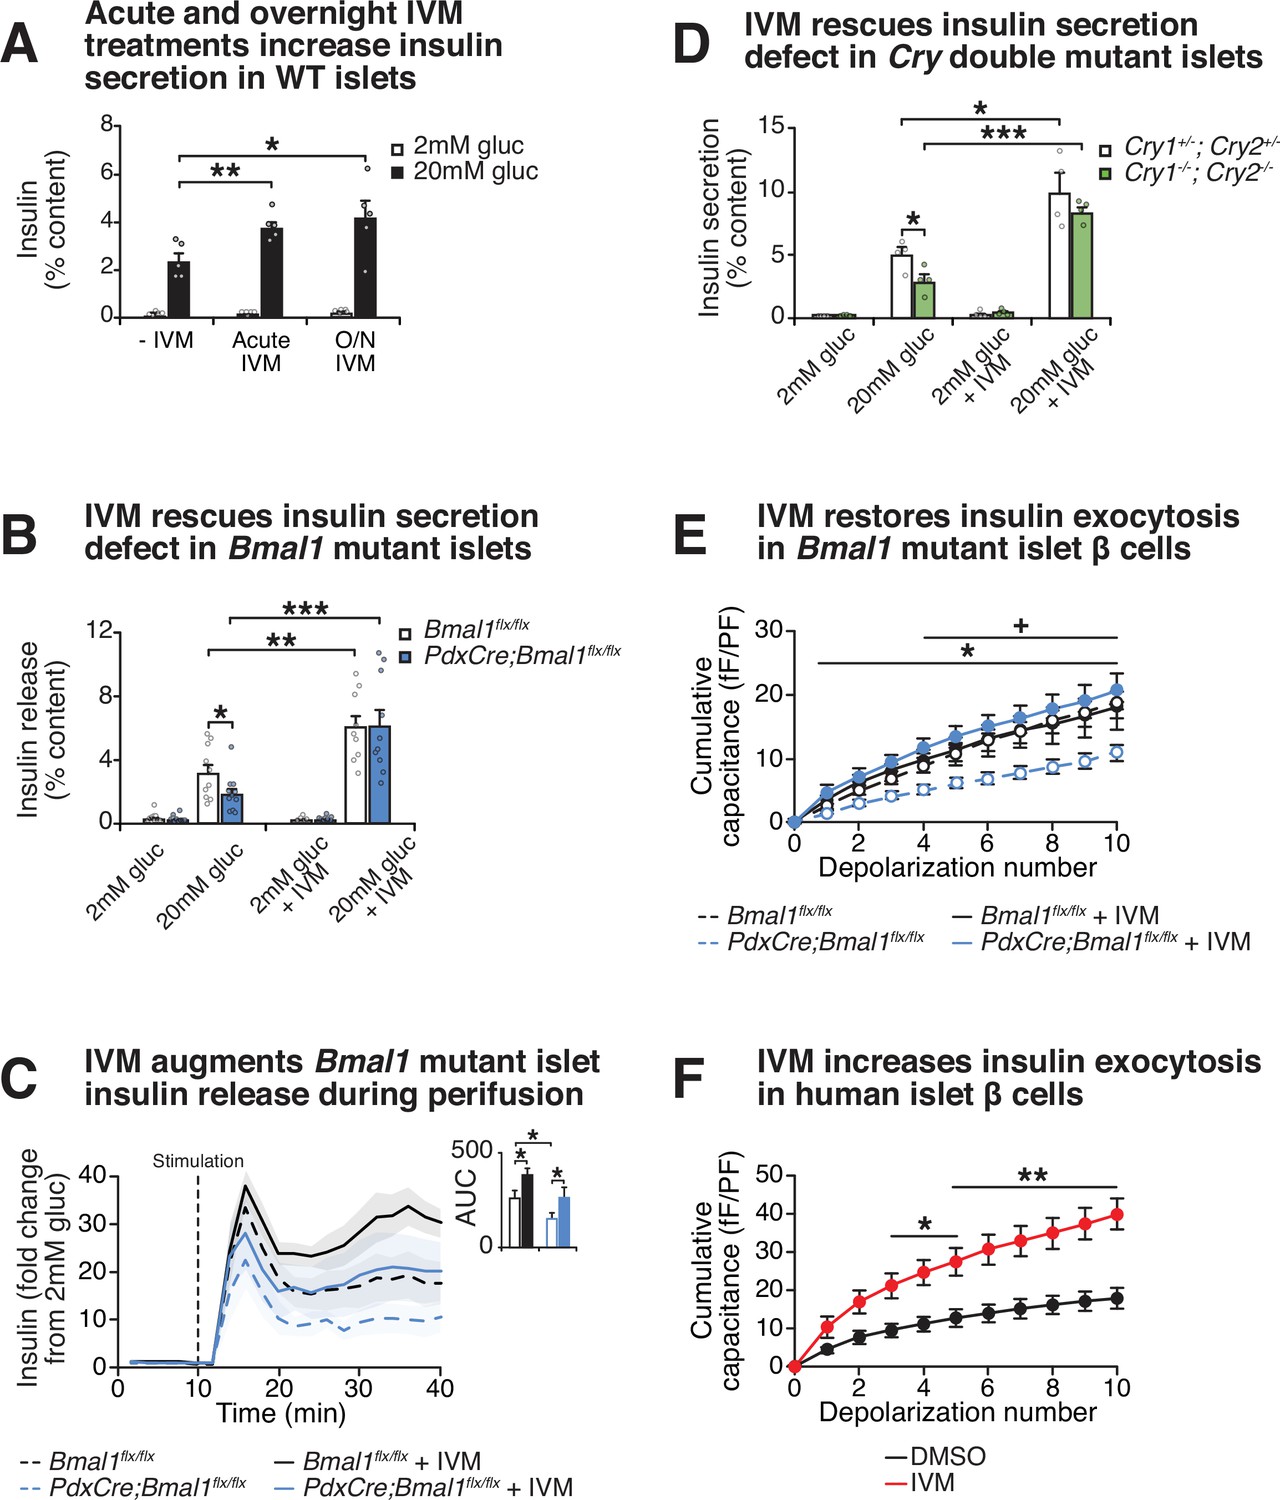
Effect of lead compound ivermectin (IVM) on glucose-stimulated insulin exocytosis and calcium flux from WT and circadian mutant β-cells.
(A) Insulin secretion (expressed as % content) assessed by ELISA at 2 mM and 20 mM glucose in WT mouse islets in response to 1 hr 10 µM IVM treatment or 24 hr 10 µM IVM pretreatment (n = 5 mice). Data was analyzed by two-way ANOVA and false discovery rate (FDR) correction for multiple testing. (B) Insulin secretion as assessed by ELISA from islets isolated from 8-month-old pancreas-specific Bmal1 knockout and Bmal1flx/flx mice in the presence or absence of 10 µM IVM (n = 10–11 mice/genotype). (C) Perifusion analysis of insulin secretion in islets from pancreas-specific Bmal1 knockout (PdxCre;Bmal1flx/flx) and Bmal1flx/flx mice in response to 10 µM IVM in the presence of 20 mM glucose (n = 3 mice/genotype). (D) Insulin secretion as assessed by ELISA from islets isolated from 9- to 12-month-old male Cry1-/-;Cry2-/- knockout and Cry1+/-;Cry2+/- heterozygous control mice in the presence or absence of ± µM IVM (n = 4 mice/genotype). (E) Capacitance measurements in β-cells from PdxCre;Bmal1flx/flx and Bmal1flx/flx mouse islets treated with 10 µM IVM (n = 4–5 mice/genotype, 5–16 cells per mouse). Asterisks denote significance between PdxCre;Bmal1flx/flx and PdxCre;Bmal1flx/flx + IVM; plus symbols denote significance between Bmal1flx/flx and PdxCre;Bmal1flx/flx for all depolarization numbers indicated. */+ p<0.05. (F) Capacitance measurements in β-cells from human islets treated with 10 µM IVM (n = 3 donors, 7–11 cells per donor). Capacitance and calcium data were analyzed by two-way repeated-measures ANOVA with Bonferroni correction for multiple testing. All values represent mean ± SEM. *p<0.05, **p<0.01, ***p<0.001.
Figure 3—figure supplement 1
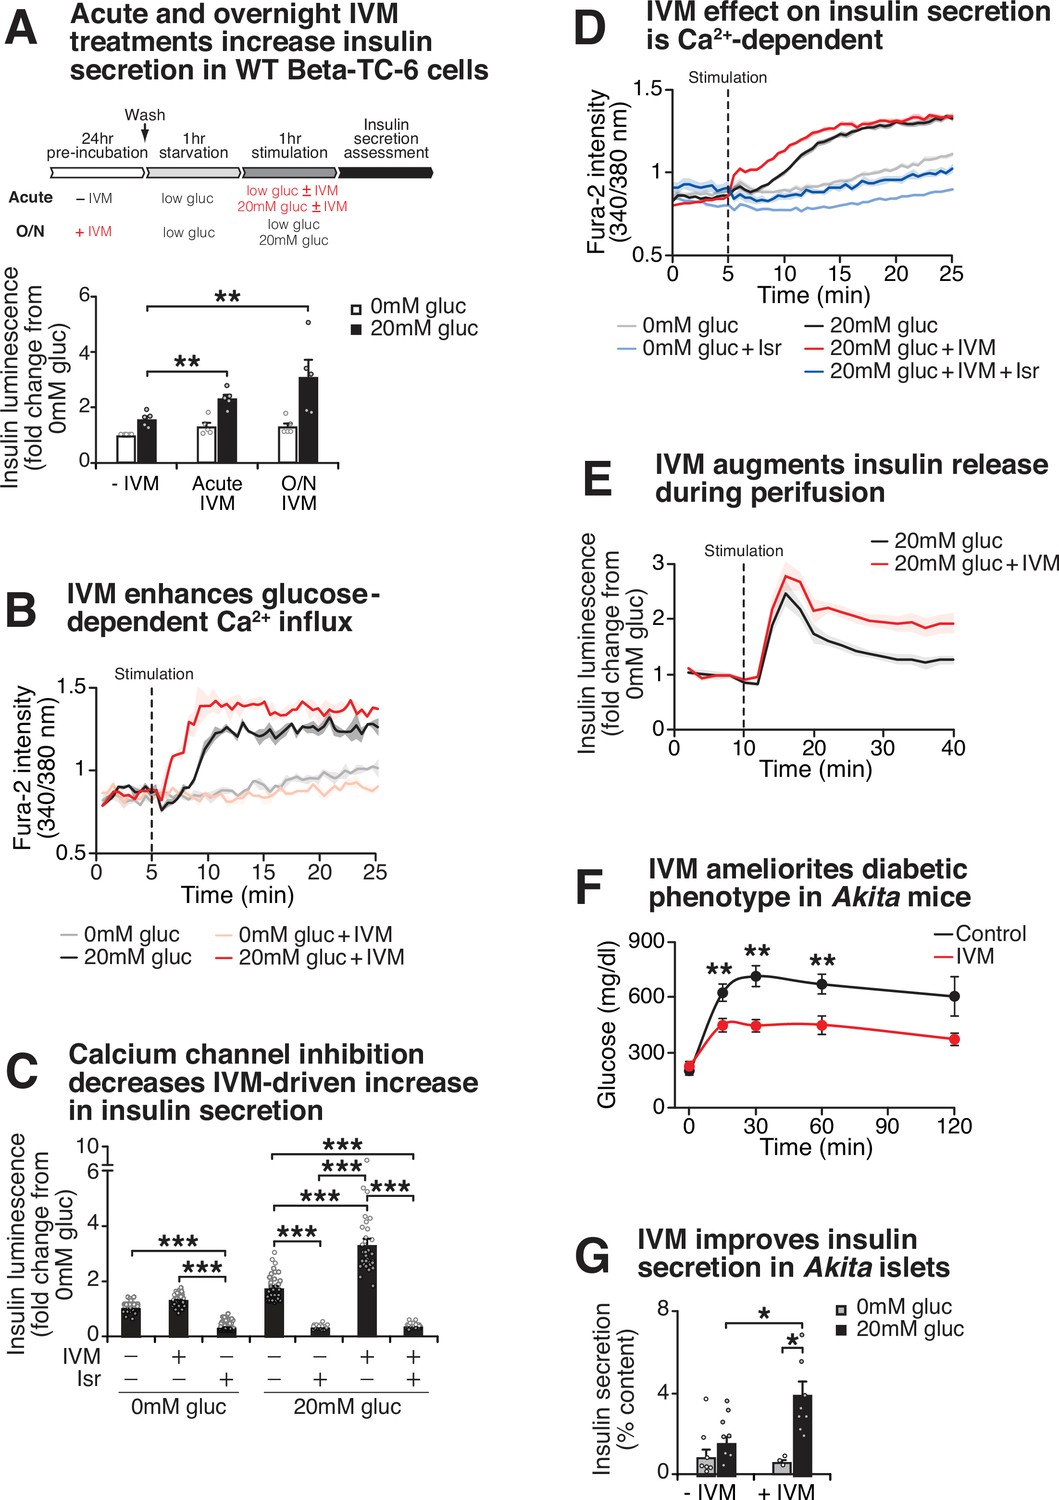
Ivermectin (IVM) improves insulin exocytosis in diabetic mice.
(A) Insulin-NanoLuciferase (insulin-Nano-Luc) bioluminescence at 0 mM and 20 mM glucose in WT Beta-TC-6 cells in response to 1 hr 10 µM IVM treatment or 24 hr 10 µM IVM pretreatment (n = 5 experiments, 3–24 experimental repeats/experiment). Data was analyzed by two-way ANOVA and false discovery rate (FDR) correction for multiple testing. (B) Ratiometric determination of intracellular Ca2+ using Fura2-AM dye in WT Beta-TC-6 cells stimulated in the presence or absence of 10 µM IVM (n = 3 experimental repeats/condition). (C) Insulin secretion in pseudoislets from WT insulin-NanoLuc-expressing Beta-TC-6 cells in response to 10 µM IVM and 5 µM isradipine (isr) (n = 3–8 experiments, 3–16 experimental repeats/experiment). p-Values were determined by Tukey’s multiple comparison tests following one-way ANOVA. (D) Ratiometric determination of intracellular Ca2+ using Fura2-AM dye in WT Beta-TC-6 cells stimulated with IVM or isr (n = 3–8 experiments, 4–16 experimental repeats/experiment). (E) Perifusion analysis of insulin secretion from WT insulin-NanoLuc pseudoislets in response to 10 µM IVM in the presence of 20 mM glucose (n = 6 experimental repeats/condition). (F) Glucose levels at the indicated time points following an intraperitoneal injection of glucose (2 g/kg body weight) at ZT2 after 14 days of daily intraperitoneal injections with 1.3 mg/kg body weight of IVM (n = 8 mice/genotype). Glucose levels were analyzed by two-way repeated-measures ANOVA with Bonferroni multiple testing. (G) Insulin secretion as assessed by ELISA from islets isolated from 4-month-old Akita mice in the presence or absence of 10 μM IVM (n = 5–6 mice/genotype). All values represent mean ± SEM. **p<0.01, ***p<0.001.
Figure 4 with 2 supplements
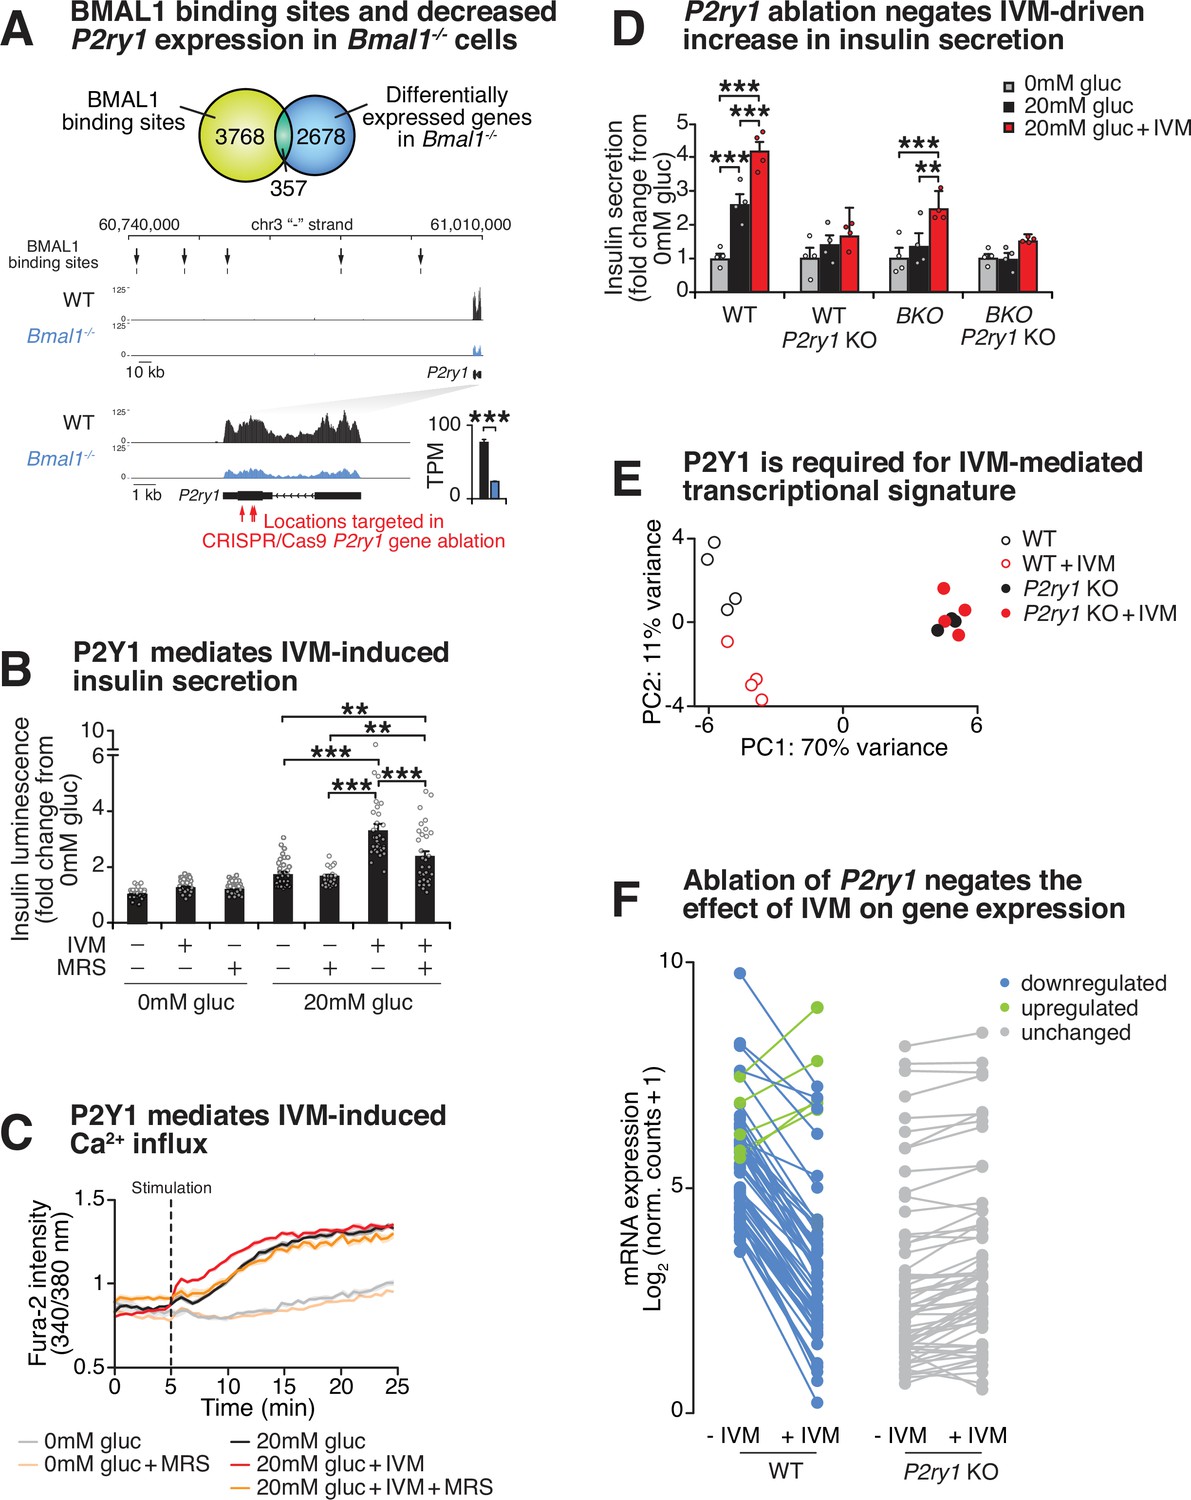
Purinergic receptor P2Y1 is required for ivermectin (IVM) to augment insulin exocytosis.
(A) Venn diagram of BMAL1 binding sites identified by ChIP-sequencing overlapping with differentially expressed genes identified by RNA-sequencing in Bmal1-/-β-cell line compared to control cell line (top). Browser tracks and bar graph showing decreased expression of P2ry1 gene in Bmal1-/- cells compared to controls. BMAL1 binding sites upstream of the P2ry1 gene are also indicated (bottom). (B) Bioluminescence from WT insulin-NanoLuciferase pseudoislets in response to 10 µM IVM and/or 10 µM of the P2Y1 antagonist MRS2179 (n = 3–8 experiments, 3–15 experimental repeats/experiment). (C) Ratiometric determination of intracellular Ca2+ using Fura2-AM dye in WT Beta-TC-6 cells stimulated in the presence or absence of 10 µM IVM (n = 3–7 experiments, 4–19 experimental repeats/experiment). (D) Insulin secretion by ELISA in pseudoislets from P2ry1 KOs and control WT and Bmal1-/- Beta-TC-6 cells (n = 4 experiments, two experimental repeats/experiment). p-Values were determined by Tukey’s multiple comparison tests following two-way ANOVA. (E) First two principal components (PC1 and PC2) following unbiased principal component analysis (PCA) of DESeq2 normalized counts in WT, WT + IVM, P2yr1 KO, and P2yr1 KO cells (n = 4 per group). (F) Mean log2-transformed DESeq2-normalized counts in WT, WT + IVM, P2yr1 KO, and P2yr1 KO cells (n = 4 per group) at differentially expressed (1.5-fold, adjusted p-value<0.05) transcripts identified between WT and WT + IVM treated cells. All values represent mean ± SEM. *p<0.05, **p<0.01, ***p<0.001.
Figure 4—figure supplement 1
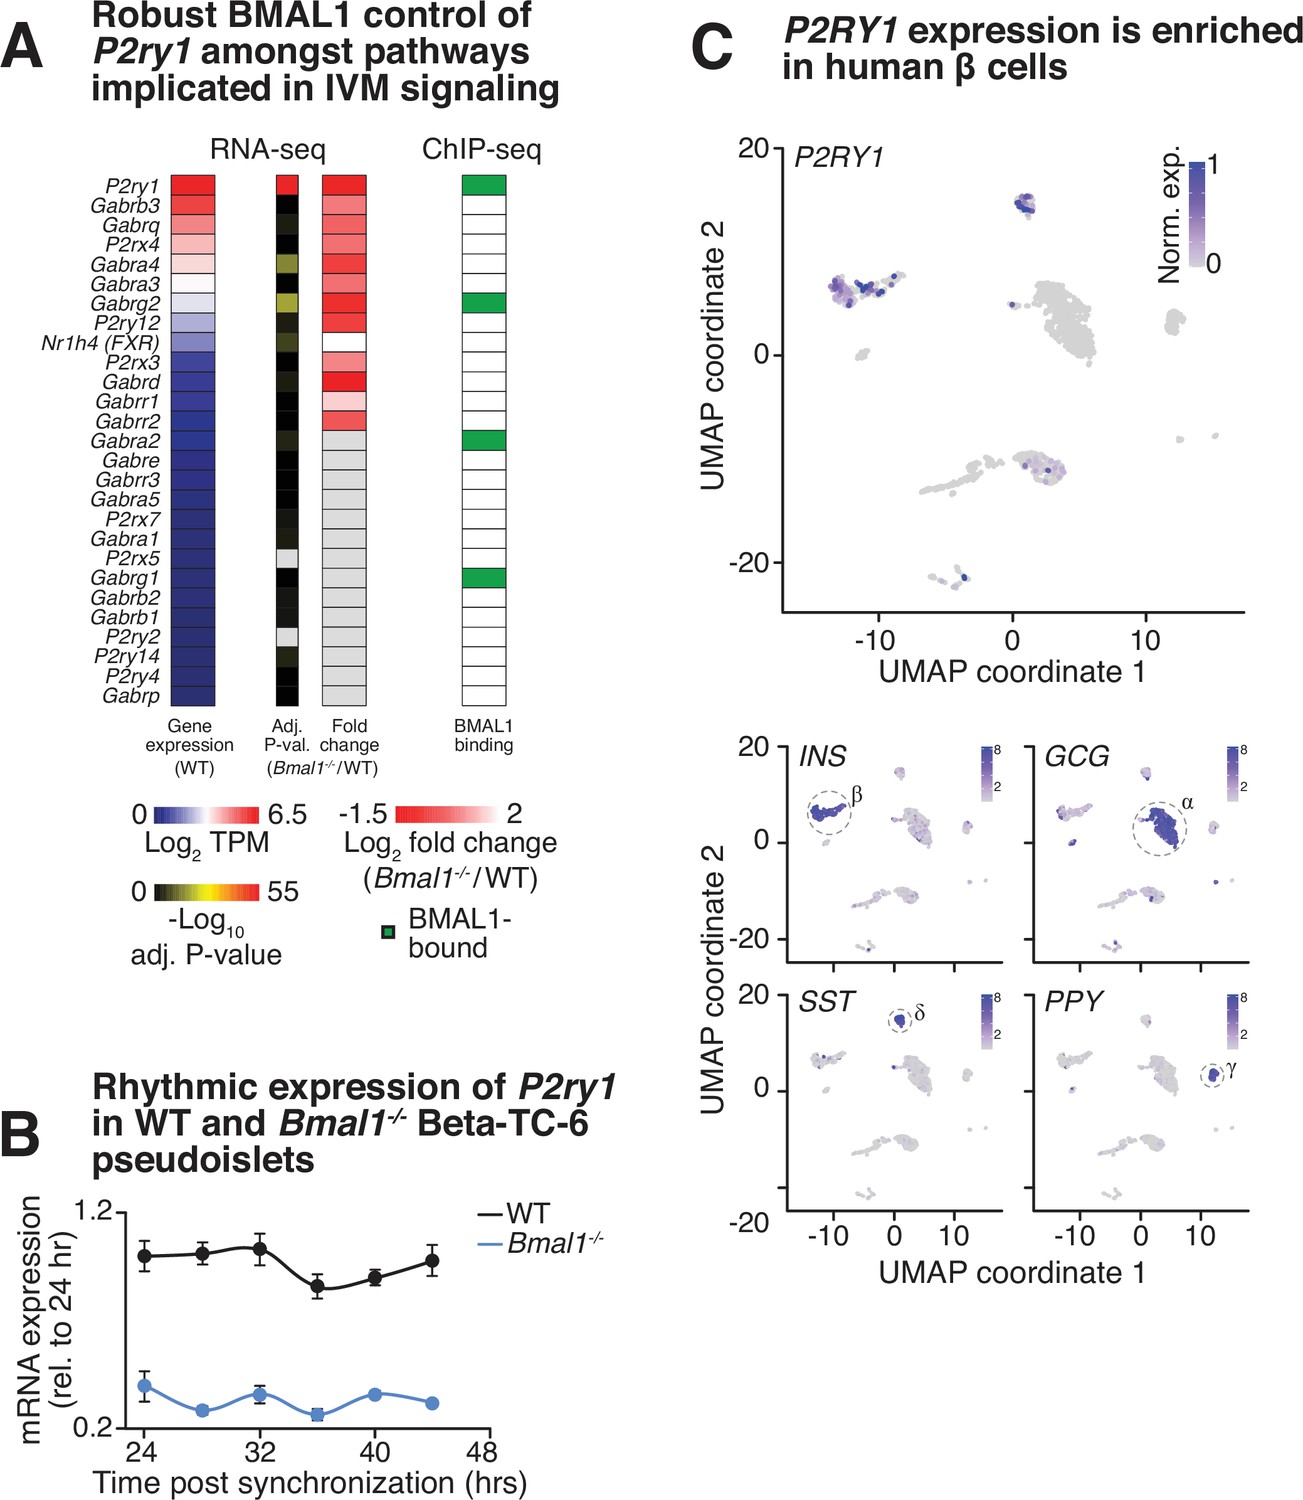
Evidence for circadian control of P2ry1.
(A) mRNA abundance (transcripts per million [TPM]) in WT β-cells (left), DESeq2-adjusted p-values from differential expression analysis in Bmal1-/- versus WT β-cells (middle left), fold change in expression in Bmal1-/- versus WT β-cells (middle right), and presence or absence of an annotated BMAL1 binding site near genes of putative ivermectin (IVM) targets (right). (B) Rhythmic expression of P2ry1 gene in synchronized pseudoislets from WT Beta-TC-6 cells as assessed by quantitative real-time PCR (n = 3) (false discovery rate (FDR)-adjusted p-value<0.05). (C) Uniform manifold approximation and projection (UMAP) clustering analysis of single-cell expression values in single human islet cells isolated from type 2 diabetic and healthy subjects highlights distinct transcriptional profiles of β, α, δ, and γ cells marked by high levels of insulin (INS), glucagon (GCG), somatostatin (SST), or pancreatic polypeptide (PPY) mRNA, respectively. P2RY1 expression is enriched in β and δ cells, and grossly excluded from α and γ cells.
Figure 4—figure supplement 2
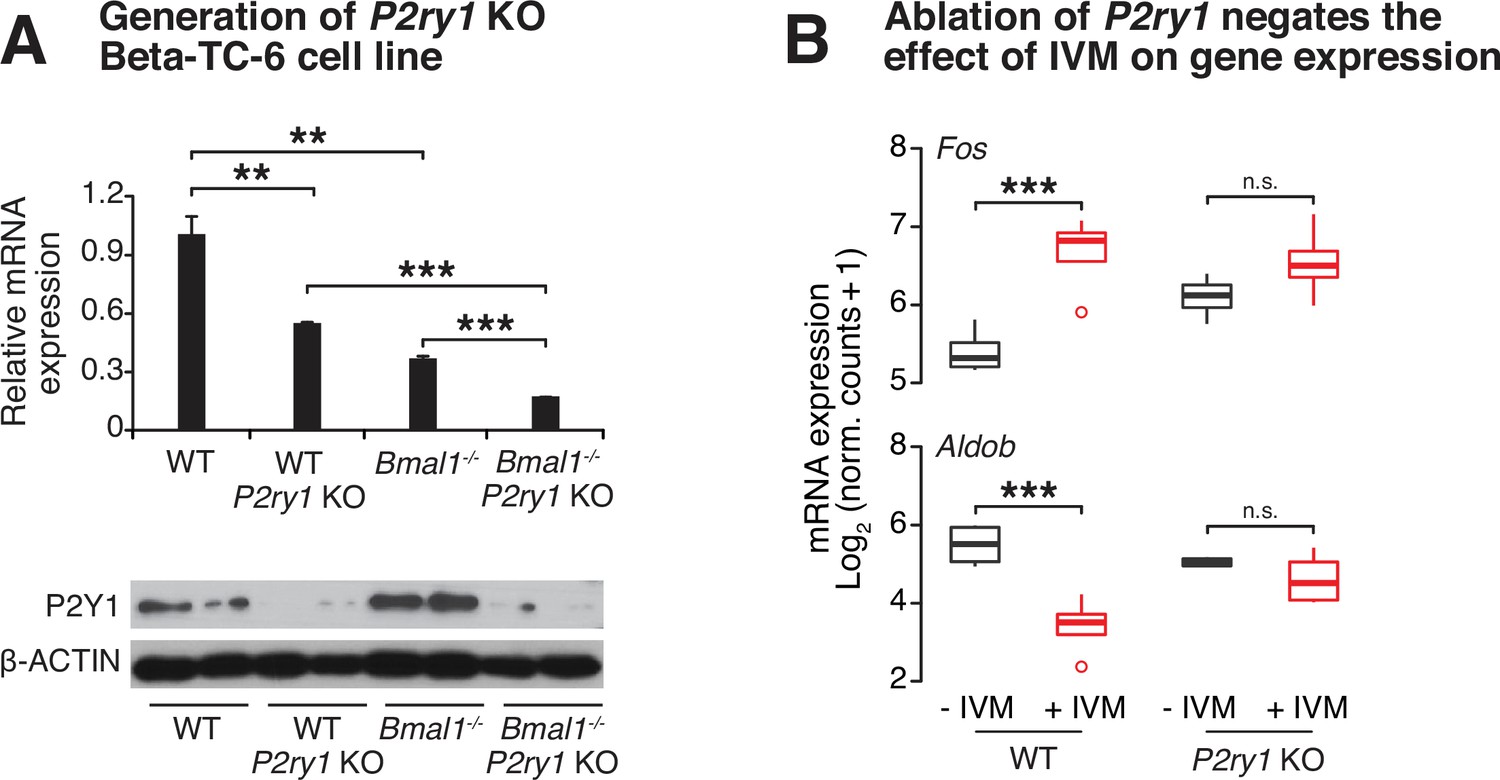
Genetic ablation of purinergic receptor P2Y1 in Beta-TC-6 cells blunts effect of ivermectin (IVM) on gene expression.
(A) Quantitative real-time PCR screening for disruption of P2ry1 gene expression (n = 3–4/genotype) (top). Decreased P2Y1 receptor protein expression by Western blot in WT and Bmal1-/- Beta-TC-6 cells after genetic disruption (bottom). (B) Loss of effect of IVM on gene expression in P2ry1 mutant β-cells identified by RNA-sequencing (n = 4/genotype/condition). Dots represent values that exceed 1.5-fold of the interquartile range. All values represent mean ± SEM. *p<0.05, **p<0.01, ***p<0.001. See Figure 4—figure supplement 2—source data 1 and Figure 4—figure supplement 2—source data 2.
-
Figure 4—figure supplement 2—source data 1
P2Y1 expression by Western blot.
- https://cdn.elifesciences.org/articles/75132/elife-75132-fig4-figsupp2-data1-v1.zip
-
Figure 4—figure supplement 2—source data 2
ACTIN expression by Western blot.
- https://cdn.elifesciences.org/articles/75132/elife-75132-fig4-figsupp2-data2-v1.zip
Author response image 1

Comparison of our circadian small molecule screen to Burns et al.
, 2015 screen. The hits from each screen were compared by analyzing Z-scores, which reflect the compounds’ insulin-secretory effects on Bmal1-/- Β-TC-6 cells (our screen) versus the cell-types used by Burns et al., wild-type MIN6 (left) and INS1E cells (right), in the presence of glucose.
Author response image 2
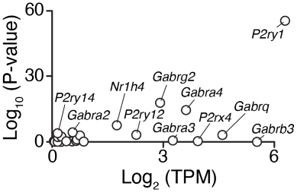
Robust differential expression of P2ry1 following BMAL1 ablation.
The P2ry1 transcript is one of the most abundant receptors in the broad class of putative IVM targets and was identified following BMAL1 ablation as one of the most consistently and highly repressed transcripts (Adj. P < 10-55).
Tables
Key resources table
| Reagent type (species) or resource | Designation | Source or reference | Identifiers | Additional information |
|---|---|---|---|---|
| Gene (Mus musculus) | Bmal1 | NCBI | Gene ID: 11865 | |
| Gene (M. musculus) | Cry1 | NCBI | Gene ID: 12952 | |
| Gene (M. musculus) | Cry2 | NCBI | Gene ID: 12953 | |
| Gene (M. musculus) | P2ry1 | NCBI | Gene ID: 18441 | |
| Strain (M. musculus), strain background (C57BL6J) | PdxCre;Bmal1flx/flx | PMID:20562852 | PdxCre;Bmal1flx/flx | Pancreas-specific Bmal1 mutant mice |
| Strain (M. musculus), strain background (C57BL6J) | Cry1-/-;Cry2-/- | PMID:10518585 | Cry1-/-;Cry2-/- | Whole-body Cry1 and Cry2 double knockout mice |
| Strain (M. musculus), strain background (C57BL6J) | C57BL/6-Ins2Akita/J | Jackson Laboratory | 3548 | Spontaneous mutation in the insulin two gene leads to incorrect folding of the insulin protein Monogenic mouse model for type 1 diabetes. |
| Biological sample (M. musculus) | Primary pancreatic islets | Northwestern University | Freshly isolated from mice | |
| Biological sample (Homo sapiens) | Primary pancreatic islets | Alberta Diabetes Institute Islet-Core | https://www.isletcore.ca (R224, R225, R226) | Freshly isolated from nondiabetic donors |
| Cell line (H. sapiens) | HEK293T | ATCC | CRL-11268 | Kidney cells |
| Cell line (M. musculus) | Beta-TC-6 | ATCC | CRL-11506 | Pancreatic β-cells |
| Cell line (M. musculus) | Bmal1-/- Beta-TC-6 | PMID:21686102 | Bmal1-/- Beta-TC-6 | Pancreatic β-cells, mutant for Bmal1 |
| Cell line (M. musculus) | Insulin-NanoLuc-expressing Beta-TC-6 | This paper | Pancreatic β-cells, expressing Proinsulin-NanoLuc luminescent reporter | |
| Cell line (M. musculus) | Insulin-NanoLuc-expressing Bmal1-/- Beta-TC-6 | This paper | Pancreatic β-cells, mutant for Bmal1, expressing Proinsulin-NanoLuc luminescent reporter | |
| Recombinant DNA reagent | P2Y1 CRISPR/Cas9 KO plasmid | Santa Cruz Biotechnology | sc-422095 | Pool of three plasmids, encoding the Cas9 nuclease and a P2Y1-specific 20 nt guide RNA, targeting exon 1 of the mouse P2ry1 gene |
| Recombinant DNA reagent | P2Y1 HDR plasmid | Santa Cruz Biotechnology | sc-422095-HDR | Pool of 2–3 plasmids, containing puromycin resistance gene and HDR templates, corresponding to the P2Y1 CRISPR/Cas9 KO plasmid cut sites |
| Recombinant DNA reagent | Proinsulin-NanoLuc in pLX304 lentivirus packaging plasmid | Addgene | 62057 | Luminescent reporter of insulin secretion, mouse synthetic Ins2 insert |
| Recombinant DNA reagent | pCMV-VSV-G | Addgene | 8454 | Envelope vector |
| Recombinant DNA reagent | pCMV delta R8.2 | Addgene | 12263 | Packaging vector |
| Chemical compound, drug | Spectrum Collection | MicroSource Discovery Systems, Inc | Small-molecule compound library, which consists of 2640 known drugs and drug-like molecules | |
| Chemical compound, drug | Ivermectin | Tocris | 1260 | |
| Chemical compound, drug | (+)-Bicuculline | Tocris | 130 | |
| Chemical compound, drug | MRS2179 tetrasodium salt | Tocris | 900 | |
| Chemical compound, drug | Isradipine | Cayman Chemical Company | 17536 | |
| Chemical compound, drug | Phorbol 12-myristate 13-acetate (PMA) | Sigma-Aldrich | P1585 | |
| Chemical compound, drug | Carbamoylcholine chloride | Sigma-Aldrich | C4382-1G | |
| Chemical compound, drug | Forskolin | Sigma-Aldrich | F3917-10MG | |
| Chemical compound, drug | D-Glucose | Sigma-Aldrich | G7528-250G | |
| Chemical compound, drug | Potassium chloride | Sigma-Aldrich | P-5405 | |
| Chemical compound, drug | 3-Isobutyl-1-methylxanthine | Sigma-Aldrich | I7018-250mg | |
| Chemical compound, drug | Tyrothricin | Sigma-Aldrich | T3000000 | |
| Chemical compound, drug | Alexidine hydrochloride | Cayman Chemical Company | 13876 | |
| Chemical compound, drug | Benzalkonium chloride | Sigma-Aldrich | 12060-5G | |
| Chemical compound, drug | Suloctidil | MicroSource Discovery Systems, Inc | 01501153 | |
| Chemical compound, drug | Tomatine | MicroSource Discovery Systems, Inc | 01504079 | |
| Chemical compound, drug | Isoetharine mesylate | MicroSource Discovery Systems, Inc | 01505977 | |
| Chemical compound, drug | Tacrine hydrochloride | MicroSource Discovery Systems, Inc | 02300104 | |
| Chemical compound, drug | Pipamperone | MicroSource Discovery Systems, Inc | 01505690 | |
| Chemical compound, drug | Dyclonine hydrochloride | MicroSource Discovery Systems, Inc | 01500268 | |
| Chemical compound, drug | Desoxycorticosterone acetate | MicroSource Discovery Systems, Inc | 00300029 | |
| Chemical compound, drug | Puromycin dihydrochloride | Sigma-Aldrich | P8833-25MG | |
| Chemical compound, drug | Collagenase P | Sigma-Aldrich | C7657-100mg | |
| Chemical compound, drug | Biocoll | Millipore | L6155 | |
| Chemical compound, drug | 2-Hydroxypropyl-b-cyclodextrin | Sigma-Aldrich | H107-5G | |
| Chemical compound, drug | Fura-2 | Invitrogen | F1201 | |
| Chemical compound, drug | Pluronic F-127 | Invitrogen | P3000MP | |
| Chemical compound, drug | Penicillin-streptomycin | Gibco | 15-140-122 | |
| Chemical compound, drug | L-glutamine | Gibco | 25-030-081 | |
| Commercial assay or kit | Lipofectamine 3000 | Thermo Fisher Scientific | L3000015 | |
| Commercial assay or kit | NanoGlo Luciferase Assay Substrate | Promega | N1110 | |
| Commercial assay or kit | Ultra Sensitive Mouse Insulin ELISA Kit | Crystal Chem Inc | 90080 | |
| Commercial assay or kit | Autokit Glucose | Wako-Fujifilm | 997-03001 | |
| Commercial assay or kit | Direct-zol RNA Microprep kit | Zymo Research | R2062 | |
| Commercial assay or kit | High Capacity cDNA Reverse Transcription Kit | Applied Biosystems | 4368813 | |
| Commercial assay or kit | iTaq Universal SYBR Green Supermix | Applied Biosystems | 1725125 | |
| Commercial assay or kit | NEBNext Ultra Directional RNA Library Prep Kit for Illumina | New England Biolabs | E7760L | |
| Commercial assay or kit | NEBNext Library Quant Kit for Illumina | New England Biolabs | E7630L | |
| Commercial assay or kit | Quick Start Bradford Protein Assay | Bio-Rad | 500-0116 | |
| Sequence-based reagent | β-actin F | This paper | PCR primers | 5′-TGCTCTGGCTCCTAGCACCATGAAGATCAA-3′ |
| Sequence-based reagent | β-actin R | This paper | PCR primers | 5′-AAACGCAGCTCAGTAACAGTCCGCCTAGAA-3′ |
| Sequence-based reagent | P2ry1 F | This paper | PCR primers | 5′-TTATGTCAGCGTGCTGGTGT-3′ |
| Sequence-based reagent | P2ry1 R | This paper | PCR primers | 5′-ACGTGGTGTCATAGCAGGTG-3′ |
| Antibody | Anti-P2Y1, mouse monoclonal | Santa Cruz | sc-377324 | WB (1:500) |
| Antibody | Anti-β-ACTIN, rabbit monoclonal | Cell Signaling | CST 4970 | WB (1:4000) |
| Software, algorithm | STAR | PMID:23104886 | RRID:SCR_004463 | |
| Software, algorithm | RSEM | PMID:21816040 | RRID:SCR_013027 | |
| Software, algorithm | DESeq2 package in R | PMID:25516281 | RRID:SCR_015687 | |
| Software, algorithm | Pheatmap package in R | RRID:SCR_016418 | ||
| Software, algorithm | GraphPad Prism | GraphPad | RRID:SCR_002798 | |
| Software, algorithm | SRA-Toolkit | https://trace.ncbi.nlm.nih.gov/Traces/sra/sra.cgi?view=software | ||
| Software, algorithm | Seurat in package in R | PMID:34062119 | RRID:SCR_007322 | |
| Software, algorithm | JTK_Cycle | PMID:20876817 | RRID:SCR_017962 | |
| Other | Dulbecco’s modified Eagle’s medium | Gibco | 90-013-pb | |
| Other | Fetal bovine serum | Bio-Techne | S11550 | |
| Other | RIPA buffer | Sigma-Aldrich | R0278-50ML | |
| Other | Tri Reagent | Molecular Research Center, Inc | NC9277980 | |
| Other | Complete Mini EDTA-Free Protease Inhibitor | Roche | 4693159001 | |
| Other | PhoStop | Roche | 4906837001 | |
| Other | Nitrocellulose membranes | Bio-Rad | 1620112 |
Additional files
-
Supplementary file 1
High-throughput screen results.
- https://cdn.elifesciences.org/articles/75132/elife-75132-supp1-v1.xlsx
-
Supplementary file 2
Results of differential expression analysis in ivermectin (IVM)-treated WT and P2ry1-/-β cells.
- https://cdn.elifesciences.org/articles/75132/elife-75132-supp2-v1.xlsx
-
Transparent reporting form
- https://cdn.elifesciences.org/articles/75132/elife-75132-transrepform1-v1.pdf
Download links
A two-part list of links to download the article, or parts of the article, in various formats.
Downloads (link to download the article as PDF)
Open citations (links to open the citations from this article in various online reference manager services)
Cite this article (links to download the citations from this article in formats compatible with various reference manager tools)
P2Y1 purinergic receptor identified as a diabetes target in a small-molecule screen to reverse circadian β-cell failure
eLife 11:e75132.
https://doi.org/10.7554/eLife.75132


